
Assessing pandemic era stadium events and infections using mobile phone based population mobility data: An exploratory study from Ireland, 2021
Abstract
Mass gathering events (MGEs) attracting local, national, or international crowds presented particular challenges in the context of the coronavirus disease 2019 (COVID-19) pandemic. Sporting, religious, music and other cultural events held during the early months of the pandemic, without social distancing or other safeguards, have been regarded as so-called ‘super spreader’ events. By the summer of 2020, MGEs were generally banned or subject to severe restrictions. Regular European sporting fixtures such as England’s Football Association and Germany’s Bundesliga matches began to return in the autumn with protective measures in place, such as matches initially held behind closed doors, and later with sub-capacity crowd limits and mandatory social distancing [1, 2, 3, 4, 5].
With protective measures in place, and proof of COVID-19 vaccination or recovery required for entry, a series of six sporting MGEs, ‘the All-Ireland Finals’ were held in the Republic of Ireland’s largest stadium, Croke Park in Dublin, during August-September 2021. This study draws on a high-resolution human population mobility dataset to quantify journeys to/from the stadium area on MGE days by destination. The anonymised, aggregated, data used is based on mobile phone usage, and consists of a series of fine-grained geographical origin-destination matrices presenting daily estimates of area to area journey numbers. With mobility from the stadium area serving as a proxy for MGE attendance, this study explores associations between MGE attendance numbers and local COVID-19 infections over subsequent five week periods. No evidence was found of association between attendance at any of the six 2021 All-Ireland MGEs and COVID-19 infections over subsequent five week periods. This finding contrasts with studies of comparable MGEs in 2020, such as English Association Football matches held during spring 2020, and German Bundesliga football matches held during autumn 2020. These differing outcomes may point to the effectiveness of transmission mitigation policies and behaviours.
1.Introduction
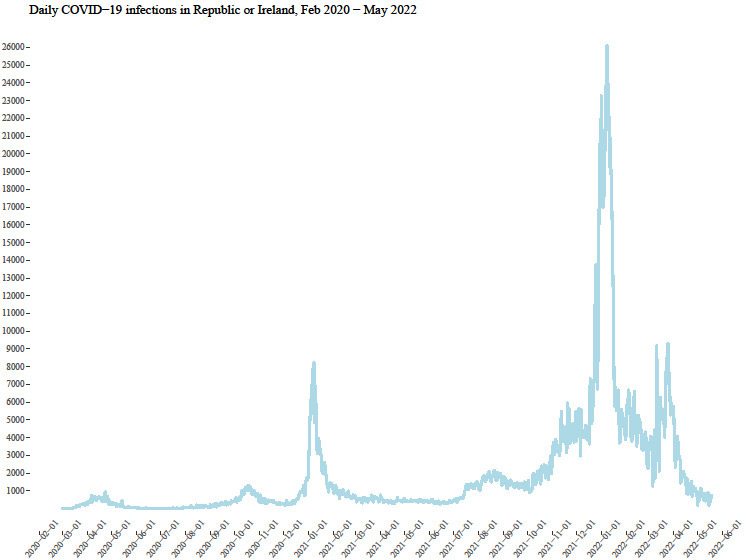
Figure 1.
Republic of Ireland daily COVID-19 infections February 2020–May 2022.
On 30
In the Republic of Ireland, as elsewhere around the world, non-pharmaceutical interventions including mandatory social distancing, stay at home orders, closure of educational and cultural facilities, and of businesses or amenities deemed non-essential, formed a major aspect of the COVID-19 policy response. The first COVID-19 case in Ireland was confirmed on 29
Table 1
Croke Park All-Ireland events August–September 2021
| Date | Event | Total CP attendance | CP capacity | Team A | Team B |
|---|---|---|---|---|---|
| 7 | Hurling semi-final | 24,000 | 28.9% | Limerick | Waterford |
| 8 | Hurling semi-final | 24,000 | 28.9% | Cork | Kilkenny |
| 14 | Football semi-final | 24,000 | 28.9% | Dublin | Mayo |
| 22 | Hurling final | 40,000 | 47.6% | Cork | Limerick |
| 28 | Football semi-final | 24,000 | 28.9% | Kerry | Tyrone |
| 11 | Football final | 41,150 | 50% | Mayo | Tyrone |
CP – Croke Park.
The Irish government responded to steadily declining daily case numbers during the first half of 2021 with a phased relaxation of restrictions. By the beginning of August, most smaller indoor leisure venues, such as pubs, restaurants, cinemas, gyms, indoor sports and gaming facilities, were permitted to open subject to reduced patron capacity, social distancing, and/or patron’s proof of COVID-19 vaccination or recovery. Larger attendances had generally been capped at one hundred for indoor performances and events, and five hundred for outdoor events hosted in stadia with a maximum capacity of at least five thousand. However, a ‘pilot’ programme of sixteen outdoor events held in June accepted larger audiences under mandatory safeguarded conditions including advance communication with attendees, contact tracing, venues operating at reduced patron capacity, physical distancing, mask wearing and hand hygiene [13, 30]. On 30
These MGEs were thus authorised and scheduled in a context of falling COVID-19 cases, but actually held during what proved to be a six-month a period of rising daily case numbers. The analysis presented below considers the question of whether the 2021 All-Ireland Finals MGEs contributed to or accelerated the rising daily COVID-19 case numbers experienced in the Republic of Ireland during autumn 2021.
2.Materials and methods
2.1Overview
The All-Ireland inter-county sporting competitions are contested annually by teams representing the Republic of Ireland’s twenty-six counties, plus Northern Ireland’s six counties, competing in two sports, football and hurling. Two semi-finals and one final match for each sport, for a total of six MGEs, collectively referred to as the ‘All-Ireland Finals’, are traditionally hosted in the GAA’s flagship stadium, Croke Park in north inner city Dublin. With a maximum spectator capacity of 82,300, Croke Park is among Europe’s largest stadia, attracting fans from across Ireland [15]. Each MGE pits two county teams against one another, with attending crowds including substantial numbers of fans making round trip journeys from the competing counties on match days. The 2021 All-Ireland Finals were held on this traditional format, but with sub-capacity stadium attendance. Crowds of 24,000 fans attended the hurling and football semi-finals on 7
All-Ireland Finals MGEs have a slightly different structure to typical team sporting league or national tournament fixtures. Rather than a home team hosting a visiting team in a local stadium, with the visiting team and supporters travelling, All-Ireland final Fixtures are all hosted in the same neutral stadium, Croke Park. Thus, with the exception of Dublin county teams, all teams are effectively visiting teams when playing in Croke Park. The population mobility associated with assembling the large crowds attending these MGEs can be envisaged on a hub and spoke pattern, with Croke Park acting as the hub, attracting round trip journeys from countrywide. Large proportions of crowds attending the All-Ireland Finals are drawn from finalist/semi-finalist counties, as GAA fans make the round trip journey from their ‘home’ counties to support their county team on the day. Representation levels of each ‘spoke’, i.e. crowd composition by geography, vary according to the specific event, but unlike home team vs. visiting team scenarios, visiting team vs. visiting team mobility patterns are directly comparable, relatively unimpeded by the noise from regular daily mobility in the host city. Increased hub-spoke round trip journeys on match days can thus serve as a strong proxy for MGE attendance, and can be used to disaggregate attending crowds by geographical pre-match origin and post-match destination. The 2021 All-Ireland Finals present a unique set of conditions for exploring the extent to which MGE attendance levels from defined ‘spoke’ areas impacted on subsequent COVID-19 infections in those localities.
2.2Data
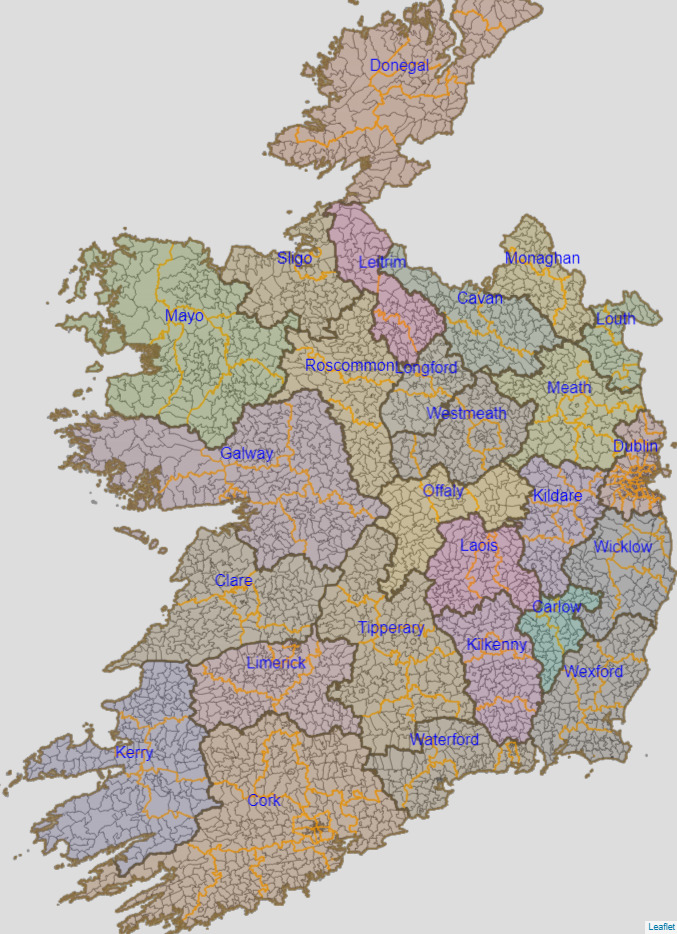
The Republic of Ireland’s electoral geography is structured on a three-level nested hierarchy of 26 counties, subdivided into 166 local electoral areas (LEAs), further subdivided into 3,409 electoral divisions (EDs) (Fig. 2). The mobility data used in this study is comprised of a series of daily ED-to-ED contact origin-destination matrices covering the period 1
Figure 2.
Republic of Ireland counties, local electoral areas, and electoral districts.
The origin-destination matrices are based on statistical analysis of anonymised, aggregated, mobile phone activity records from one of Ireland’s three major mobile network operator (MNO) companies, which holds approximately 30% market share. This high volume, high detailed data provides reliable geographically disaggregated high resolution estimates of daily population mobility, without any compromises of personal privacy. Anonymised data is aggregated to ED level and scaled up to estimates of ED-to-ED movement. To preserve anonymity, cells containing five or less estimated movements are populated with zeroes. For the purposes of this study, a random estimate from zero to five was substituted in such cases. Cases of ‘true zero’, i.e. no detected/estimated movement, are not populated in the matrices. As the contact matrices are compiled at the lower ED level, ED estimates can be easily aggregated to LEA or county level estimates, provided three levels of administrative zone available for analysis.
Ireland’s Central Statistics Office (CSO) published weekly new COVID-19 case numbers by LEA during 2021, week ending Monday. Both case counts and case rates per 100,000 of population are published, with figures
Eight counties (Cork, Dublin, Kerry, Kilkenny, Limerick, Mayo, Tyrone, and Waterford) were involved in six 2021 All-Ireland Final events over six dates, as seen in Table 1. However, while Dublin competed in the football semi-final on 14
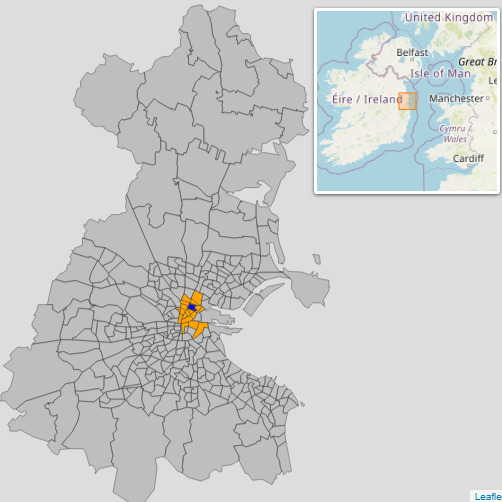
The one hundred and fifty-five LEAs throughout the Republic of Ireland, excluding Dublin, make up the study population. This study uses journeys from the ‘Croke Park area’ (CPA) to LEAs on All-Ireland Finals match dates to proxy for MGE attendance. The CPA, shown in Fig. 3, is defined as the ED where Croke Park resides, Ballybough B (coloured in dark blue) and surrounding and nearby EDs which tend to display increased mobility levels on match days (coloured in orange) (Fig. 3). CPA-LEA journey numbers are assumed to represent post-MGE movements, and used to disaggregate MGE attending crowds by LEA.
Figure 3.
Dublin electoral district map with ‘Croke Park area’ EDs highlighted.
Studies of MGEs and COVID-19 have argued that mobility associated with MGE-related travel in itself is not necessarily a major factor in increasing transmission rates, but that risks are increased by activities associated with MGE celebration, such as visiting crowds’ tendencies to congregate in confined spaces, to be closely packed together when queuing, and to engage in behaviours such as singing, dancing, chanting, and loud conversation. In the context of socially distanced outdoor sporting MGEs, heightened risks of COVID-19 transmission are not necessarily while actually spectating the event itself, but in corridors and on concourses during ingress and egress from the stadia, and during celebration before and afterwards in nearby bars, restaurants, and other shared spaces [1, 2, 3, 4, 5, 18, 19, 20]. Given these scenarios, event day journeys to/from MGE locations can serve as a strong proxy for potential exposure or for participation in risk behaviours associated with MGE attendance.
2.3Statistical analysis
This study frames the 2021 Croke Park All-Ireland MGEs as a series of discrete events, and explores associations between MGE attendance and COVID-19 infections by LEA over subsequent five week periods. The two hurling semi-finals which took place over the same weekend are treated as a single event occurring during the week ending Monday 9
The timeframe of each analysis begins with the event week, and extends for five weeks thereafter. The Delta variant, which was the dominant COVID-19 strain during the study period, has an average incubation period of 4.8–7.4 days and serial interval of 4–8 days [21, 22, 23]. A five week timeframe allows for extreme incubation periods of up fourteen days and an additional three weeks allowing for household and community transmission, and also for lags in testing. Two statistical methods are employed: regression of COVID-19 cumulative infections onto MGE attendance counts by LEA, and; analysis of variance of infection rates across ordinal mobility levels by LEA.
The two techniques offer slightly different perspectives. The regression analysis is based on a simple linear equation regressing cumulative COVID-19 cases since week ending 7
The first week in June is chosen as the base week for cumulative COVID-19 infections as this was at the end of the period of relatively stable low case numbers and the beginning of a period of rising daily cases. This was the context in which the 2021 All-Ireland Finals MGEs were held, and the key question at issue here is whether infections increased more rapidly in LEAs to which All-Ireland Finals attendees travelled after the MGEs.
Estimated MGE attendance, posited as the treatment variable
(Negative numbers are not an indication that the MGE deterred travel! Rather, some LEAs, particularly those in closer proximity to Dublin, tend to have higher weekday than weekend journeys associated with commuter patterns. In the absence of an LEA-relevant event attracting increased weekend journeys, subtracting a specific weekend date’s journeys from an overall mean is likely to produce a negative number, which, for current purposes, is noise).
Rather than focus on direct association between MGE journeys and COVID-19 infections, the second mode of analysis offers a broader perspective, using two custom metrics, Event Day Factor (EDF) and Indexed Infection Rate (IIR) to compare post-MGE LEA infection rates across event day mobility levels. EDF, a metric of MGE day CPA-LEA journeys relative to typical (non-MGE) journeys daily journeys, is calculated by dividing match day journeys by mean daily journeys on non-match day (days when no All-Ireland Finals event was held match at Croke Park) over the period 1
Indexed Infection Rate (IIR) IIR is calculated by dividing the infection rate posted for the week of the event into the five subsequent weekly infection rates, thus compiling a weekly index number series, indexed to the event week. Again this provides a generic measure of how LEA infection rates changed in the weeks after the MGE, comparable across LEAs of different sizes and circumstances.
Example: The mean of estimated daily journeys from the Croke Park area to Cappamore-Kilmallock LEA-7 in county Limerick on non-match days during period 1
Cappamore-Kilmallock LEA-7 posted a COVID-19 infection rate of 324.5 per 100,000 week ending 9
Table 2
CPA journeys by All-Ireland finalist counties
| Event date | County | Population | Non-match day Avg to CPA | Match day to CPA | To CPA county EDF | Non-match day Avg from CPA | Match day from CPA | From CPA county EDF |
|---|---|---|---|---|---|---|---|---|
| 07 | Limerick | 194899 | 145 | 2166 | 14.9 | 115 | 1710 | 14.9 |
| 07 | Waterford | 116176 | 99 | 1885 | 19.0 | 79 | 1492 | 18.9 |
| 08 | Cork | 542868 | 229 | 3557 | 15.5 | 192 | 2652 | 13.8 |
| 08 | Kilkenny | 99232 | 233 | 2550 | 10.9 | 173 | 1977 | 11.4 |
| 14 | Mayo | 130507 | 71 | 1191 | 16.8 | 54 | 147 | 2.7 |
| 22 | Cork | 542868 | 229 | 4336 | 18.9 | 192 | 3857 | 20.1 |
| 22 | Limerick | 194899 | 145 | 3776 | 26.0 | 115 | 2947 | 25.6 |
| 28 | Kerry | 179000 | 57 | 689 | 12.1 | 38 | 405 | 10.7 |
| 11 | Mayo | 130507 | 71 | 2704 | 38.1 | 54 | 1409 | 26.1 |
CPA – Croke Park Area; EDF – Event Day Factor.
As weighted metrics, EDF and IIR facilitate direct comparison across LEAs of differing population sizes and levels of daily mobility from Dublin. Testing the hypothesis of no difference in LEA infection rates across ordinal ranks of MGE-related mobility presents a different perspective from the regression, offering insight as to whether critical masses of mobility might be associated with increased infection rates, irrespective of any direct linear relationship. A Kruskal-Wallis analysis of variance on ranks is used to compare IIRs across ordinal EDF bands of
Let
With the hurling finals considered as a single event, analyses are applied to five MGEs overall. Tables presenting regression results, LEA counts by EDF level, the results of tests for normal distribution (required for ANOVA) of IIR scores by week and EDF level, and ANVOA results are presented in Appendix 1, with accompanying notes. Three visualisations pertaining to each event are included in Appendix II. The first of each set is a choropleth displaying EDF by LEA, providing a geographically disaggregated, easily understood view of MGE-related mobility. The second of each set, intended as visual aid to the regression analyses, is a scatterplot, faceted by week, of cumulative COVID cases plotted against estimated MGE attendance. The third, intended as a visual aid to ANOVA, is a boxplot faceted by week, plotting IIR scores by EDF levels.
3.Results
Figure 4 and Table 2 below shows daily estimated journeys to/from the Croke Park area (CPA) by selected county (All-Ireland 2021 finalist/semi-finalist counties) over the period 1
Figure 4.
Daily journeys to/from Croke Park.
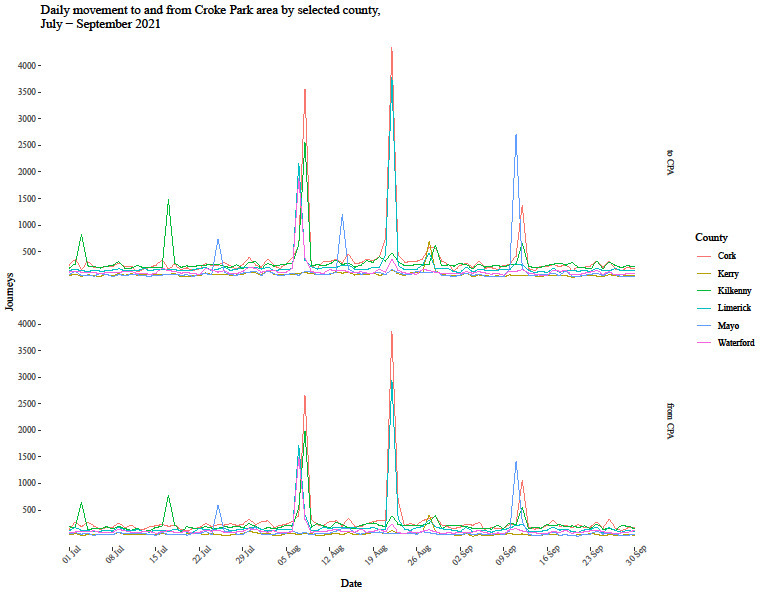
The 2021 All Senior Championship Hurling semi-finals were contested in Croke Park between Limerick and Waterford on the Saturday, 7
The first All-Ireland Senior Championship Football semi-final match was contested between Dublin and Mayo in Croke Park on Saturday 14
The All-Ireland Senior Championship Hurling final was contested between Cork and Limerick in Croke Park on Sunday 22
The second 2021 All-Ireland Senior Championship football semi-final was contested between Kerry and Tyrone in Croke Park on Saturday 28
The last of the 2021 All-Ireland Finals MGEs, the Football Senior Championship Final, was contested between Mayo and Tyrone in Croke Park on 11
4.Discussion
Studies of sporting MGES during spring 2020 in England and during autumn 2020 in Germany both found that the events precipitated minor increases in local COVID-19 infections. Olczak et al. estimated that each football match held across England during March-April 2020 increased local COVID-19 cases by 6 per 100,000 people on average, and may also have impacted on infection rates in areas from which visiting teams and their supporters travelled [1]. Similarly, Fischer et al.’s analysis of European professional football matches held from 10
By contrast, this exploratory study, which investigated how a series of stadium MGEs held in Dublin during late summer 2021, did not find any association between MGE attendance and COVID-19 infections. Although the 2021 All-Ireland Finals MGEs were held in August and early September, a time when the dominant strain was the Delta variant, which was more transmissible (though less virulent) than previously dominant strains, and just a few weeks into a period of rising case numbers, no association was found between MGE-related mobility from/to specific LEAs and COVID-19 infection rates in those LEAs over subsequent five week periods. No evidence that the 2021 All-Ireland Finals MGEs contributed to COVID-19 infection rates was found.
While contrasting with earlier studies findings on how comparable sporting MGEs impacted on infection rates during the pandemic’s earlier stages, this study supports the consensus that association between mobility in of itself and infections weakened after the pandemic’s initial stages. Drawing on mobility metrics derived from MNO data, studies by Gatelo et al. [16] and Madden et al. [17] found that high mobility levels were associated with high infection rates during the earlier months of the pandemic, up to May 2020, and that the sharply decreased mobility imposed by ‘lockdowns’ did curb infection rates. However, mobility-infection correlations associations weakened after the initial stage of the pandemic. These studies argue that behavioural changes such as mask wearing in shared spaces, social distancing, and appropriate hand hygiene were likely more important in reducing case numbers than mobility restrictions alone. Scenarios where these behaviours were relaxed or absent are associated with increased case numbers. A retrospective cohort study linked a COVID-19 outbreak in Castellon, Spain to attendance at feast and dance MGEs associated with the Falles festival held in Castellon’s Borriana municipality in late February and early March 2020 [18]. Malaysia suffered the highest numbers of COVID-19 cases and deaths in Southeast Asia in the first quarter of 2020, with over 35% cases directly linked to the Sri Petaling religious MGE attracting members of the Tablighi Muslim missionary movement from across the region [19]. Iran came to be regarded as the ‘second epicentre’ of COVID-19 pandemic when an epidemic spread from Qom, a city of 1.2 m inhabitants which attracts 20 million Shite Muslim pilgrims from the Middle Eastern, Afghanistan, and Pakistan [20]. Madden et al. note that Ireland’s 2020 festive period, during which restrictions on indoor social gathering were relaxed, precipitated a wave of unprecedented daily COVID-19 case numbers [17]. This pattern was repeated in more intensified form over the following year’s festive season.
These studies of a diverse range of MGEs and social occasions are aligned in emphasised the role communal activities in spreading infections. These include activities general to many forms of MGEs such as congregation and loud conversation, shared dining, dancing, singing and/or chanting, and also event specific activities such as shared sleeping at religious pilgrimage MGEs and alcohol consumption, which is associated with risk behaviours at sporting and music events. Near universal cancellation or significant modification of MGEs is widely held to have forestalled or mitigated further COVID-19 outbreaks. The All-Ireland MGEs examined in this study were held in an outdoor venue during late summer 2021, with sub-capacity attendance and mandatory social distancing, in a context of high degrees of awareness of infection mitigation behaviours, such as wearing face covers and practising appropriate hand hygiene, and where the overwhelming majority of Ireland’s adult population were vaccinated against COVID-19, with proof of vaccination or recovery required to enter the stadium or hospitality venues such as pubs and restaurants. These factors may explain the difference between the relatively modest effect on case rates detected by studies of earlier comparable stadium MGES and the lack of effect found here. Contrasting the circumstances, policy context, and epidemiological outcomes of the All-Ireland Finals MGEs in 2021 and comparable football MGEs held in England and Germany in 2020, the evidence presented here does appear to support the Irish government’s claims of success with it’s ‘pilot’ approach. Controlled experimentation with scaling up attendances at a series of safeguarded events with carefully monitored post-hoc contact tracing did provide sufficient evidence for greater outdoor MGE attendance increases, and might provide a template for future MGE management under similar circumstances.
Mobile phone network data is recognised as the gold standard for analysis of human population mobility, and has proved a valuable resource in analysing mobility disruptions and restructuring around the world caused by the COVID-19 pandemic, underpinning analyses of population mobility responses in national and situational contexts such as studies examining mobility trends and the spread of COVID-19 in the Republic of Ireland [17], quantifying migration from cities towards rural areas in Finland, where many families maintain a second home, during periods of government stay at home orders [24], and modelling the effects of mobility restrictions on the spread of COVID-19 in Shenzhen, China [25].
However, few studies of MGEs in the pandemic context have used origin-destination matrices [28, 29]. Fischer uses mobility metrics based on estimates of match day percentage point increases in general mobility in home and visiting counties relative to a 2019 reference period, rather than considering visiting county to home county journeys directly. Olczak et al. also consider home and visiting team areas separately, but do not include mobility metrics in their analysis. This exploratory study took a simpler, more direct approach, facilitated by the high resolution mobility data. The linear formula employed estimates of mobility from the stadium ‘hub’ area to LEA ‘spokes’ as a proxy for MGE attendance, while the analysis of variance considered MGE journeys relative to typical mobility levels. A 2020 Lancet article on effective analytical use of mobile phone data for monitoring travel and physical distancing interventions recommended that ‘data must be optimised to an actionable spatial boundary, such as an administrative zone or grid square, and on a timescale that can provide epidemiologically relevant information’ [26]. The analysis of the pandemic-era MGEs presented here is based on mobility data fitting this framework.
While the mobility data used is of high quality, there are some caveats around interpretation. MGE attendance is inferred from mobility proxies, which do not offer direct observation of individual or group behaviours such as social distancing observance or face covering wearing. And as the dataset is anonymised and aggregated, demographic details on mobile carriers are unavailable. Rather than the more fully realised predictive models incorporating variables representing local demographic conditions, or more detailed representation of local epidemiological conditions factoring in hospitalisations and excess deaths presented in many other studies, here COVID infections numbers by LEA were regressed onto MGE attendance with a straightforward linear equation. This admittedly narrow approach was chosen to highlight and explore the potential of the high resolution mobility data in understanding mobility associated with and attendance at specific events, and in producing granular, localised analysis of their epidemiological impacts. More broadly it demonstrates how high detail, high volume privately held data can be leveraged for statistical analysis or official statistics without compromising personal privacy or digital rights. Future work could incorporate high-resolution mobility data into more holistic and sophisticated models, or on the other hand, present more straightforward aggregates and indicators, such as the EDF and IIR metrics as bases for official statistics.
This paper presents formal statistical analysis, but the key finding that the MGEs did draw large crowds and did occasion substantial increases in mobility, but did not precipitate increases in COVID-19 infections, is intimated by the maps and plots included, and can be understood intuitively at a glance. The graphs, maps and tables presented here are produced by parameterised software routines, which can be embedded in desktop based or web based ‘dashboard’ style interfaces. The work presented here provides an example of the types of tools techniques which can be made available to leverage high volume, high detail data to generate insights into specific policy issues or questions and capability to provide information and analytical/visual tools available to non-expert, non-technical users, such as policy makers, media, or members of the general public, in timely fashion, as official statistics. While the focus here is on a specific series of sporting MGEs taking place at single, a similar approach could be employed to analyse mobility associated with many events and locations.
5.Conclusion
Framing the 2021 All-Ireland Finals as a series of discrete natural experiments, this study found that while the events caused localised mobility spikes, they did not precipitate increases in local COVID-19 infection rates over the following five weeks. In addition to these specific findings, the study has demonstrated how mobility datasets derived from mobility network operators can be leveraged for insights into or official statistics on population mobility and COVID-19 infection patterns, without compromises of privacy or personal data rights.
Supplementary data
The supplementary files are available to download from http://dx.doi.org/10.3233/SJI-220045.
References
[1] | Olczak M, Reade J, Yeo M. Mass outdoor events and the spread of an airborne virus: English football and COVID-19. (2020) Aug 27. Available at SSRN 3682781. |
[2] | Fischer K. Thinning out spectators: Did football matches contribute to the second COVID-19 wave in Germany. (2021) Feb 26. Available at SSRN 3793379. |
[3] | Drury J, Rogers MB, Marteau TM, Yardley L, Reicher S, Stott C. Re-opening live events and large venues after Covid-19 ‘lockdown’: Behavioural risks and their mitigations. Safety Science. (2021) Jul 1; 139: : 105243. |
[4] | Corsini A, Bisciotti GN, Eirale C, Volpi P. Football cannot restart soon during the COVID-19 emergency! A critical perspective from the Italian experience and a call for action. British Journal of Sports Medicine. (2020) Oct 1; 54: (20): 1186-7. |
[5] | McCloskey B, Zumla A, Ippolito G, Blumberg L, Arbon P, Cicero A, Endericks T, Lim PL, Borodina M. Mass gathering events and reducing further global spread of COVID-19: a political and public health dilemma. The Lancet. (2020) Apr 4; 395: (10230): 1096-9. |
[6] | Listings of WHO’s response to COVID-19. https://www.who.int/news/item/29-06-2020-covidtimeline, accessed 4 |
[7] | Timeline and detail of public health restrictive measures advised by NPHET in response to the COVID-19 pandemic. NPHET Policy Unit, Department of Health, 13 January (2021) . |
[8] | Coronavirus in Ireland – a timeline. https://www.rte.ie/news/2020/0320/1124382-covid-19-ireland-timeline/, accessed 5 |
[9] | Resilience and Recovery 2020-2021: Plan for Living with COVID-19. Department of the Taoiseach, Government of Ireland, 15 |
[10] | https://www.gov.ie/en/publication/e5175-resilience-and-recovery-2020-2021-plan-for-living-with-covid-19/, accessed 5 |
[11] | Ireland’s COVID-19 Data Hub. Government of Ireland. https://covid19ireland-geohive.hub.arcgis.com/, accessed 5 |
[12] | Speech by Taoiseach Micheál Martin from Government Buildings. Department of the Taoiseach, Government of Ireland, Friday, 28 |
[13] | Minister Chambers publishes guidelines for safe return of spectators to sports events. Department of Tourism, Culture, Arts, Gaeltacht, Sport and Media, Government of Ireland, Published on 7 |
[14] | Attendance of 40,000 to be permitted at GAA All-Ireland Finals in Croke Park. Irish Times. 30 July (2021) . Available at: https://www.irishtimes.com/news/ireland/irish-news/attendance-of-40-000-to-be-permitted-at-gaa-all-ireland-finals-in-croke-park-1.4635098. |
[15] | |
[16] | Gatalo O, Tseng K, Hamilton A, Lin G, Klein E. Associations between phone mobility data and COVID-19 cases. The Lancet Infectious Diseases. (2021) May 1; 21: (5): e111. |
[17] | Madden JM, More S, Teljeur C, Gleeson J, Walsh C, McGrath G. Population Mobility Trends, Deprivation Index and the Spatio-Temporal Spread of Coronavirus Disease 2019 in Ireland. International Journal of Environmental Research and Public Health. (2021) Jan; 18: (12): 6285. |
[18] | Domènech-Montoliu S, Pac-Sa MR, Vidal-Utrillas P, Latorre-Poveda M, Del Rio-González A, Ferrando-Rubert S, Ferrer-Abad G, Sánchez-Urbano M, Aparisi-Esteve L, Badenes-Marques G, Cervera-Ferrer B. Mass gathering events and COVID-19 transmission in Borriana (Spain): A retrospective cohort study. PloS One. (2021) Aug 26; 16: (8): e0256747. |
[19] | Mat NF, Edinur HA, Razab MK, Safuan S. A single mass gathering resulted in massive transmission of COVID-19 infections in Malaysia with further international spread. Journal of Travel Medicine. (2020) Apr 1. |
[20] | Ebrahim SH, Memish ZA. COVID-19 – the role of mass gatherings. Travel Medicine and Infectious Disease. (2020) Mar 1; 34: : 101617. |
[21] | McAloon C, Collins Á, Hunt K, Barber A, Byrne AW, Butler F, Casey M, Griffin J, Lane E, McEvoy D, Wall P. Incubation period of COVID-19: a rapid systematic review and meta-analysis of observational research. BMJ open. (2020) Aug 1; 10: (8): e039652. |
[22] | Health Protection Surveillance Centre. Summary of COVID-19 virus variants in Ireland Report. Health Service Executive, (2022) Jan 1. |
[23] | Park M, Cook AR, Lim JT, Sun Y, Dickens BL. A systematic review of COVID-19 epidemiology based on current evidence. Journal of Clinical Medicine. (2020) Apr; 9: (4): 967. |
[24] | Willberg E, Järv O, Väisänen T, Toivonen T. Escaping from cities during the covid-19 crisis: Using mobile phone data to trace mobility in finland. ISPRS International Journal of Geo-information. (2021) Feb; 10: (2): 103. |
[25] | Zhou Y, Xu R, Hu D, Yue Y, Li Q, Xia J. Effects of human mobility restrictions on the spread of COVID-19 in Shenzhen, China: a modelling study using mobile phone data. The Lancet Digital Health. (2020) Aug 1; 2: (8): e417-24. |
[26] | Kishore N, Kiang MV, Engø-Monsen K, Vembar N, Schroeder A, Balsari S, Buckee CO. Measuring mobility to monitor travel and physical distancing interventions: a common framework for mobile phone data analysis. The Lancet Digital Health. (2020) Sep 1. |
[27] | Oliver N, Lepri B, Sterly H, Lambiotte R, Deletaille S, De Nadai M, Letouzé E, Salah AA, Benjamins R, Cattuto C, Colizza V. Mobile phone data for informing public health actions across the COVID-19 pandemic life cycle. Science Advances. (2020) Jun 1; 6: (23): eabc0764. |
[28] | Wesolowski A, Eagle N, Tatem AJ, Smith DL, Noor AM, Snow, RW, Buckee CO. Quantifying the impact of human mobility on malaria. Science. (2012) ; 338: : 267-270. |
[29] | Csáji BC, Browet A, Traag VA, Delvenne JC, Huens, E, Van Dooren P, Blondel VD. Exploring the mobility of mobile phone users. Physics A. (2013) :392; 1459-1473. |
[30] | Department of Tourism, Culture, Arts, Gaeltacht, Sport and Media. Minister Chambers publishes guidelines for safe return of spectators to sports events. (2020) Jun 7. Available at: https://www.gov.ie/en/press-release/70663-minister-jack-chambers-publishes-updated-guidelines-for-safe-return-of-spectators-to-sports-events/. |
Appendices
Appendix 1
Appendix 1.1. Hurling semi-finals 7–8th
| Week ending | Normality test |
|---|---|
| 09th Aug 2021 | 0.0e+00 |
| 16th Aug 2021 | 0.0e+00 |
| 23th Aug 2021 | 0.0e+00 |
| 30th Aug 2021 | 1.0e-07 |
| 06th Sep 2021 | 2.0e-07 |
| 13th Sep 2021 | 5.0e-07 |
| 20th Sep 2021 | 9.0e-07 |
| 27th Sep 2021 | 1.2e-06 |
| 04th Oct 2021 | 1.4e-06 |
| 11th Oct 2021 | 2.5e-06 |
| 18th Oct 2021 | 4.2e-06 |
| 25th Oct 2021 | 8.6e-0 |
| COVID-19 cumulative cases by LEA regressed onto journeys from CPA increase, 7th, 8th Aug 2021 | ||||
|---|---|---|---|---|
| Week | Estimate | Std. error | Pr ( | |
| 16 | 0.23 | 0.81 | ||
| 23 | 0.26 | 0.63 | ||
| 30 | 0.30 | 0.50 | ||
| 06 | 0.33 | 0.43 | ||
| 13 | 0.35 | 0.44 | ||
CPA – Croke Park Area; EDF – Event; LEA – Local Electoral Area.
| LEA Count by EDF Level 7th, 8th August 2021 | ||||||
|---|---|---|---|---|---|---|
| EDF level | 2–4.9 | 5–9.9 | 10–14.9 | 15–19.9 | 20 | |
| LEA count | 68 | 28 | 12 | 11 | 7 | 5 |
EDF – Event Day Factor; LEA – Local Electoral Area.
| IIR five weeks subsequent to MGE by EDF levels 7th, 8th August 2021 Kruskal-Wallis test results | |||
| Week | Chi Sq | DF | |
| 16 | 2.84 | 5 | 0.73 |
| 23 | 5.30 | 5 | 0.38 |
| 30 | 4.16 | 5 | 0.53 |
| 06 | 2.87 | 5 | 0.72 |
| 13 | 3.11 | 5 | 0.6 |
EDF – Event Day Factor; IIR – Indexed Infection Rate.
| 7th, 8th August 2021 match day mobility normality test results | |||||
|---|---|---|---|---|---|
| EDF level | 16 | 23 | 30 | 06 | 13 |
| 0.00 | 0.00 | 0.00 | 0.00 | 0.00 | |
| 2–4.9 | 0.00 | 0.00 | 0.00 | 0.00 | 0.00 |
| 5–9.9 | 0.18 | 0.04 | 0.05 | 0.96 | 0.10 |
| 10–14.9 | 0.20 | 0.66 | 0.89 | 0.43 | 0.09 |
| 15–19.9 | 0.15 | 0.90 | 0.63 | 0.00 | 0.02 |
| 20 | 0.84 | 0.21 | 0.06 | 0.99 | 0.72 |
EDF – Event Day Factor.
| 7th, 8th August 2021 match day mobility log transformed normality test results | |||||
|---|---|---|---|---|---|
| EDF | |||||
| level | 16 | 23 | 30 | 06 | 13 |
| 0.40 | 0.73 | 0.35 | 0.03 | 0.73 | |
| 2–4.9 | 0.34 | 0.34 | 0.33 | 0.55 | 0.43 |
| 5–9.9 | 0.20 | 0.47 | 0.86 | 0.92 | 0.85 |
| 10–14.9 | 0.56 | 0.91 | 0.89 | 1.00 | 0.62 |
| 15–19.9 | 0.13 | 0.53 | 0.98 | 0.08 | 0.51 |
| 20 | 0.93 | 0.30 | 0.04 | 0.62 | 0.58 |
EDF – Event Day Factor.
| ANOVA results, IIR five weeks subsequent to MGE by EDF levels 7th, 8th August 2021 | |||||
|---|---|---|---|---|---|
| Week | Df | Sum Sq | Mean Sq | Pr ( | |
| 16 | 5 | 0.01 | 0.00 | 0.16 | 0.98 |
| 23 | 5 | 0.05 | 0.01 | 0.31 | 0.90 |
| 30 | 5 | 0.03 | 0.01 | 0.16 | 0.98 |
| 06 | 5 | 0.03 | 0.01 | 0.14 | 0.98 |
| 13 | 5 | 0.06 | 0.01 | 0.25 | 0.94 |
EDF – Event Day Factor; IIR – Indexed Infection Rate; MGE – Mass Gathering Event.
Appendix 1.2. Football semi-final 14th
| COVID-19 cumulative cases by LEA regressed onto journeys from CPA increase, 14th Aug 2021 | ||||
|---|---|---|---|---|
| Week | Estimate | Std. error | Pr ( | |
| 23 | 0.26 | 0.22 | ||
| 30 | 0.30 | 0.18 | ||
| 06 | 0.32 | 0.18 | ||
| 13 | 0.35 | 0.21 | ||
| 20 | 0.36 | 0.25 | ||
CPA – Croke Park Area; LEA – Local Electoral Area.
| EDF levels by LEA 14 August 2021 | ||||||
|---|---|---|---|---|---|---|
| EDF level | 2–4.9 | 5–9.9 | 10–14.9 | 15–19.9 | 20 | |
| LEA count | 110 | 17 | 1 | – | – | – |
EDF – Event Day Factor; LEA – Local Electoral Area.
| IIR five weeks subsequent to MGE by EDF levels 14th August 2021 Kruskal-Wallis test results | |||
| Week | Chi Sq | DF | |
| 23 | 0.24 | 2 | 0.89 |
| 30 | 0.93 | 2 | 0.63 |
| 06 | 1.85 | 2 | 0.40 |
| 13 | 1.73 | 2 | 0.42 |
| 20 | 1.10 | 2 | 0.58 |
EDF – Event Day Factor; IIR – Indexed Infection Rate; MGE – Mass Gathering Events.
The EDF and IIR scores associated with 14
| EDF levels by LEA 14 August 2021 | ||
|---|---|---|
| EDF level | 2 | |
| LEA count | 110 | 18 |
EDF – Event Day Factor; LEA – Local Electoral Area.
The two weeks’ data successfully normalised are suitable for comparison, using a
| 7th, 8th August 2021 match day mobility normality test results | |||||
| EDF level | 23 | 30 | 06 | 13 | 20 |
| 0.00 | 0.00 | 0 | 0 | 0.00 | |
| 2 | 0.09 | 0.11 | 0 | 0 | 0.01 |
EDF – Event Day Factor.
| 7th, 8th August 2021 match day mobility log transformed normality test results | |||||
|---|---|---|---|---|---|
| EDF level | 23 | 30 | 06 | 13 | 20 |
| 0.00 | 0.00 | 0.00 | 0.17 | 0.73 | |
| 2 | 0.02 | 0.94 | 0.09 | 0.19 | 0.7 |
EDF – Event Day Factor.
| IIR by EDF levels | |||
|---|---|---|---|
| Week | T | Df | |
| 13 | 0.89 | 21.27 | 0.38 |
| 20 | 1.13 | 21.28 | 0.27 |
EDF – Event Day Factor; IIR – Indexed Infection Rate.
Appendix 1.3. Hurling final 22nd
| COVID-19 cumulative cases by LEA regressed onto journeys from CPA increase, 11th Sep 2021 | ||||
|---|---|---|---|---|
| Week | Estimate | Std. error | Pr ( | |
| 30 | 1.03 | 1.17 | 0.88 | 0.38 |
| 06 | 1.00 | 1.28 | 0.78 | 0.44 |
| 13 | 1.03 | 1.38 | 0.75 | 0.45 |
| 20 | 1.06 | 1.47 | 0.72 | 0.47 |
| 27 | 0.99 | 1.55 | 0.64 | 0.52 |
CPA – Croke Park Area; LEA – Local Electoral Area.
| 22 | ||||||
|---|---|---|---|---|---|---|
| EDF level | 2–4.9 | 5–9.9 | 10–14.9 | 15–19.9 | 20 | |
| LEA count | 76 | 20 | 11 | 9 | 2 | 12 |
EDF – Event Day Factor; LEA – Local Electoral Area.
| IIR five weeks subsequent to MGE by EDF levels 22nd August 2021 Kruskal-Wallis test results | |||
| Week | Chi Sq | DF | |
| 30 | 2.84 | 5 | 0.72 |
| 06 | 3.12 | 5 | 0.68 |
| 13 | 5.89 | 5 | 0.32 |
| 20 | 2.49 | 5 | 0.78 |
| 27 | 2.29 | 5 | 0.81 |
EDF – Event Day Factor; IIR – Indexed Infection Rate; MGE – Mass Gathering Events.
Of the 130 LEAs for which data was available, 76 of 130 experienced
| 22 | |||||
|---|---|---|---|---|---|
| EDF level | 2–4.9 | 5–9.9 | 10–19.9 | 20 | |
| LEA count | 76 | 20 | 11 | 11 | 12 |
EDF – Event Day Factor; LEA – Local Electoral Area.
| 22 | |||||
|---|---|---|---|---|---|
| EDF level | 30 | 06 | 13 | 20 | 27 |
| 0.01 | 0.00 | 0.0 | 0.00 | 0.00 | |
| 2–4.9 | 0.00 | 0.01 | 0.0 | 0.00 | 0.02 |
| 5–9.9 | 0.33 | 0.16 | 0.2 | 0.77 | 0.58 |
| 10–19.9 | 0.04 | 0.00 | 0.0 | 0.00 | 0.65 |
| 20 | 0.96 | 0.07 | 0.2 | 0.01 | 0.0 |
EDF – Event Day Factor.
| 22 | |||||
|---|---|---|---|---|---|
| EDF level | 30 | 06 | 13 | 20 | 27 |
| 0.41 | 0.42 | 0.95 | 0.18 | 0.12 | |
| 2–4.9 | 0.03 | 0.09 | 0.02 | 0.60 | 0.89 |
| 5–9.9 | 0.88 | 0.51 | 0.83 | 0.49 | 0.38 |
| 10–19.9 | 0.12 | 0.03 | 0.08 | 0.04 | 0.96 |
| 20 | 0.99 | 0.61 | 0.99 | 0.87 | 0.20 |
EDF – Event Day Factor.
| IIR five weeks subsequent to MGE by EDF levels 22nd August 2021 ANOVA results | |||||
|---|---|---|---|---|---|
| Week | Df | Sum Sq | Mean Sq | Pr ( | |
| 30 | 4 | 0.02 | 0.00 | 0.39 | 0.82 |
| 06 | 4 | 0.03 | 0.01 | 0.37 | 0.83 |
| 13 | 4 | 0.00 | 0.00 | 0.03 | 1.00 |
| 20 | 4 | 0.10 | 0.03 | 0.52 | 0.72 |
| 27 | 4 | 0.15 | 0.04 | 0.66 | 0.62 |
IIR – Indexed Infection Rate; MGE – Mass Gathering Event.
Appendix 1.4. Football semi-final 28th
| COVID-19 cumulative cases by LEA regressed onto journeys from CPA increase, 28th Aug 2021 | ||||
|---|---|---|---|---|
| Week | Estimate | Std. error | Pr ( | |
| 06 | 0.73 | 0.36 | 2.03 | 0.04 |
| 13 | 0.81 | 0.38 | 2.11 | 0.04 |
| 20 | 0.89 | 0.41 | 2.17 | 0.03 |
| 27 | 0.91 | 0.43 | 2.11 | 0.04 |
| 04 | 0.91 | 0.45 | 2.03 | 0.04 |
CPA – Croke Park Area; LEA – Local Electoral Area.
| 22 | ||||||
|---|---|---|---|---|---|---|
| EDF level | 2–4.9 | 5–9.9 | 10–14.9 | 15–19.9 | 20 | |
| LEA count | 92 | 28 | 8 | 2 | – | – |
EDF – Event Day Factor; LEA – Local Electoral Area.
| IIR five weeks subsequent to MGE by EDF levels 28 | |||
| Week | Chi Sq | DF | |
| 06 | 1.77 | 3 | 0.62 |
| 13 | 5.57 | 3 | 0.13 |
| 20 | 3.82 | 3 | 0.28 |
| 27 | 4.77 | 3 | 0.19 |
| 04 | 2.67 | 3 | 0.45 |
IIR – Indexed Infection Rate; MGE – Mass Gathering Events.
As ANOVA requires a minimum sample size of three from each group included in the analysis, all LEAs experiencing 5
| EDF Levels | |||
|---|---|---|---|
| EDF level | 2–4.9 | 5 | |
| LEA count | 92 | 28 | 10 |
EDF – Event Day Factor; LEA – Local Electoral Area.
|
Table 11.22 | |||||
|---|---|---|---|---|---|
| EDF level | 06 | 13 | 20 | 27 | 04 |
| 0.01 | 0.00 | 0.00 | 0.01 | 0.00 | |
| 2–4.9 | 0.49 | 0.18 | 0.02 | 0.00 | 0.00 |
| 5 | 0.30 | 0.69 | 0.87 | 0.12 | 0.05 |
EDF – Event Day Factor.
|
Table 11. 22 | |||||
|---|---|---|---|---|---|
| EDF level | 06 | 13 | 20 | 27 | 04 |
| 0.67 | 0.10 | 0.20 | 0.01 | 0.76 | |
| 2–4.9 | 0.49 | 1.00 | 0.66 | 0.19 | 0.32 |
| 5 | 0.21 | 0.51 | 0.55 | 0.24 | 0.71 |
EDF – Event Day Factor.
| IIR by EDF Levels ANOVA results, five weeks subsequent to 28 | |||||
|---|---|---|---|---|---|
| Week | Df | Sum Sq | Mean Sq | Pr ( | |
| 30 | 4 | 0.02 | 0.00 | 0.39 | 0.82 |
| 06 | 4 | 0.03 | 0.01 | 0.37 | 0.83 |
| 13 | 4 | 0.00 | 0.00 | 0.03 | 1.00 |
| 20 | 4 | 0.10 | 0.03 | 0.52 | 0.72 |
| 27 | 4 | 0.15 | 0.04 | 0.66 | 0.62 |
EDF – Event Day Factor; IIR – Indexed Infection Rate.
Appendix 1.5. Football final – 11th
| COVID-19 cumulative cases by LEA regressed onto journeys from CPA increase, 11th Sep 2021 | ||||
|---|---|---|---|---|
| Week | Estimate | Std. error | Pr ( | |
| 20 | 0.4 | 0.3 | ||
| 27 | 0.5 | 0.4 | ||
| 04 | 0.5 | 0.4 | ||
| 11 | 0.5 | 0.5 | ||
| 18 | 0.5 | 0.5 | ||
CPA – Croke Park Area; LEA – Local Electoral Area.
| 11 | ||||||
|---|---|---|---|---|---|---|
| EDF level | 2–4.9 | 5–9.9 | 10–14.9 | 15–19.9 | 20 | |
| LEA count | 92 | 25 | 7 | 1 | 1 | 3 |
EDF – Event Day Factor; LEA – Local Electoral Area.
| IIR five weeks subsequent to MGE by EDF levels 22nd August 2021 Kruskal-Wallis test results | |||
| Week | Chi Sq | DF | |
| 20th Sep 2021 | 3.48 | 5 | 0.63 |
| 27th Sep 2021 | 1.29 | 5 | 0.94 |
| 04th Oct 2021 | 1.48 | 5 | 0.92 |
| 11th Oct 2021 | 5.32 | 5 | 0.38 |
| 18th Oct 2021 | 5.18 | 5 | 0.39 |
EDF – Event Day Factor; IIR – Indexed Infection Rate; MGE – Mass Gathering Events.
As the 10–14.9 and 15–19.9 EDF categories only displayed one observation each, and the 20
| 11 | ||||
|---|---|---|---|---|
| EDF level | 2–4.9 | 5–9.9 | 10 | |
| LEA count | 92 | 25 | 7 | 5 |
EDF – Event Day Factor; LEA – Local Electoral Area.
| 11 | |||||
|---|---|---|---|---|---|
| EDF level | 20 | 27 | 4 | 11 | 18 |
| 0.17 | 0.00 | 0.00 | 0.01 | 0.00 | |
| 2–4.9 | 0.00 | 0.00 | 0.35 | 0.26 | 0.01 |
| 5–9.9 | 0.42 | 0.71 | 0.30 | 0.72 | 1.00 |
| 10 | 0.78 | 0.37 | 0.93 | 0.99 | 0.71 |
EDF – Event Day Factor.
| 11 | |||||
|---|---|---|---|---|---|
| EDF level | 20 | 27 | 4 | 11 | 18 |
| 0.54 | 0.78 | 0.60 | 0.25 | 0.33 | |
| 2–4.9 | 0.36 | 0.73 | 0.36 | 0.35 | 0.75 |
| 5–9.9 | 0.25 | 0.17 | 0.03 | 0.11 | 0.33 |
| 10 | 0.38 | 0.27 | 0.78 | 0.95 | 0.59 |
EDF – Event Day Factor.
| IIR by EDF Levels ANOVA results, five weeks subsequent to 28 | |||||
|---|---|---|---|---|---|
| Week | Df | Sum Sq | Mean Sq | Pr ( | |
| 20 | 3 | 0.04 | 0.01 | 1.09 | 0.36 |
| 27 | 3 | 0.04 | 0.01 | 0.47 | 0.71 |
| 04 | 3 | 0.07 | 0.02 | 0.66 | 0.58 |
| 11 | 3 | 0.24 | 0.08 | 1.72 | 0.17 |
| 18 | 3 | 0.27 | 0.09 | 1.48 | 1.22 |
EDF – Event Day Factor; IIR – Indexed Infection Rate.


