
Economic support to European households in the aftermath of COVID-19. A cross-country comparative analysis based on quarterly sector accounts
Abstract
In response to the COVID-19 outbreak, governments in European countries adopted a wide range of containment measures to prevent the spread of the virus. These measures led to unprecedented short-term economic loss for national economies, to which governments responded with support measures targeting both households and businesses. In this article, we argue that official statistics are a key source for robust comparisons of the economic impact of COVID-19 and subsequent support measures across countries. In particular, we use Eurostat’s quarterly non-financial sector accounts and supplementary information provided by countries to estimate and compare the support received by households in 18 European countries. We focus our analysis on the second and third quarter of 2020, when national economies in Europe were impacted mostly by the containment measures. The results show some heterogeneity in the type and extent of support provided. Interestingly, while in some countries support interventions were far from making up for the loss of income, in others they far outweighed it.
1.Introduction
Since the first months of 2020, many countries around the world enacted stringent containment measures to halt the spread of the coronavirus and limit the number of fatalities. Empirical evidence suggests that these measures were effective in flattening the pandemic curve and reducing the number of fatalities [1, 2]. However, they led to unprecedented economic losses in the short term. According to [3], containment measures determined, on average, a loss of about 15% in industrial production over a 30-day period following their implementation. The OECD estimates that, as a first initial direct impact of lockdowns, the level of output declined between 20% and 25% in many economies [4]. In response to the pandemic outbreak, governments in European countries took a wide range of economic measures to support production activities and households, such as direct income support measures, debt relief policies or fiscal interventions [5].
The necessity of monitoring the economic impact of containment measures and the effectiveness of support measures has led to the development of indices like the Oxford COVID-19 Government Response Tracker [5], and ad hoc databases derived from almost real time data [3, 6, 7]. These high-frequency indicators and data are useful to capture short term changes of economy. However, the heterogeneity of the data sources casts a shadow on the soundness and reliability of comparisons across countries. In this paper, we argue that official statistics represent an indispensable source for comparing what happened in the aftermath of the pandemic outbreak in various countries. In particular, at the macroeconomic level, quarterly non-financial sector accounts published by Eurostat represent a key data source for soundly comparing European governments’ economic interventions.
In this analysis, we focus on household support measures that were put in place the second and third quarter of 2020. First, we use sector accounts data, as well as additional information on COVID-19 support measures provided directly by countries, to estimate the household support measures adopted in various countries, irrespectively of how these measures were implemented. Second, we try to assess their adequacy by relating the total amount of measures to the loss of income that households suffered due to the restrictive measures linked to COVID-19. The empirical application concerns 18 European countries.
The paper is structured as follows. Section 2 describes the data, the metadata and the methods used for the empirical application. Section 3 illustrates the results of the analysis. Section 4 discusses achievements and limits of our study and presents the conclusions.
2.Data, metadata and methods
The empirical application described in this paper is based on non-financial quarterly sector accounts data [8, vintage April 2022] and information on COVID-19 support measures that countries have implemented, which Eurostat has been publishing since June 2020 [9].
This section provides an overview of the general concepts of national accounts that are necessary for the understanding of the analysis described in the rest of the paper. Then, we analyse the information that was provided by countries on the COVID-19 support measures that they implemented at national level. Finally, this section discusses the methodology proposed to derive comparable cross-country estimates of government measures put in place to support households.
2.1National accounts
National accounts describe in monetary terms the economic process that takes place in a territory and in a certain period of time, e.g. one year or quarter. Following a framework similar to that of business accounting, national accounts describe each phase of the economic process, from production to the determination of a debt or credit position of the country versus all other countries.
In national accounts, transactions are grouped according to their nature (e.g. wages and salaries, property income, or social benefits) but also looking at the type of economic agents who receive or pay them. Economic agents are grouped together into five mutually exclusive sectors, namely non-financial corporations, financial corporations, general government, households, and non-profit institutions serving households. The subdivision of the economy into separate sectors allows the development of an accounting system national accounts that shows the financial and non-financial transactions pertaining both to the economy as a whole and to each of the institutional sectors, highlighting in a systematic way their interdependencies.
Compilers of national accounts follow internationally agreed concepts, definitions, classifications and accounting rules in order to produce a coherent, consistent and integrated set of macroeconomic accounts. The internationally agreed guidelines are described in the System of National Accounts 2008 [10] at the global level and the European System of Accounts 2010 [11] at European Union level, the latter also being a legally binding Regulation (Regulation (EU) No 549/2013). The conformity to common rules assures a sound comparability of results.
Non-financial quarterly sector accounts provide estimates of main macro-economic non-financial variables for every quarter of the year. Households and non-profit institutions serving households are considered together as a unique sector. Eurostat publishes non-financial quarterly sector accounts data regularly on its website [8] the fourth month after the end of the reference quarter.
Since its origins, national accounts were designed to be ‘exhaustive’, meaning that, when fully implemented, the accounting framework should make it possible to account for any economic transaction that takes place in the economy. The outbreak of COVID-19 and resulting economic fallout represented a real challenge for compilers of national accounts, who needed to record the newly appeared economic transactions that corresponded to government support measure in way that would be methodologically correct and would allow comparability across countries.
2.2COVID19-related information
In June 2020 Eurostat published guidance [12] for compilers of quarterly sector accounts, whose purpose was twofold. First, it warned of the risk of a deterioration in the quality of estimates caused by missing or only partially available data sources. Secondly, it provided guidance on the recording of major active policy measures adopted by European governments [13],
Table 1
Overview of government support schemes targeting households and their recording in national accounts
| Belgium | Czechia | Germany | Denmark | Greece | Spain | France | Italy | Netherlands | Austria | Portugal | Poland | Finland | Slovenia | Sweden | |
|---|---|---|---|---|---|---|---|---|---|---|---|---|---|---|---|
| Short-time work | x | x | x | x | x | x | x | x | x | x | x | x | x | x | |
| Recorded as other subsidies on production (to employers) | x | x | x | x | x | x | x | x | x | x | |||||
| Recorded as social assistance benefits in cash | x | x | x | x | x | x | x | ||||||||
| Support to keep small business running | x | x | x | x | x | x | x | x | x | x | x | x | x | x | |
| Recorded as other subsidies on production | x( | x( | x( | x( | x( | x( | x( | x( | x( | x( | x( | x( | x( | ||
| Recorded as social assistance benefits in cash | x | x | x | x | x | ||||||||||
| Rrecorded as miscellaneous current transfers | x | ||||||||||||||
| Recorded as other capital transfers | x | x | |||||||||||||
| Support due to working in unfavorable conditions | x | x | x | x | |||||||||||
| Recorded as compensation of employees | x | ||||||||||||||
| Recorded as social assistance benefits in cash | x | x | x | ||||||||||||
| Support to households under COVID not related to their employment or production activities | x | x | x | x | x | x | x | x | x | x | |||||
| Recorded as social assistance benefits in cash | x | x | x | x | x | x | x | ||||||||
| Recorded as social transfers | x | x | |||||||||||||
| Recorded as miscellaneous current transfers | x |
Notes: (
in sector accounts. Based on the nature and purpose of each scheme, the guidance recommended to record government support measures as ‘other subsidies on production’, ‘social assistance benefits in cash’ or alternatively as ‘miscellaneous current transfers’ or ‘other capital transfers’ (see the Appendix for their ESA 2010 definitions).
To help users analyze the impact of COVID-19 on the economies of European Union Member States, Eurostat has been publishing specific metadata on the recording of government support measures in quarterly sector accounts since 2020 [9]. Based on the provided information, analysts have been able to assess whether similar schemes in purpose might have been recorded differently in various countries due to national specificities. Furthermore, the metadata have provided the assessment of national compilers on the impact of COVID-19 on the quality of estimates. While in the second and third quarter of 2020 a number of countries indicated that COVID-19 had impacted the quality of estimates to a certain extent, in the first quarter of 2022, the vast majority of countries managed to ensure the same quality of data as before the COVID-19 outbreak. This seems to be confirmed by the magnitude of revisions, which were not considerable larger during COVID-19 period [14].
From the analysis of available information, it follows that many different schemes were put in place across Europe. In this analysis, we focus on those targeting the household sector, i.e. families and very small producers (sole proprietorships, small enterprises and own-account workers), whose accounts cannot be separated from those of the household that the self-employed worker belongs to [11, par. 2.118].
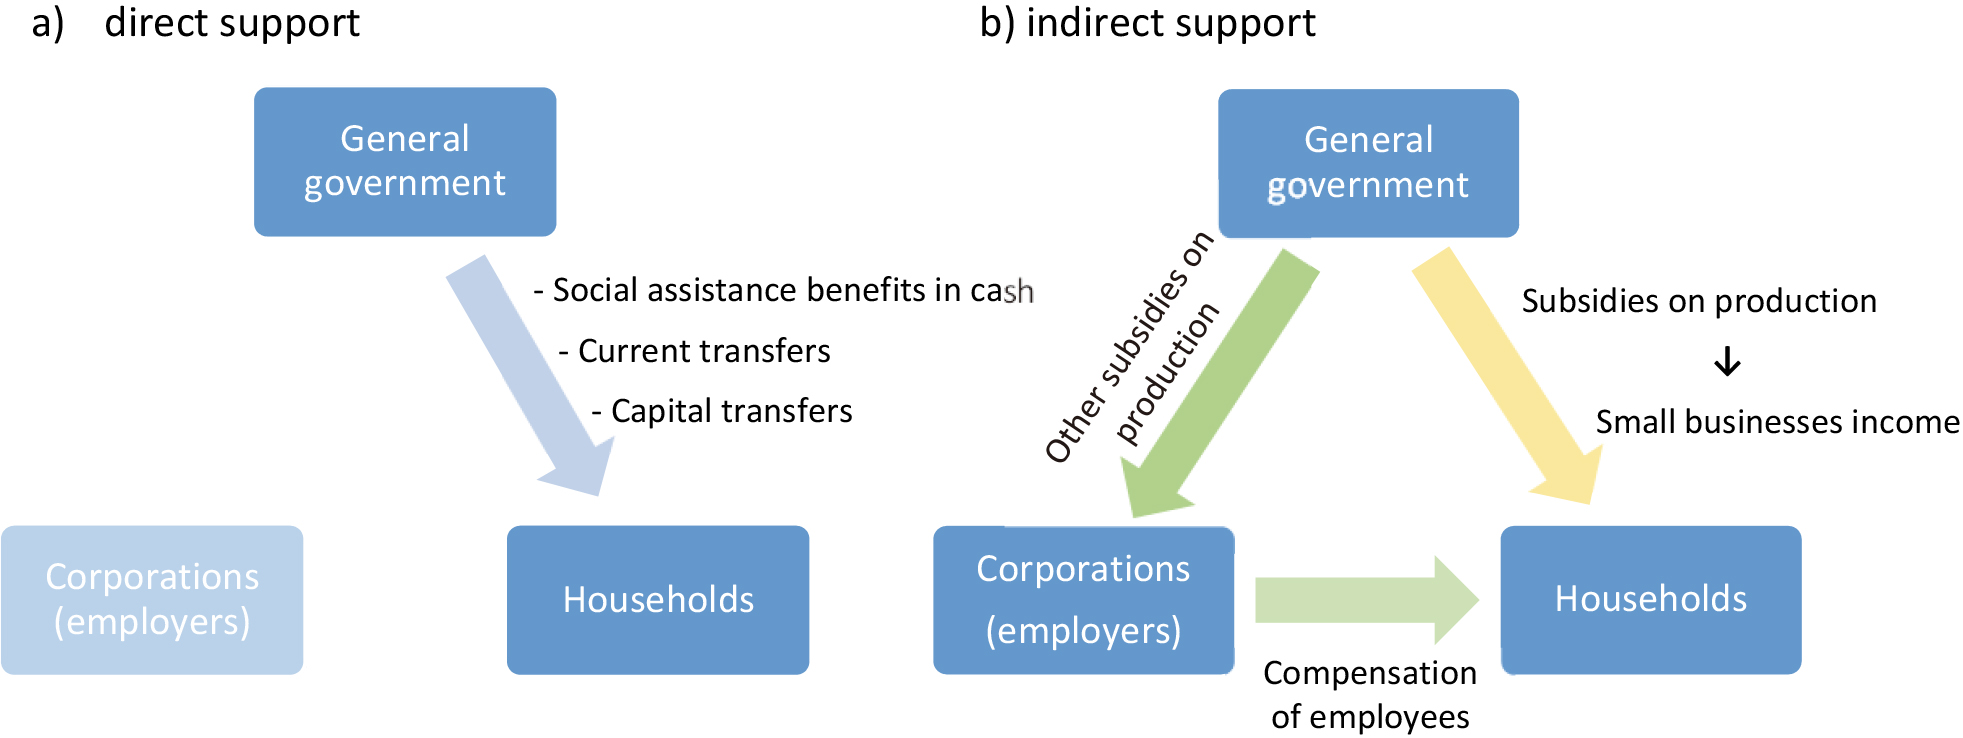
Table 1 provides an overview of this kind of schemes and their recording in non-financial sector accounts, for those European countries that provided the relevant information. A first group of interventions by general governments aimed at supporting households whose members suffered from short-time work or temporary layoff. Other schemes were designed to support households as producers, by helping them either to continue their self-employment or ensure that their small businesses can keep operating. Some measures were designed to support workers employed in adverse conditions (e.g. benefits to workers in the health care sector) and others to relieve families facing adverse conditions due to COVID-19, such as parents involved in home schooling who received special benefits or exceptional solidarity benefits for the most vulnerable families. Finally, some interventions aimed at stimulating household spending in economic sectors particularly affected by COVID-19 related containment measures, such as the hospitality industry.
Most of these schemes were paid directly to households and were recorded as social benefits or current and capital transfers. A relevant exception occurred, however, in the case of the schemes designed for short-time work or temporary layoffs. While some countries recorded support in the context of furlough schemes as social benefits, in many others, these schemes were realized as support to businesses to retain their employees. Consequently, they were recorded as subsidies on production for businesses. In this case, households receive government’s support indirectly via the financial and non-financial corporations sectors by retaining their employment status and receiving their full or biggest part of their wage (Fig. 1).
Figure 1.
Support schemes helping households directly (a) and indirectly (b).
2.3Methodology
The different recording of support given to households in relation to furlough schemes across countries does not allow the direct analysis of COVID-19 on the income of households. In addition, quarterly sector accounts do not directly show the amount of economic measures related to COVID-19, as these are recorded within categories where other relevant transactions are also classified. Therefore, from an analytical perspective it is challenging to compare the interventions of governments across countries to support households during the COVID-19 outbreak.
However, based on some hypotheses, we show that it is possible to approximate the level of these interventions and assess their adequacy. The proposed methodology is based on two fundamental estimates. As a first step, we aim at defining an indicator of the loss of generated income that households experienced. Then, we try to identify and estimate the overall amount of support measures received by households, both in the primary and secondary redistribution of income.
In national accounts, the part of gross domestic product assigned to households is called generated income (GI) and it is composed of compensation of employees and gross mixed income (see the Appendix for definitions).
(1)
We assume that the year-over-year decline of generated income in the second and third quarter of 2020 was due to the economic fallout as a result of the COVID19 containment measures and we indicate this change as loss of generated income (LGI). For the generic X quarter of 2020, LGI is defined as follows:
(2)
We consider the year-over-year change, instead of the quarter-over-quarter, as the income of households exhibits a strong seasonal pattern.
The observation of LGI can be misleading for capturing the real extent of the economic loss experienced by the economy and for comparing such losses across countries. In fact, in some countries, LGI was mitigated or even reversed by the indirect support provided to households through their employers (see Section 2).
In this work we propose to overcome the problem by estimating the theoretical loss of generated income (TLGI), i.e. the loss of income that households would have experienced if governments had not given any production subsidies to employers in the context of the COVID-19 lockdowns.
Assuming that any year-over-year change of subsidies on production was due to COVID-19-related support measures, TLGI can be computed as follows.
(3)
Where
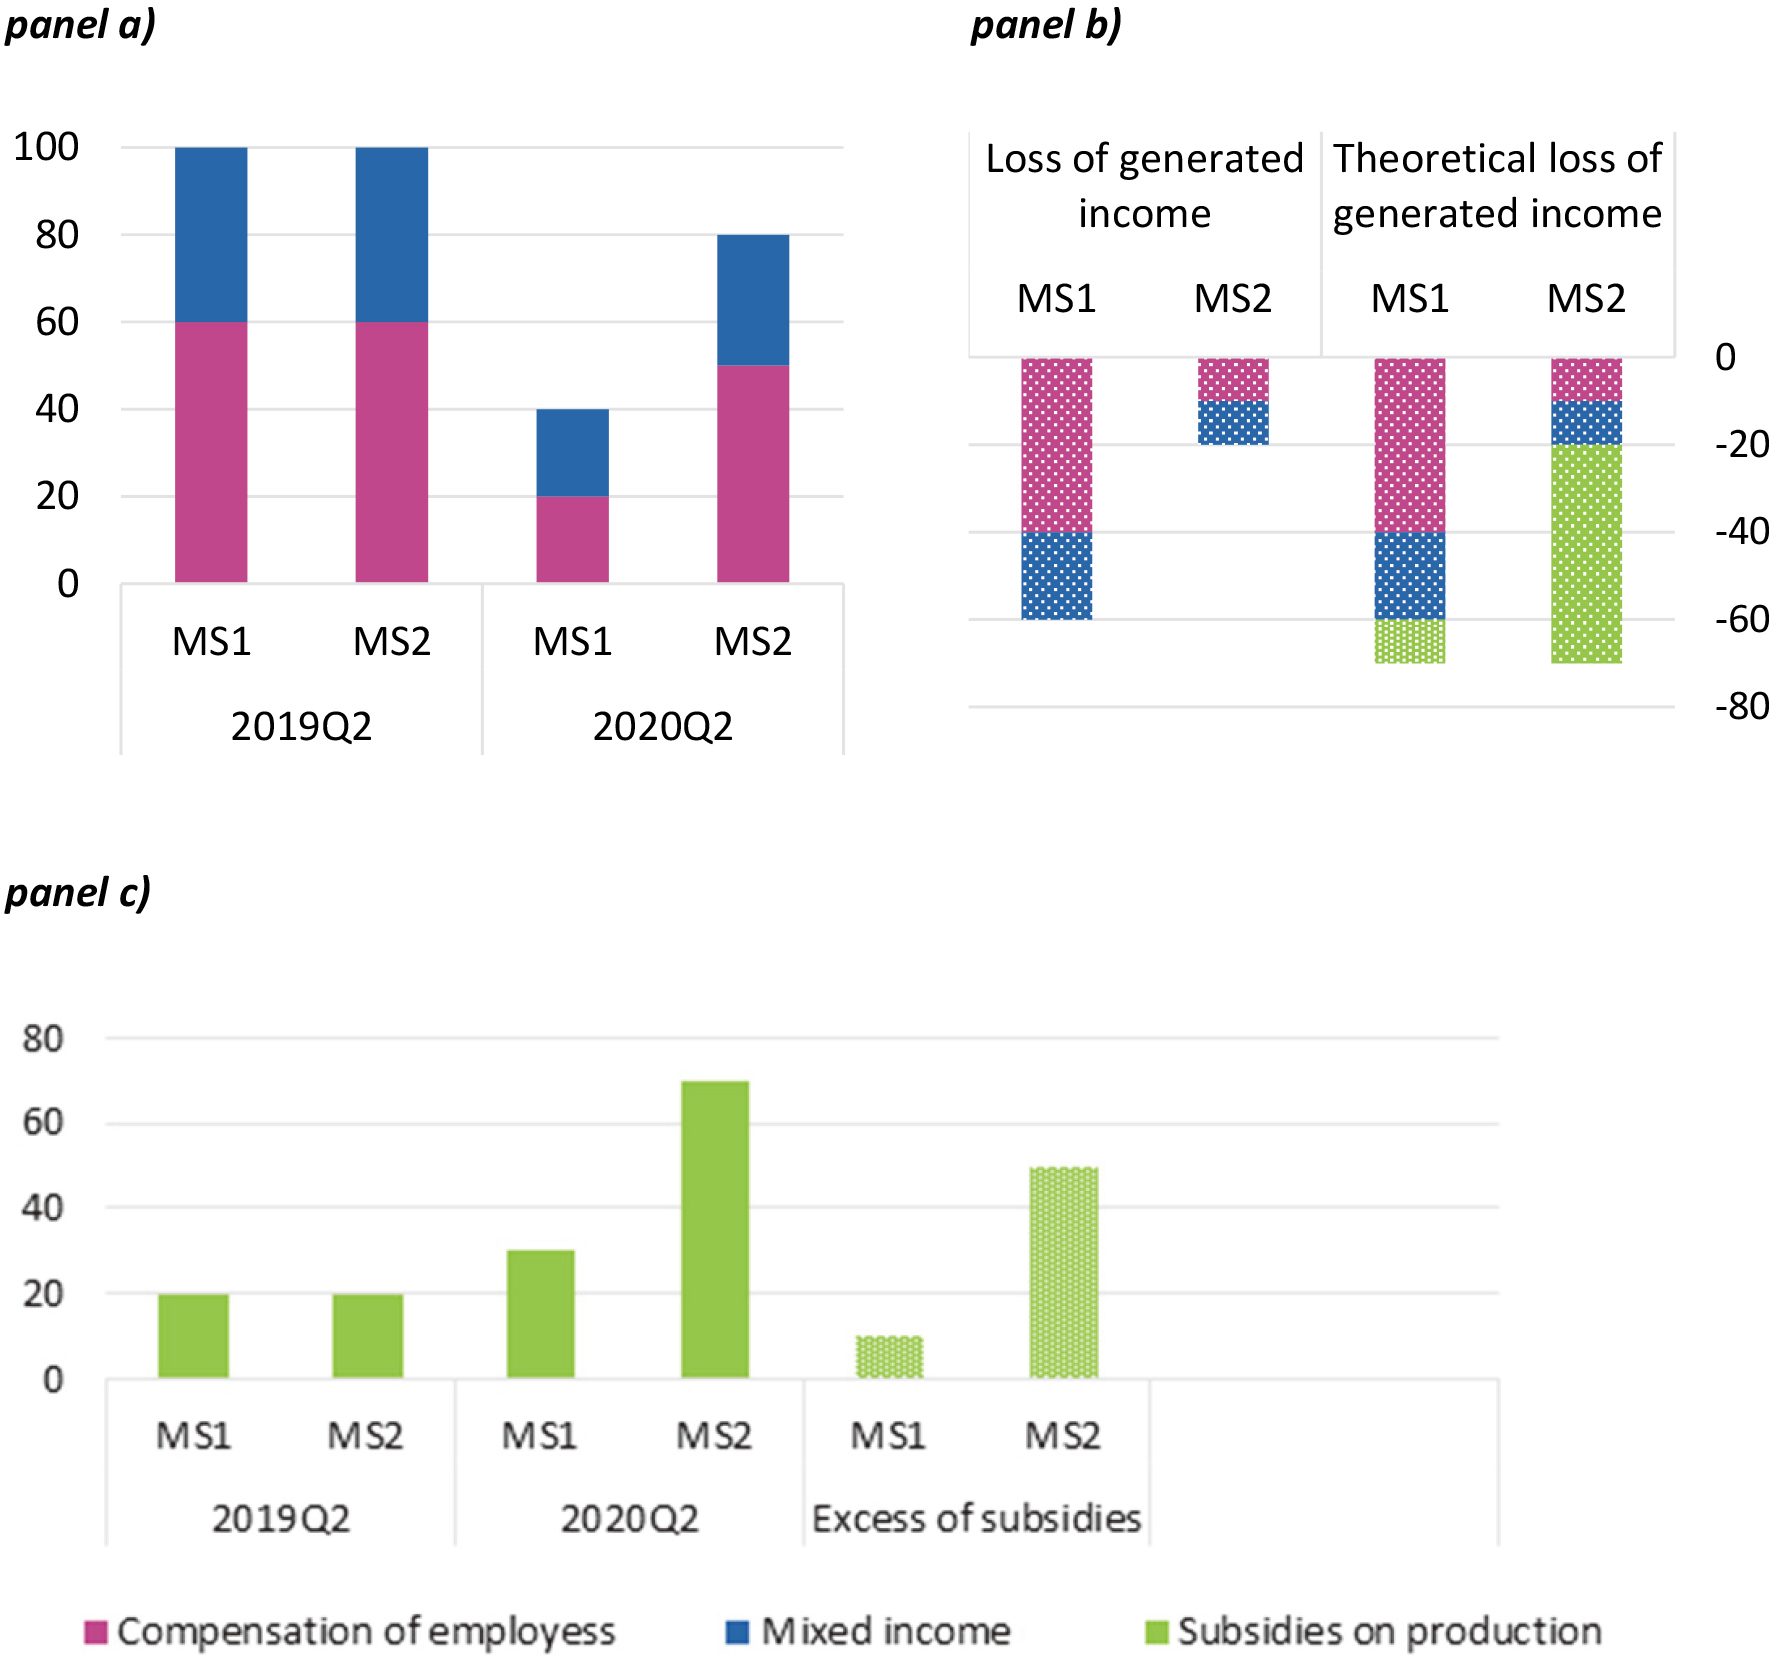
Figure 2 illustrates an example of how TLGI is computed based on the change in compensation of employees, gross mixed income and subsidies on production. We consider two countries MS1 and MS2 with the same generated income in the second quarter of 2019 (panel
Figure 2.
Example of the calculation of the theoretical loss of generated income of households.
3.Results
The analysis presented in this section is based on non-seasonally adjusted quarterly sector accounts data, published by Eurostat for the second and third quarter of 2020 [8, vintage April 2022]. The analysis covers 18 countries, namely: Austria, Belgium, Czechia, Denmark, Finland, France, Germany, Greece, Hungary, Ireland, Italy, Netherlands, Norway, Poland, Portugal, Slovenia, Spain and Sweden.
As a first step, we compare the economic impact of lockdowns across countries and in the European Union. To this end, we present TLGI as a percentage of the generated income recorded by the European Union and the selected countries in the second and third quarter of 2019 (Fig. 3).
Figure 3.
Theoretical loss of generated income, second and third quarter of 2020. Notes: TLGI is computed as percentage of the generated income recorded in 2019. Countries are sorted by decreasing values of TLGI (second and third quarters’ average values). Source: Non-seasonally adjusted quarterly sector accounts data, second and third quarter of 2020 [8, vintage April 2022].
![Theoretical loss of generated income, second and third quarter of 2020. Notes: TLGI is computed as percentage of the generated income recorded in 2019. Countries are sorted by decreasing values of TLGI (second and third quarters’ average values). Source: Non-seasonally adjusted quarterly sector accounts data, second and third quarter of 2020 [8, vintage April 2022].](https://content.iospress.com:443/media/sji/2022/38-4/sji-38-4-sji220004/sji-38-sji220004-g003.jpg)
In the second quarter of 2020, the European Union recorded a theoretical loss of generated income equal to 11.2% of the generated income in the same quarter of 2019. The largest drop was recorded by Spain (
Figure 4.
Loss of generated income and theoretical loss of generated income, 2020 second quarter. Notes: The actual and the theoretical losses of generated income, and the change of subsidies on production are expressed as percentages of 2019 generated income. Countries are sorted by decreasing values of LGI. Source: elaboration based on data provided by countries [8, vintage April 2022].
![Loss of generated income and theoretical loss of generated income, 2020 second quarter. Notes: The actual and the theoretical losses of generated income, and the change of subsidies on production are expressed as percentages of 2019 generated income. Countries are sorted by decreasing values of LGI. Source: elaboration based on data provided by countries [8, vintage April 2022].](https://content.iospress.com:443/media/sji/2022/38-4/sji-38-4-sji220004/sji-38-sji220004-g004.jpg)
Figure 5.
Loss of generated income and theoretical loss of generated income, 2020 third quarter. Notes: The actual and the theoretical losses of generated income, and the change of subsidies on production are expressed as percentages of 2019 generated income. Countries are sorted by decreasing values of LGI. Source: elaboration based on data provided by countries [8, vintage April 2022].
![Loss of generated income and theoretical loss of generated income, 2020 third quarter. Notes: The actual and the theoretical losses of generated income, and the change of subsidies on production are expressed as percentages of 2019 generated income. Countries are sorted by decreasing values of LGI. Source: elaboration based on data provided by countries [8, vintage April 2022].](https://content.iospress.com:443/media/sji/2022/38-4/sji-38-4-sji220004/sji-38-sji220004-g005.jpg)
Figure 6.
Contribution of various government measures to covering the theoretical loss of generated income, 2020 second quarter. Notes: Variables are expressed as percentage of the generated income of 2019, second quarter. Countries are sorted by decreasing values of LGI. Source: elaboration based on data provided by countries [8, vintage April 2022].
![Contribution of various government measures to covering the theoretical loss of generated income, 2020 second quarter. Notes: Variables are expressed as percentage of the generated income of 2019, second quarter. Countries are sorted by decreasing values of LGI. Source: elaboration based on data provided by countries [8, vintage April 2022].](https://content.iospress.com:443/media/sji/2022/38-4/sji-38-4-sji220004/sji-38-sji220004-g006.jpg)
Figure 7.
Contribution of components to covering the theoretical loss of generated income, 2020 third quarter. Notes: Variables are expressed as percentage of the generated income of 2019, second quarter. Countries are sorted by decreasing values of LGI. Source: elaboration based on data provided by countries [8, vintage April 2022].
![Contribution of components to covering the theoretical loss of generated income, 2020 third quarter. Notes: Variables are expressed as percentage of the generated income of 2019, second quarter. Countries are sorted by decreasing values of LGI. Source: elaboration based on data provided by countries [8, vintage April 2022].](https://content.iospress.com:443/media/sji/2022/38-4/sji-38-4-sji220004/sji-38-sji220004-g007.jpg)
Figures 4 and 5 illustrate the year-on-year loss of generated income that was actually observed in the second and third quarter of 2020 and the theoretical loss that would have been observed, had the employers not received subsidies to retain their employees on the payroll. This analysis illustrates clearly that is necessary to use TLGI (and not LGI) to compare the economic impact of lockdowns across countries. In fact, countries apparently not suffering significant reductions of generated income experienced indeed significant economic losses, but these were covered by substantial increase in the subsidies on production. This analysis allows also to compare the size of indirect support (see Fig. 1) in mitigating the loss of generated income of households. In Poland and in the Netherlands, the generated income of households increased in both quarters, but this increase would not have been observed if employers had not received subsidies from government. Subsidies on production helped to mitigate the loss of generated income of all the observed countries, with Italy being the only exception, while they played only a marginal role in France and Hungary.
In the third quarter of 2020, the TLGI and year-over-year increases of subsidies on production were much more limited. In the case of Poland, Netherlands, Austria, Slovenia, and Hungary the increase of subsidies on production led to an increase of generated income.
The following graphs extend the analysis to direct support measures, i.e. social benefits or transfers. In this regard, it is worth reminding that quarterly sector accounts record government measures in much more aggregated categories compared to the ones described in Section 2. This is due to the fact that the ESA 2010 transmission programme for quarterly sector accounts [15] requires a reduced set of items compared to annual accounts and some of them only on a voluntary basis. In particular, ‘social assistance benefits in cash’ are not required separately, while ‘miscellaneous current transfers’ and ‘other capital transfers’ are requested only on a voluntary basis. Consequently, in this analysis, we could only consider more aggregated items, namely: ‘social benefits other than social transfers in kind’, ‘other current transfers’ and ‘capital transfers’ (see the Appendix for ESA 2010 definitions).
The analysis is based on the assumption that any year-over-year increase in net ‘social benefits other than social transfers in kind’, ‘other current transfers’ and ‘capital transfers’ of households was due to support measures implemented to mitigate the economic impact of the COVID-19 pandemic.
Figures 6 and 7 present the contribution of the various government support measures to covering the theoretical loss of generated income of households. When the measures put in place by governments do not fully cover the theoretical loss of households’ generated income, the stacked bars do not reach the line of the TLGI. In some cases, the stacked bars exceed the line of the TLGI, and this indicates that the government measures even exceeded the actual loss of income.
According to our analysis, in the second quarter of 2020 (Fig. 6), in 10 countries out of the 18 included in the analysis, the support schemes implemented by the general government were able to cover the TLGI. Poland and Norway were the countries where the size of support measures was the highest with respect to TLGI. In both cases, the support schemes covered around twice the theoretical loss of generated income. In 10 countries (Austria, Denmark, Finland, Germany, Greece, Netherlands, Poland, Portugal, Slovenia and Sweden), subsidies on production represented the main support measure in favor of households; either by supporting their employment through subsidies to their employers or by directly subsidizing households in their capacity as producers. On the opposite side, in 8 countries (Belgium, Czechia France, Hungary, Ireland, Italy, Norway, and Spain), the households’ loss of income was mainly compensated by social benefits. In the case of Czechia, the remarkable increase of capital transfers is explained by the direct support given to self-employed and private entities and by compensation to hotels [9]. In the European Union and the Euro area, social benefits was the dominant scheme. Finally, it is worth noting that only a few countries put in place measures that were recorded as current and capital transfers.
In the third quarter of 2020 (Fig. 7), Ireland was the country that provided the greatest support. In all cases but three (Greece, Portugal and Spain), the support was higher than the theoretical loss of generated income. In the third quarter, the year-on-year increase of social benefits was much higher than the increase of subsidies. In the European Union, the increase of social benefits was equal to the 2.65% of the generated income of the same quarter of the previous year, while it was only 1.39% for the subsidies on production.
Five countries (Greece, Netherlands, Poland, Portugal and Sweden) continued to support households mainly through subsidies on productions. By contrast, Austria, Denmark, Finland, and Germany joined Italy, France, Belgium, the Czech Republic, Norway and Spain in providing support mainly through social benefits. While support through capital transfers decreased, support through current transfers increased. In the case of Slovenia, current transfers became the main type of government support to households.
4.Discussion and conclusions
Since the early months of 2020, European governments have been taking a wide range of economic measures in response to the economic fallout caused by the COVID-19 outbreak. In response to a request of information for monitoring the economy, the scientific community has sought to detect proper data sources to estimate the size of the implemented support policies, evaluate their appropriateness, and make reasonable comparisons across countries. In this work, we argue that quarterly sector accounts published by Eurostat represent a fundamental source. Compared to the customised databases developed during COVID-19, quarterly sector accounts are certainly less timely, but they ensure a higher level of international comparability and make it possible to directly link COVID19-related measures with countries’ macroeconomic variables. Unfortunately, they do not show directly the amount of COVID-19 related support measures. However, based on some hypotheses, it is possible to approximate the level of the various measures put in place and assess their adequacy.
Based on information made available by countries, we propose a method to estimate the amount of economic interventions aimed at supporting households and assess their appropriateness to evaluate income loss caused by restrictions related to COVID-19. Our ultimate objective is to compare the size and appropriateness of government support measures across European countries. The analysis covers the second and third quarters of 2020 and it is based on two fundamental assumptions. The first is that the decline of household’ generated income recorded in 2020 second and third quarters is entirely due to the economic crisis triggered by the COVID-19-related containment measures. The second assumption is that any year-over-year increase of subsidies on production, social benefits, current and capital transfers of households is due to measures implemented to answer the economic loss due to COVID-19 containment measures.
Support measures designed and implemented across the European Union varied from country to country. A same objective (e.g. relief for short term work) was sometimes pursued by schemes with national peculiarities, with a different recording in quarterly sector accounts. One relevant consequence of these differences is that the loss of household’s generated income cannot be used as an indicator of the economic impact due COVID-19. The methodology proposed in this paper tries to overcome comparative problems due to the presence of different schemes and their national specificities.
The main limitation of this analysis is that the underlying assumptions allow only an approximate measurement of the various support measures and this approximation is also inherited into the results. These approximations are inevitable, as the macro nature of the data does not allow to identify the exact level of resources dedicated to COVID-19 economic interventions. However, this approximation is in our opinion more than balanced by the high level of international harmonization of national accounts data. Furthermore, despite the advent of the pandemic, almost all countries included in the analysis managed to maintain a good level of data quality, ensuring the robustness of cross-country comparability.
The analysis shows that countries were affected differently by the economic fallout that followed COVID-19 restriction measures and that governments reacted with support measures that varied both in nature and size. These results could form the basis for assessing the medium- and long-term impact of those governmental interventions onto the economy of European countries and in the European Union as a whole. Furthermore, it would be interestingly to combine these results with information stemming from official statistics micro-data, in order to have more details on governments interventions and their impact on household income consumption and wealth.
Acknowledgments
The authors would like to thank the anonymous reviewers for their valuables comments and suggestions.
Disclaimer
The information and views set out in this article are those of the authors and do not necessarily reflect the official opinion of the European Commission.
References
[1] | Atalan A. Is the lockdown important to prevent the COVID-19 pandemic? Effects on psychology, environment and economy-perspective. Annals of Medicine and Surgery. Elsevier. (2020) ; 56: : 38–42. |
[2] | Hien L, Khosrawipour V, Kocbach P, Mikolajczyk A, Schubert J, Bania J, Khosrawipour T. The positive impact of lockdown in Wuhan on containing the COVID-19 outbreak in China. Journal of Travel Medicine. April (2020) ; 27: (Issue 3). |
[3] | Deb P, Furceri D, Ostry JD, Tawk N. The Economic Effects of Covid-19 Containment Measures, CEPR Discussion Paper No. DP15087, July (2020) . |
[4] | OECD. Evaluating the initial impact of COVID-19 containment measures on economic activity Tackling Coronavirus (COVID-19), contributing to a global effort, June 2020, http://www.oecd.org/coronavirus/, Accessed on April 2021. |
[5] | Hale T, Angrist N, Cameron-Blake E, Hallas L, Kira B, Majumdar S, Petherick A, Phillips T, Tatlow H, Webster S. Variation in Government Responses to COVID-19, Version 7.0. Blavatnik School of Government Working Paper. May 25, (2020) . www.bsg.ox.ac.uk/covidtracker. |
[6] | Ashraf BN. Economic impact of government interventions during the COVID-19 pandemic: International evidence from financial markets. Journal of Behavioral and Experimental Finance. Elsevier, (2020) ; 27: . doi: 10.1016/j.jbef.2020.100371. |
[7] | Chen S, Igan D, Pierri N, Presbitero AF. Tracking the economic impact of COVID-19 and mitigation policies in Europe and the United States, IMF working paper, WP/20/125, July (2020) . |
[8] | Eurostat, Quarterly sector accounts (ESA 2010) – Non-financial transactions. Online database, accessed on 2022.https://ec.europa.eu/eurostat/databrowser/view/nasq_10_nf_tr/default/table?lang=en. |
[9] | Eurostat, Country specific metadata related to published quarterly sector accounts. https://ec.europa.eu/eurostat/documents/499359/499434/NFSA+country+specific+metadata. Accessed May 2022. |
[10] | United Nations, European Commission, International monetary fund, Organization for economic Co-operation and Development, and World Bank, System of National Accounts 2008. New York, (2009) . |
[11] | Eurostat. European System of Accounts, Luxembourg, (2013) . https://ec.europa.eu/eurostat/documents/3859598/5925693/KS-02-13-269-EN.PDF/44cd9d01-bc64-40e5-bd40-d17df0c69334. |
[12] | Eurostat. Guidance on quarterly sector accounts, Eurostat, Luxembourg, June (2020) . https://ec.europa.eu/eurostat/documents/10186/10693286/QSA_guidance.pdf. |
[13] | ECFIN. Directorate General for economic and financial affairs of the European Commission. Policy measures taken against the spread and impact of the coronavirus, February (2021) . https://ec.europa.eu/info/files/policy-measures-against-spread-coronavirus_en. |
[14] | Panizo Espuelaz A. Sector accounts during the pandemic: did it mean larger revisions? How government measures were recorded across the EU, conference paper, IAOS 2022 conference, 26–28 April, Kraków, Poland. |
[15] | Eurostat European System of Accounts (ESA 2010), Transmission Programme of data, (2014) . https://ec.europa.eu/eurostat/documents/3859598/5936561/KS-01-13-429-3A-C-EN.PDF.pdf/69e7e68c-661d-44dc-bef3-d0e560403722?t=1414782972000. |
Appendices
Appendix
This Appendix reports the definitions of the national accounts items used in the analysis, taken from ESA 2010 (Eurostat, 2013). In bracket, the identification code is shown.
Capital transfers (D.9)
§4.145 Definition: capital transfers require the acquisition or disposal of an asset, or assets, by at least one of the parties to the transaction. Whether made in cash or in kind, they result in a commensurate change in the financial, or non-financial, assets shown in the balance sheets of one or both parties to the transaction.
§4.147 Capital transfers include capital taxes (D.91), investment grants (D.92) and other capital transfers (D.99).
Compensation of employees (D.1)
§4.02 Definition: Compensation of employees is defined as the total remuneration, in cash or in kind, payable by an employer to an employee in return for work done by the latter during an accounting period.
Mixed income (B3)
§8.19 In the case of unincorporated enterprises in the households sector, the balancing item of the generation of income account implicitly contains an element corresponding to remuneration for work carried out by the owner or members of the family. This income from self-employment has characteristics of wages and salaries, and characteristics of profit due to work carried out as an entrepreneur. This income, neither strictly wages nor profits alone, is referred to as ‘mixed income’.
Miscellaneous current transfers (D.75)
Miscellaneous current transfers include different typologies of transfers: Current transfers to NPIHs (D.751), current transfers between households (D.752) and other miscellaneous current transfers (D.759).
Other capital transfers (D.99)
§4.164 Definition: Other capital transfers cover transfers other than investment grants and capital taxes which do not themselves redistribute income but redistribute saving or wealth among the different sectors or subsectors of the economy or the rest of the world. They can
be made in cash or kind (cases of debt assumption or debt cancellation) and correspond to voluntary transfers of wealth.
Other current transfers (D.7)
Other current transfers are a heterogeneous category that includes:
• Net non-life insurance premiums (D.71)
• Non-life insurance claims (D.72)
• Current transfers within general government (D.73)
• Current international cooperation (D.74)
• Miscellaneous current transfers (D.75)
The description of each sub-item is reported in paragraphs 4.112–4.139.
Other subsidies on production (D.39)
§4.36 Other subsidies on production consist of subsidies except subsidies on products which resident producer units may receive as a consequence of engaging in production.
Social benefits other than social transfers in kind (D.62)
§4.102 The heading D.62 is made up of three sub-headings:
• social security benefits in cash (D.621);
• other social insurance benefits (D.622);
• social assistance benefits in cash (D.623)
Social assistance benefits in cash (D.623)
§4.103 Definition: social security benefits in cash are social insurance benefits payable in cash to households by social security funds. Reimbursements are excluded and treated as social transfers in kind (D.632).


