
The 50x2030 Initiative and production of SDG 2 indicators: Country challenges and experiences
Abstract
An important objective of the 50x2030 Initiative to Close the Agricultural Data Gap is to empower partner countries’ statistical systems for evidence-based decision-making, especially to achieve Sustainable Development Goal (SDG) 2. The reference survey instruments of the Initiative allow the monitoring of SDG 2, particularly through indicators 2.3.1, 2.3.2 and 2.4.1. As the lead agency of the Initiative’s Data Production component, FAO assists countries in collecting the required data.
The paper discusses the experiences, challenges and solutions encountered in the partner countries engaged in the 50x2030 Initiative and one of its preceding survey programs, the AGRISurvey Programme – namely Cambodia, Ecuador, Georgia, Indonesia, Nepal, Senegal, and Uganda. The experiences encompass data collection and the computation and dissemination of the Indicators.

1.Introduction
A key objective of the 50x2030 Initiative to Close the Agricultural Data Gap (Initiative) is to empower beneficiary countries’ agricultural statistics systems for evidence-informed decision-making, especially to achieve Sustainable Development Goal (SDG) 2 (End hunger, achieve food security and improved nutrition, and promote sustainable agriculture) [1]. Three high-priority SDG indicators for the Initiative are associated to:
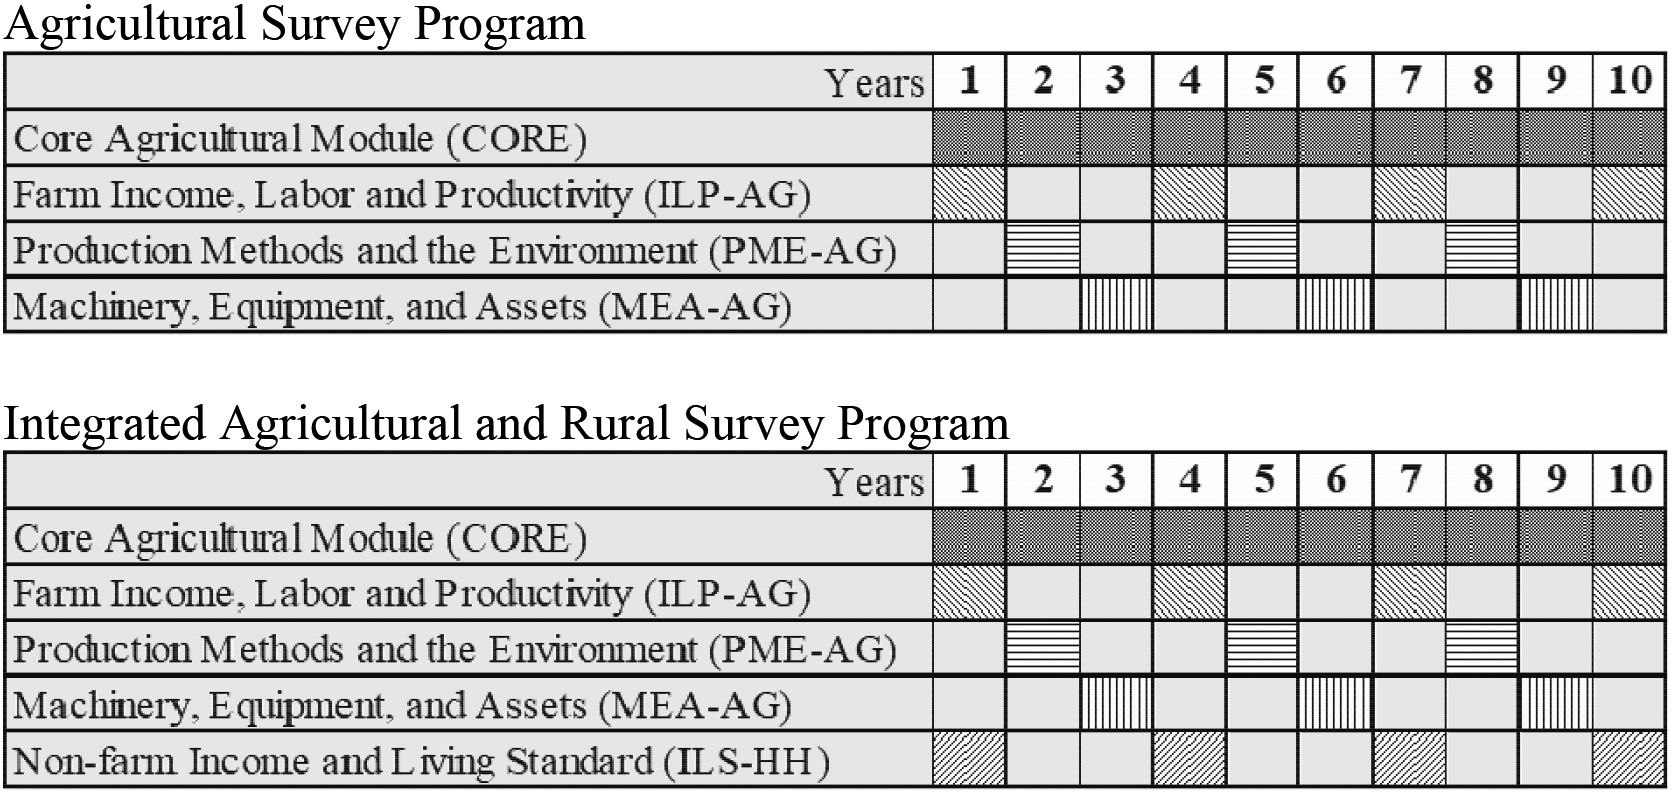
Figure 1.
Schemas of the 50x2030 Initiative programs.
2.3.1 – Volume of production per labor unit by classes of farming/pastoral/forestry enterprise size; 2.3.2 – Average income of small-scale food producers, by sex and indigenous status; and 2.4.1 – Proportion of agricultural area under productive and sustainable agriculture.
In addition, the 50x2030 Initiative promotes other SDG Indicators, including SDG 5.a.1.a (Percentage of people with ownership or secure rights over agricultural land out of total agricultural population), SDG 5.a.1.b (Share of women among owners or rights-bearers of agricultural land, by type of tenure) [2] and SDG 2.1.2 (Prevalence of moderate or severe food insecurity in the population, based on the Food Insecurity Experience Scale). Agricultural surveys need to be carefully designed to ensure these Indicators are well covered; moreover, some of the Initiative’s target Indicators (including SDG 2.1.2) require the coverage of non-agricultural households. Accordingly, the 50x2030 Initiative proposes that countries undertake two integrated survey programs:
• Agricultural Survey Programme: covering both household and non-household farms and integrating agricultural production data and economic and environmental data. Through a modular approach, it covers various topics including production costs, agricultural income, labor and productivity, gender decision-making in agriculture, production practices, and environmental aspects of farming. This survey program allows the production of SDG indicators 2.3.1, 2.3.2, 2.4.1., and 5.a.1.
• Integrated Agricultural and Rural Survey Programme: this includes all the features of the Agricultural Survey Programme while incorporating a household survey tool and broadening the target population with a sample of rural non-agricultural households. It provides information on household non-farm income and living standards, allowing comprehensive analysis of rural development. This also contributes to the calculation of additional SDG Indicators, including SDG 2.1.2. (see Fig. 1)
The standard survey system developed for the 50x2030 Initiative [3, 4] was built on the experience of FAO’s Agricultural Integrated Surveys Programme (AGRISurvey) [5] and the World Bank’s Living Standards Measurement Study – Integrated Surveys on Agriculture (LSMS-ISA) program [6]. With the AGRISurvey activity providing technical assistance and survey funding during the last several years, these experiences provided useful information for the development of the 50x2030 Initiative and its implementation in many ways.
Since 2018, through the AGRISurvey programme, FAO has worked with countries to build their capacity to implement high-quality, cost-efficient survey systems to generate critical data to help them better understand their agricultural sectors. With funding from USAID and the Bill & Melinda Gates Foundation, a number of country projects have been conducted. The projects’ central aim was to promote the implementation of the Agricultural Integrated Survey (AGRIS) [7].
AGRIS is a multipurpose, modular, and integrated survey program with a ten-year cycle to collect information on key aspects of the agriculture sector for policy and decision-making, covering socio-economic, technical, and environmental aspects of the agricultural holding, developed by the Global Strategy to improve Agricultural and Rural Statistics [8]. Besides the systematic production of a broad range of official agricultural statistics in a cost-effective way, AGRIS also aims to ensure the production of SDG indicators based on agricultural surveys.
Table 1
Overview of the 50x2030 Initiative integrated questionnaires and the coverage of SDG indicators
| Questionnaires | Description | SDG Indicator | Frequency |
|---|---|---|---|
| Core Agricultural Questionnaire (Core) | Covers the major components of agricultural production (crop, livestock, aquaculture, fishery, and forestry production). | Annual | |
| Farm Income, Labor, and Productivity Questionnaire (ILP) | Includes questions of the core questionnaire plus land tenure; agricultural production costs; agricultural income; labor; and gender differentials in decision-making, productivity, and management. | 2.3.1 | |
| 2.3.2 | |||
| 5.a.1 | |||
| 1.4.2 | |||
| 2.4.1 (economic and social-Sub-indicators excluding FIES Sub-Indicator) | Every 3 years | ||
| Non-Farm Income and Living Standards Household Questionnaire (ILS-HH) | Light, multi-topic household questionnaire capturing information on the household and its members, including education, labor and time use, housing conditions, shocks and coping, household enterprises, and other household income. | 5.a.1 | |
| 2.1.2 | |||
| 1.4.2 | |||
| 2.4.1 (FIES Sub-indicators) | Every 3 years | ||
| Production Methods and Environment (PME) | Includes questions of the core questionnaire plus focuses on agricultural production methods and their environmental, social, and economic sustainability, as well as agricultural investments, marketing, and storage. | 2.4.1 (environmental Sub-indicators) | Every 3 years |
| Agricultural Machinery and Equipment (MEA): | Includes questions of the core questionnaire plus captures information about the use of assets, machinery, and equipment in the agricultural sector. | Every 3–5 years |
This paper discusses the experience of producing the SDG Indicators 2.3.1, 2.3.2, and 2.4.1 in seven FAO partner countries: Cambodia, Ecuador, Indonesia, Georgia, Nepal, Senegal, and Uganda. The paper does not aim to replace the methodological notes or the e-learning material developed by FAO in its capacity as custodian agency. Rather, it aims to complement the official theoretical guidance with the practical experience of national statistical agencies in low and lower-middle-income countries. In particular, this paper emphasises the most critical expansions that statistical agencies are called to make in order to collect the full range of data required by these indicators. The production of the above-mentioned indicators demands expansions that have a substantial impact on the measures and imply important changes to the agricultural surveys – e.g., expansion of the survey coverage and scope, the introduction of specifically-tailored questions, and determining the frequency of data collection. The experience of FAO partner countries revealed that sometimes it is necessary to leverage other data sources in order to acquire some elements needed to compute the Indicators, like, for instance, the prices of some agricultural inputs. It is very difficult to prepare a complete and exhaustive questionnaire that contains all the Indicators’ data-components. The review of challenges and solutions faced by FAO partner countries to compute SDG 2 Indicators may contribute to a successful implementation in other countries and to future methodological guidance and recommendations. Therefore, this review is conducted with the intention of raising the awareness of survey designers working in statistical offices and ensuring that the right choices are discussed and addressed at the proper time in the survey process.
Following this introduction, the second section of this paper presents the recommendations regarding the use of the agricultural integrated surveys as a source of information for computing SDG 2 Indicators. The third section highlights the main challenges and solutions observed in the countries mentioned above, including the collection of the required data and the computation and dissemination of the Indicators. General remarks, conclusions, and recommendations are summarized in the fourth section.
2.Integrated survey programmes as a source for computing SDG 2 Indicators: Recommendations
2.1Agricultural Integrated Surveys as a source for SDG 2
The 50x2030 survey system, similar to the AGRIS methodology, was designed following the modular approach: an annual core questionnaire focused on crop, livestock, aquaculture, fishery, and forestry production, and a set of specialized rotating questionnaires covering topics such as costs and farm income, labor and productivity, gender decision-making in agriculture, and production practices and environmental aspects of farming. Table 1 presents an overview of the integrated questionnaires and the coverage of SDG indicators.
The sequence of modules determines the frequency and order of the production of the Indicators, as can be deduced from Table 1 and Fig. 1. Since the standard system has a three-year cycle, the complete set of the three Indicators are produced every three years. SDG Indicators 2.3.1 and 2.3.2 are produced in the first year of the cycle, while Indicator 2.4.1 is produced after the first two years of each cycle, according to distribution of its sub-Indicators shown in Table 2. Computation of the SDG Indicators 2.3.1, 2.3.2, and 2.4.1 presupposes a dataset of agricultural holdings with comprehensive coverage of the agricultural activities of the country. This is crucial for determining the thresholds for the definition of the range of smallholder units in the case of SDG 2.3.1 and 2.3.2 and for producing reliable estimates of labor productivity, average income, and the country agricultural area in the context of SDG 2.4.1.
Table 2
Production of the SDG 2.4.1. Sub-indicators through the 50x2030 Initiative Integrated questionnaires
| Year t | Year t |
|---|---|
| ILP | PME questionnaire |
| SDG 2.4.1 Economic Sub-indicators:1. Farm output value per hectare (ILP) | |
| 2. Net farm income (ILP) | |
| 3. Risk mitigation mechanisms (ILP) | SDG 2.4.1 Environmental Sub-indicators:4. Prevalence of soil degradation (PME) |
| 5. Variation in water availability (PME) | |
| 6. Management of fertilizers (PME) | |
| 7. Management of pesticides (PME) | |
| 8. Use of agrobiodiversity-supportive practices (PME) | |
| SDG 2.4.1 Social Sub-indicators:9. Wage rate in agriculture (ILP) | |
| 10. FIES (ILS or PME) | |
| 11. Secure tenure rights to land (ILP) |
The integrated survey approach involves the development and use of a Master Sampling Frame (MSF) and a sampling design that ensures completeness of a country’s agricultural activity, targeting all agricultural production units (i.e., agricultural households and corporate producers) and covering all crop and livestock activities. The use of multiple frames is also recommended, usually consisting of an area frame and/or list frame for the household sector and a list frame for the non-household sector or special farms. Section 3.2 includes details on the sampling frames used by the analyzed countries for the surveys utilized to produce the Indicators. Using a single statistical survey system ensures consistency in data collection, in terms of concepts, reference period, and information completeness.
Another central aspect of the integrated survey approach is the expansion of the survey scope. In general, agricultural surveys are focused on strictly agricultural data, such as cultivation area, yield, and crop production, and animal numbers. Taking advantage of the modular approach, the integrated system goes far beyond traditional agricultural statistics, collecting data related to multiple aspects associated with agriculture and allowing for the inclusion of aquaculture, fishing and forestry activities of the agricultural holdings. It seeks to reconcile more lengthy questionnaires with data quality, minimising respondent burden and ensuring the production of detailed data, as the SDGs require.
2.2SDG 2 computation requirements
Indicators 2.3.1, 2.3.2 and 2.4.1 are the outputs of computational processes that follow refined methodologies, which also include common elements, such as the need to identify the small-scale food producers (SDG 2.3.1; SDG 2.3.2), calculate their volume of production and their agricultural land area (SDG 2.3.1; SDG 2.3.2; 2.4.1) and production costs (SDG 2.3.2; 2.4.1) [9, 10].
SDG Indicator 2.3.1 measures the agricultural labor productivity, i.e., the agricultural volume of production per labor input, whereas the SDG Indicator 2.3.2. measures the average income of small-scale food producers, where income refers to:
The formulas of the above-mentioned Indicators are the following:
where
Table 3
Components required to calculate SDG 2 Indicators and their relative level of accessibility (E: Easy; M: Medium; D: Difficult)
| Component | SDG 2.3.1 | SDG 2.3.2 | SDG 2.4.1. | Accessibility |
|---|---|---|---|---|
| Agricultural land area (indicator specific) | Y | Y | Y | E |
| Number of animals | Y | Y | Y | E |
| Livestock stock variation | N | Y | Y | E |
| Crop revenues | Y | Y | Y | E |
| Livestock revenues | Y | Y | Y | E |
| Aquaculture revenues | Y | Y | Y | E |
| Fishery revenues | Y | Y | Y | E |
| Forestry revenues | Y | Y | Y | M |
| Cost of crop activities | Y | Y | Y | M |
| Cost of livestock activities | Y | Y | Y | M |
| Cost of aquaculture activities | Y | Y | Y | M |
| Cost of fishery activities | Y | Y | Y | M |
| Cost of forestry activities | Y | Y | Y | D |
| Prices of the agricultural products | Y | Y | Y | M |
| Labor inputs | Y | N | N | M |
| External workers labor cost | N | Y | Y | M |
| Cost of land rent | N | Y | Y | M |
| Agricultural holding’s profitability over the last 3 calendar years | N | N | Y | E |
| Access to or availed credit/insurance | N | N | Y | E |
| List of soil degradation threats and land area affected by these threats | N | N | Y | E |
| Irrigated agricultural land area | N | N | Y | E |
| Reduction in water availability experienced by the holding | N | N | Y | E |
| Existence of organizations dealing with water allocation | N | N | Y | E |
| Management measures to reduce risks caused by the use of fertilizers | N | N | Y | E |
| Management measures to reduce risks caused by the use of pesticides | N | N | Y | M |
| Entire area of the farm | N | N | Y | E |
| Practices for biodiversity conservation | N | N | Y | D |
| Wage and number of unskilled workers hired | N | N | Y | M |
| Holding experience of food insecurity | N | N | Y | E |
| Rights to sell or bequeath any of the parcel of the holding, formal document | N | N | Y | E |
| of ownership. |
Source: Authors’ elaboration.
The agricultural activities considered are crop land farming, fishing capture, aquaculture, livestock farming and forestry activities, whereas the agricultural land is that under operation, including the area cultivated by the agricultural holdings (regardless of land ownership) with temporary and permanent crops, aquaculture land and temporary pasture, land rented in and fallow land. It excludes land that is rented out, forestland and land that had been abandoned prior to the reference period. Moreover, – all values in local currency units need to be converted in Purchasing Power Parity Dollars (PPP $) for countries comparison purposes.
The SDG indicator 2.4.1 for the year
where the denominator includes the area under temporary and permanent crops, meadows, pastures, fallow land and other land used for agriculture, plus forest and other wooded land and areas dedicated to aquaculture. The focus of this Indicator is those holdings whose primary activities are crop cultivation and/or livestock grazing. Holdings that have other activities as their primary focus are excluded from the calculation. The value of Indicator 2.4.1. is calculated by aggregating the results of each of the 11 sub-indicators, that measure sustainability in different areas. They are: 1. Farm output value per hectare; 2. Net Farm Income; 3. Risk mitigation mechanisms; 4. Prevalence of soil degradation; 5. Variation in water availability; 6. Management of fertilizers; 7. Management of pesticides; 8. Use of agrobiodiversity-supportive practices; 9. Wage rate in agriculture; 10. Food Insecurity Experience Scale (FIES); and 11. Secure tenure rights to land.
Table 3 shows the components required to calculate each Indicator and the level of accessibility of that information through the agricultural surveys, as evaluated from different countries’ experiences.
2.3SDG 2 sampling requirements
Sampling procedures should be carefully considered in the design of integrated surveys to ensure the reliable measurement of SDG 2 Indicators. Accordingly, the 50x2030 Initiative proposes an integrated sampling design to fulfil the measurement objectives of the Integrated Agricultural and Rural Survey Program [11]. Specific sampling requirements for SDG 2 Indicators are highlighted below.
The sampling frame should adequately cover both the agricultural sector and the household sector (in order to satisfy the requirements of some Indicators). The use of a multiple frame would be necessary to fulfil the following requirements:
• Coverage of the agriculture sector: the sampling frame should cover all agricultural holdings in both the household and non-household sectors. This is important, in general, for the production of reliable estimates of many agricultural aggregates and particularly of Indicators like SDG 2.3.1, 2.3.2 and 2.4.1, which requires data from non-household farms. In the event that parcels need to be sampled, it is also necessary to ensure the coverage of all parcels used by agricultural holdings (not only for crops) for the measurement of SDG 2.4.1.
• Coverage of the household sector: agricultural surveys in the household sector typically cover only agricultural households, which is adequate for calculating the priority SDG 2 Indicators (2.3.1, 2.3.2 and 2.4.1). However, the measurement of some Indicators of interest, such as SDG 2.1.2 and 1.4.2, requires the coverage of non-agricultural rural households.
The sample size should be large enough to ensure reliable estimations of the target SDG Indicators. The sample size calculation procedures based on the measure of statistical dispersion (coefficient of variation or standard error) of a key variable of interest in the population is preferable. Target variables correlated to the various SDG 2 Indicators should be considered. For integrated surveys, agricultural land or value of production and household income or consumption is adequate. The 50x2030 Initiative discusses the calculation of an integrated sample size suitable for both agriculture and household-related indicators [11].
Stratification is an important operation for improving the precision of estimates. Since strata are Indicator-specific, the choice of stratification criteria suitable for the various SDG Indicators is important, so as to avoid having too many strata, which can be problematic. In multistage sampling, stratification of primary sampling units (PSUs) should be carefully performed, not only for improved estimates but for suitable coverage of sub-populations for reporting purposes. Criteria based on the structure of households in PSUs e.g., by practice of agriculture, could be helpful [11]. For the specific case of SDG 2.4.1, additional criteria suitable for the various sub-indicators could be considered, including the type of activity (crops, livestock and mixed holdings), irrigation (irrigated/non-irrigated holdings) or soil fertility-based criteria [12].
SDG 2 Indicators are expected to be reported at the national level. To reduce respondent burden and related measurement errors, the questionnaires of the specific modules designed for the SDG can be administered only to a subsample. Subsampling would also be cost-effective for objective measurements, e.g., plot land measurement using GPS or yield estimation with crop cutting operations.
Moreover, following the principle of “leaving no one behind,” SDG indicators are supposed to be disaggregated, where relevant, by income, sex, age, race, ethnicity, migratory status, disability and geographic location, or other characteristics. The sampling design should allow, as much as possible, the observation of sampling units for every sub-population for which disaggregated data must be produced. Sampling procedures for disaggregated SDG Indicators are discussed in [13].
For a sustainable measurement of SDG Indicators, sampling procedures over time should consider the frequency of SDG reporting, sample obsolescence over time, the cost of updating samples over time and the requirement of estimating changes in the Indicators for performance assessment. The 50x2030 Initiative recommends either panel or partial rotation sampling over time as cost-effective sampling approaches for computing SDG 2 Indicators [14].
Table 4
SDG 2 Indicators addressed by statistical operations (survey rounds and pilot tests), selected countries
| Country | Statistical operation | SDG 2 Indicators addressed |
|---|---|---|
| Cambodia | CIAS 2019 | SDG 2.3.1 |
| CAS 2020 | SDG 2.3.1, SDG 2.4.1 FIES Sub-indicator | |
| CAS 2021 (Pilot test) | SDG 2.4.1 (except FIES Sub-indicator, Environment Sub-indicators) | |
| Ecuador | ESPAC 2019 | SDG 2.3.1, SDG 2.3.2, SDG 2.4.1 |
| ESPAC 2020 | SDG 2.3.1, SDG 2.3.2, SDG 2.4.1 | |
| Georgia | SAH 2019 | test SDG 2.3.1, SDG 2.3.2 |
| SAH 2020 | SDG 2.3.1, SDG 2.3.3 | |
| SAH 2021 | SDG 2.4.1 (except FIES Sub-indicator) | |
| Indonesia | AGRIS (2020 Pilot) | SDG 2.3.1, SDG 2.3.2, SDG 2.4.1 |
| Nepal | AIS (2019 Pilot) | SDG 2.3.1, SDG 2.3.2, SDG 2.4.1 (except Biodiversity and Social Sub-indicators) |
| Senegal | EAA 2017/18 | SDG 2.3.1 |
| EAA 2018/19 | SDG 2.3.1, SDG 2.3.2 | |
| Uganda | AAS 2019 | SDG 2.3.1, SDG 2.3.2 |
| UHIS (2021 Pilot) | SDG 2.3.1, SDG 2.3.2 |
Source: Authors elaboration.
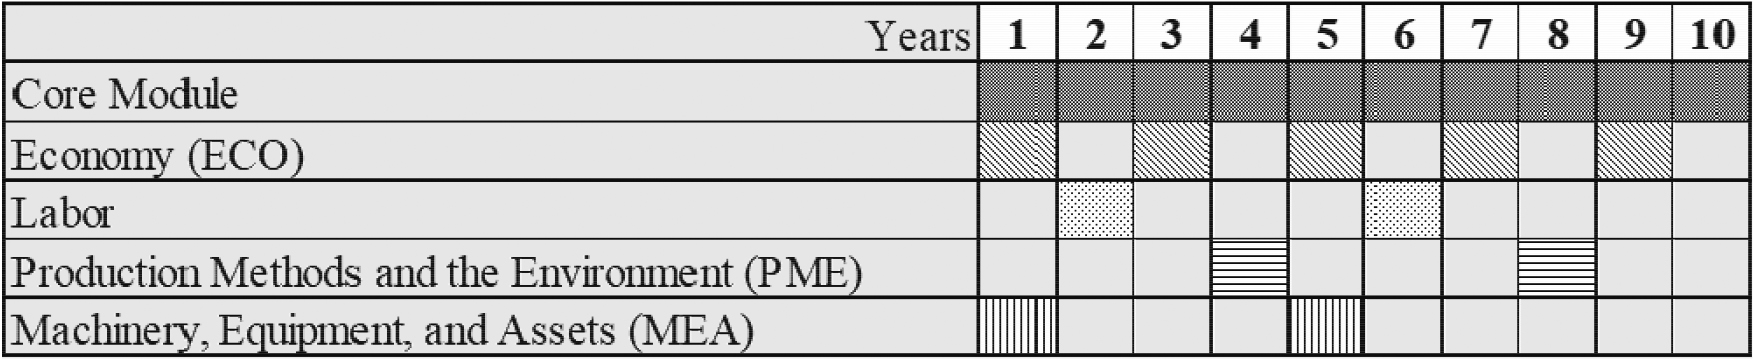
Figure 2.
AGRIS modular architecture (recommended module flow).
3.Producing SDG Indicators using the Agricultural Integrated Survey: Country experiences
As mentioned, the country experiences reported here refer to the production of indicators in the context of the implementation of the AGRISurvey programme. It is important to highlight that the AGRISurvey model is very similar to the Agricultural Survey Program of the 50x2030 Initiative, and both follow the same principles. However, the procedures involved the inclusion of the same Indicator data requirements in the process of customizing the questionnaires. The latter was particularly important in the case of SDG 2.4.1, the definition of which was finalized after the publication of the AGRIS handbook and its instruments of collection.
With four rotating modules, the AGRIS standard integrated schema is very similar to the 50x2030 Agricultural Survey Program but proposes a different recommended module flow (Fig. 2). It is worth noting that, due to the flexible nature of the modular approach, countries can easily modify the proposed setting according to national priorities and adapt it to their existing agricultural surveys. That was the case in the countries considered in this paper, except for Cambodia and Indonesia, which were countries with no regular agricultural survey at the time of program implementation (see Section 3.1).
The country experience discussed in this paper refers mainly to the following full data collection survey and pilot survey test operations: Cambodia Inter-Censal Agriculture Survey (CIAS) 2019, Cambodia Agriculture Survey (CAS) 2020 and CAS 2021 Pilot [15]; Ecuador Encuesta de Superficie y Producción Agropecuaria Continua (ESPAC) 2019 [16]; Georgia Survey of Agricultural Holdings (SAH) 2019, 2020 and 2021 [17]; Indonesia Agricultural Integrated Survey 2021 Pilot test [18]; Nepal Agricultural Integrated Survey 2019 Pilot test [19]; the Enquête Agricole Annuelle (EAA) 2017–2018, 2018–2019 in Senegal [20]; and the Uganda Annual Agricultural Survey (AAS) 2018/19, 2019/20, and 2020/21, and a pilot for the new Uganda Harmonized Integrated Survey Programme (UHIS) carried out under the 50x2030 Initiative in 2021 [21]. Table 4 lists SDG 2 Indicators addressed by each statistical operation mentioned above. In addition, part of the information presented comes from other sources like country briefs released by the AGRISurvey Programme [22], internal notes and reports, and other related publications [23, 24, 25, 26, 27].
Table 5
Estimations of SDG Indicators 2.3.1, 2.3.2 and 2.4 1 for selected countries and regions
| Country | Reference year | SDG 2.3.1 Production per Labor Unit of Small-Scale Food Producers (USD PPP/labor day) | SDG 2.3.2 Average income of Small-Scale Food Producers (USD PPP) | SDG 2.4.1 (1) Agricultural Area under Productive and Sustainable Agriculture (%) |
|---|---|---|---|---|
| Cambodia | 2019 | 9.42 | – | – |
| Ecuador | 2019 | 157.46 | 935.34 | 7.6 |
| Jawa Barat, Jawa Timur and Nusa | 2020 | 36.30 | 641.97 | 10.3 |
| Tengara Barat – Indonesia | ||||
| Jawa Barat, Indonesia | 2020 | 43.58 | 683.37 | 13.5 |
| Jawa Timur, Indonesia | 2020 | 28.52 | 573.83 | 8.3 |
| Nusa Tengarra Barat, Indonesia | 2020 | 20.15 | 466.73 | 1.6 |
| Chitwan province – Nepal | 2019 | 6.55 | 733.00 | 34.0 |
| Senegal | 2018/19 | 5.67 | 1058.30 | |
| Uganda (3) | 2018/19 | 5.23 | – | – |
| Georgia | 2020 | 12.57 | 1435.85 | – |
Data Sources: NIS, Cambodia Inter-Censal Agriculture Survey CIAS 2019; INEC,Encuesta de Superficie y Producción Agropecuaria Continua – ESPAC 2019; BPS, Pilot of Indonesian AGRIS 2021, 2020. DAPSA Enquete Agricole Annuelle (2018–2019); CBS, Pilot Agricultural Integrated Survey 2019; UBoS, Annual Agricultural Survey 2018; Geostat, Georgia – Survey of Agricultural Holdings 2020 (SAH) INEC. Report: SDG. Indicators. Methodology and analysis of data sources and calculation. November 2021: (1) SDG 2.4.1 Aggregated – Minimun of the sum of desirable and acceptable percentage among sub-indicators, (3) SDG 2.3.2 based only on the value of crop production.
Figure 3.
SDG Indicator 2.4.1 selected results.
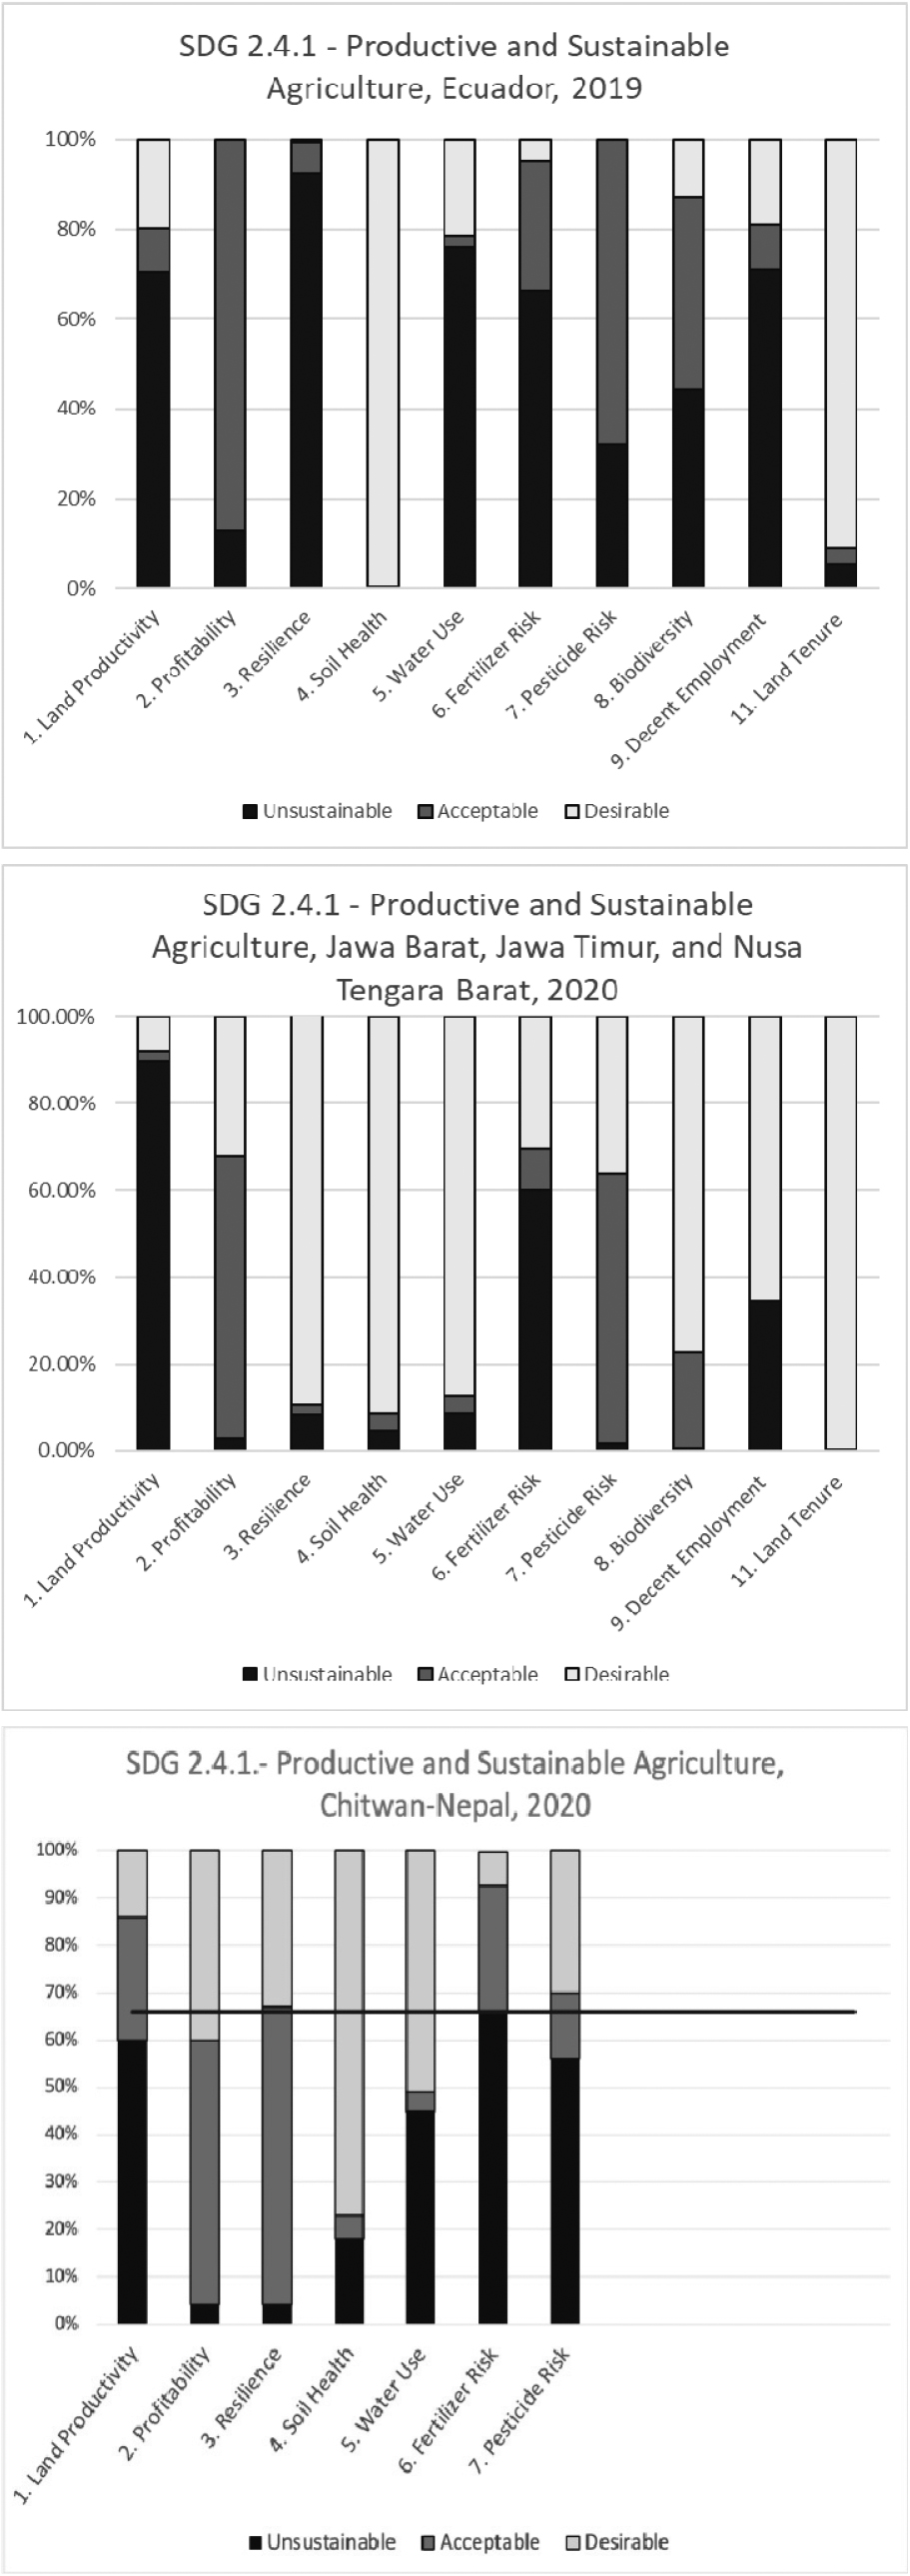
Table 5 and Fig. 3 show estimations of SDG Indicators 2.3.1, 2.3.2 and 2.4.1 obtained by each country and computed taking advantage of data collected through the respective surveys. The prevailing circumstances, challenges faced, and solutions adopted are discussed below.
3.1Integrated survey system implementation: Thematic priorities and SDG2
Since 2018, countries assisted by the AGRISurvey programme have adopted the integrated survey approach, progressively adjusting their existing survey to ensure comprehensive coverage of the national agricultural activity and expanding the survey scope by incorporating the rotating modules.
Most countries prioritise the economic aspects with specific interests in farm income, cost of production, or even to inform the national accounts. In the sequence, priority is given to environmental aspects; frequency varies but the three-year cycle is most common. It is important to mention that commonly key labour aspects, in particular labour input, were incorporated in the core module. In this case, data for computation of SDG Indicator 2.3.1 is obtained every year (e.g., Cambodia, Ecuador, Georgia).
Table 6
Agricultural Integrated Survey rotating modules schema in each selected countries, 2018–2026
| Year | Cambodia | Ecuador | Georgia | Indonesia | Nepal | Senegal (1) | Uganda. |
|---|---|---|---|---|---|---|---|
| 2018 | Only CORE | Only CORE | |||||
| 2019 | Only CORE | ECO | ECO | – | – | ECO | Only CORE |
| 2020 | ILP-AG | ECO | ECO | – | – | Only CORE | ECO |
| 2021 | PME-AG | ECO | ECO | ECO | – | Only CORE | ILP-AG |
| 2022 | MEA-AG | ECO | ECO | LABOR | – | ILP-AG | PME-AG |
| 2023 | Only CORE | LABOR | ECO | ECO | – | MEA-AG | |
| 2024 | ILP-AG | ECO | ECO | PME | PME | PME-AG | |
| 2025 | PME-AG | PME | ECO | ||||
| 2026 | MEA-AG | ECO | LABOR |
Source: Our elaboration based in AGRISurvey program work plans and countries’ 50X2030 Initiative Program Implementation Plan (PIP). Note: All countries’ data collection instruments customized according their characteristics and priorities. (1) the survey cycle overlaps 2 calendar years: “2018” means the survey cycle “2017–2018”.
Table 6 synthesizes country implementation, describing the order and frequency of the rotating modules, and indicating plans for the production of SDG 2 Indicators from the survey rounds in subsequent years. The combination of rotating modules is also observed, even though it represents longer interviews, with excessive respondent burden and some loss of data quality.
Besides the institutional, financial, and operational aspects, the implementation of the integrated approach mainly involves elaborating or revising the sampling frame and sampling design and developing data collection instruments. The latter activity, in principle, refers to the customization of standard questionnaires according to the country’s characteristics. In practice, the general configuration of the survey system could differ substantially from country to country. It is important to distinguish between cases where implementation is undertaken from scratch and the reformulation of a survey system that is already in place. In the first case, usually, the standard methodology is adopted. In the second, characteristics of the previous, ongoing survey system tend to be preserved, and adaptations developed (e.g., Ecuador, Georgia, Senegal, Uganda). The mode of implementation varies according to the type of institution in charge (e.g., national statistical office or ministry of agriculture) and basic survey objectives. The interest in early crop estimates and/or area measurement or crop-cutting determines the adoption of several data collection waves during the year, corresponding to each agricultural season (e.g., Senegal and Uganda) and season cycle (post-planting and post-harvesting time); while the interest in providing data for national accounts could claim for a quarterly survey implementation (e.g., Georgia). Moreover, the interest mainly in agricultural official statistics and cost-effectiveness would tend towards the one-visit approach (e.g., Cambodia and Ecuador). The different configurations have an impact on the complexity involved in computing the Indicators.
3.2The coverage issue
Limitations regarding the coverage of agricultural activities are not rare in agricultural survey systems, particularly among developing countries. Besides a lack of financial or operational resources, the following can be mentioned:
a) Special attention to household farming, neglecting the non-household units;
b) Focus on main crops, neglecting minor crops or horticultural- or pure livestock-oriented units;
c) Exclusion of certain important sub-segments, in some cases, industrial crops, for which information is produced by private associations or basic administrative data exists;
d) Agricultural statistical systems based on household surveys.
There are normally very few corporation-like agricultural holdings compared to family farms. However, even in countries where the sector has very low participation, it could be relevant for a particular agricultural activity/commodity or in terms of land possession or value of production. Administrative or private sector data are normally limited in scope. This data could complement or serve as a benchmark during the data validation process, but it hardly comprises the information required regarding statistical units or variables.
Table 7
Simulation of smallholder numbers and SDG 2.3.1 and 2.3.2 Indicators by total population and family holdings population
| Agricultural holder category | Target population | |||
| All holdings | Family holdings | |||
| # | % | # | % | |
| Smallholders | 495,354 | 82.4 | 470,459 | 78.3 |
| Non-smallholders | 106,086 | 17.6 | 130,312 | 21.7 |
| Total | 601,440 | 100.0 | 600,771 | 100 |
| SDG Indicators | All holdings | Family holdings | ||
| SDG 2.3.1. – Labor Productivity (USD/labor day) | 12.57 | 11.71 | ||
| SDG 2.3.2. – Income of small-scale producers (USD) | 1435.85 | 1261.60 | ||
Source: Georgia SAH 2020.
Table 8
Requirements for the computation of SDGs 2.3.1 and 2.3.2. and country compliance
| SDG 2.3.1 & 2.3.2 DATA REQUIRED | Cambodia (CAS 2019) | Nepal (AIS 2019) | Senegal (2017/ 2018) | Senegal (2018/ 2019) | Uganda (AAS 2019) | Uganda (UHIS 2021/2022) | Indonesia (AGRIS pilot 2020) | Georgia (SAH 2019; 2020; 2021) |
|---|---|---|---|---|---|---|---|---|
| Household Sector coverage | Y | Y | Y | Y | y | Y | Y | Y |
| Non-Household Sector Coverage | Y | Y | N | N | N | Y | Y | Y |
| Agricultural Area | Y | Y | Y | Y | Y | Y | Y | Y |
| Number of Animals | Y | Y | N | Y | Y | Y | Y | Y |
| Value of Crop Production | Y | Y | Y | Y | Y | Y | Y | Y |
| Value of Livestock Production | Y | Y | N | Y | Y | Y | Y | Y |
| Value of Aquaculture Production | Y | Y | N | Y | N | Y | Y | N |
| Value of Fishery Production | N | N | N | Y | N | N | Y | N |
| Value of Forestry Production | Y | N | N | Y | N | Y | Y | N |
| Labor Input (time) | Y | Y | Y (Only crops) | Y (Only for crops) | Y | Y | Y | Y |
| Labor Input Cost (only for SDG 2.3.2.) | SDG 2.3.2. not computed | Y(incomplete) | SDG 2.3.2. not computed | Y | Y | Y | Y | Y |
| Input Costs (only for SDG 2.3.2.) | SDG 2.3.2. not computed | Y (no pesticides) | SDG 2.3.2. not computed | Y | Y | Y | Y | Y |
| Other Fixed Costs | SDG 2.3.2. not computed | Y | SDG 2.3.2. not computed | Y | y | Y | Y | Y |
As mentioned before, a multiple-frame survey design is necessary. Traditional sampling schemas, such as two-stage sampling or area frame sampling based on segments, have been the preferred approaches to ensure the general coverage of the household sector. For instance, Cambodia, Senegal, Uganda, Nepal and Georgia use a list frame for the household sector of the agricultural surveys where they extract the Indicators. In particular, Uganda and Georgia benefit from a rich master sampling frame that provides samples for all the agricultural surveys and also, in the case of Uganda, for households surveys. Ecuador instead makes use of an area frame for the household sector. All the countries analyzed in this paper associate to the frame for the household sector a second frame for the non-household sector and special units. Building this type of frame is always challenging. Difficulties include the definition of a legal corporation itself, considering local legislation and formal record-keeping practices in the country; the identification, access and quality of cadastres; and integration of records from competent administrative or private-sector data (e.g., Cambodia, Senegal and Uganda). Due to the relevance of the problem, special guidelines on the topic were developed in the context of the AGRISurvey programme [28].
Table 9
Requirements for the computation of SDs 2.4.1. and country compliance
| SDG 2.4.1. SUB-INDICATOR | SDG 2.4.1 DATA REQUIRED | Nepal (AIS 2019) | Indonesia (AGRIS pilot 2020) | Georgia (SAH 2021 |
|---|---|---|---|---|
| 1. Farm output value per hectare | Crop, livestock, aquaculture production | Y | Y | Y |
| 2. Net farm income | Simplified option: profitability over the last 3 calendar years | Y | Y | Y |
| 3. Risk mitigation mechanism | Access to or availed insurance/credit, on-farm diversification | Y | Y | Y |
| 4. Prevalence of soil degradation | Threats to soil health | Y | Y | Y |
| 5. Variation in water availability | Irrigated agricultural land area, reduction of water availability experienced by the holding, existence of organizations dealing with water allocation | Y | Y | Y |
| 6. Management of fertilizers | Management measures to reduce risk caused by fertilizers | Y | Y | Y |
| 7. Management of pesticides | Management measures to reduce risk caused by pesticides | Y | Y | Y |
| 8. Use of agrobiodiversity- | Practices for biodiversity conservation | N | Y | Y |
| supportive practices | ||||
| 9. Wage rate in agriculture | Wage and number of unskilled workers hired, minimum agricultural sector wage rate | N | Y | Y |
| 10. Food Insecurity Experience | Holding experience of food insecurity | N | Y | N |
| Scale (FIES) | ||||
| 11. Secure tenure rights to land | Rights to sell or bequeath any of the parcel of the holding, formal document of ownership | N | Y | Y |
| General | Agricultural land | Y | Y | Y |
Source: Authors’ elaboration.
The simulation summarized in Table 7, using the Georgia Survey of Agricultural Holdings 2020, demonstrates a possible impact on estimates when the non-household sector is neglected. The smallholder population that should be the target of a specific policy is underestimated, as well as labor productivity and average income of the policy target group. Senegal and Uganda (AAS 2019) discarded the non-household sector in the computation of both SDG Indicators 2.3.1. and 2.3.2. Tables 8 and 9 provide an overview of the coverage and thematic scope of analyzed countries’ surveys, with reference to the data required for SDG Indicators 2.3.1, 2.3.2 and 2.4.1.
Comprehensive coverage of a country’s agricultural activities is crucial for adequate computation of SDG Indicators 2.3,1 2.3.2, and 2.4.1. The misclassification of corporate farms and other legal entities involved in agricultural production shifts the determination of the threshold to define the smallholder group, tending to underestimate the target population, as in the case of SDG Indicators 2.3.1 and 2.3.2. The lack of coverage of all types of producers and agricultural activities harms the estimates of all Indicators mentioned. Ensuring adequate coverage is the first challenge faced by countries. The adoption of an integrated survey system helps to overcome the issue.
It was observed that in most countries, certain regions are intentionally left out of the survey due to marginal relevance, like large cities (all countries), the absence of agriculture activities or remoteness and/or hard accessibility (e.g., Ecuador) or even due to inescapable political or military conflicts or obstacles (e.g., Georgia). Punctual coverage issues due to short-term inaccessibility such as flooding events were also observed (e.g., Indonesia pilot). During the last two years, the Covid-19 pandemic has affected coverage but mainly resulted in delays in data collection or adaptation of data collection modes to phone-based interviews using tablets, Computer-assisted telephone interviewing (CATI) or Computer-assisted web interviewing (CAWI).
Beyond the comprehensiveness of the target population and sampling design, attention should also be paid to the questionnaire content. In some situations, the complete absence or insufficient coverage concerning relevant agricultural activities in the data collection instruments was observed. For example, forestry and fisheries information was not collected in the case of the Ecuador ESPAC, Georgia SAH, Nepal pilot 2019, Uganda AAS 2019, Senegal EAA 2017/2018. The prices of forestry products were not collected in the Cambodia Inter-Censal Agriculture Survey 2019 (CIAS 2019), making it impossible to calculate the value of production generated by forestry activities which was, consequently, excluded from both SDG 2.3.1 and 2.3.2 computation. In some other cases, questions related to minor activities or less relevant commodities were avoided in favor of justified reduction of the respondent burden and costs, with gains in additional survey efficiency (e.g., Cambodia). For instance, the value of production and costs related to crop activities took into consideration only the 30 main crops in Cambodia since detailed information on minor crops was not collected in CIAS 2019.
3.3Required questions and questionnaire size and flow
As mentioned, the integrated approach proposed by the 50x2030 Initiative combines comprehensive coverage of agricultural activities and the most relevant themes related to the agricultural and rural sectors in the same survey system. It is conceived as a way of guaranteeing not only comprehensiveness in terms of coverage and thematic enlargement but also of ensuring concept standardization, result coherence, resource sharing, field- and deskwork optimization, and, in particular, cost-effectiveness.
The integrated approach also contributes to greater efficiency in data collection. By combining different modules applied to the same sample and operation, it is possible to obtain a larger amount of coherent information at a lower cost and in an efficient manner. It also expands the analytical possibilities, through crosschecking the data collected and the production of more complex Indicators, such as the farm survey-based SDG 2 Indicators. The FAO Working Paper on Mainstreaming SDG Indicator 2.4.1 maps the correspondence between the proposed SDG 2.4.1 Indicator stand-alone questionnaire and the 50x2030 tools [23].
Typically, an integrated survey system combines multiple objectives, resulting in richer but lengthier questionnaires. So, careful consideration should be taken regarding the trade-off between thematic coverage, respondent burden, and data quantity and quality. In practice, implementation of the system involves customization of the standard data collection instruments. Customization involves adaptation of the standard instruments and recommendations according to specifics, such as the country’s agricultural characteristics and policy priorities, respondents’ profiles, and the country’s technical and resource capacities.
The requirements for the numerator of SDG 2.3.1 correspond to the traditional production information collected annually in agricultural surveys and are part of the core module. Moreover, all assisted countries have expressed interest in maintaining the collection of key labour data in the core module, centered on annual labour input, which is the denominator of the Indicator. The core module, as well, provides the necessary data for the determination of the thresholds that define the smallholder sub-population. As a result, the SDG 2.3.1 Indicator on labour productivity can be produced every year for countries adopting the expanded core module.
This is not the case for SDG 2.3.2, since farm income requires data related to costs of production and holding expenses, which could be collected periodically using the economic modules. The collection of this kind of data is very demanding, involving information related to several items. Nevertheless, countries have decided to include the cost and expenses data with high frequency, such as every year, every other year, or every three years as the standard proposal suggests.
With 11 Sub-indicators, SDG 2.4.1 on agricultural sustainability involves the collection of several types of non-traditional data, including aspects related to environmental issues and the social dimension. The mode of measurement of the 11 SDG 2.4.1 Sub-indicators is very precisely specified and incorporated in the 50x2030 data collection instruments and some country surveys. According to the theme, the required questions are allocated to different sections of the questionnaire in order to ensure better logic and coherence with the flow of the questionnaire.
It is important to mention that there are several synergies between the three SDGs. Careful measurement of the value of production is fundamental; it is required to compute both SDG 2.3.1, SDG 2.3.2 and the first Sub-indicator of SDG 2.4.1. The costs related to agricultural activities are also the main components of SDG 2.3.2 and the SDG 2.4.1 second Sub-indicator if the simplified option is not applied. The criteria for identifying the smallholders relevant to SDG Indicators 2.3.1 and 2.3.2 are the same, meaning that time and resources can be saved if both data for both indicators are collected and computed together.
The inclusion of the required questions/sections could significantly increase the length of the questionnaire. As a result, the computation of SDG 2.4.1 in some countries was only partial. The questions for the 2.4.1 Sub-indicator 10 on Food Insecurity Experience Scale (FIES) and for some more demanding environmental Sub-indicators were either dropped (e.g., Nepal pilot 2019) or planned to be incorporated into different survey editions (e.g., Cambodia). The FIES indicator was dropped in the case of the Georgia SAH 2021, due to lack of relevance.
To reduce respondent burden and survey cost, both the 50x2030 Initiative and the AGRIS recommendations suggest applying the rotating modules to a sub-sample. In this case, the focus is the production of the SDGs Indicators at the national level, with sub-national level results obtained only for less desegregated domains. This recommendation was followed by some assisted countries, however, most opted to apply the rotating modules to the entire sample.
Some issues have been identified relating to certain aspects of the surveys and questionnaires. Since production data is often collected on a declaration basis at the holding level, the main issue is the use of non-standard units by respondents, making it difficult to produce estimates on standard units without appropriate conversion factors. This is an important source of measurement error for this kind of data. To ensure quality production data, a detailed list of conversion factors that allow converting crop harvests from local to metric units should be developed, even if it requires putting in place a dedicated survey to update the coefficients. To help countries facing this issue, the 50x2030 Initiative proposes developing a technical note describing such an ad hoc survey [29]. Some countries (e.g., Senegal) have developed and integrated a specific questionnaire into the main survey to collect additional data on the conversion factors.
Another issue is the lack of producers’ price data in the questionnaire to enable valuation of the production. In some cases, the customized questionnaires did not include commodities and/or input prices. Minimal attention is devoted to forestry activities, particularly the collection of price information on forestry products, making it difficult to estimate the value of production (e.g., Cambodia, CIAS 2019). In this case, administrative data may be used to calculate the required values. Recall issues are a common source of bias concerning: the selling price of agricultural products; agricultural production; production lost, destroyed or given to service or input providers; and quantities of agricultural inputs. Some input costs (e.g., hybrid and local seeds) were impossible to estimate (e.g., Nepal pilot 2019). The costs of several agricultural inputs and labor inputs were not collected and most of them were obtained through administrative sources.
Some proxies and assumptions were used to harmonize measurement units, such as the hypothesis that the annual labor input of a permanent worker corresponds to 250 man-days, since the unit of measurement of temporary worker labor and exchange labor available in the questionnaire was man-days (Nepal pilot 2018).
For the calculation of some Sub-indicators of SDG Indicator 2.4.1, the simplified option is often chosen, including in the questionnaire proxy questions. For example, in order to compute the second Sub-indicator of SDG 2.4.1, the direct question on profitability in the last three years is used instead of more detailed questions on a holding’s revenues over the same period.
For Indicator 2.4.1, the measurement of the agricultural area is crucial. Questions relating to land area and use are asked in a very detailed manner, collecting area in the following categories: area under temporary crops; fallow; meadows and pastures; permanent crops; other types of area used for agriculture; forest and other wooded lands; and area dedicated to aquaculture. Measurement errors can affect the precision of the agricultural land area reported by farmers through declaration, considering also the fact that it comprises several components. One of the strengths of some of the survey programs studied is the objective measurement of land area, which contributes to reliable yield estimates and more accurate production values. However, production data based on farmer estimates are subject to: (i) recall bias, and (ii) distortions in the conversion from local to standard units. This important measurement error affects crop, livestock, aquaculture and forestry products, and it is a common source of errors in agricultural surveys in developing countries. Similarly, the cost of inputs, including labor input (time), are affected by recall mistakes. The time worked on the holding is particularly difficult to collect due to the seasonality, irregularity and informality of farm labor.
The content of each Agricultural Integrated Survey questionnaire is quite complex and creates respondent burden during enumeration. The median amount of time is nearly one hour, when focused on the core questionnaire alone, and can reach two hours or more when rotating modules are included. This situation is known to jeopardize the quality of responses. The duration of the interview, however, is also associated with the complexity of the farm activity, in particular, it can be related to the number of parcels and plots when questions are not asked at the holding level but at the plot level. One strategy utilised has been to limit the number of crop items for which detailed information is captured, neglecting the information regarding less relevant ones. A multiple-visit strategy was also considered for some types of respondents.
Table 10
Time of interview by selected statistical operation
| Country | Statistical operation | Time of interview | |||
|---|---|---|---|---|---|
| Mean | Q1 | Median | Q3 | ||
| Cambodia | CAS 2020 (1) | 46’ | 22’ | 36’ | 56’ |
| Ecuador | ESPAC 2018 | 45’ | 42’ | 46’ | 48’ |
| Ecuador | ESPAC 2019 (1) | 1h15’ | 1h11’ | 1h15’ | 1h19’ |
| Ecuador | ESPAC 2020 | 50’ | 46’ | 50’ | 54’ |
| Senegal | EAA2020/21-Phase 1 (2) | 1h42’ | 48’ | 1h24’ | 2h18’ |
| Uganda | AAS 2019 (1) | ||||
| Season1-Post-planting | 50’ | 23’ | 37’ | 52’ | |
| Season1-Post-harvesting | 40’ | 15’ | 21’ | 32’ | |
| Season2-Post-planting | 53’ | 16’ | 23’ | 36’ | |
| Season2-Post-harvesting & production, livestock | 57’ | 26’ | 49’ | 1h11’ | |
Source: Authors’ elaboration. (1) Includes Economic and Labour Rotating Module. (2) Include crop-cutting exercise for a sub-sample.
Table 10 shows the interview times for statistical operations in different countries, in terms of the number of visits and the rotating modules used.
3.4Data collection challenges
As mentioned, some information required for the computation of the farm survey-based SDG 2 Indicators is standard, such as crop and agricultural area; livestock numbers; agricultural production; and use of irrigation, fertilizer and other inputs. However, most of the required information corresponds to aspects more recently incorporated into agricultural surveys, linked to the large scope of the emerging data needs. Moreover, many of the new themes of interest correspond to phenomena that are hard to measure, representing an additional challenge to producing consistent and reliable estimates of the Indicators. Information that is difficult to capture includes the following:
• Cost of production and expenses – the measurement of economic data is ever-challenging. In the context of the SDG Indicators, the information should cover all expenses incurred throughout the year and, for better accuracy, should be collected across dozens of items.11 Most of the respondents are not book-keeping farmers, and the information generated relies on their memory of items, quantities, and prices or value estimations using calculations assisted by the enumerators are not exceptions. In addition, most of the respondents could not separate the expenses of some items like electricity or water for the household versus agricultural activity.
• Labour – Estimating the total labor input for all agricultural activities along the different seasons of the year, considering household members and external workers in terms of working days is not less difficult. Labour data is usually collected by asking the average number of hours per day and days per season worked by each household member and external worker type [7, 26]. It is important to use the same inputs for all types of labour (i.e., family labour, external labour, occasional labour). When the labour inputs collected differ (for instance total hours worked versus the type of worker – part-time or full-time) conversion factors should be adequately used. During questionnaire design, attention should be paid to coherence between measurements units of labour data. A recent World Bank publication stresses the relevance of the agriculture labor data in the context of poor countries and for crop productivity measurement and recommends an even more detailed data capture approach that includes multiple visits and data collection at plot level [30]. Additional methodological studies on the theme are required, with attention paid to the holding’s labor input as a whole, and to find the appropriate balance between the level of detail, accuracy, and respondent burden.
• The criteria for the determination classifying the sustainability of holdings to compute most of the SDG 2.4.1 Sub-indicators requires very precise questions. Most of the questions are categorical and do not require the enumerators to consult notations. The difficulty faced in these cases is based on understanding and interpretation. Many of the questions are based on complex concepts that are not common knowledge to either the respondent or the enumerator. Examples are the technical questions on fertilizers and pesticides required for Sub-indicators 6 and 7. Avoiding item non-response and ensuring the collection of correct answers demands extensive and careful training of enumerators, and patience and knowledge while conducting the interview.
3.5Indicator computation and challenges due to missing components
In this section, challenges encountered when performing SDG computations due to missing components or difficulties in methodology interpretation are discussed. Information on how the challenges were overcome is provided, including (i) deviations from the strict Indicator methodology eventually adopted; (ii) proxies used for the calculation due to missing questionnaire items; and (iii) the use of administrative data or other sources to complement data requirements. The challenges and solutions described could refer to one or more country experiences.
The main deviation from the strict indicator methodology is in the identification of the smallholder group required for the computation of SDG 2.3.1 and 2.3.2. As indicated above, in the absence of non-household sector holdings, proper identification of the smallholder group, which requires the inclusion of the entire population of holdings, is problematic. Given that farm size distributions are typically highly skewed (i.e. there is a large number of small farmers and a low number of large farmers) and have “long tails” (a very low number of very large farmers, which significantly impacts the aggregate land size), the approach, based on 40% of the cumulated value, will inevitably lead to identifying a very large proportion of farmers as small food producers. This proportion will be even higher if agricultural surveys are used, as opposed to household surveys, as the former also includes commercial farms. That is one reason for using agricultural surveys to determine the set of small-scale food producers and to calculate SDG Indicators 2.3.1 and 2.3.2. The use of household surveys as an alternative should be considered only when non-household sector agricultural production is considered absolutely negligible. While household surveys may indeed contain most of the data required to determine the set of small-scale food producers and compute the SDG Indicators, they only cover the household sector and therefore farms that tend to be smaller, generate lower incomes and possess a lower number of animals than in the non-household sector. Determining the set of small-scale food producers from these surveys, as opposed to sector-wide agricultural surveys, would generally lead to lower thresholds and likely distortions in the results, as farm size (physical and economic) is correlated to average farm incomes and productivity. For some countries, the problem could be overcome only in the subsequent editions of the surveys, incorporating a list of special (non-household) farms in the frame and sample of the survey.
Another deviation from the methodology of Indicators 2.3.1, 2.3.2 and 2.4.1 is the exclusion of the forestry and fishery sectors in the computation of the Indicators. Few attempts have been made to estimate the missing information, i.e., the value of aquaculture, fishery and forestry production or the prices of their products and consequently the relative values of production. Therefore, these sectors are sometimes excluded from the calculation of the Indicators. Note, however, that in general, they represent marginal activities of the agricultural holdings. Therefore, their absence is not considered a concern. In any case, it could have a consequence for evaluation of the “on-farm diversification” in the context of the SDG 2.4.1 Sub-indicator 3 – Risk mitigation mechanisms.
Difficulties relating to methodology interpretation
A series of doubts and misunderstandings were observed relating to the procedures for determining the set of small-scale food producers, a crucial piece of information for SDG Indicators 2.3.1 and 2.3.2. Some issues raised by the countries are not really a matter of interpretation but rather require a discussion of clearly specified methodological options. Among them, the following issues should be mentioned:
a. Whether or not to use sampling weights in the computation of the smallholder threshold.
b. Whether to use of the 40
c. Whether to use as economic size the value of the agricultural output, or on the value of the sold output.
d. Whether the set of small-scale producers excludes those exclusively producing non-food commodities (i.e., they are excluded from the target population for the Indicator).
e. Whether the area and revenue thresholds refer only to food commodities or to all agricultural production (food and non-food).
f. Whether all types of pastures are excluded or only permanent pastures (usually natural/unimproved) and not temporary ones (usually improved/sown pastures).
g. Whether areas devoted to tree plantations are considered “forest land”? If so, does it mean that the area devoted to tree growing is excluded from the concept of operated land used to determine the threshold?
h. How to treat instances where income is a negative value.
i. Whether labor productivity should be computed as the ratio of the the total agricultural production and total labor input or as the mean of the unit productivity across smallholders In the latter case, should average farm-level labor productivity be weighted by the farm’s share of total labor input.
Most of these issues were addressed in the revised version of the methodology of the two Indicators.
Small-scale food producers
Due to insufficient clarity or ambiguities regarding the indicator methodology, confusion with the standard statistical methodology and mistakes made when using pre-defined functions from statistical packages, disparate procedures were followed by different countries. Later, the main issues were clarified. The use of the sampling weight, the value of agricultural output as revenue and the use of 40% of the cumulated value to define the thresholds was confirmed. The distribution should be computed according to the estimated number of units in the population (weighted distribution) and not according to the number of units in the sample (unweighted distribution). Indeed, the set of small-scale farms might differ significantly depending on the approach used, as extrapolation factors typically vary across units.
Operated land: According to the methodology for computing SDG Indicators 2.3.1 and 2.3.2, the concept of land used for discriminating smallholders excludes pastures, forest land and the area devoted to aquaculture. Additional clarifications were needed for the operational implementation of the concept, with regards to whether food and non-food products should be considered. Tree plantations as part of permanent crops are therefore included in the scope. Tree nurseries should be included as well. Land used for aquaculture and pasture could be included in a further revision of the methodology, but not forestry land.
Economic size/revenues: In the measurement of revenues, just the sold output was considered in some cases. However, the concept to be measured is the total agricultural output, information usually directly measured in farm surveys, regardless of the destination of the output. The methodology mentions that livestock bought should be accounted as a cost and therefore deducted from the income. Animal purchases could be counted as an investment that contributes to building up the stock of animals on the farm. This is a common practice in farms accounting for breeding livestock [31]. Livestock purchased for resale should, however, be accounted as a cost. In practice, this supposes that the destination of the animal purchased be known at the moment the data is collected from the farmer, which is not often the case. It was envisioned using, as a rule of thumb, the accounting of livestock purchases as an investment, except in cases where it is known that the animals purchased are meant to be sold shortly after. However, it was confirmed that, for the purpose of the Indicator, any livestock purchases should be accounted as a cost.
Labour cost: The SDG Indicator 2.3.2 methodology clearly mentions that labor costs should only include hired and occasional workers, implicitly excluding unpaid family labor. While even the time devoted by household members to agricultural activities, as well other unpaid labor, is considered in the denominator, it is not considered among the cost items in the calculation of the income. Costs are computed as explicit costs. Family labor cost is implicit and would need to be imputed on the basis of its shadow price since family members do not usually receive a salary for their work at the holding. If implicit labor costs were included, the same logic should be applied to other factors of production conferred by the farmer to the production process – land for instance – and possibly others, including the labor of the entrepreneur themself. The recommendation is consistent with the notion that income is not entirely net, as it would be if you were able to compute it as what remains after all factors of production, including the implicit ones, are remunerated. In fact, if we consider, for instance, the cost of family labor in the computation of the income, we obtain negative values for almost all holdings.
Negative values: Even considering only explicit costs, i.e., excluding the remuneration of factors such as family labor or land, several holdings can show income as a negative value. A question arises as to how to treat such cases when computing the Indicator. The actual practice excludes such units from the calculation of average income.
Economic size/stock of animals. The SDG 2.3.2 methodology mentions that the income from livestock should also take into account the change in the value of the stock of animals. The measure of net farm income on which the Indicator is based is a flow measurement and corresponds to the standard definition of “income after expenses from production in the current year and is calculated by subtracting farm expenses from gross farm income”, the latter reflecting the total value of agricultural output [32]. Including animal stock implies to use a different wealth-related metric, i.e tangible assets which, to be complete, would require the valuation of other assets such as land, machinery, infrastructure, trees, etc., which is not considered. An alternative consideration is sticking to the definition of net income as the value of farm output minus operating costs.
Other difficulties
Volume of production: To address the issue of non-standard units, when conversion factors are not available or the Local Unit of Measure (LUM) is missing for a given rainfed crop, its production is approximated by multiplying the area planted by the average yield of the given crop as estimated from the crop-cutting measurement. For other crops, the equivalent quantity of harvest in kilograms declared by the respondent is used instead (e.g., Senegal).
Value of production/prices. In order to calculate the agricultural production for those holdings that do not practice sales and, consequently, did not report the selling price of their agricultural products, imputation was used in some cases (e.g., Cambodia, Nepal), i.e. prices of product x were imputed using the mean among the prices of product x made by the holdings that practice sales for product x. In other cases, instead, an external source of price data is used, normally administrative data (e.g., Senegal). Note that this could approximate actual prices, as the prices collected externally did not always consider price inflation.
Agricultural area: This is normally obtained from a directed question on land use asked at the holding level. However, some surveys do not include such structural questions. Information regarding land use could be spread between different questionnaire sections.
Use of other data sources
Production costs: Administrative data was used to fill gaps in the information collected through the questionnaire. For instance, in the Nepal pilot 2019, the holding was not asked to report how much each worker was paid in cash, hence it was considered an estimate provided by the Field Office of the average monthly salary in the agricultural sector. This was divided by 25 to get the salary per labor day.
Computation
The SDG Indicator 2.3.1 methodology [9] and metadata [33], define the Indicator as the “Volume of agricultural production of small-scale food producer in crop, livestock, fisheries, and forestry activities per number of days”. It is computed as the average among all smallholders’ labor productivity, i.e.:
where:
•
•
•
•
The formula is not fully explicit as to how the calculation should be performed using microdata. The formula presented in the methodology consists of a simple average of farm-level ratios (farm agricultural output divided by labor input), which is appropriate for analytical purposes (e.g., distributional analysis) but less so when the objective is to compute ratio estimates for the target population or a portion of it. Instead, the standard ratio of aggregates approach could be used, as it is when producing survey-based estimates of yields. The formula would then be as follows (omitting time indices):
Where the
Everything else held equal, this approach should be superior to the simple average approach given that the weights reflect the relative use of labor input and that these weights are likely to be correlated with labor productivity. The simple average approach assumes uniform weights and therefore gives equal importance in the index to farms that use very little labor and those that are more labor intensive, which might distort the aggregate result.
The SDG 2.3.2 Indicator methodology [9, 34] proposes to compute the average annual farm income in the following way:
where:
The same concern mentioned regarding the formula related to Indicator 2.3.1, i.e. the use of sampling weights in the formula, is raised.
The computation of SDG 2.4.1 generically involves three steps applied to each of the 11 Sub-indicators: (a) compute the agricultural area of each sampled holding; (b) determine the sustainable status of the sampled holdings, and; (c) aggregate the agricultural area according to the status category (desirable, acceptable, unsustainable) and compute the respective proportion.
Step (b) is more demanding. For most of the Sub-indicators, development and implementation of the required algorithm are straightforward. However, difficulties and concerns related to the calculation of agricultural and sustainable areas and the more complex Sub-indicators have been observed, in particular, Sub-indicator 1 (land productivity) and Sub-indicator 10 (Food Insecurity Experience Scale).
Concerning the computation of the SDG 2.4.1 Indicator, an issue raised refers to the unit of analysis that should be taken into consideration in the calculation of the sustainable area. The confusion emerges when data is collected at plot or parcel level is available, and the sustainable criteria parameter is then calculated at plot or parcel level. In this case, analysts tend to compute the indicator using plot or parcel area aggregates. The Indicator methodology, however, clearly indicates that in any case the aggregation should be done considering the total agricultural area of each holding. For example, if extremely hazardous pesticides are used just in one plot/crop and not in other plots/crops, the holding is considered unsustainable regarding the management of pesticides and the entire agricultural area of the holding is computed as part of the non-sustainable agricultural area proportion of the Sub-indicator.
Whereas SDG 2.4.1 uses a dimensionless indicator, with the agricultural area as the denominator, both the closed segment and the proportional segment were taken into consideration for its computation. In the case of a closed segment, all tracks belonging to the same holding receive the same sustainability classification: Green (desirable); Yellow (acceptable) or Red (unsustainable), according to the criteria accessed at the holding level.
A doubt raised is linked to agricultural area and related to the computation of the SDG 2.4.1 Sub-indicator 1 (land productivity). In the context of SDG 2.4.1, land productivity does not refer directly to traditional agriculture productivity indicators like crop yield and is not limited to crops. The sustainable criteria parameter refers simply to the ratio between the total holding value of production and the agricultural area. However, some country analysts consider developed areas instead of physical areas.
In the case of Sub-indicator 1, the SDG 2.4.1 methodology recommends that the productivity frontier used to define the sustainable status of the holdings should be as refined as possible. To this end, it is recommended to consider distinct homogeneous sub-populations to calculate the productivity frontier. The number and characteristics (activities) of the sub-populations depends on each country’s agricultural context and the survey sample size. A common approach is to distinguish five to six sub-populations considering crop, livestock and mixed farming and the use, or not, of irrigation. Following this recommendation demands special data analysis that represents additional difficulties in the calculation process.
In relation to Sub-indicator 10, the difficulties observed are related to the implementation of the estimation of parameters for the prevalence of food insecurity based on the Item Response Theory and the Rasch model, as indicated by the Indicator methodology.
As mentioned, specific algorithms should be developed for the computation of each of the SDG 2.4.1 Sub-indicators. The algorithm varies and could become quite complex when the variables involved refer to data collected at the parcel or plot level and depending on criteria for defining sustainability. In some cases, such as the Sub-indicator 8 (use of agrobiodiversity-supportive practices, the criteria for which involves multiple parameters, including different thresholds), the computation becomes especially demanding. It is not always possible to compute all of the Sub-indicators of SDG 2.4.1, and its value may be released even though its computation is based only on a part of the Sub-indicators (Nepal pilot 2019). In this situation, it is important to mention the limitations of the computation in the disseminated results.
Due to the complexity of SDG Indicators 2.3.1, 2.3.2 and 2.4.1 and the quantity and variety of raw data and derived variables involved, their computation is not a trivial task. In-depth knowledge of the survey instruments, concepts, dedicated study of the indicator methodology, advanced statistical skills related to inferences estimation, data analysis and sampling aspects and very attentive, careful, and conscious procedures are required for a competent computation. The supply of professionals with the adequate skills to compute the Indicators is a challenge: Statisticians with the required capacity can be hard to find in national statistical systems and, where available, typically require additional capacity building.
A common misunderstanding regarding the production of the SDG 2.4.1 Indicator relates to confusing the specific parameter used to classify the holdings in the context of each Sub-indicator with the Indicator itself. Sometimes, such confusion led to relay for the production of the Indicator on alternative sources that do not provide enough information. Important and interesting information regarding several aspects of agricultural sustainability addressed by the Indicator could be found in administrative data, remote sensing studies or environmental and household surveys or population and housing censuses. However, most of these sources do not contain information able to link sustainability with agricultural area that is the base variable in which the indicator is ultimately expressed.
Regarding the use of proxies due to missing questionnaire items, it is interesting to mention the case of SDG 2.4.1 Indicator production carried out by Ecuador for the year 2019. Proxies were adopted to compute several environmental Sub-indicators. The ESPAC 2019 questionnaire did not collect several items specified by the Indicator methodology, particularly those related to Sub-indicators 4 (Prevalence of soil degradation), 6 (Management of fertilizers), 7 (Management of pesticides) and 8 (Use of agrobiodiversity-supportive practices). For example, it was missing information about soil erosion, reduced soil fertility and salinization of irrigated land. A soil fitness map on a scale of 1:25000 and information on the management of pesticides provided by the Ecuador Instituto Nacional de Investigaciones Agropecuarias (INIAP) were used as alternative sources [27].
3.6Publication of Indicators: clearance and dissemination
The 50x2030 Initiative promotes best practices in partner countries that aim to make statistics accessible to the public in formats that ensure greater readability, usability, interoperability, and findability of the data. In line with countries’ data dissemination strategies (if available), targeted support is provided to improve dissemination policies and programs, helping ensure that dissemination programs become part of national institutional processes.
To the extent possible, the Initiative promotes the dissemination of timely statistics, recommending that the data should be disseminated within six to 12 months after data collection is completed and target data users/producers and donor communities at the national level.
At the United Nations-level, the release of the SDG Indicators is guided by the official principles for submission and publication of the SDG indicators, which are contained in the IAEG-SDG Guidelines on Global Reporting [35]. The main principle is that countries should report to the relevant custodian agency or publish their data on their own national reporting platform. However, there is no official procedure for this, because the specifics may vary from Indicator to Indicator. It is often the case that countries submit the underlying data and FAO calculates the final figure based on that data. Usually, it is good practice to allow for both scenarios, i.e., a country can proceed to the final calculation itself or it can leave this to FAO. By contrast, it is not good practice to allow countries to simply send the final figure to the custodian agency without any underlying data (although exceptions could be made on a case-by-case basis), due to the need for quality assurance procedures performed by the custodian agency.
On the other hand, at the country level, the dissemination of SDG Indicators 2.3.1, 2.3.2 and 2.4.1 is country-specific, according to each country’s National SDG programs, release calendars and priorities. In most countries, the governments prepare SDG priority plans. The implementation and monitoring of the plans are different from country to country Some of them develop a detailed program, which determines the national institutions responsible for monitoring the SDGs, the data providers, the reference years and the targets adjusted to the national context (e.g. Georgia) [36]. Other countries establish coordination groups that gather members of the relevant Ministries and NSOs (e.g., in Cambodia the coordination groups are the Data for Development Group, led by NIS and the SDG Secretariat 2019, located in the Office of the Prime Minister) or incorporate the SDG goals into the broader national development policy (e.g., Senegal integrated the SDG goals into its national development policy 2019–2023). However, in general, the countries do not adopt a strict national SDG publication plan and the calculated SDG is not included in the survey publications (Georgia is an exception). One of the objectives in the dissemination program of AGRIS and 50x2030 Initiative is closely linked to assistance in the calculation of the selected SDG Indicators, namely 2.3.1, 2.3.2, 2.4.1, and 5.a.1, and their proper dissemination, either through the country websites (e.g. the NIS website in Cambodia, Geostat website in Georgia) or through FAO platforms. Table 6 shows the progress achieved, or planned, in the years during the period of assistance provided in the countries. The procedures for the publication of SDG Indicators need to be further developed and well communicated to the countries.
4.Conclusion
An important objective of the 50x2030 Initiative is empowering partner countries to monitor progress on SDG 2 through indicators 2.3.1, 2.3.2 and 2.4.1. The paper discussed the experiences, challenges and solutions encountered in the Initiative partner countries.
Indicators 2.3.1, 2.3.2 and 2.4.1 require that the agricultural survey programs cover all types of producers, regardless of their sector, size and location. In addition, they entail an expanded thematic coverage encompassing sales, costs and labor and including all agricultural commodities produced by the holding.
Fulfilling these data requirements obliges countries to implement important changes to their surveys. The modular and integrated approach proposed by the 50x2030 Initiative allows member countries to periodically (every two or three years) collect with specific questionnaires the detailed information required to compute Indicators 2.3.2. and 2.4.1. The data gathered with the core module administered every year instead allows to compute Indicator 2.3.1. more frequently. Most importantly, Indicators 2.3.1, 2.3.2 and 2.4.1 require the survey programs to include non-household sector holdings. The coverage of the non-household sector is highly recommended to all survey programs as a way of ensuring a complete overview of agriculture. But, in practice, many developing countries tend to ignore this sector, given its limited incidence and contribution to total production. Indicators 2.3.1 and 2.3.2 push for the inclusion of the non-household sector, even when it has limited importance. Secondly, they require accounting for all agricultural commodities produced by the holdings while some surveys consider only the main commodities in order to limit the burden on respondents (e.g. only the main crops). Therefore, it is not surprising if the main methodological deviations observed in the partner countries concern the smallholder calculation and the exclusion of forestry, fishery and aquaculture-related production. Nor, are we surprised that Indicator 2.4.1 is only partially covered, given the large amount of data and Sub-indicators it requires.
The experience with partner countries suggests that some data gaps can be filled at the processing stage using alternative data sources, such as prices for products and inputs. Therefore, incorporation of the SDG Indicators should be carefully analyzed at the first stages of survey implementation to ensure that all the essential data is either collected or accurately imputed during the analysis. This particularly concerns data on cost of production, expenses and labor that is complicated to be collected in detail and that is fundamental for the computation of Indicator 2.3.1, 2.3.2 and 2.4.1. During the questionnaire design it is important to specify standardized and coherent units of measurement of these components, particularly of labor and agricultural inputs. Special attention should also be given to the questions that capture the land-use of the agricultural area.
With the proposed agricultural integrated survey approach the 50x2030 Initiative and AGRIS offer to partner countries several efficient and effective tools for data production and computation of SDGs Indicators. Each country can customize the survey according to its needs, with the possibility to estimate, from the collected data, Indicators 2.3.1, 2.3.2. and 2.4.1. within a three years cycle. A dissemination plan for the publication of the results can be developed simultaneously. This paper discussed the experience of partner countries that have already implemented AGRIS methodology, showing the challenges and the solutions they faced in the computation of the above-mentioned Indicators. These examples can serve as a guide for a continuous improvement of both the Indicators methodology and its practical implementation.
Notes
1 47 items in the case of the 50x2030 ILP-AG questionnaire, with the expenses associated with five labor categories asked via five activities, and five livestock expense items asked via 17 livestock categories.
Acknowledgments
The authors thank the collaboration of the following institutions and practitioners:
Badan Pusat Statistik – BPS, Indonesia
Direction de l’Analyse, de la Prévision et des Statistiques Agricoles (DAPSA) – Ministry of Agriculture and Rural Equipment – Sénégal
Instituto Nacional de Estadística y Censos (INEC), Ecuador
National Institute of Statistics (NIS), Cambodia
National Statistics Office of Georgia (GEOSTAT), Georgia
Uganda Bureau of Statistics (UBOS), Uganda
Arbab Asfandiar Khan
Armando David Salazar
Dorian Kalamvrezos Navarro
Franck Cachia
Giorgi Sanadze
Kadir Ruslan
Mamuka Nadareishvili
Xinia Andrade Ruiz
The reviewers and the English editor
References
[1] | The 50x2030 Initiative. Available from: https://www.50x2030.org/about (Accessed 16 September 2021). |
[2] | Brunelli C, Gourlay S. Individual Land Rights – Filling Data Gaps with the 50x2030 Initiative. Forthcoming (this special section). |
[3] | 50x2030 Initiative. Producing, Using, Innovating: How 50x2030 is Closing the Agricultural Data Gap. (2020) . Available from: https://www.50x2030.org/resources/document-library (Accessed 16 September 2021). |
[4] | 50x2030 Initiative. A Guide to the 50x2030 Data Collection Approach: questionnaire design. (2021) . Available from: https://www.50x2030.org/resources/document-library (Accessed 26 September 2021). |
[5] | The AGRISurvey program website. Available from: http://www.fao.org/in-action/agrisurvey/en/ (Accessed 16 September 2021). |
[6] | The Living Standards Measurement Study – Integrated Surveys on Agriculture (LSMS-ISA) website. Available from: https://www.worldbank.org/en/programs/lsms/initiatives/lsms-ISA (Accessed 26 September 2021). |
[7] | Global Strategy to improve agricultural and rural statistics. AGRIS Handbook on the Agricultural Integrated Survey. (2017) . Available from: http://www.fao.org/in-action/agrisurvey/resources/resource-detail/en/c/1198081/ (Accessed 16 September 2021). |
[8] | Global Strategy to improve agricultural and rural statistics. http://www.fao.org/food-agriculture-statistics/capacity-development/global-strategy/en/ (Accessed 16 September 2021). |
[9] | FAO. Methodology for computing and monitoring the Sustainable Development Goal Indicators 2.3.1 and 2.3.2. FAO Statistics Working Paper Series. (2019) ; 18–14. Available from: http://www.fao.org/documents/card/en/c/CA3043EN/. |
[10] | FAO. SDG indicator 2.4.1: Proportion of Agricultural Area under Productive and Sustainable Agriculture. Methodological Note. (2020) . Available from: http://www.fao.org/3/ca7154en/ca7154en.pdf. |
[11] | 50x2030 Initiative. A Guide to sampling. Technical Paper Series. (2021) . Available from: https://www.50x2030.org/resources/document-library. |
[12] | FAO. Sampling Guidance for SDG 2.4.1. (2019) . Available from: http://www.fao.org/3/ca7439en/ca7439en.pdf. |
[13] | FAO. Guidelines on data disaggregation for SDG Indicators using survey data. (2021) . Available from: doi: 10.4060/cb3253en. |
[14] | Bako D, D’Orazio M, Missiroli S, Ssennono VF, Brunelli C, Kilic T, Ponzini G, Bolliger F. Integrated sampling design for agricultural and socio-economic households’ surveys: a cost-effective approach for agricultural and rural statistics. Forthcoming (this special section). |
[15] | Kingdom of Cambodia. Cambodia Inter-Censal Agriculture Survey 2019 (CIAS19) Final Report. Available from: https://www.nis.gov.kh/index.php/km/27-cias/94-cias2019-finalreport. |
[16] | INEC. Encuesta de Superficie y Producción Agropecuaria Continua – ESPAC. Available from: https://www.ecuadorencifras.gob.ec/estadisticas-agropecuarias-2/. |
[17] | GEOSTAT Agriculture of Georgia website. Available from: https://www.geostat.ge/en/single-categories/102/agriculture-of-georgia. |
[18] | Badan Pusat Statistics. Agricultural SDG indicators 2020 in West Java, East Java, and West Nusa Tengara (the Integrated Agricultural Survey Results (2020). Available from: http://s.bps.go.id/IndonesianAGRIS2020_Publication. |
[19] | Government of Nepal, FAO. Pilot Agriculture Integrated Survey 2019, Chitwan: Statistical report (Major findings). (2020) . Available from: https://nepalindata.com/resource/pilot-agriculture-integrated-survey-2019-chitwan-nepal/. |
[20] | DAPSA. Rapports de l’Enquête Agricole Annuelle (EAA) 2017–2018 et 2018–2019. Available from: https://dapsa.sec.gouv.sn/toutes-les-publications. |
[21] | UBOS. Annual Agricultural Survey 2018. (2020) . Available from: https://www.ubos.org/wp-content/uploads/publications/AAS_2018_Report_Final_050620.pdf. |
[22] | FAO. AGRISurvey Country Brief. (2021) . Available from: https://www.fao.org/in-action/agrisurvey/en/.2 |
[23] | FAO Working Paper on Mainstreaming SDG Indicator 2.4.1 in AGRIS & 50x2030. Working paper. (unpublished). |
[24] | FAO. Defining small scale food producers to monitor Target 2.3 of the 2030 Agenda for Sustainable Development. FAO Working Paper Series, ESS/17–12. June (2017) . Available from: https://www.fao.org/3/i6858e/i6858e.pdf. |
[25] | FAO. Methodology for Computing and Monitoring the Sustainable Development Goal Indicators 2.3.1 and 2.3.2. FAO Working Paper Series. ESS/18–14. (2019) . Available from: https://www.fao.org/3/ca3043en/ca3043en.pdf. |
[26] | 50x2030 Initiative. Survey Instruments. Available from: https://www.50x2030.org/resources/survey-instruments. |
[27] | INEC. Report: SDG Indicators. Methodology and analysis of data sources and calculation. (2021) . |
[28] | Bako D, Cara O, Paré L, Missiroli S, Mugabe S, Koudelka K. Operational guidelines on listing and survey preparation for household and non-household agricultural holdings and special farms. (2021) . Working Statistics Paper Series/21–21. Available from: https://www.fao.org/documents/card/en/c/cb4065en. |
[29] | 50x2030 Initiative. Technical Note on Non-Standard Units. (2021) . NoteOnNSU_FINAL.pdf (50x2030.org). |
[30] | Sagesaka A, Palacios-Lopes A, Amankwah A. Measuring Agricultural Labor: A Guidebook for Designing Household Surveys. LSMS Guidebook. World Bank. (2021) . |
[31] | USDA. Commodity Costs and Returns Estimation Handbook. Section 2–7. (1998) . |
[32] | USDA. Farming and Farm Income. Available from: https://www.ers.usda.gov/data-products/ag-and-food-statistics-charting-the-essentials/farming-and-farm-income/. |
[33] | UNSTATS. Metadata for the compilation of Indicator 2.3.1. (2018) . Available from: https://unstats.un.org/sdgs/metadata/files/Metadata-02-03-01.pdf. |
[34] | UNSTATS. Metadata for the compilation of Indicator 2.3.2. (2018) . Available from: https://unstats.un.org/sdgs/metadata/files/Metadata-02-04-01.pdf. |
[35] | UNSC. Guidelines on Data Flows and Global Data Reporting for Sustainable Development Goals. (2018) . Available from: https://unstats.un.org/unsd/statcom/49th-session/documents/BG-Item-3a-IAEG-SDGs-DataFlowsGuidelines-E.pdf. |
[36] | Government of Georgia. Decree N 2328/12.11. The National Document for the Sustainable Development Goals. (2019) . |


