
The integration of socio-economic and agricultural surveys by national statistical offices: The case of the Uganda Harmonized Integrated Survey1
Abstract
Since 2009, the Socio-Economic Directorate of the Uganda Bureau of Statistics (UBOS) has been implementing the Uganda National Panel Survey (UNPS). In 2017, the Agriculture and Environment Statistics Directorate (DAES), started implementing the Annual Agricultural Survey (AAS). Similarities and disparities in the design of the two surveys have led, on the one hand, to the duplication of part of the collected information, and, on the other, to the different methodologies inevitably returning different estimates. This has resulted in issues around reconciling and communicating the differences in some agriculture indicators and statistics retrieved through the two different surveys. In integrating the two survey programs under the 50
1.Background and motivation for integration
The World Development Report 2021: Data for Better Lives describes the pathways through which data collected with the intent of serving the public good (i.e., public intent data) can foster development, including by improving service delivery, prioritizing scarce resources, making governments more accountable, and empowering individuals [1]. In low- and middle-income countries, where agriculture is a key source of employment and household income, the availability and quality of data on the agricultural sector is key to the design and evaluation of policies aimed at fighting poverty and hunger.
Joliffe et al. [2] identify twelve conditions that make data more valuable for improving development outcomes: completeness, frequency, timeliness, accuracy, comparability, granularity, accessibility, understandability, interoperability, impartiality, confidentiality, and appropriateness. Even though these conditions may not apply equally to public intent data of all types, agricultural survey data generated by national statistical offices (NSOs) should undoubtedly satisfy these conditions for data-driven decision-making in the agricultural sector to achieve national and international development goals.
Yet, agricultural survey data generated by NSOs in low- and lower-middle income countries often do not satisfy these conditions. Insufficient financing by governments; underinvestment by donors in part due to the mismatch between donor priorities and country needs; weaknesses in NSO technical capacity and technological infrastructure; poor data governance; and deficiencies in data demand are among the key reasons agricultural survey data may fail to satisfy the desired conditions [3, 4, 1]. Relatedly, FAO [5] underlines how critical gaps in data production are often filled using small-scale and ad hoc surveys leading to several small-scale surveys lacking statistical harmonization and generating conflicting estimates.
This paper reports on the experience of the Uganda Bureau of Statistics (UBOS) regarding the integration of a socio-economic household survey, known as the Uganda National Panel Survey (UNPS), and a farm survey, known as the Annual Agricultural Survey (AAS), to increase the availability, cost-effectiveness, quality, and use of nationally-representative agricultural survey data in a way that is set out to satisfy the ambitious set of conditions laid out by Jolliffe et al. [2] outlined above. The Uganda Harmonized Integrated Survey (UHIS) Programme is supported by the 50x2030 Initiative and facilitates the computation of global and regional indicators,22 the monitoring of agricultural production and the provision of high-quality and integrated agricultural and socioeconomic data for policymaking and development research.33 As laid out in greater detail in the subsequent sections, integration in the context of UHIS entails shared samples; identical agricultural questionnaire and fieldwork protocols used by both surveys; and a light AAS household questionnaire that draws on the more complex UNPS counterpart. These features work towards lowering costs of data production, incorporating socio-economic data collection into the farm survey, deepening agricultural data collection as part of the socio-economic survey, and enhancing comparability of seemingly identical information elicited from two parallel surveys. The creation of the integrated survey infrastructure also allows experimentation with statistical matching methods to derive the predicted measures of socio-economic variables for AAS households that are otherwise only observed in the UNPS sample. This further increases the cost-effectiveness and utility of survey data production. Moreover, the adoption of improved, objective survey methods seeks to increase the accuracy of agricultural survey data collection and ensure seamless integration with satellite imagery and other geospatial data for the survey data to calibrate and validate remote sensing models for high-resolution crop area mapping and yield estimation. Finally, integration involves the amalgamation of UBOS, the World Bank, and FAO task teams that have traditionally worked on either the UNPS or the AAS – thus building on a history of statistical capacity building at UBOS, facilitating greater knowledge sharing among UBOS departments, and enhancing donor coordination in technical assistance provision. On the whole, the extent of methodological, logistical, and institutional integration exemplified by the UHIS may be aspirational in the short term for many NSOs in low- and middle-income countries. However, the documentation of this experience can help when establishing long-term strategies and implementation plans to move towards similar goals. The paper is organized as follows: Section 2 describes the main features of the UHIS Programme. Section 3 discusses the cost-efficiency implications of integrating the UNPS and the AAS. Section 4 details the UHIS questionnaire design and computer-assisted personal interviewing (CAPI) platform, sampling design, and fieldwork implementation arrangements. Section 5 discusses the main non-technical challenges encountered during the design of the UHIS. Section 6 describes the methodological innovations embedded into the UHIS. Section 7 outlines the way forward and concludes.
2.Integrating, and harmonizing the surveymethodologies in the context of the 50x2030 Initiative
Data integration entails the combination of data from different sources for statistical use, including data analysis and inference. In the context of National Statistical Systems, integration is encountered at different steps of the data production process, it can be applied to diverse types of data (e.g., administrative, census, sample survey, geospatial) or modes of data collection (e.g., face-to-face interview, Computer-Assisted Web Interviewing). Most often, a NSO pursues integration to improve cost-efficiency, to have a more flexible data production system, and to add value to the collected data.
Data integration assumes different forms. For instance, the approach adopted for the European Social Surveys increases the cost-efficiency of the survey system by organizing the instruments of each survey into modules, which can be partially shared across the surveys. Instruments are administered to different sub-samples; however, when the instruments share the same modules or information strongly correlated to each other, the subsamples can be pooled together for joint inference. This method increases the potentiality of the data while reducing the overall response burden and total cost of the surveys [5, 6]. Statistics Netherlands responded to a decrease in the budget available for face-to-face interviews by making more extensive use of registers and administrative data, whose collection costs were lower than the equivalent survey-based data, and by combining several methods of data collection, including face-to-face, telephone, and internet surveys. Data is pooled together and analyzed using small area estimators or other model-based sample techniques [7]. In the 50x2030 Initiative, integration is achieved through (i) the coverage of both the household and non-household sector holdings; (ii) the adoption of a modular approach with core data collected annually and thematic instruments applied less frequently to sub-samples; (iii) the periodic addition of a socio-economic questionnaire to the agricultural questionnaire; and (iv) the periodic inclusion of rural non-agricultural households to the sample of agricultural households. In the 50x2030 Model, cost-effectiveness is achieved using rotating modules administered over time to different subsamples, so as not to collect data more frequently than needed. In addition, in the 50x2030 Initiative’s Integrated Agricultural and Rural Survey Program, cost-effectiveness and data value-addition are achieved by adding a socio-economic component and enlarging the sample to non-agricultural households [8].
The above-mentioned approaches to integration allow for more flexibility in the survey system. The modular approach, for instance, facilitates the introduction of new modules during the survey program. This offers the possibility of responding quickly to emerging needs of users in the data system [9]. Meanwhile, the combination of face-to-face interviews with new data collection modes permits the administering of new modules or questions on emerging phenomena quickly and in a cheap way [7].
Integration entails the harmonization of questionnaires and survey methodologies. The use of standard definitions, concepts, classifications, and metadata permits comparability of the information, thus the joint use of data from different samples. For instance, in Statistics Canada, overcoming a lack of consistency in statistical results due to poor harmonization across data sources has been an important driver of integration [10].
In Uganda, UBOS integrated the Agricultural and Social-Economic Panel Survey mainly to (i) avoid potential inconsistencies due to differing survey methodologies; (ii) establish a more cost-efficient approach in agricultural data production; and (iii) provide agricultural and socio-economic data in a coordinated manner.
(i) Avoid potential inconsistencies due to differing survey methodologies;
The AAS and UNPS instruments had a wide range of common topics. The information, however, was sometimes collected using different reference periods, classification systems, or levels of observation, which may lead to incomparable results.
Figure 1.
Production from main crops in first season 2018 (Tonnes).
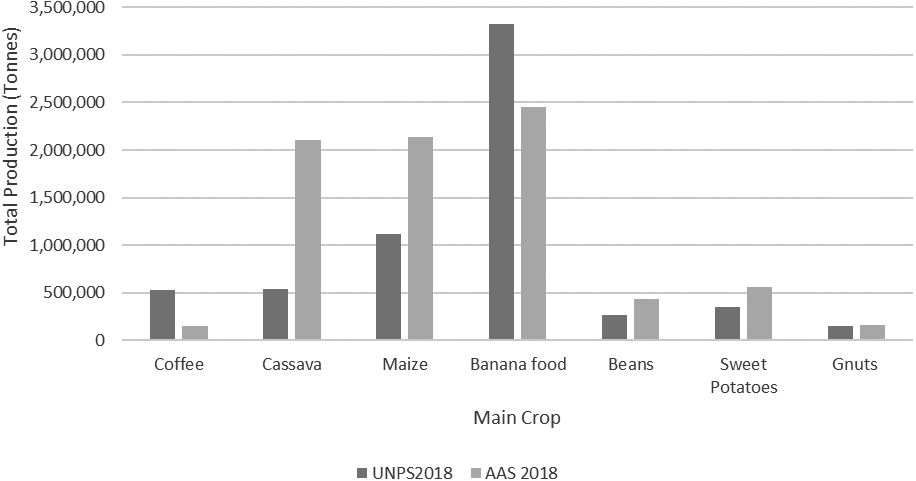
Figure 2.
Area under main crops in first season of 2018 (Ha).
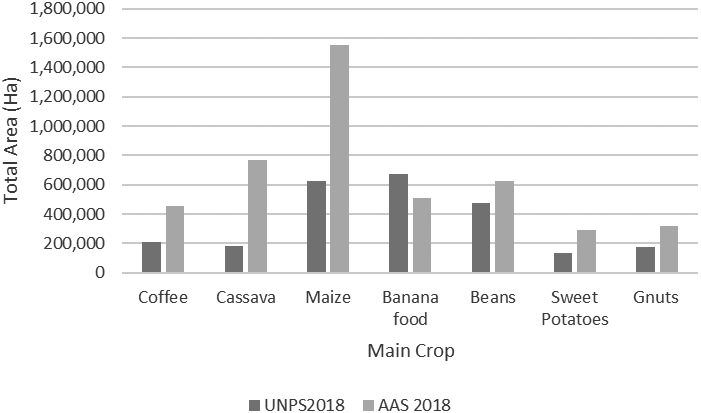
Figures 1 and 2 report the main crop area and total production for the first agricultural season of 2018 as presented in the statistical reports of the AAS 2018 and UNPS 2018/19. With the exception of banana-food and coffee, the production values of the AAS are higher than those of the UNPS and, with the exclusion of banana-food, the crop areas are larger in the AAS than in the UNPS. Despite there being no differences in the way the instruments of the two surveys collect information on crop area and total production, contrasting results can still arise from different recall periods, training provided to the enumerators on the way the data is collected, protocols for GPS area measurements, data cleaning and imputation procedures, estimation algorithms and other considerations. For instance, Wollburg et al. [17] find that farmers tend to report higher harvest quantities as the recall period gets longer, however, they may tend to forget some of their more marginal plots. A longer recall period, therefore, can result in higher production estimates per plot, but forgetting marginal plots may eventually result in lower total harvest estimates. Moreover, forgetting marginal plots, can result in lower estimates of the total crop area. One striking observation in the comparison of the UNPS and AAS survey methodology is the difference in the organization of the fieldwork and the length of the recall period for the agricultural input and output variables. The UNPS, indeed, used to visit each household once per agricultural season, approximately six months after the start of that season.44 The AAS used to visit the households twice per season, once at the end of the post-planting, and again at the end of the post-harvesting activities.
With integration, UBOS has harmonized survey methodologies, concepts, definitions, and classifications and will harmonize data processing and data analysis in the future months. Moreover, the integration will guarantee high-quality data by (i) adhering to international standards for concepts and definitions in all the survey domains; (ii) conforming to guidelines for the collection of household and agricultural survey data recommended by international survey programmes, such as the World Bank’s Living Standards Measurement Study (LSMS) Program, FAO’s AGRISurvey Program, and the Global Strategy to Improve Agricultural and Rural Statistics (GSARS); and (iii) embracing the 50x2030 Initiative Methods & Tools Development component, which aims to assess and incorporate objective methods of data collection to scale up the use of the same at the national level. Finally, the survey aligned the recall periods for the two samples.
(ii) Establish a more cost-efficient approach to agricultural data production;
The reduced survey costs of the UHIS are driven by a decrease of the data collection costs, which – in turn – are determined by a reduction of the number of survey visits, a smaller sample size, and the fact that the cross-sectional non-shared sample is covered every other year.
Table 1
Sample size and fieldwork cost: Dual system vs UHIS
| Total units per year | Annual cost | Cost in 10 years | |
|---|---|---|---|
| AAS & UNPS in parallel | 10,200 | 1,800,000 | 18,000,000 |
| UHIS ‘on years’ | 9,300 | 1,600,000 | 12,000,000 |
As depicted in Table 1, when the two survey programmes run in parallel (i.e., ‘dual system’), as in the past rounds, each year the AAS has a sample of around 7,000 agricultural households while the UNPS has a sample of around 3,000 households, totaling around 10,200 units.55
According to the existing plan, the UHIS has a sample of 9,288 units in the ‘on-years’ and 6,348 units in the ‘off-years’.66 The financial consequences of this schema are shown in Table 1.77 We observe that, while the dual system has an annual fieldwork88 cost of about US $1,800,000, the UHIS fieldwork would cost 1,600,000 in the ‘on years’ and US $810,000 in the ‘off years’. The savings increase if we adopt a long-term perspective, for instance, by evaluating the expenditures over ten years. It is worth noting that the saving holds even though the sample size of the panel has been considerably enlarged to increase its accuracy and be representative at a sub-regional level on the socio-economic estimates.
(iii) Provide agricultural and socio-economic data in a coordinated manner.
As in the AAS, the UHIS collects data from a representative sample of all agricultural holdings, both household and non-household, on topics like production, productivity, revenues and net returns, and farm practices. Similarly, to the UNPS, the UHIS integrates information on socio-economic and demographic topics like income, poverty, employment, and food security, covering also non-agricultural households in urban and rural areas to provide a full picture of livelihoods for the entire country. Thus, in line with the core principles of integration under the 50x2030 Initiative, the resulting data goes beyond the production of traditional agricultural statistics. This allows for analysis of the drivers of productivity and the interaction between socio-economic characteristics of the rural population, agricultural production methods, off-farm activities, and the environment with agricultural activities, amongst others.
The two surveys are described in Box 1.
| Box 1 The UNPS and AAS Surveys. | |
| The UNPS is an annual initiative started in 2009 as a follow-up to the Uganda National Household Survey 2005/6 to provide nationally and regionallyrepresentative household-level data on income and poverty dynamics in the interim years of the UNHS. Since its launch in 2009, the UNPS has conducted eight waves of data collection on a sample of about 3000 households. Its sample is representative at the national, rural-urban, and regional levels. | Launched in 1967/68 and revamped in 2017 after about 25 years of interruption, the AAS was restored and remodeled, to improve the accuracy and reliability of agricultural production estimates. The AAS is representative at the national level and for the ten agro-ecological zones of the country (ZARDIs), with the exclusion of Greater Kampala |
Figure 3.
The UHIS integrated sample.
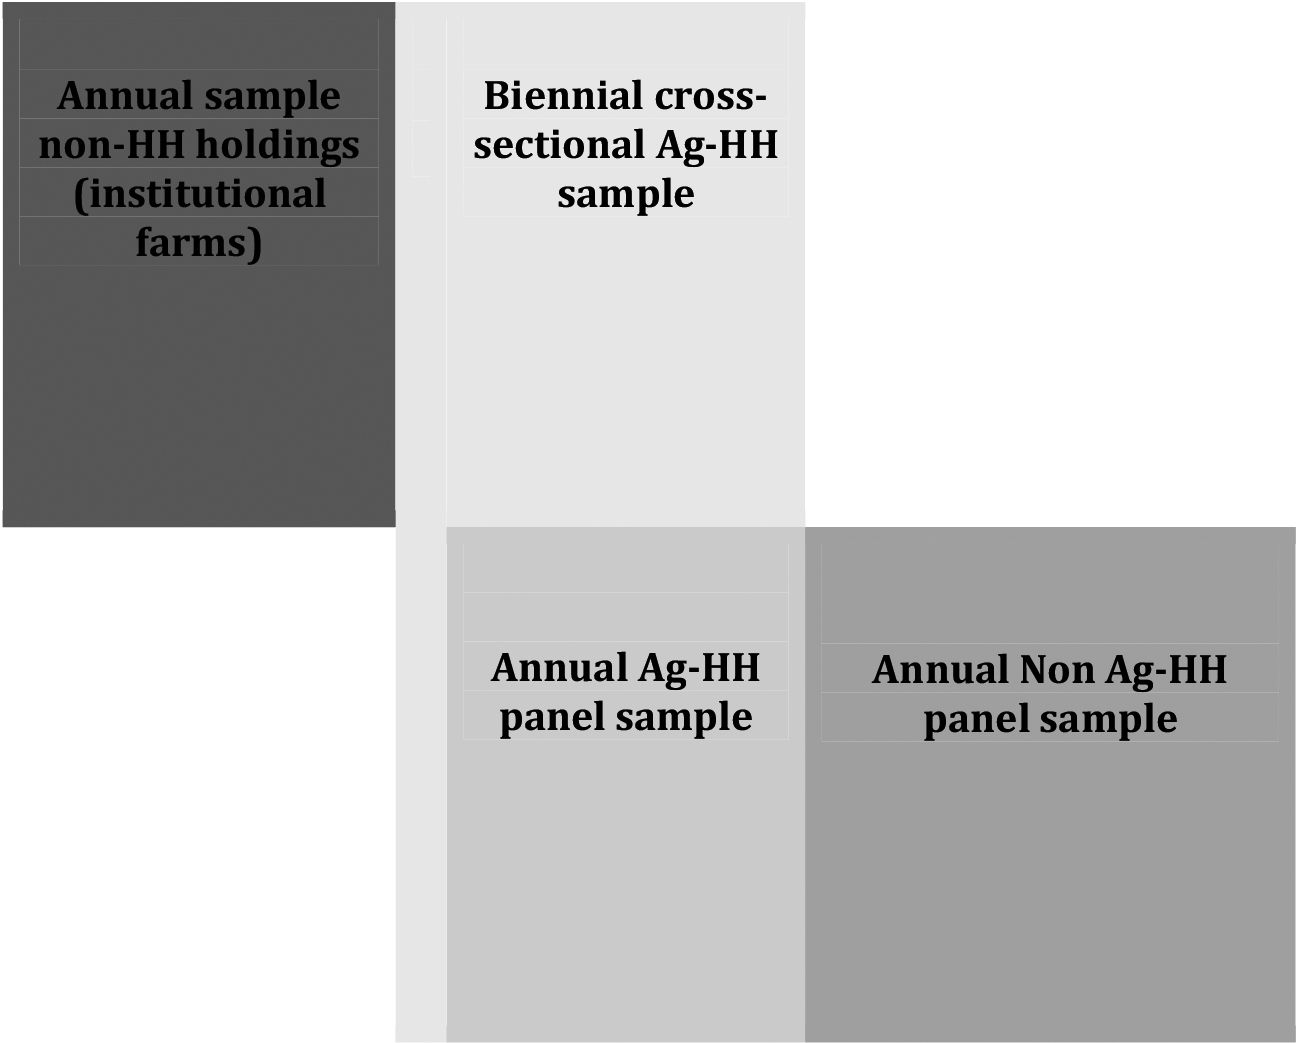
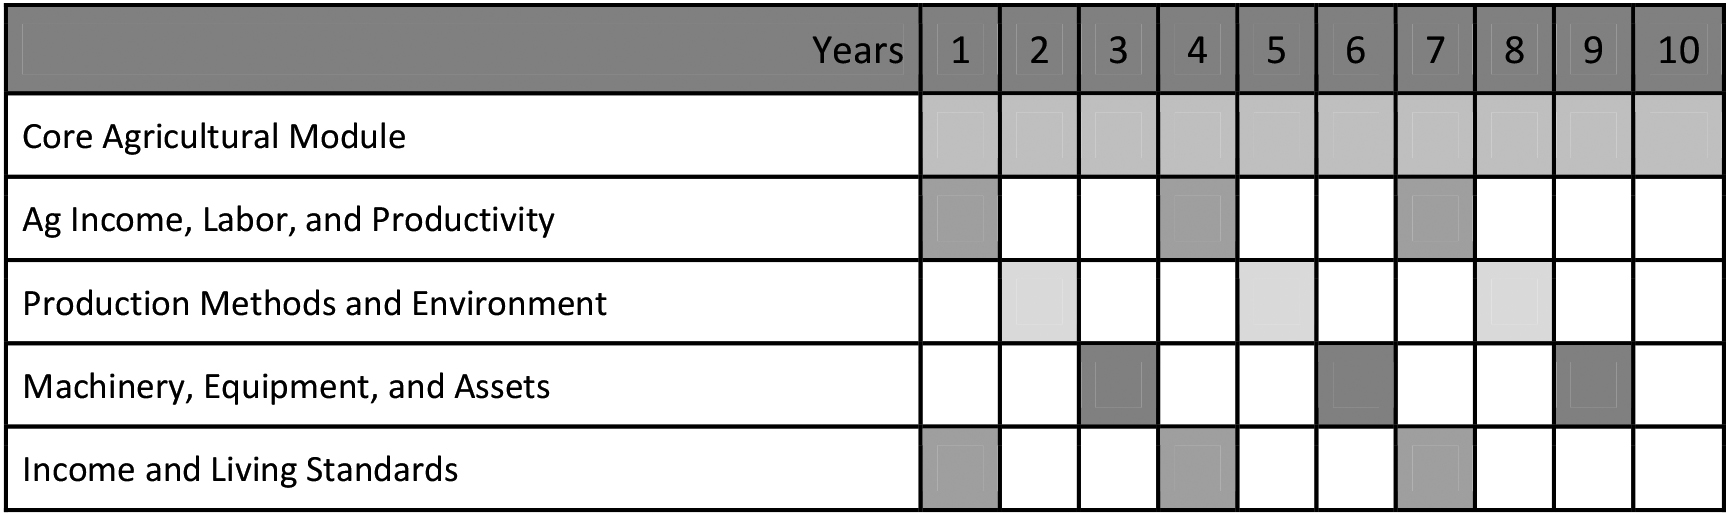
Figure 4.
Example of the 50x2030 Integrated Agricultural and Rural Survey Program.
The best way to describe the integration of the UHIS is to think of it as the integration of three samples (see Fig. 3 below). An annual sample of agricultural and non-agricultural households from urban and rural areas (i.e., an annual panel sample (APS)) is complemented every other year, with an additional sample of agricultural households (i.e., a biennial cross-sectional sample (BCS)). During the years of integration, the agricultural households in the APS and those in the BCS are analyzed in combination to generate more accurate agricultural estimates. Each year, agricultural and non-agricultural households in the APS are surveyed to gather information on livelihoods and other relevant socio-economic information. In parallel, an annual agricultural survey is run using a sample of non-household agricultural holdings.
The integration of the agricultural and the socio-economic survey program is framed under the Integrated Agricultural and Rural Survey Program of the 50x2030 Initiative, but is tailored to the specific country’s needs. The original Integrated model of the Initiative is based on a core module that collects information on agricultural production, which is complemented every three years by a thematic questionnaire that collects information on agricultural income, agricultural input and labor (i.e., the Agricultural Income, Labor and Productivity (Ag-ILP) questionnaire). Concurrently with the Ag-ILP, households receive a household questionnaire covering off-farm income and living standards. It is possible to refer to the years in which the households receive this full set of questionnaires as integration years, as opposed to the years in which only the agricultural survey is administered. The program is summarized in Fig. 4 below.
The Uganda model differs from the standard 50x2030 Integrated Model, first in terms of the periodicity of integration. Each year, a reduced sample (i.e., the panel) receives an agricultural questionnaire based on the Initiative’s Ag-ILP and a socio-economic questionnaire. In parallel, an Ag-ILP type of questionnaire is administered to the sample of non-household agricultural holdings. Every other year, the panel sample is complemented by the BCS (receiving the same Ag-ILP questionnaire). The periodicity with which complementary rotating modules are administered are yet to be programmed. The second difference between the 50x2030 Initiative standard model and the UHIS is in the fact that the reduced annual sample is a panel. The third feature of the Uganda model is that the households in the panel receive a consumption module as part of the household questionnaire, which permits the study of poverty dynamics over time. The last feature of the UHIS is the inclusion of non-agricultural urban households, which allows for the monitoring of poverty and reporting on SDG 1.
Figure 5.
The Uganda Harmonized and Integrated Survey Programme calendar. (*) panel of agricultural and non-agricultural households. (**) cross-sectional sample of agricultural households.
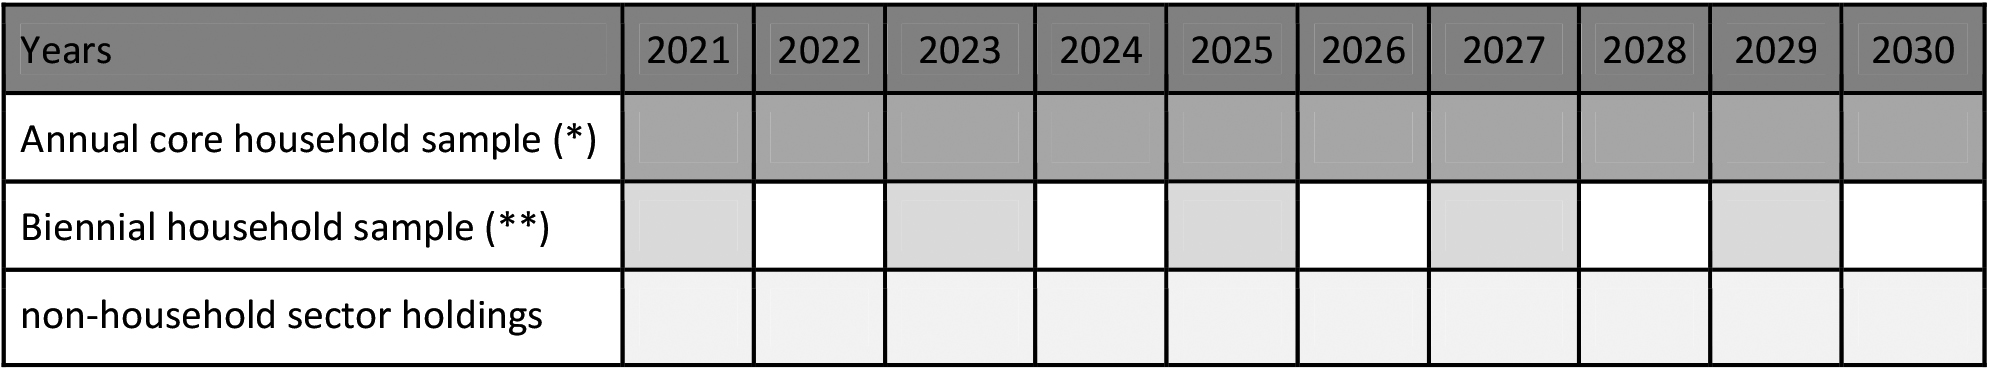
Figure 5 shows the survey calendar of the UHIS program over ten years.
In conclusion, the Uganda model shares the aspirations and principles of the Initiative’s Integrated Agricultural and Rural Survey Program, but it adapts the standard model to the country’s needs, objectives and its long-lasting agricultural and socio-economic survey tradition. The UHIS model is more complex than the 50x2030 integrated model and was possible thanks to an already advanced survey system, and the existence of technical skills and infrastructures within UBOS. However, this remains an accomplishment of the Initiative, which generally provides concrete and programmatic solutions to countries where the statistical systems are less advanced. The relevance of the 50x2030 Initiative for UBOS can be seen in the extent to which it has enabled UBOS to integrate two survey programs in a programmatic and cost-efficient way and introduced good practices and support to strengthen the capacity of the country in producing, analyzing, and using survey data for evidence-based decision making.
3.Synergies and challenges: Steps and phases of the integration
3.1Sample integration
The literature on survey integration recognizes the benefits of integrated sampling strategies, highlighting the substantial reduction in survey costs, especially if the surveys to be integrated show a non-negligible overlap among the populations of interest, if they use similar sampling methods, or they have interlinked measurement objectives [11, 12, 13]. The UHIS inherited the objectives of the Annual Agricultural Survey and the National Panel Survey. One of the main challenges was the need for agricultural and socio-economic statistics at the sub-national level while controlling the sample size and the cost of the survey program. In addition, UBOS intended to cover the entire agricultural sector, including the non-household sector holdings. The sampling design of the survey was developed with these objectives in mind. In particular, the sampling approach of the household component was inspired by the integrated sampling methodology developed under the 50x2030 Initiative for integrated rural and agricultural surveys [11]. Table 2 below summarizes the main elements of the integrated design of the UHIS.
Table 2
Main elements of the integrated design of the UHIS
| Elements | UHIS components | ||
|---|---|---|---|
| Annual shared sample (panel) | Biennial non-shared sample (cross-sectional) | Non-household sector holdings | |
| Observation units | Agricultural and non-agricultural households | Agricultural households | Agricultural holdings |
| Final sampling units | Households | Agricultural households | Agricultural holdings |
| Frames | List of EAs sampled for the Uganda National Household Survey (UNHS) and lists | List of non-household farms | |
| of households in the sampled EAs | developed from registers and field operations | ||
| Sampling method | Stratified two-stage | Stratified one-stage | |
| Domains of inference |
| (Once combined with the panel) Sub-region |
|
| Stratification | Urban/rural (implicit stratification) |
| |
| Sampling scheme | 1 | 1 | Simple Random Sampling without replacement within each stratum |
| Sample size calculation | Target variables socio-economic component: chronic poverty rates, electricity |
| |
| use rate, ownership of enterprise | |||
| Target variables for agriculture: value of crop production, agricultural area, | |||
| number of livestock | |||
Of the elements above, those requiring more discussion were the domains of inference and the sample size calculation, given their direct impact on survey costs.
Ultimately, UBOS chose to generate sub-regional socio-economic statistics and regional-level agricultural statistics on a yearly basis, and sub-regional agricultural statistics every two years. As a result, the sampling methodology for the household sample has been designed in a way that:
1. During the ‘on-years’, the total sample (APSl
2. In the ‘off-years’, the APS can provide agricultural statistics representative at the regional level and socio-economic statistics representative at the sub-regional level.
In the first year of the UHIS (UHIS 2021/22), the target variables considered for the socio-economic component in each domain of inference (i.e., the sub-regions) were chronic poverty rates (2016–2020), electricity use rate, and ownership of enterprise (for Kampala only). In each domain of inference (region for the panel; sub-region for the total sample), the target variables for the agricultural component were the value of crop production, the agricultural area, and the number of livestock (in tropical livestock units).
A minimum sample size for acceptable estimations was calculated with each target variable, through an assessment of its variability in previous surveys (AAS 2018, UNPS 2016–2020). The maximum sample sizes of the target variables’ specific for each component was then considered in each domain of inference. For each component, adjustments were performed in a few domains by excluding very heterogeneous target variables and slightly increasing the maximum expected error to keep the total sample size at an acceptable level.
Ultimately, in each domain
(1)
A sample of 12 households is expected to be selected in each sampled Enumeration Area (EA), therefore the sample size of EAs (
(2)
The sampling scheme adopted by the country involves the selection of the integrated panel sample of EAs as a subsample of the total sample of EAs. Since the EAs of the APS and the BCS are different, a conservative and convenient solution was to calculate the sample size of the full sample in an integrated way using Eq. (1) and the sub-region as inference domain for agriculture. If, in a sub-region, the size of the full sample is lower than the panel sample size, the integrated panel sample size is simply considered adequate and no additional EAs are selected. The UHIS sample size is summarized in Table 3 below.
Table 3
UHIS sample size
| Region | Sub-region | Number of EAs | |||
| Sample size UHIS (EAs) | Number of shared EAs (UNPS | Only UNPS EAs | Only AAS EAs | ||
| Kampala | Kampala | 23 | 23 | ||
| Central | Buganda South | 54 | 54 | 0 | |
| Buganda North | 75 | 40 | 35 | ||
| Northern | West Nile | 48 | 36 | 12 | |
| Lango | 65 | 35 | 30 | ||
| Acholi | 32 | 23 | 9 | ||
| Western | Kigezi | 66 | 47 | 19 | |
| Bunyoro | 57 | 31 | 26 | ||
| Tooro | 46 | 30 | 16 | ||
| Eastern | Busoga | 52 | 42 | 10 | |
| Teso | 81 | 31 | 50 | ||
| Bukedi | 38 | 26 | 12 | ||
| BugisElgon | 38 | 28 | 10 | ||
| Karamoja | Karamoja | 49 | 49 | 0 | |
| Western | Ankole | 50 | 34 | 16 | |
| Total (EAs) | 774 | 506 | 23 | 245 | |
| Total (Households) | 9,288 | 6,072 | 276 | 2,940 | |
The simulations on the integrated sample started quite early in the process and required several interactions. Notwithstanding, some challenges arose in the process:
(i) The household listing in the EAs sampled for the UNHS happened quite early in the process and the survey launch was delayed due to the COVID-19 pandemic. As a consequence, the lists are expected to be slightly outdated, which may result in an increased non-response rate;
(ii) the objectives of the socio-economic survey became more ambitious, entailing the revision of the total sample size and the size of the shared sample;
(iii) communication between sampling experts was challenged by distance, virtual sessions, and conflicting timelines.
Non-household sector
As mentioned above, an important feature of the UHIS is the inclusion of non-household sector holdings in the survey.1010 Recognizing the importance of this sector for the calculation of comprehensive agricultural statistics and the estimation of SDG indicators 2.3.1 and 2.3.2, the required effort was made to add non-household sector holdings to the survey.
The work undertaken to integrate the non-household sector holdings in the survey program followed the good practices and lessons learned from other countries documented by 50x30 Initiative [11], and Bako et al. [12, 13]. As frequently happens in developing economies, the main aim of the process was the development of an accurate frame that was complete, recent, and not overlapping with the household sector. In Uganda, the key difficulty was given by two interlinked issues: (i) the fact that corporations operating in the agricultural sector rarely have an official registration number, thus they appear neither in the national business register nor in other administrative registers; and (ii) the absence of reliable and recent lists of non-household sector farms. In addition, the presence of unregistered ‘quasi-corporations’ creates a high risk of overlap between the household and non-household sector frames.
Development of the sample frame for the non-household sector was organized in two steps. First, UBOS prepared a provisional list of farms based on inputs from the District Agriculture Officials (DAOs). Then, a field screening was organized.
For developing the provisional list of farms, UBOS set up consultations with the DAOs during the fieldwork of the AAS 2019. On this occasion, supervisors met the DAOs and asked them to list the corporations, quasi-corporations, cooperatives, governmental institutions, non-profit organizations, and tribes/clans operating land or raising livestock in their districts. The consultation resulted in a provisional list of approximately 3,000 farms.
Subsequently, UBOS and FAO developed a light screening questionnaire to better understand the characteristics of the farms in the provisional list and verify that they belonged to the above-listed categories. The questionnaire was organized into five sections:
I. The geographical location of the holding. It collects the exact geographical location of the farm, including GPS coordinates. This information is important to efficiently locate the farm if it is included in the sample.
II. Identification of the entity responsible for the holding. If the holding is a civil person/natural person or a group of civil persons/natural persons, it collects the name and phone number of the holder. As above, this information is important for reaching the holder, if the farm is included in the sample.
III. Identification of the holding. In addition to registering the business name of the holding, it collects the holding’s legal status,1212 its official registration in the national business register (if available), and the presence and location of and secondary branches. The registration number helps identify the registered corporations and quasi-corporations and understand the prominence of unregistered quasi-corporations on the registered corporations. The information on the secondary branches helps avoid duplications in the frame.
IV. Information on the respondent. This includes the position of the respondent on the holding and contact information.
V. Agricultural activities of the establishment/ holding. It collects general information on the activities of the farm, including the area planted the previous season, the number of animals raised, and the availability of records or registers on crop and livestock activities. The area planted and the number of animals can be used for stratification purposes while the record availability is fundamental to understanding if and how the survey questionnaire for the non-household sector shall differ from the survey questionnaire for agricultural households.
The field screening occurred in November and December 2021. It will be followed by the analysis of the data and frame development. Based on the final number of holdings in the frame, UBOS will decide between a full enumeration of the farms or a sampling.
During the analysis, special attention shall be devoted to analyzing the unregistered quasi-corporations. In the absence of an official registration number, such unincorporated enterprises owned by households may overlap with the frame of agricultural households, thus they should be excluded from the non-household sector frame. However, they could also be used to develop a separate stratum of large farms.
The survey calendar for the non-household sector holdings will be different from the calendar of the main survey. Indeed, non-household sector farms will be visited only twice, at the end of each season. This is done under the assumption that non-household sector farms keep track of the agricultural activities (including the area planted under different crops); therefore, they do not require objective area measurement and frequent visits. The survey questionnaire will be adapted in line with this approach. The survey cycle 2021/22 will be useful for testing the validity of these assumptions. If necessary, the instrument will be amended for future survey cycles.
3.2The questionnaire integration
Most of the survey integration experiences reviewed in the literature have the standardization and harmonization of instruments, concepts, definitions, and classifications in common. Many of them have a modular approach with part of questionnaires (modules) applying to different subsamples. As discussed in Section 2, this approach minimizes costs and allows for more flexibility in the survey system.
The standard model proposed by the 50x2030 Initiative is modular. It comprises a core agricultural module and a set of add-on modules administered on a rotational basis in the course of the survey program and involving different samples.
The UHIS survey partially builds on the instruments of the 50x2030 Initiative and fully adopts the principle of different tools administered to distinct (sub)samples.
The UHIS consists of:
i. A shared agricultural questionnaire, which adapts the Ag-ILP questionnaire of the 50x2030 Initiative to the specificities of the country (e.g., the Uganda tenure system) and of the survey program (e.g., detailed information on seed varieties is included to complement the data from the objective measurement component). A customized version of the same is administered in the sample of non-household agricultural holdings.
ii. A broad socio-economic questionnaire to be administered in the annual panel sample comprising modules on consumption, food security, energy use, and others, beyond the income, housing and socio-demographic modules prescribed by the initiative. A selected set of questions from the panel HH questionnaire became a mini-household questionnaire, to be administered to the BCS. Maintaining design and standards across the two samples allows for consistency and comparability and could allow for survey-to-survey imputation or other data integration statistical methods.
iii. Finally, the UHIS inherits the women’s health and a community questionnaires from the UNPS. These are administered in the annual panel sample.
The full set and the respective samples for the UHIS 2021/22 are summarized in the box below:
| Box 2. The UHIS 2021/22 survey tools |
|
|
The harmonized agricultural questionnaire
The harmonized agricultural questionnaire is at the core of the integration of the socio-economic and agricultural survey into the UHIS. The FAO and World Bank teams worked with UBOS to customize the 50x2030 Initiative’s Ag-ILP questionnaire to the country context. The original AAS and UNPS agricultural questionnaires were reviewed to set up a series of harmonized concepts, definitions, codifications, and structures to be adopted by the UHIS common agricultural questionnaire. The final product is a very detailed and sophisticated instrument whose success was facilitated by the fact that the instruments previously adopted by the two survey programmes already adhere to best practices and high data collection standards.1313
The UHIS agricultural survey tools capture the major components of agricultural production (crop, livestock, aquaculture and forestry), and complement it with information on land tenure, use of inputs, labor, the value of agricultural production, agricultural production costs, agricultural income and gender differentials in decision-making, productivity, and management. The questionnaire is also designed to produce sex-disaggregated data that is crucial for understanding gender dynamics and women’s engagement in a country’s agricultural sector. The data includes land rights; participation in agricultural advisory services, training, and producer groups; intra-household decision making over agricultural production; and labor participation.
The agricultural questionnaire includes three subsets of modules covering different recall periods. The aim is to collect these at different moments of the survey period. The first two subsets of modules are seasonal, thus they are administered once per agricultural season. The first collects information on post-planting activities, agricultural land and crops planted; the second covers harvest and post-harvest activities (namely, harvest use and harvest processing) for seasonal and permanent crops. This structure helps respondents remember their activities, assures accuracy of data on agricultural activities affected by seasonality, and allows for GPS land measurement. Agricultural activities somewhat less affected by seasonality, or whose seasonality is very different from that of crops, such as livestock, aquaculture, and forestry, are covered in the post-harvest visit of the second agricultural season, with a reference period of 12 months.
The information on land and input use is collected at the plot level, while temporary crops production is collected at the plot-crop level. These levels of disaggregation facilitate the agricultural productivity analysis. Notwithstanding, the sections on crop labor inputs, seeds, fertilizer and chemicals, and livestock labor inputs were aggregated to the individual, crop, item, and worker-type level, respectively. This solution reduces interview time and strikes a balance between implementation feasibility, costs, and data quality. The modules, their periodicity, and levels of observation are summarized in Table 4. The agricultural questionnaire produced for the UHIS 2021/22 will be used also in future years, although some revisions may occur.
Table 4
The agricultural questionnaire
| Topics and questionnaire modules | Level of data collection |
| Post-planting modules (duplicated for seasons 1 and 2) | |
| Land use and Crop Production | |
| 1. Agricultural Parcel Roster | Parcel |
| 2. Plot Roster and Details | Parcel-Plot |
| 3. Crop Roster | Parcel-Plot-crop |
| 4. Seed Use and Acquisition | Crop |
| Post-harvest modules (duplicated for seasons 1 and 2) | |
| Agricultural Inputs and Crop Production | |
| 1. Input use | Parcel-Plot |
| 2. Input Roster | Crop |
| 3A. Labour Input – HH | Individual |
| 3B. Labour Input (HIRED & EXCHANGE) | Worker Category |
| 4A. Temporary Crop Production | Parcel-Plot-Crop |
| 4B. Field (Temporary) Crop Disposition | Parcel-Plot-Crop |
| 4C. Tree and Permanent Crop Production and Disposition | Crop |
| 12-Month Recall Modules | |
| Processed Crop Production | |
| 4D. Processing crop production | Parcel-Plot-Crop |
| Livestock Production | |
| 4A. Livestock – Ownership | Livestock Type |
| 4B. Livestock – Change in Stock (Ruminants) | Livestock Type |
| 4C. Livestock – Change in Stock (Poultry) | Livestock Type |
| 4D. Livestock – Breed, Housing, Feed | Livestock Category |
| 4E. Livestock – Labour | Worker Category |
| 4F. Livestock - Health | Livestock Category |
| 4G. Livestock – Milk Production | Livestock Type |
| 4H. Livestock – Egg Production | Livestock Type |
| 4I. Livestock – Other Livestock Products | Product Type |
| Aquaculture and Forestry | |
| 7A. Aquaculture Production | Product Type |
| 7B. Aquaculture Labour | Worker Category |
| 8A. Forestry Production | Product |
| 8B. Forestry Labour | Worker Category |
| Other Agricultural costs | |
| Other Costs | Cost Type |
| Other relevant agricultural modules | |
| 10. Facilities | Facility type |
| 11. Transport | Transport mean |
| 12. Information on Agriculture | Ag info type |
| 13. Extension services | Source of service |
The non-household sector questionnaire
The agricultural questionnaire for the non-household sector farms will be based on the questionnaire developed for the household sector, but it will be adapted to take into account the specific survey calendar of this sample. For instance, it will not be divided into a post-planting and a post-harvest questionnaire, because these farms will be visited only one time per season, after the post-harvest activities. The field screening required for developing the frame of this sector will allow for the collection of basic information on the use of farm registers. This information will be used to further adapt the existing instruments for the non-household sector.
3.3The CAPI application
The development of the Computer-Assisted Personal Interview (CAPI) application for the UHIS 2021/22 has been an important element of the integration and a learning opportunity for all actors involved in the process. To succeed in transitioning from paper questionnaires to CAPI, the group embraced good practices, developed synergies, and adopted innovative ways of working together.
The CAPI application, developed in Survey Solutions Software (SuSo) developed by the World Bank, is based on two key principles:
1. It contains all the survey questionnaires required throughout the survey cycle for the sample of households – i.e., the post-planting and post-harvest questionnaires of seasons 1 and 2, the annual agricultural questionnaire, and the household, nutrition, and women’s questionnaires.
A filter variable determining the ‘visit type’ defines which questionnaires are enabled. For instance, in visit 1 agricultural households receive only the post-planting questionnaire. Therefore, during this visit, this questionnaire is enabled while the others are blocked.
This approach has advantages and constraints. On the one hand, it avoids preloading data across visits, which requires data manipulation and does not fit well with the fieldwork calendar of the shared annual sample (i.e., continuous data collection across the 12 months). On the other hand, it requires the implementation of complex rules to feed-forward members, parcels, plots, and crops from one visit to another. In addition, it complicates the development and testing of the application, due to the many different scenarios requiring simulations. Finally, hosting all the questionnaires in one application increases the chances to reach the maximum capacity of a SuSo questionnaire.
2. One application has been developed for the shared annual sample and the non-shared biennial sample.
A filter variable determining the ‘sample type’ is preloaded during the creation of the assignments defining which questions are enabled. For instance, agricultural households in the non-shared biennial sample are not administered the full household questionnaire; they only respond to key socio-demographic questions on the household and its members. Therefore, if the sample type is the ‘biennial cross-sectional sample’, most of the household questionnaire is blocked and only a few questions are active. This approach ensured the consistency of the survey instruments across the samples.
Due to the presence of several questionnaires and different samples CAPI development required advanced skills and careful testing. In addition, it emphasized the importance of adopting good practices and innovations.
In terms of good practices, the team decided to centralize the Paper-and-Pencil Interviewing (PAPI) and CAPI questionnaires and to maintain a rigorous consistency between the paper and the electronic questionnaires. So, the updates to the paper questionnaires were applied by a dedicated person after clearance by the team; the CAPI application was managed by one developer at UBOS and changes requested in CAPI were implemented only after modification of the paper questionnaires. In addition, enabling conditions and validation rules were reported in the paper questionnaires for their implementation in CAPI and the paper questionnaires were stored in a shared drive, allowing everyone to access the latest versions at any time.
Speaking of innovations, the development of the CAPI application was inspired by the AGILE methodology that is commonly used in software design. The AGILE approach promotes continuous iteration of development and testing and requires constant collaboration between teams. In Uganda, the AGILE approach was based on three elements (see Fig. 6):
Figure 6.
AGILE approach for the UHIS CAPI application.
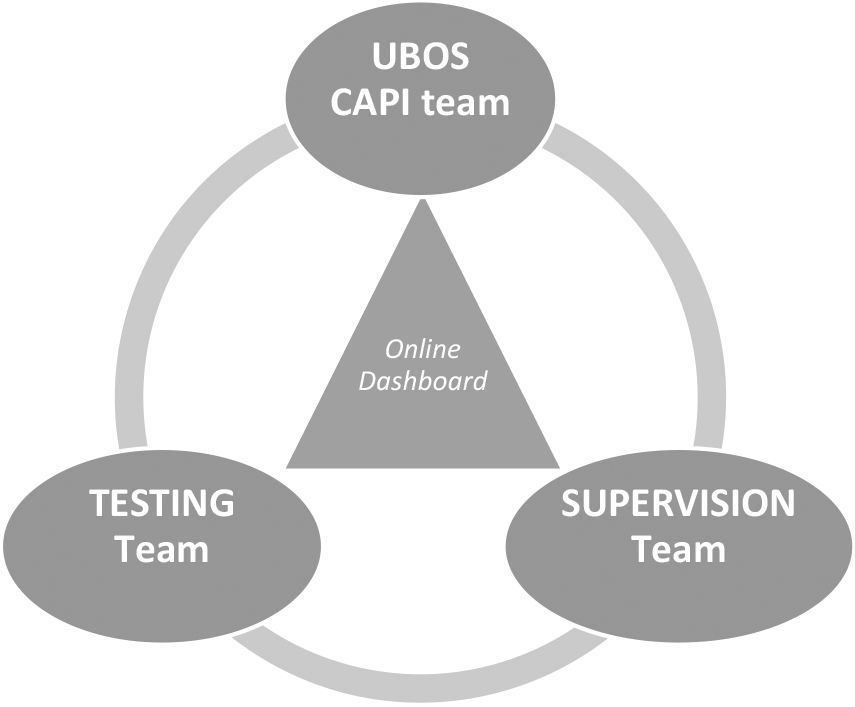
• UBOS CAPI developed (supported by the WB CAPI team)
• Testing team
• TRELLO an online platform, that organizes projects into board facilitating collaboration.
The UBOS CAPI developer was responsible for designing and updating the application based on the comments of the testing team and the advice of the World Bank CAPI team (if necessary).
The testing team was responsible for testing the CAPI application. It comprised three types of members: (i) CAPI developer; (ii) questionnaire experts; and (iii) enumerators. These members contributed to the test bringing in different perspectives; therefore, their comments complemented each other. For instance, the CAPI developers tested the application to see if it worked as intended. The questionnaire experts, knowing how the survey should be administered, were the best placed to determine if the application met the survey’s needs and gave final approval to the proposed changes. The enumerators checked the completeness of the application with the paper questionnaire in hand and evaluated the “readability” of the questions. In Uganda, in-office testing was just as important as field tests. It allowed the CAPI team to ensure not only that all the skips and validations were correct but also that, more broadly, the application met expectations.
Finally, the CAPI development benefited from a dashboard (TRELLO) that made the work more visible, better organized, and more interactive (see Fig. 7).
Figure 7.
TRELLO dashboard.
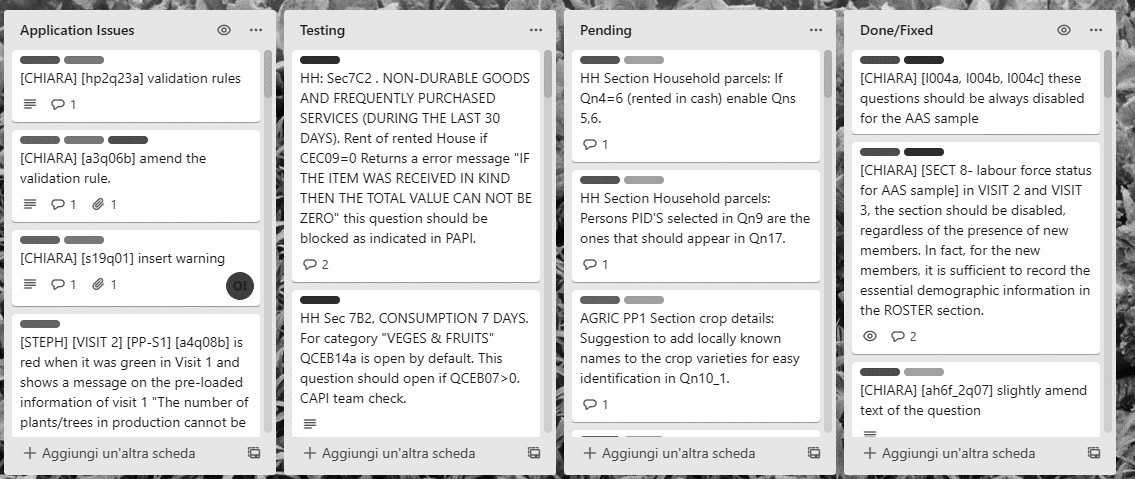
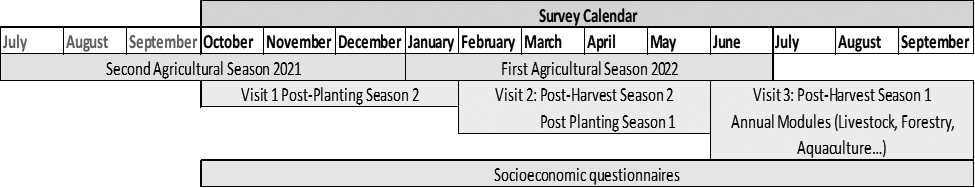
Figure 8.
Survey modules administration.
3.4Field work integration
The fieldwork of the UHIS is conceived to be implemented by each directorate in an independent but coordinated manner. To ensure the comparability of the results, the calendar of data collection needs to be aligned to assure internal consistency in the recall and reference periods for the key metrics. Fieldwork planning difficulties were mainly due to: (i) the need to consider the seasonality of consumption; (ii) the desire to retrieve estimates pertinent to the agricultural year; (iii) the desire to minimize the recall periods for the main agricultural activities (i.e., post-planting and post-harvest), assuring a timely presence in the field for GPS land measurement data collection; and (iv) the desire to minimize the total cost of survey operations. On top of that, the fieldwork management was designed in such a way that the two teams were working in an integrated way.
On the one hand, high-quality data on consumption for yearly poverty measurement requires a 12-month survey calendar, because food consumption and expenditure data is subject to fluctuations related to the time of the year it is collected. If not properly considered in the survey design, seasonal patterns depending on the agricultural season, holidays or festivals can introduce significant bias and measurement errors in consumption data. If the intention is to represent habitual consumption over the year, the best practice to factoring seasonality in consumption survey design is to conduct one visit per household spreading the sample over the 12 months of fieldwork, while splitting the overall sample into 12 monthly subsamples in such a way as to allow for an overall sample stratified into quarterly representative subsamples (FAO and World Bank [16]). The implication is that the APS component needs to have continuous data collection.
On the other hand, appropriate collection of agricultural data entails visiting the household the closest to the end of the post-planting and the post-harvest activities. Wollburg et al. [17] demonstrate that non-random measurement error in survey-based estimates of key agricultural input and output data is a function of the length of the recall period. To improve agricultural data reliability, the authors recommend implementing two visits, one in the post-planting and one in the post-harvest. In the Uganda setting, characterized by two equally important agricultural seasons, it would be ideal to visit the household four times, twice per season. If budget or organizational constraints do not allow for a four-visit approach, it is key to administer the post-planting module before the harvest is complete to ensure reliable area measurement.
As mentioned above, the Uganda agricultural year consists of two seasons. Planting activities of the first one start in February/March, while its harvesting activities end in June; planting activities for the second season start in July/August, and the harvest is generally completed by December. Ideally, the fieldwork of the UHIS would have been organized in a way to cover the agricultural year from January to December. Data collection of livestock activities would have been organized in a way to refer to the same agricultural year.
Budget limitations implied that the UHIS 2021/22 adopted a three visit scheme: during the first visit, planned for the end of planting activities of the first surveyed season, the post-planting module is administered; in visit two, occurring towards the end of planting activities of the second surveyed season, the post-harvest modules of the previous season would be administered along with the post-planting modules of the second surveyed season; in visit three, programmed to start at the end of the second survey season, the post-harvest of the second surveyed season and the annual modules would be implemented in the field. The provision of annual modules in the third season guarantees an approximate overlap of the survey period of the crop with the other agricultural activities and, consequently, consistency in the result. The socio-economic modules are planned to be administered over a 12-month survey period.
Figure 9.
Fieldwork schedule for the APS.
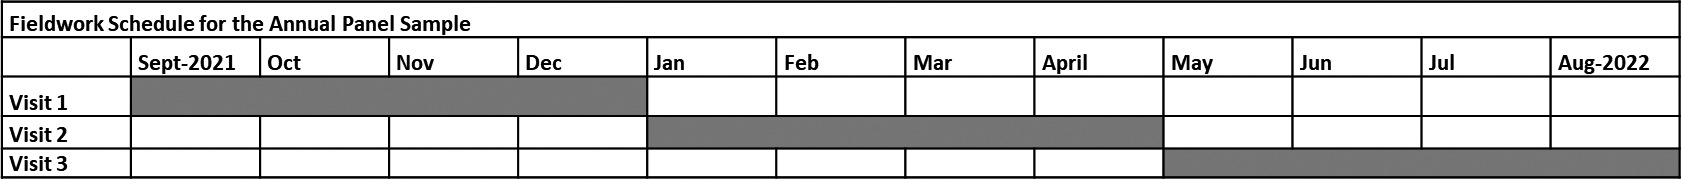
Figure 10.
Fieldwork schedule for the BCS.
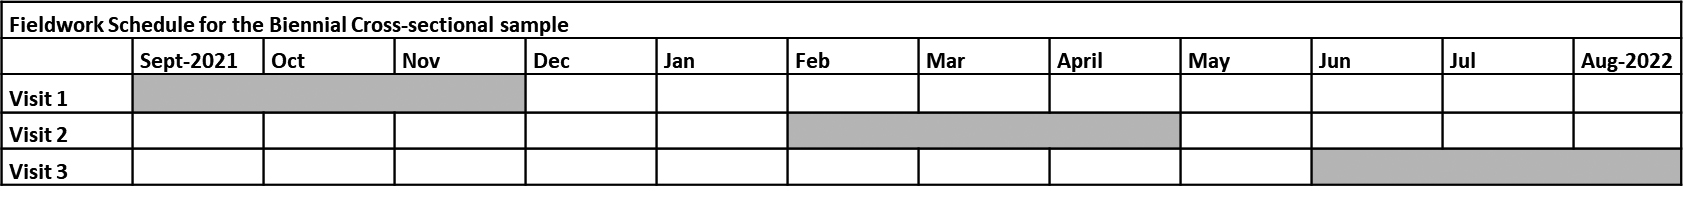
Figure 8 illustrates the three-visit approach adopted in the UHIS 2021/22.
Before the start of the fieldwork, APS households are assigned, at random, the month in which they would receive the full household questionnaire for the first and only time during the integrated survey fieldwork. In each month, there are one-third of households from each UNPS EA in which the full household questionnaire is administered.
For the APS, which receives the socio-economic component of the survey, the collection of the agricultural data is driven by the consumption-related visits and is planned over the full 12-month period as well. For the BCS, which is free from consumption-related considerations, the fieldwork is envisioned to span nine months.
The UHIS fieldwork activities were initially planned to start in May 2020 and end in April 2021, to cover the 2020 agricultural season. However, due to the COVID 19 pandemic, the survey activities were shifted, starting in May 2021 and due to end in April 2022.
In addition, due to the Livestock Census 2021, all resources, especially vehicles and staff at UBOS, were dedicated to ensuring that the livestock census was a success. The UHIS fieldwork activities were shifted to start in October 2021 and will end in September 2022. The fieldwork is still be conducted in three phases. Visit 1 starts at the end of the second season planting period. Visit 2 starts at the beginning of the second season harvest period. Finally, Visit 3 starts at the beginning of the second season planting period. While the annual panel sample fieldwork is implemented over the full 12-month period, the biennial cross-sectional sample fieldwork is envisioned to span nine months, as depicted in Figs 9 and 10.1414
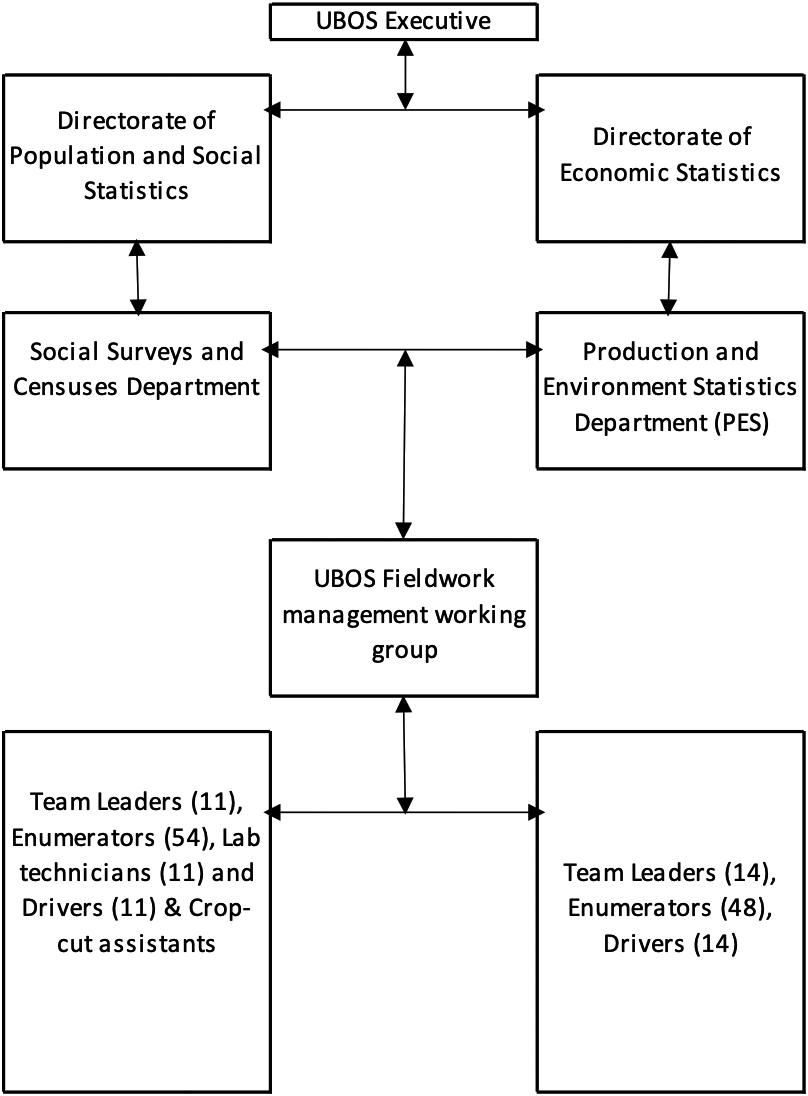
Field work management and supervision
Parallel and coordinated fieldwork implied extra effort in terms of fieldwork management supervision. The overall survey supervision is done by the UBOS executive director in dialogue with the directors of the Directorate of Population and Social Statistics and the Directorate of Economic Statistics. The two Directorates appointed a fieldwork management working group composed of staff members from the Social Survey and Census Department and the Production and Environment Statistics Department which are involved firsthand in the design and implementation of the UHIS. The working group assured the adoption of a common principle, practice, and guidelines in the technical and operational aspects of the survey, including but not exclusively: (i) the design of the fieldwork, (ii) the training materials and modalities, (iii) the sample allocation and assignation of households to interviewers; (iv) integrated survey and data management systems with common guidelines for interviews and data validation. Finally, the working group works closely with the leaders of the interview team, providing the needed operational supports. Figure 11 summarizes the fieldwork management structure.
Figure 11.
Fieldwork management and supervision.
4.Methodological innovations
There are two main ways in which methodological innovations have been incorporated into the design of the UHIS. First, in view of (i) the agricultural household survey sample that is shared by the APS and BCS; (ii) the use of the same agricultural questionnaire by both surveys (samples); and (iii) the ‘light’ household questionnaire administered to the BCS with questions that are identical to those included in the more detailed APS household questionnaire, a range of methods will be considered under the domain of statistical matching (D’Orazio et al. [18]) to derive for the BCS households predicted measures of socio-economic variables that are otherwise only observed in the APS. The candidate socio-economic variables that will be the focus of this type of experimentation will be total annual household consumption expenditures per adult equivalent (i.e., the continuous variable that underlies Uganda’s monetary poverty indicator) and total annual household income.
The second area of methodological innovation in the UHIS will be the adoption of objective survey methods in the collection of agricultural survey data. Over the last decade, methodological survey research conducted in low-income countries, including in Uganda, has revealed non-classical measurement error (NCME) in self-reported agricultural survey data, including on cultivated plot areas [19, 20, 21, 22, 23], crop production and yields [24, 25, 26]), and cultivated crop varieties [27, 28, 29]. The literature has showcased how NCME can bias not only the ensuing multivariate analyses that hinge on this data but also the policy implications of research. Consequently, the calls have been intensifying for the adoption of direct, objective measurement methods, such as GPS-based land area measurement, crop cutting, and DNA fingerprinting-based crop varietal identification, in capturing agricultural survey data.
Against this background, and with support from the Methods & Tools Development Component of the 50x2030 Initiative, the UHIS will also adopt the use of objective methods within the sample of rural panel UHIS households for (i) improved crop area, maize area and maize yield estimates – via collection of GPS-based plot outlines and crop cutting on the ground, combined with satellite-based methods for high-resolution mapping of these outcomes across Uganda; and (ii) objective crop variety identification – via DNA fingerprinting. This component of the UHIS is formally known as the Uganda National Study on Objective Measurement in Agriculture (UNOMA) and builds on the experience of UBOS with the Methodological Experiment for Measuring Maize Productivity, Soil Fertility and Crop Variety (MAPS), which was conducted in the first seasons of 2015 and 2016 [26, 30] with support from the World Bank LSMS and the CGIAR Standing Panel on Impact Assessment (SPIA). In other words, UNOMA scales-up methods that were tested and validated as part of MAPS and in follow-up research, and is a testament to the importance of conducting methodological research in partnership with national statistical offices in a way that facilitates the adoption of improved methods in national surveys.
The UNOMA protocols for crop cutting had been developed in the context of MAPS and were previously published by Gourlay et al. [26]. Although the use of crop cutting will be limited to the sub-sample of rural panel maize-producing UHIS households, the intention is to derive imputed crop cut maize yields for the rest of the maize-producing UHIS sample that is not subject to crop cutting. Various techniques under the domain of statistical matching [18] could be considered for this type of imputation exercise, as well as a modeling approach that was most recently showcased in Mali [31] and that hinges on the availability of a range of complementary survey and geospatial data that UHIS/UNOMA have readily planned to collect.
In integrating georeferenced survey data and plot outlines from the broader UHIS sample and crop cut measures from the UNOMA sample with satellite imagery and complementary geospatial data, and leveraging machine learning techniques, the aim will be to derive high-resolution maps of crop areas, maize areas and maize yields across Uganda. In doing so, we will be drawing on the existing research in this space [32, 33, 30, 36], including ongoing research efforts supported by the Methods & Tools Development Component of the 50x2030 Initiative [34]. The latter is part of an ongoing body of research that seeks to inform the 50x2030 guidelines for the collection of required georeferenced survey data to support high-resolution mapping of agricultural outcomes in smallholder farming systems. In this respect, UHIS will be the first 50x2030-supported survey to benefit from the emerging recommendations on survey data collection for enabling downstream earth observation applications.
Moreover, the UNOMA protocols for obtaining and managing crop samples for crop varietal identification through DNA fingerprinting will be informed by those used in (i) MAPS in 2015 and 2016 for maize variety identification; (ii) Methodological Experiment on Banana Varietal Identification and Soil Fertility Measurement (BaVIS), which was also implemented in 2017, with support from the World Bank LSMS and the CGIAR SPIA [36]; and (iii) similar methodological studies implemented in Ethiopia [27, 28, 29] and Malawi [38] that experimented with the use of DNA fingerprinting for sweet potato and cassava. The crops that will be subject to DNA fingerprinting-based crop variety identification as part of UHIS/UNOMA will be maize, bean, sweet potato, cassava, banana and groundnut.
In addition, in collecting self-reported data on cultivated plot areas, crop production and yields, and crop varieties, alongside their objective counterparts, UNOMA will be a new source of data that can facilitate further research into NCME in self-reported agricultural survey data. In later years and with sufficient co-financing, the coverage of crops that are subject to crop cutting and crop varietal identification could be expanded, and soil and crop nutritional analyses could be pursued, informed by activities that will be supported in this space by the Methods & Tools Development Component of the 50x2030 Initiative. The latter expansion can allow for a better understanding of the extent to which soil quality is a constraint on increasing crop yields.
As mentioned above, UNOMA is limited to the rural panel UHIS households. The timing of UNOMA activities is closely tailored to the timing of agricultural activities and the overall workload of the UHIS field teams. For instance, crop sampling for (i) sweet potatoes and beans, (ii) bananas and cassava, and (iii) groundnuts for DNA fingerprinting-based varietal identification will spread across time and will be conducted during Visit 1, Visit 2 and Visit 3 respectively. Crop sampling for these crops will be limited to the rural panel UHIS households that are planned to be visited during the first two months of the fieldwork in each visit – corresponding to approximately half of the rural panel UHIS sample.
Conversely, maize crop cutting and maize crop sampling for DNA fingerprinting will be limited to the remaining half of the rural panel UHIS sample – to be visited during the third and fourth months of the fieldwork in Visit 2. Data collection will be specific to the second season of 2022. During the scheduled Visit 2 to the UHIS households, the GPS-based plot outline will be captured for a randomly selected maize plot cultivated by each maize-cultivating UHIS household that is part of UNOMA. In addition, the enumerator will establish at random, following the aforementioned MAPS protocols, two 8 m
Furthermore, since the scheduled Visit 3 to the UNOMA households will be too late vis-à-vis the timing of the harvest, an extra crop cutting visit will be fielded to each UNOMA household. During this visit, the demarcated crop cut sub-plots will be harvested and the crops weighed in the field using high-quality digital scales. Moisture readings will also be taken. Once the harvest is processed and weighed, maize grain samples will be obtained separately from the harvest of each crop cut sub-plot. These samples will then be barcoded and captured in the UHIS CAPI application and will be transported to a centralized location for further drying and DNA extraction prior to DNA fingerprinting. The protocols for these steps will also be aligned with those followed by UBOS in the context of MAPS in 2015 and 2016, and BaVIS in 2017.
Table 5
Standard activities and actions and their descriptions
| Activity/action | Description | Outputs |
|---|---|---|
| Activity 1: Assessment and Planning | ||
| Action 1.1: Ecosystem Mapping and Assessment | Initiative staff/contractors will work with country counterparts to conduct an assessment of the ecosystem through data collection, data analysis, and validation workshop. The output will be a final report. | Ecosystem Assessment Report and Maps. |
| Action 1.2: Joint Plan Development through the Delphi Method | Initiative staff/contractors will coordinate a negotiation process with country stakeholders to develop a plan that prioritizes constraints and topics to address through data use activities. Output is a revised plan for the data use section of the Program Implementation Plan (PIP). | Revised PIP Data Use Section. |
| Activity 2: Technical Assistance | ||
| Action 2.1: Technical assistance on reforms to data policies and processes | The Initiative will support country partners through the provision of expert guidance on reforms to data policies and processes that could improve data use. | Recommendations for improvements in policies and processes to promote data use. |
| Action 2.2: Technical Assistance on technological tools | The Initiative will support country partners through the provision of expert guidance on tools and platforms to promote data sharing and equipment/services related to those tools. | Recommendations for tools, platforms, and technologies to promote data use. |
| Action 2.3: Technical Assistance on Data Use Monitoring | The Initiative will provide expert guidance and coordinate government staff on processes to monitor data use among country stakeholders. | A plan for monitoring data use, including indicators and monitoring processes, as well as recommendations to implement. |
| Activity 3: Training/Capacity Building | ||
| Action 3.1: Training to Data Producers | The Initiative will hold trainings for data producers on presentation and interpretation of data. This general plan estimates two-day trainings twice a year for 30 participants. | Trained data producers. Training materials and curriculum. |
| Action 3.2: Training to Intermediaries on Analytical Techniques | The Initiative will hold trainings for data intermediaries (analysts and researchers) on analytical techniques, presentation, and interpretation of data. This general plan estimates three-day training every quarter for 30 participants. | Trained data intermediaries. Training materials and curriculum. |
| Action 3.3: Senior/Director-level Decision-makers | The Initiative will hold trainings for senior/director-level decision-makers on statistical literacy and interpretation of data. This general plan estimates one-day trainings twice a year for 30 participants. | Trained senior/director-level decision-makers. Training materials and curriculum. |
| Action 3.4: Executive/Ministerial-level Decision-makers | The Initiative will hold trainings for executive/ministerial-level decision-makers on statistical literacy and interpretation of data. This general plan estimates partial-day trainings twice a year for 30 participants. Output is trained individuals | Trained executive/ministerial-level decision-makers. Training materials and curriculum. |
| Activity 4: Workshops | ||
| Action 4.1: Workshops to build the data ecosystem | The Initiative will convene workshops to increase awareness of 50x2030 survey data and improve communication about the data among stakeholders. This general plan assumes a two-day workshop held twice a year. | Individuals and institutions engaged in the data ecosystem and 50x2030 data sharing activities. |
5.Integrated analysis and data use
Data integration involves combining data residing in different sources to enable statistical inference, or to generate new statistical data for purposes that cannot be served by each source on its own. This is necessary because it has the possibility of increasing data use by a broader number of stakeholders interested in undertaking scientific analysis or investigations. Analysis of integrated data requires that the data be managed well to eliminate linkage errors. The integrated work program produces the data with a range of modules such as agricultural production and productivity, income dynamics, nutrition, and gender dynamics, among others. This will require building the capacity of data producers and users in the production and management of large datasets produced by the integration work program using different statistical software, as well as in the dissemination of the data. Also, the integration work program will establish platforms for discussing results from data analysis to ensure that policy makers and development partners are able to use the data in their operations.
The 50X2030 Initiative’s Data Use component in Uganda has developed a plan based on a sequential process that includes assessment and planning of actions, followed by the implementation of activities to promote data use and strengthen the data ecosystem. The activities fall into three categories – Technical Assistance, Training, and Workshops – which all happen concurrently throughout the life of the project. Table 5 lists a set of ten standard activities proposed for a country, including their description and outputs. Following the table, a narrative section provides detailed information on the nature of the Activities and Actions. The exact focus, duration, and other details can be refined after the Ecosystem Assessment and follow-on Joint Planning.
6.The institutional process
In past decades the UBOS has used representative sample surveys to produce agricultural data. The official source of agricultural statistics in the country is the Uganda Annual Agricultural Survey (AAS), conducted in 1967/68, 1991/92 and 1992/93, before being revamped in 2017. Since 1992/1993 the Integrated Household Survey – renamed in 1995/96 as the Uganda National Household Survey (UNHS) – collects crop and other agricultural data. Starting in 2005/06, the Uganda National Panel Survey was introduced as a follow-up to the UNHS and integrated the data on agriculture in its multitopic framework.
The decision to integrate the agricultural and the socio-economic surveys has been explored by UBOS since 2017 when the AAS survey began, that is the point at which the two survey efforts started to co-exist. Interest in integrating the surveys was due to the fear that (i) one of the surveys was duplicating effort; and (ii) fear of the same organization producing contrasting agricultural estimates for the same country and period.
At that time, the UNPS and AAS survey programs were supported respectively by the WB LSMS-ISA Survey Program and the FAO AGRISurvey Programme. As implementing agencies of the 50x2030 initiative, WB and FAO supported UBOS in onboarding to the Initiative and they provided technical advice throughout the integration. In particular, UBOS, FAO and the WB set up a dedicated team to support the entire process and solicit punctual input from subject matter experts on specific issues (e.g., sampling, SuSo development, etc.).
Officially, the survey integration process started in December 2018 when the then UBOS/DAES, UBOS/DSES, FAO and WB met at the first technical retreat on the Integrated Survey Programs. On that occasion, UBOS Directorates and the program agencies agreed that the UNPS and the AAS would integrate, starting in 2020. The original UNPS sample would cease and be replaced with a new integrated one.
An Integration Team was established to ensure the continuity of technical discussions on the methodological, logistical, financial and technical aspects of integration. The technical work for the design of UHIS started after the first retreat focusing on the sampling methodology and on the harmonization of survey instruments. Subsequently, the discussion agreed on the survey calendar (in July 2019) and the architecture of the CAPI application (in January 2020).
From the institutional standpoint, two separate directorates had to work together, aligning their working programs, duties, and responsibilities. The integration process generated synergies in terms of optimizing human capacity and the transfer of knowledge between the two directorates, although the task turned was not always easy. The UHIS was designed and developed as a unique survey program, but institutionally the teams involved have different management and several roles beyond the UHIS.
UBOS intended to launch the UHIS in May 2020, but external challenges – especially the COVID-19 pandemic – obliged UBOS to reschedule the launch of the survey. In response to the rapid escalation of the spread of COVID-19 worldwide, the Government of Uganda (GoU) undertook measures to prevent the outbreak of the pandemic in the country by locking down the economy in March 2020. This had an immediate impact on UBOS, entailing the suspension of all field operations and the rescheduling of activities, including the UHIS. A decision was taken to shift the UHIS launch to May 2021.
In April 2021, the survey launch was further challenged by the abrupt decision by GoU to undertake the Livestock Census 2021. UBOS was obliged to make all its resources – especially vehicles and staff – available for the timely implementation of the Census. The UHIS suddenly found itself lacking in human resources, leading to a delay in its start. It was then agreed that training would start in September 2021, and the fieldwork thereafter.
7.Conclusions and the way forward
The paper has presented and discussed the peculiarities of the Uganda Harmonized and Integrated Survey from the perspective of integrating a household and an agricultural survey program. In particular, it emphasized that when two survey programs with different objectives aim to reach a strong degree of integration, the benefits of integration are inevitably accompanied by several complexities requiring careful and timely consideration.
From a technical point of view, the most complex aspect was the development of a survey calendar that was efficient and yet able to satisfy the information needs of a consumption survey (demanding a spread of the visits across 12 months) and the requirements of an agricultural survey (requiring punctual visits linked with the seasonal cycle). In Uganda, the strategy foresees that some of the panel households will be visited more than three times in the year, to ensure the agricultural questionnaires are administered in the proper time.
In addition, the paper showed that successful integration requires strong motivation at the country level and advanced technical skills. In Uganda, the integration of the AAS and UNPS was sought by the national statistical office, facilitated by high national expertise and long-standing relationships with the relevant international agencies.
In terms of the ways forward, the authors would like to emphasize the importance of completing the integrated design and data collection with equivalent integration and harmonization at the processing, analysis and reporting phases. So, for instance, the agricultural data collected through the different components shall be analyzed by a unified and coordinated inter-departmental team, following the same procedures. This technical coordination may benefit from stronger coordination at the senior level, through the presence of a central coordinator.
The Uganda experience offers interesting lessons to other countries interested in the integration experience. In addition, it may also pave the way for other types of integration within UBOS. For instance, the development of the survey instruments showed the value of aligning concepts and definitions and, in some instances, even survey modules, to ensure consistent statistics across surveys.
Notes
2 The Initiative produces the data necessary to monitor the indicators of Sustainable Development Goal 2 (Zero Hunger) that can be derived from survey data (2.3.1, 2.3.2, and 2.4.1), as well as other international (SDG 5.a.1) and regional (Comprehensive Africa Agriculture Development Programme [CAADP] indicators.
3 The technical assistance to UBOS on the design, implementation, analysis, and dissemination of the UHIS is provided by an integrated task team across the World Bank, as the institution that has supported the UNPS since 2009, and the Food and Agriculture Organization of the United Nations (FAO), as the institution that has supported the AAS since 2017.
4 The UNPS fieldwork deployment is tied to the administration of the consumption modules, whose requirements differ from those entailed for the agricultural surveys.
5 The sample size of the panel fluctuates, due to attrition and split-off households. This number refers to the realized sample size during the last survey round (i.e. AAS 2018; UNPS 2019/20).
6 The term ‘off year’ is used to indicate the years where only the core annual sample is interviewed. The term ‘on-year’ is used to indicate the years where the core annual sample is complemented by the biennial sample.
7 The comparison is based on the unit prices of the previous AAS and UNPS survey cycles. The UHIS interviews non-household sector farms, but this cost is excluded from the comparison, being a new feature of the integrated program. Other costs, such as the COVID-19 sanitary protection products, have also been excluded from the evaluation to guarantee the comparability and better assess the gains.
8 Authors’ calculation based on the available budgets. Fieldwork includes fieldwork, field monitoring, and sensitization. The vehicle opportunity costs have been excluded.
10 Non-household holdings include the following types of farms (FAO, 2015; Bako et al., 2021): 1. Corporations: entities created by process of law whose existence is recognized independently of the other institutional units that may own shares in its equity (EC, IMF, OECD, UN and WB, 2009). 2. Registered quasi-corporations: unincorporated enterprises owned by households that are sufficiently self-contained, independent, and operated as if they were privately owned corporations (EC, IMF, OECD, UN and WB, 2009). 3. Cooperatives: associations of persons united voluntarily to meet their common economic objectives through a jointly-owned enterprise. 4. Governmental institutions: production entities operated by a central or local government directly or through a special body; 5. Non-Profit Institutions (NPI): legal or social entities, created for producing goods and services, whose status does not permit them to be a source of income, profit, or another financial gain for the units that establish, control, or finance them. NPIs could be religious institutions, schools, colleges, clinics, hospitals, etc. (EC, IMF, OECD, UN and WB, 2009). 6. Holdings operated by tribes or clans.
12 Response options include corporation, cooperative, government institution, No-profit institution, a farm run by a tribe or clan.
13 Not only they address similar topics, but they used similar approaches – i.e., harvest and crop inputs collected at the plot level, objective area measurement through GPS, etc. The process would have been much more complex if the directorates had adopted different methodologies. Therefore, in countries where institutions adopt different approaches, the convergence is expected to be more complicated than it was in Uganda.
14 The biennial cross-sectional sample does not collect consumption data that otherwise would need to be collected across the 12-month period to accommodate seasonality in household consumption and expenditures. In view of the biennial cross-sectional sample data collection requirements, it is anticipated that the fieldwork for each visit could span 3, instead of 4, months.
References
[1] | World Bank. World Development Report 2021: Data for Better Lives. Washington, DC: World Bank. (2021) . https://wdr2021.worldbank.org/. |
[2] | Jolliffe D, Mahler D, Veerappan M, Kilic T, Wollburg P. Under What Conditions Are Data Valuable for Development? World Bank Policy Research Working Paper No. 9811. (2021) . |
[3] | Calleja R, Andrew R. Financing Challenges for Developing Statistical Systems AReview of Financing Options. PARIS21 Discussion Paper 14, Partnership in Statistics for Development in the 21st Century, Paris. (2019) . |
[4] | Sethi T, Mihir P. Counting on Statistics: How Can National Statistical Offices and Donors Increase Use? Williamsburg, VA: AidData at William and Mary; (2018) . https://www.aiddata.org/publications/counting-on-statistics. |
[5] | Global Strategy to improve Agricultural and Rural Statistics. Handbook on the Agricultural Integrated Survey. Rome: FAO; (2017) . |
[6] | European Commission, Eurostat. Define estimation Procedures. Development of methods and scenarios for an integrate system of European Social Surveys. VIP Integration of Social Surveys Final Report, CROSD1. (2013) . Available from: https://ec.europa.eu/eurostat/cros/content/vip-iss-final-reports_en. |
[7] | Cuppen MDJ, van der Laan P, an Nunspeet W. Reengineering dutch social surveys: From single-purpose surveys to an integrated design. Statistical Journal of the International Association for Official Statistics. (2013) ; 29: : 21–29. doi: 10.3233/SJI-130762. |
[8] | 50x30 Initiative. A Guide to Promoting Data Use Under the 50x2030 Initiative. Technical Paper Series. Rome: World Bank; (2020) a. Available from: https://www.50x2030.org/sites/default/files/resources/documents/2021-09/Methodological%20Guidance%20on%2050x2030%20Data%20Use%20Activities_Sept2021.pdf. |
[9] | European Commission, Eurostat. Roadmap for the integration of European social surveys. Development of methods and scenarios for an integrate system of European Social Surveys. D12. (2014) . Available from: https://ec.europa.eu/eurostat/cros/content/vip-iss-final-reports_en. |
[10] | Priest G. The Struggle for Integration and Harmonization of Social Statistics in a Statistical Agency, A Case Study of Statistics Canada. IHSN Working Paper, No 004. (2010) . Available from: https://www.ihsn.org/sites/default/files/resources/IHSN-WP004.pdf. |
[11] | 50x30 Initiative. A Guide to sampling. Technical Paper Series. Rome: World Bank; (2020) b. Available from: https://www.50x2030.org/sites/default/files/resources/documents/2021-09/50x2030%20Sampling%20Strategy_14%20June%20COVER%20ACK_SG_tracked.pdf. |
[12] | Bako D, Cara O, Paré L, Missiroli S, Mugabe S, Koudelka K. Operational guidelines on listing and survey preparation for household and non-household agricultural holdings and special farms. FAO Statistics Working Paper 21–21. Rome: FAO; (2021) a. doi: 10.4060/cb4065en. |
[13] | Bako D, D’Orazio M, Missiroli S, Ssennono VF, Brunelli C, Kilic T, Ponzini G, Bolliger F. Integrated sampling design for agricultural and socio-economic householdsurveys: overview and application in Uganda Harmonized Integrated Survey, (2021) b. Note this is submitted to the same IAOS issue on 50x2030. Reference need to be revised depending on the final reference of the IAOS issue. |
[14] | FAO. Handbook on Master Sampling Frames for Agricultural Statistics: Frame Development, Sample Design and Estimation. Global Strategy Handbook: Rome: FAO; (2015) . |
[15] | EC, IMF, OECD, UN & WB. 2009. System of National Accounts, (2008) . UNSD, New York. Available at: https://unstats.un.org/unsd/nationalaccount/docs/sna2008.pdf. |
[16] | FAO and The World Bank. Food Data Collection in Household Consumption and Expenditure Surveys. Guidelines for Low- and Middle-Income Countries. Rome. (2018) . Available from: https://www.worldbank.org/en/programs/lsms/publication/Food-data-collection-in-household-consumption-and-expenditure-surveys-guidelines-for-low-and-middle-income-countries. |
[17] | Wollburg P, Tiberti M, Zezza A. Recall length and measurement error in Agricultural Surveys, 50x2030 Working Paper Series. Rome: World Bank; (2021) . Available from: https://www.50x2030.org/sites/default/files/resources/documents/2021-09/Recall%20Length%20WP%2025%20Feb%202021.pdf. |
[18] | D’Orazio M, Di Zio M, Scanu M. Statistical Matching, Theory and Practice. Chichester: Wiley & Sons; (2006) . |
[19] | Carletto C, Gourlay S, Murray S, Zezza A. Cheaper, Faster, and More than Good Enough: Is GPS the New Gold Standard in Land Area Measurement? Survey Research Methods. (2017) ; 11: (3): 235–265. |
[20] | Carletto C, Gourlay S, Winters P. From Guesstimates to GPStimates: Land Area Measurement and Implications for Agricultural Analysis. Journal of African Economies. (2015) ; 24: (5): 593–628. |
[21] | Carletto C, Savastano S, Zezza A. Fact or artifact: The impact of measurement errors on the farm size-productivity relationship. Journal of Development Economics. (2013) ; 103: : 254–261. |
[22] | Dillon A, Gourlay S, McGee K, Oseni G. Land measurement bias and its empirical implications: Evidence from a validation exercise. Economic Development and Cultural Change. (2019) ; 67: (3): 595–624. |
[23] | Kilic T, Zezza A, Carletto C, Savastano S. Missing(ness) in Action: Selectivity Bias in GPS-Based Land Area Measurements. World Development. (2017) ; 92: : 143–157. |
[24] | Abay KA, Abate GA, Barrett CB, Bernard T. Correlated Non-Classical Measurement Errors and ‘Second BestPolicy Inference: The Case of the Inverse Size-Productivity Relationship in Agriculture. Journal of Development Economics. (2019) ; 139: : 171–184. |
[25] | Desiere S, Jolliffe D. Land Productivity and Plot Size: Is Measurement Error Driving the Inverse Relationship. Journal of Development Economics. (2018) ; 130: : 84–98. |
[26] | Gourlay S, Kilic T, Lobell D. A New Spin on an Old Debate: Errors in Farmer-Reported Production and Their Implications for the IR in Uganda. Journal of Development Economics. (2019) ; 141. doi: 10.1016/j.jdeveco.2019.102376. |
[27] | Kosmowski F, Aragaw A, Kilian A, Ambel A, Ilukor J, Yigezu B, Stevenson J. Varietal Identification in Household Surveys: Results from Three Household-Based Methods Against the Benchmark of DNA Fingerprinting in Southern Ethiopia. Experimental Agriculture. (2019) ; 55: (3): 371–385. |
[28] | Odson DP, Jaleta M, Tesfaye K, et al. Ethiopia’s transforming wheat landscape: Tracking variety use through DNA fingerprinting. Sci Rep. (2020) ; 10: : 18532. doi: 10.1038/s41598-020-75181-8. |
[29] | Wossen T, Abay KA, Abdoulaye T. Misperceiving and Misreporting Input Quality: Implications for Input Use and Productivity. Journal of Development Economics. (2021) . |
[30] | Lobell DB, Azzari G, Burke M, Gourlay S, Jin Z, Kilic T, Murray S. Eyes in the Sky, Boots on the Ground: Assessing Satellite- and Ground-Based Approaches to Crop Yield Measurement and Analysis in Uganda. American Journal of Agricultural Economics. (2020) a; 102: (1,b): 202–219. |
[31] | Yacoubou Djima I, Kilic T. Survey Measurement Errors and the Assessment of the Relationship between Yields and Inputsin Smallholder Farming Systems: Evidence from Mali. World Bank Policy Research Working Paper No. 9841. (2021) . |
[32] | Burke M, Lobell DB. Satellite-Based Assessment of Yield Variation and its Determinants in Smallholder African Systems. PNAS. (2017) ; 114: (9): 2189–2194. |
[33] | Jin Z, Azzari G, Burke M, Aston S, Lobell DB. Mapping Smallholder Yield Heterogeneity at Multiple Scales in Eastern Africa. 2017. Remote Sensing. 9; 931. |
[34] | Azzari G, Jain S, Jeffries G, Kilic T, Murray S. Understanding the Requirements for Surveys to Support Satellite-Based Crop Type Mapping: Evidence from Sub-Saharan Africa. Remote Sensing. (Forthcoming). |
[35] | Jin Z, et al. Smallholder maize area and yield mapping at national scales with google earth engine. Remote Sensing of Environment. (2019) ; 228: : 115–128. |
[36] | Lobell DB, Di Tommaso S, You C, Yacoubou Djima I, Burke M, Kilic T. Sight for Sorghums: Comparisons of Satellite- and Ground-Based Sorghum Yield Estimates in Mali. Remote Sensing. (2020) b; 12: (1). doi: 10.3390/rs12010100. |
[37] | Sinha P, Robson A, Schneider D, Kilic T, Mugera HK, Ilukor J, Tindamanyire. The Potential of In-Situ Hyperspectral Remote Sensing for Differentiating 12 Banana Genotypes Grown in Uganda. ISPRS Journal of Photogrammetry and Remote Sensing. (2020) ; 167: : 85–103. |
[38] | Kilic T, Moylan H, Ilukor J, Pangapanga-Phiri I. Root for the Tubers: Extended-Harvest Crop Production and Productivity Measurement in Surveys. Food Policy. (2021) ; 102. doi: 10.1016/j.foodpol.2021.102033. |
[39] | Lobell DB, Tommaso S, Burke M, Kilic T. Twice is Nice: The Benefits of Two Ground Measures for Evaluating the Accuracy of Satellite-Based Sustainability Estimates. Remote Sensing. (2021) ; 13: (16). doi: 10.3390/rs13163160. |


