
Integrated sampling design for agricultural and socio-economic households surveys: Overview and application in Uganda Harmonized Integrated Survey
Abstract
The 50x2030 Initiative proposes an integrated modular agricultural and rural survey program that promotes the integration of traditional socio-economic household surveys and agricultural surveys in beneficiary countries. An integrated sampling design is proposed to ensure that the integrated survey fulfils the measurement objectives of the traditional surveys in a cost-effective way. This paper will present an overview of the key technical features of the proposed integrated sampling procedures including the development of sampling frames, stratification criteria, sampling size calculations, estimation procedures and sampling approaches over time. The operational procedures will be highlighted through a presentation of an application of the methodology in the Uganda Harmonized Integrated Survey.
1.Introduction
National statistical offices are facing increasing surveys costs and declining participation and response rates for traditional surveys [1]. At the same time, there is an increased demand for data from various users in the public and private sectors. A solution to this challenge is the integration of data from a variety of sources, providing the potential to produce timelier and more disaggregated statistics more frequently than via traditional approaches alone [2]. Data integration is a broad and emerging topic in survey research, covering the integration of survey and administrative or big data, as well as the integration of data from different surveys.
In recent years, various statistical agencies have investigated the possibility of integrating distinct sample surveys. Initial studies focused mainly on the ex-post integration of data from independent surveys referred to the same target population, with the objective of studying the relationship between phenomena (variables) not jointly observed in the same survey. In this case, the methods developed fall under the umbrella of statistical matching or data fusion [3]. Statistical matching has received much attention and some of the proposed methods are just extensions of well-known imputation methods; however, not all the proposed methods require integration at the microdata level- Unfortunately, the application of statistical matching requires a number of assumptions that are seldom valid in most real cases. The main lesson learned from the many (unsuccessful) attempts to integrate survey data through statistical matching is that the surveys can be maintained independently but should be designed with a posteriori integration in mind [4], in order to satisfy the underlying assumptions. These findings have pushed the research towards the design of fully integrated surveys. For instance, a recent proposal in Europe suggested a modular approach to the design of a set of integrated social surveys [5]. This approach builds upon the integration of survey questionnaires, obtained by combining the different modules, following the lines of the split-questionnaire methodology [6]. In this modular approach, each questionnaire is then administered to a random sample of the target population. The proposed modular approach is flexible and efficient but is tailored to the domain of social statistics, where EU surveys (Labour Force, Consumption and Expenditures, etc.) refer to the same target population, namely households.
The approach proposed in this article shares some features with the EU modular approach to integrated social surveys but has a wider scope, as it aims to integrate surveys referring to different statistical domains when the target populations show a non-negligible overlap. This is often the case with agricultural surveys in developing countries that collect data on the subset of households practicing agricultural activities (agricultural households), while socio-economic surveys consider all households as target population.
The 50x2030 Initiative to Close the Agricultural Data Gap (hereafter “50x2030 Initiative”) promotes an integrated approach to the agricultural survey system. It proposes an Integrated Agricultural and Rural Survey Program aiming at integrating socio-economic and environmental data with agricultural data. This allows for the analysis of the drivers of productivity and the interactions between households’ socio-economic characteristics, agricultural production methods, off-farm activities, and the environment with agricultural activities, amongst others, speaking to the needs of different data users. The integrated approach greatly increases the value of agricultural data beyond production of basic macro-indicators [7]. Integrated survey instruments were designed [8] as well as an integrated sampling design [9] to ensure the cost effectiveness of the program. The main objective of this paper is to present and discuss key technical features of the proposed integrated sampling design and to present its application in Uganda. The paper is organized as follows: after the introductory section, a second section presents and discusses the data integration approaches adopted in the 50x2030 Initiative. After that, the 50x2030 Initiative’s Integrated Agricultural and Rural Survey Program is presented, followed by a discussion of the proposed integrated sampling design as well as the sampling approach over time. Prior to the concluding section, application of the approach in the Uganda Harmonized Integrated Survey (UHIS) program is presented.
2.Data integration approaches in the 50x2030 Initiative
2.1Integration of survey instruments
This is one of the most common solutions discussed in the literature on data integration. It consists in harmonizing and integrating the questionnaires of the surveys, to ensure the standardization of concepts, definitions, identifiers, codes etc., and to avoid duplication. The main objectives include generating a coherent dataset that are comparable over time and across sources when relevant, and ensuring data production is cost-effective [10]. The length of the integrated questionnaires should be considered carefully to avoid excessive burden on respondents. The 50x2030 Initiative elaborated integrated survey instruments for the recommended integrated survey programs (see [8]) and https://www.50x2030. org/resources/survey-instruments).
2.2Integration of survey samples
The integration is performed with respect to the sampling design. An integrated sampling strategy is elaborated for the different surveys, improving data consistency and facilitating cross-survey data analysis, especially when well-integrated survey instruments are considered. The 50x2030 Initiative’s integrated sampling design [9] complements the integrated questionnaires proposed by the initiative in a consistent way, providing operational tools and methods to countries for cost-effective implementation of the integrated agricultural and rural survey program. This approach could be applied in situations characterized by different degrees of overlap between the target populations (and also in surveys with completely different target populations) although implementation could be complex in some cases (e.g., surveys using different data collection frequencies and reference periods). However, integrating sampling designs can be cost effective to an important extent when some conditions are fulfilled, including:
• High overlap among target populations
In the presence of non-negligible overlap among the populations of interest in the surveys, the integration of the samples presents a number of potential advantages:
• Reduced cost of sampling frame development. This is an obvious advantage if the sampling populations are identical. Even where sampling units are different, a common master sampling frame could be explored in the presence of overlap between populations of interest.
• The possibility of administering the surveys on overlapping samples, reducing the cost of survey implementation.
In the context of developing countries, the proportion of households practicing agriculture is usually relatively high. That makes the integration of samples from households and agricultural surveys particularly advantageous.
• Use of similar sampling method
In the event that a similar sampling approach is used by the different independent surveys or considered adequate for them, the cost of sample selection can potentially be reduced by integrating the samples. For instance, if all surveys use multistage sampling design, there is the possibility of considering a unique sample of primary sampling units for the screening operations usually performed before selecting the final sampling units. That is a common situation in developing countries, where the most common sampling method used for both household surveys and agricultural surveys is multistage sampling design ([11, 12]).
• Complementarity/linkages of measurements objectives
When the measurement objectives of the different surveys are interlinked, the integration of the samples offer additional analytical advantages with the possibility of performing cross-survey analyses. In general, household socio-economic surveys and agricultural surveys share a number of measurement objectives and collect a great deal of similar demographic and economic information from households.
Table 1
Common features of sampling designs recommended and used for agricultural and socio-economic surveys
| Features | Socio-economic survey | Agricultural survey | |
|---|---|---|---|
| Household sector | Non-household sector | ||
| Observation units | Households | Agricultural holdings | Agricultural holdings |
| Sampling units | Households | Agricultural Households Points Segments | Agricultural holdings |
| Frames | List of EAs from population census and micro censuses in sampled EAs | List of EAs from Agricultural census or population census and micro censuses in sampled EAs Aerial frame | List of non-household farms Register of commercial farms |
| Stratification | Administrative zones, Urban/rural | Administrative zones Urban/Peri-urban/Rural Agro-ecological zones Agricultural intensities Land use (aerial frame) | Production systems (crop/livestock/mixed), ad hoc categorization |
| Sampling method | Stratified two-stage | Stratified two-stage | Stratified one-stage |
![Coverage of the agricultural program and the integrated program in 50x2030 [2].](https://content.iospress.com:443/media/sji/2022/38-1/sji-38-1-sji210905/sji-38-sji210905-g001.jpg)
3.50x2030 integrated agricultural and rural survey program
To support beneficiary countries in the production of detailed and diverse statistics that fulfil national data demand as well as international data requirements (e.g., data relating to Sustainable Development Goals [SDG] targets/indicators), the 50x2030 Initiative proposes that the Integrated Agricultural and Rural Survey Program goes beyond the production of traditional agricultural statistics (see Fig. 1). The survey program integrates socio-economic data with agricultural data covering both agricultural and non-agricultural households for agricultural and rural analyses, increasing the value of agricultural data exponentially beyond basic production indicators [7]. The resulting data allows users to better understand, (i) the drivers and dynamics of rural development, structural transformation, and their linkages with agriculture; and (ii) the linkages between agricultural productivity and income with aspects of welfare and livelihoods, such as educational outcomes, non-agricultural income, or shocks and coping [8].
The survey program follows a modular approach with a core survey tool focused on crop, livestock, aquaculture, fishery, and forestry production (CORE-AG), and a set of specialized tools (rotating modules):
• ILP: covering topics such as farm income, labor and productivity;
• PME: covering production practices and environmental aspects of farming;
• MEA: covering farming-related machinery, equipment and assets
• ILS-HH: covering non-farm incomes and household living standards
The rotating modules are administered at lower frequencies: in particular, the ILS-HH is administered every three years to both agricultural and non-agricultural households.
At the country level, this program promotes the integration of traditional agricultural surveys (in this case, FAO’s Agricultural Integrated Surveys) and socio-economic surveys (the World Bank’s Living Standards Measurement Study Household Surveys). Agricultural surveys are usually focused on agricultural statistics relating to production, inputs, revenues, etc., while socio-economic surveys collect data on household demography, income, consumption, expenditure, poverty etc. The 50x2030 Initiative prioritizes the estimation of national statistics and critical, agriculture-related SDG indicators in countries of interest. In particular, the Initiative focuses on SDG 2 (Zero Hunger) and SDG 5 (Gender Equality). It can be noted that some indicators of interest for the Initiative can be produced only with integrated data from agricultural and socio-economic surveys [8] covering all households in the inference domains. The Integrated Agricultural and Rural Survey Program is therefore crucial for countries aiming to produce such indicators. To facilitate the implementation of the program in a cost-effective way, an integrated sampling design is proposed.
4.Integrated sampling design
The first step in the development of the integrated sampling design was a review of the common features of the sampling designs recommended and used by countries for the two types of surveys (agricultural and socio-economic). Then, features relevant to both types were discussed, taking into account operational issues (i.e., feasibility/cost) and efficiency, before deciding on the integrated design. An important quality requirement is that the integration of the samples should not affect the reliability of the key estimates that users usually expect from the different surveys.
4.1Common sampling designs used for agricultural and socio-economic surveys
Table 1, above, presents the main features of the sampling designs recommended/used for agricultural and socio-economic surveys. In a nutshell, socio-economic surveys consider households as sampling and observation units. A stratified two-stage sampling design is usually used in the enumeration areas (EAs) (designed for population and housing censuses) as primary sampling units (PSUs). Listing operations are performed in the sampled PSUs before selecting the final sample of households. Administrative zones and urban/rural localization are the common stratification criteria.
In agricultural surveys, agricultural holdings are observation units. The sampling method depends on the type of sampling frame (list or area frame) and the sector: household (farms operated by households) or non-household (farms operated by corporations, associations, etc.). With a list frame, the sampling units in the household sector are agricultural households usually selected through a two-stage sampling method. Enumeration areas from agricultural or population census are used as PSUs and stratification criteria are usually administrative zones and urban/rural localization and agro-ecological zones. In the non-household sector, a stratified single stage sampling method is considered with a list frame usually developed from registers (business/commercial farms register) and/or lists from agricultural censuses.
The area frame covers all holdings operating agricultural land and should be complemented by a list of landless holdings raising livestock, in order to achieve full coverage. With an area frame, single or multistage sampling methods are usually used for selecting segments or geographical points to reach the final sample of farms for the survey.
4.2Proposed integrated sampling design
The integrated sampling design proposed for the integrated agricultural and rural survey program is described here. The integration is proposed in the household sector which is covered by both types of surveys. Farms operated by non-household entities (corporations, government institutions, cooperatives, etc.) shall be covered using the recommended sampling design mentioned in Section 4.1, above.
4.2.1Populations of interest
The integrated survey program aims at producing statistics on the country’s agricultural sector and rural households. As already mentioned above, units observed in agricultural surveys are agricultural holdings and in the household sector they are sampled through agricultural households. Therefore, the target populations, in line with the measurement objectives, are: (i) rural households; (ii) urban agricultural households; and (iii) farms operated by non-household entities.
4.2.2Sampling method and frame
As it can be noted from Section 4.1, a common sampling method recommended for both agricultural surveys (in the household sector) and socio-economic surveys is the two-stage sampling design using the list of enumeration areas from the most recent population and housing census (PHC) as the sampling frame for PSUs. The target population that can be investigated through an integrated sampling method is the subset of rural households. In fact, there is no integration in urban areas as non-agricultural urban households are not part of the target population of the 50x2030 initiative. Urban areas shall be covered only by agricultural surveys and in countries where urban agriculture is important. The sampling method for urban agricultural households will be country-specific, depending on their number and distribution, as captured in the most recent population and housing census, which will also be used for developing the sampling frame. Figure 3 shows the components of the sampling frame recommended for the integrated survey program and highlights the integration domain which includes only households in rural areas as explained above.
4.2.3Sample size
The required size of the integrated sample should be considered carefully to ensure that the final sample includes the minimum number of units required for the measurement objectives of each survey, as well as those of the integrated survey. The 50x2030 Initiative promotes the calculation of the sample size based on the analytical requirements of the survey, i.e., it ensures the reliable estimation of key variables of interest. Traditionally, agricultural surveys consider agricultural production or agricultural area, while socio-economic surveys consider household income or consumption when calculating the minimum sample size.
In rural areas, the Integrated Agricultural and Rural Survey Program has two main estimation goals: those for the whole population of rural households, and those for the subset of agricultural households at the national and sub-national levels. To meet these objectives, the optimal sampling strategy would require a complete list of rural households from a recent PHC, classed according to whether they are agricultural (denoted as A from now on) or non-agricultural (denoted as B).
To calculate the minimum sample size of households, the recommended approach is one that considers the analytical requirements of the survey, i.e., it ensures the reliable estimation of unknown population quantities related to key variables of interest. The variable of interest can be chosen among the key variables necessary for the calculation of the most important indicators expected from the survey operation. the usual approximate formula based on the coefficient of variation can be used. From [13] (pages 30 and 76), the minimum sample size
(1)
Where:
•
•
•
•
•
The coefficient of variation of
(2)
Where:
•
•
In the integrated survey, the household-sector sample size should ensure reliable estimation of unknown population parameters (mean, total) referred to a key household-related
Let’s denote as
•
•
•
•
•
•
The minimum sample size of households (
(3)
Or:
(4)
In case the two surveys being integrated consider other formulas different from Eq. (1) to calculate the optimal sample size (e.g. sample size for change estimation, sample size considering more than one variables), then the corresponding outputs can be plugged-in in Eq. (4) to replace
Expression (4) is the straightforward extension of Eq. (1) that takes into account the integrated sampling strategy and the fact that the sample should return estimates of the domain mean for two key variables with a desired maximum acceptable relative error
This procedure requires having all the variables in the formula for household types A and B (agricultural and non-agricultural rural households) in each domain
(5)
And:
(6)
Where:
•
•
•
Some practical guidelines concerning the values involved in these expressions can be found in [14].
When PSUs are selected using the probability-proportional-to-size sampling method, selecting a fixed number of
(7)
where
4.2.4Stratification
Stratification can make an important contribution to improving the accuracy of estimates. There is usually a distinction between design strata (used mainly for improving estimates) and analytical strata also called domains. In the framework of integrating surveys, if the surveys do not have similar design or analytical strata, considering all different stratification criteria in the integrated survey would lead to too many strata, which is problematic [15]. A compromise solution is to identify stratification criteria that are suitable for the different surveys. It is worth noting that there exist more complex strategies to handle calculation of optimal sample size in presence of a very fine stratification (see [6, pp. 124–125] or [16, 17]). Unfortunately, these approaches are quite complex and tailored to one stage stratified random sampling.
Area units like enumeration areas or villages usually present relatively low within variance of key household variables due to geographical proximity. When used as the PSU in multistage sampling, an important proportion of the sampling variance would consist in the variance between the PSUs. A proper stratification of the PSUs is therefore important to reduce sampling variance. FAO recommends a stratification of the EAs by administrative zone (e.g., regions, provinces, etc.) and agro-ecological zone [12]. This should happen prior to the first-stage selection, in order to improve the estimates of agricultural statistics. Stratification of PSUs should be carefully controlled, since having too many strata is neither desirable (an independent sample has to be selected in each stratum) nor necessary. To avoid too many strata, explicit stratification can be coupled with implicit stratification. This consists of sorting the sampling frame by relevant criteria (usually geographical) in each stratum and selecting an independent sample in each stratum with systematic sampling.
As previously stated, a two-stage sampling method is suggested for the integrated sampling design, with the list of enumeration areas taken from the most recent PHC as sampling frame of the PSUs. In most cases, the list of households from the most recent PHC would be outdated or difficult to obtain in some countries. Therefore, the actual structure of the households within the sampled PSUs can be known only after a fresh listing of households in these PSUs. A major drawback is the lack of control over the final sample, especially the number of agricultural households required in the domain (as calculated in Section 4.2.3). Since the selection is made at the level of PSUs, it may show a varying situation in terms of the proportion of agricultural households.
To maintain control of the final sample size by household type (A and B), it is preferable to make a first-level stratification of the EAs in terms of the proportion of agricultural households in each of them, estimated from the latest PHC or other suitable source in each domain of inference. In case basic agricultural data is not collected during the PHC, procedures for identifying agricultural households in such PHC data described in [18, pp. 46–48] can be considered. Even if the PHC data is considered outdated, this structural information (proportion of agricultural households) is not likely to vary much in all PSUs and could be helpful for stratification purposes.
Table 2
Allocation in first-level PSU strata and expected number of agricultural households
| First-level PSU strata | Allocation criteria | Sample of PSU allocated | Expected number of households | Expected number of agricultural households |
|---|---|---|---|---|
| Agricultural |
|
|
|
|
| Mixed |
|
|
|
|
| Non-agricultural |
|
|
|
|
A first-level stratification based on thresholds of proportions of agricultural households
•
•
•
If a fixed number
Thresholds
Allocation coefficients
(8)
i.e.
(9)
As
(10)
This means that the desired fraction of sampled agricultural households
(11)
This first-level stratification criterion is obviously relevant for agricultural aggregates and would be suitable for socio-economic surveys in most cases. In fact, an important stratification criterion for those late surveys is urban/rural localization, and proportions of agricultural households tend to be high in rural areas and low in urban ones. In any case, an assessment of the association between the proportions of agricultural households in EAs and their localization in urban/rural areas would help to confirm the suitability of the proposed first-level stratification for the socio-economic survey as well. If not, suitable stratification should be considered at a second level for that survey.
A second-level stratification of PSUs may be performed inside the first-level strata if necessary while avoiding o much of an increase in the number of strata. Common stratification criteria for improving estimates in agricultural and household surveys are: agro-ecological zones; urban/rural localization, land use classes; size categories based on population; agricultural area; intensity of agricultural activity, etc.). The allocation in these second-level strata can follow different criteria. In this framework an allocation of the PSUs proportionally across strata, to either the number of households (if known) or the number of PSUs in each stratum of PSUs, can be considered.
A multivariate stratification and allocation [19] or compromise power allocation [20] could also be explored if the frame contains relevant variables related to households’ socio-economic conditions or to agricultural phenomena (livestock, agricultural production, etc.) at the PSU level.
Table 3
Summary of the major components of the sampling design for the Integrated Program
| Items | Populations of interest | ||
|---|---|---|---|
| Household (rural) | Household (urban) | Non-household sector | |
| Observation units |
| Agricultural holdings | Agricultural holdings |
| Final sampling units | Households | Households | Agricultural holdings |
| Frames | List of households from population census or list of EAs from population census and micro censuses in sampled EAs | Country-specific: List of households from population census or list of EAs from population census | List of non-household farms developed from registers and/or field operations |
| Sampling method | Stratified two-stage | Country-specific: Stratified one-stage or two-stage | Stratified one-stage |
| Stratification | Country-specific:
| Country-specific: administrative zones; agro-ecological zones | Country-specific: administrative zones; production systems (crop/livestock/mixed); ad-hoc categorization, e.g., strata based on a measure of size (e.g., value of production) |
| Sampling scheme | 1 | Country-specific: depending on the sampling method adopted | Systematic or Simple random sampling without replacement within each stratum |
4.3Estimation issue with different observation units
The integration procedure would lead to an integrated survey program with an agricultural component and a socio-economic component. The sampling unit is the household which is also the unit of interest for generating the socio-economic data (observation unit). However, the observation unit for the agricultural component is the agricultural holding. Therefore, it is important to discuss the relationship between households and holdings in computing the sampling weights of the holdings. In fact, there is not always a one-to-one correspondence between agricultural households and agricultural holdings. In particular, in some countries there are cases of two or more distinct households operating a single agricultural holding. In contexts where such cases are important, sample weights would need specific adjustments to avoid biased estimates.
FAO recommends using the Generalized Weight Share Method (GWSM) [21], proposed in [22], when dealing with multiplicities between holdings and households.
The following operational recommendations can be made for the use of the GWSM in the framework of the 50x2030 integrated sampling design:
(i) Identifying multiplicities during household listing: when listing households in the PSU, include questions to identify multiple-household holdings;
(ii) After sampling and during the actual survey, identify the sampled households linked to each multiple household-holding;
(iii) During data processing, compute sampling weights of the multiple-household holdings using the Generalized Weight Share Method.
Let us consider:
Table 4
Pros and cons of sampling approaches over time
| Approach | Pros | Cons |
|---|---|---|
| Repeated cross-sections |
|
|
| Panel |
|
|
| Rotation | Compared to repeated cross-sections:
|
|
The design weight (adjusted for multiplicity)
(12)
The total
In countries where there are many cases of households operating agricultural holdings in partnership, given the requirement of collecting data at both household and holding levels, the following actions should be taken:
• Identify agricultural information that should be captured at both the household and holding levels, including revenues and expenses, assets, investments, etc.
• When interviewing households operating a mul-tiple-household holding, collect this information separately at the household level and the holding level. Obviously, this will increase the interview burden for these respondents but hopefully, as mentioned below, such cases will be unusual.
• Finally:
– weighted estimation of household-level data at the national level will be calculated using households’ direct sampling weights as design weights that should be adjusted through calibration, post-stratification, non-response adjustments etc., to calculate the final weights.
– Weighted estimation of holding-level data at the national level will be done using the holdings’ sampling weights (
Therefore, final household and holding weights will be different only in the case of holdings operated by more than one household.
5.Sampling approach over time
The 50x2030 survey programs recommend annual collection of agricultural and rural data. From one year to another, there are three alternatives regarding the samples for such repeated surveys: (i) selecting a new sample every year (often called “repeated cross-section”); (ii) using the same sample during a number of years (panel); and (iii) changing a proportion of the sample from one year to another (partial rotation). Strengths and limitations of each option are presented in Table 4.
The panel approach generally presents lower operational costs as the same sample is surveyed every year over a period of time, especially for surveys that do not require intensive tracking operations. The panel is also well suited to estimating change, but the panel sample may not be representative after a number of years because of sample attrition and structural changes in the population.
The partial rotation scheme is therefore a good alternative, especially for a survey plan with a relatively long period of implementation, although it could also suffer from sample attrition. It is less expensive than the repeated cross-section approach and allows longitudinal analyses and facilitates more precise estimates of changes.
The first option would improve annual cross-sectional estimates if the sampling frame is fully updated every year prior to sample selection. However, compared to the other options, it will place higher operational costs on the survey program, including annual costs for updating the sampling frame and locating the sampling units for survey implementation. In addition, because there is little or no overlap between successive samples, and repeated cross-sections usually present more discrepancies in time series data, estimates of changes are less precise and longitudinal analyses are very limited and sometimes impossible.
For the 50x2030 Initiative, the panel and the partial rotation approaches are advised as cost-effective sampling approaches over time. In countries where the rate of unit non-responses is usually high (as observed in previous surveys), the panel approach should be avoided because of the risk of increasing non-response rates over time, due to respondent burden.
Table 5
Sample size – Uganda Harmonized Integrated Survey (UHIS)
| Region | Sub-region | Sample size UHIS (EAs) – even years | Sample size UHIS (EAs) – odd years | Additional EAs – even years |
|---|---|---|---|---|
| Kampala | Kampala | 23 | 23 | 0 |
| Central | Buganda South | 54 | 54 | 0 |
| Central | Buganda North | 75 | 40 | 35 |
| Northern | West Nile | 48 | 36 | 12 |
| Northern | Lango | 65 | 35 | 30 |
| Northern | Acholi | 32 | 23 | 9 |
| Western | Kigezi | 66 | 47 | 19 |
| Western | Bunyoro | 57 | 31 | 26 |
| Western | Tooro | 46 | 30 | 16 |
| Eastern | Busoga | 52 | 42 | 10 |
| Eastern | Teso | 81 | 31 | 50 |
| Eastern | Bukedi | 38 | 26 | 12 |
| Eastern | Bugiso-Elgon | 38 | 28 | 10 |
| Karamoja | Karamoja | 49 | 49 | 0 |
| Western | Ankole | 50 | 34 | 16 |
| Total (EAs) | 774 | 506 | 245 | |
| Total (Households) | 9,288 | 6,072 | 2,940 | |
Figure 2.
Schema of the 50x2030 integrated agricultural and rural survey program.
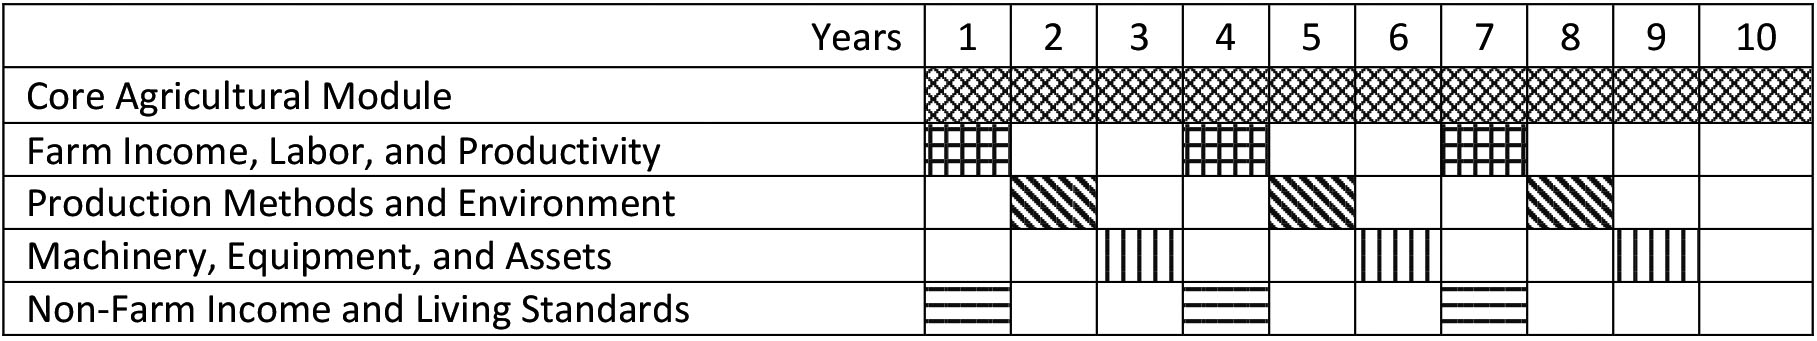
For the Integrated Agricultural and Rural Survey Program, a three-year panel or rotation would be cost effective because non-agricultural households are considered every three years in that survey program (see Fig. 2 in Section 3). A full integrated sample of households is covered every three years and the agricultural households selected are covered in the two successive years as a panel or through a partial rotation approach.
6.Application in Uganda
In Uganda, agricultural statistics have a long tradition. The country conducted its first Census of Agriculture (AC) in 1963–65. This was followed by the National Census of Agriculture and Livestock (NCAL) 1990–91, the Uganda Census of Agriculture (UCA) 2008–09 and the Livestock Census 2008. In addition, in the past decades, Uganda has generated agricultural statistics through representative sample surveys, i.e., the Uganda National Panel Survey (UNPS) and the Uganda Annual Agricultural Survey (AAS).
Established in 2009, the UNPS is a multi-topic household panel survey that aims to provide nationally and regionally representative estimates on household income, consumption and living standards. In addition, it includes an agricultural questionnaire for the households engaged in agriculture.
The Uganda Annual Agricultural Survey (AAS) is the official source of agricultural statistics in the country. The AAS is a cross-sectional agricultural survey representative at national level and for the ten agro-ecological zones of the country called Zonal Agricultural Research and Development Institutes (ZARDIs), with the exclusion of Greater Kampala. The rationale for establishing an agricultural survey in addition to the UNPS was based on the need to:
• Improve the accuracy of the agricultural production estimates and increase the level of disaggregation through a larger sample of agricultural households;
• Have a better alignment between the timing of the survey operations and the agricultural calendar through a four-visit approach that collects data immediately after planting and immediately after harvesting.
The UNPS and the AAS programs have been running independently and in parallel since 2017. Both programs fulfilled their intended objectives. Yet, it became rapidly evident the need to set up a more sustainable survey system that is more cost-efficient and avoids duplications and inconsistencies in agricultural statistics. To this extent, the country decided to integrate the two survey programs into the Uganda Harmonized and Integrated Survey (UHIS) program which was launched in September 2021, with the support of the 50x2030 Initiative.
Figure 3.
Sampling frame for the integrated agricultural and rural survey program.
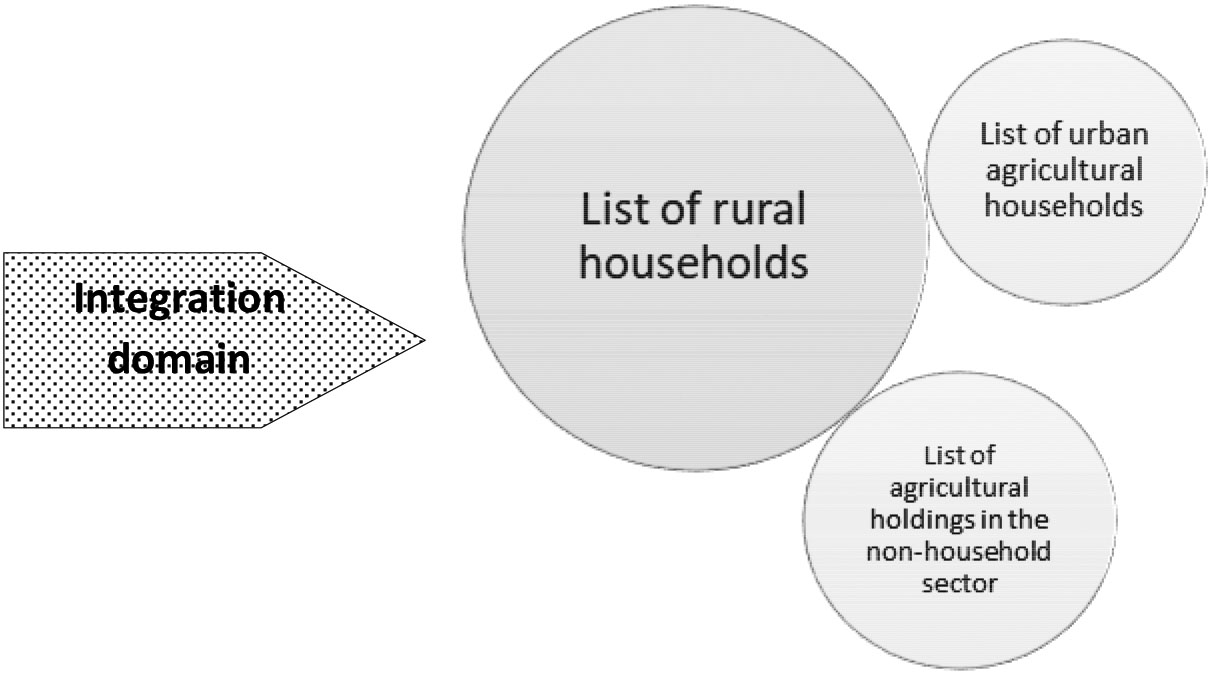
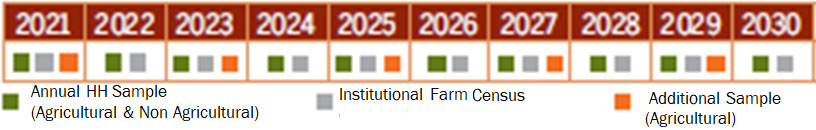
Figure 4.
Uganda Harmonized and Integrated Survey program: Calendar.
The ultimate objective of UHIS is the generation of reliable estimates on agriculture, consumption and living standards and understanding the drivers of agricultural productivity and poverty and their linkages with welfare and government programs. The integration required developing a survey calendar suitable for the consumption and agricultural data requirements; harmonizing survey instruments, concepts and definitions; and developing a sampling design that addresses the peculiarities of both surveys. A more detailed introduction of the UHIS including discussions of its cost efficiency can be found in [23].
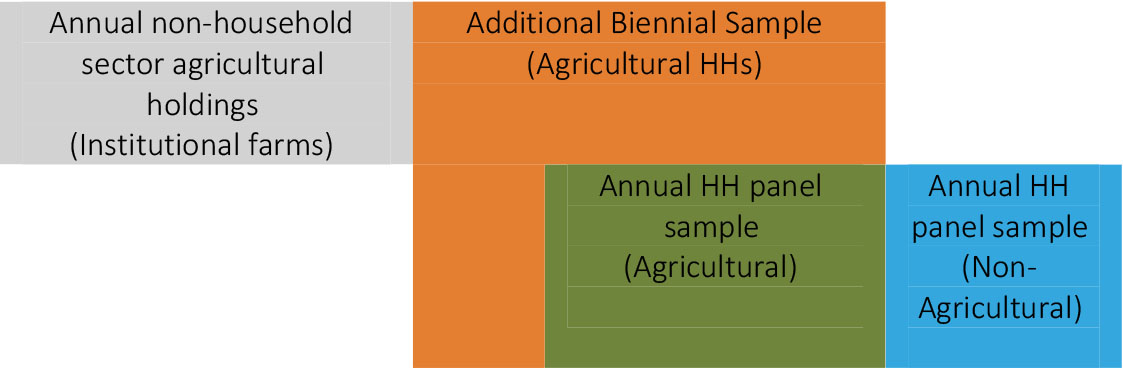
6.1UHIS calendar and samples
The main features of the UHIS are the following (see Figs 3 and 4):
1. A panel of households receives a household questionnaire and (if applicable) an agricultural questionnaire on an annual basis;
2. On a biennial basis, an additional cross-sectional sample of agricultural households is interviewed on agriculture;
3. Finally, non-household sector holdings are interviewed on an annual basis.
6.2Domains
The reporting domains of UHIS depend on the year of implementation of the survey. Only the panel is implemented in the odd years (2022, 2024, etc.) and its reporting domains are the regions11 for agricultural statistics and the sub-regions22 for socio-economics statistics. The full sample is implemented in the even years (2023, 2025, etc.) and its reporting domains are the sub-regions for both agricultural and socio-economics statistics.
Using the sub-regions as reporting domains also allows the generation of reliable estimates for the ZARDIs that are groups of districts close to each other with same climate, land use and cropping patterns. A ZARDI is equivalent to a sub-region or a combination of sub-regions, except for Mbarara ZARDI that has some districts (Lyantonde, Rakai and Sembabule) belonging to the South Buganda sub-region.
Figure 5.
Uganda Harmonized and Integrated Survey program: sample components.
6.3Frame
The frame used for UHIS is a master sample frame of Enumeration Areas (EAs) listed for the Uganda National Household Survey 2019/2020 (UNHS), which was the largest survey undertaken by the Uganda Bureau of Statistics (UBOS) whose major objective is generating poverty estimates.
The master sample contains 1,974 EAs and it was selected using a systematic sampling (within each sub-region) with probability proportional to size (the number of households in each EA at the time of the 2014 Population and Housing Census) from a frame including 78,692 EAs that were geographically ordered, and where refugee settlements, forests and institutional populations were excluded. Of the 1,974 EAs, 94% have more than 10% of households engaged in agriculture and 56% have more than 90% of households engaged in agriculture. Each EA is identified by residential type, i.e. urban or rural.
6.4Sample size
The sample size for UHIS is calculated taking into account precision requirements for both agricultural and households’ socio-economic statistics.
For the socio-economic component, the sample size is calculated to ensure reliable estimates of the rates of chronic poverty (2016–2020), electricity use and ownership of enterprise in each inference domain (i.e., the sub-region). For the specific case of the sub-region of Kampala, the unemployment rate is also considered.
The variables of interest considered for calculating the sample size for the agricultural component are the value of agricultural production, the agricultural area and the number of livestock in tropical livestock units in each inference domain (i.e., the region for the panel and the sub-region for the entire sample).
A minimum sample size
Equation (5) was used to calculate the sample sizes of households (for the socio-economic component) and agricultural households (for the agriculture component). For the socio-economic component, the final sample size in domain
The sample size of households for the odd years survey (
In this case, the domain
A sample of 12 households is expected to be selected in each sampled EA (only agricultural households in the additional EAs of the larger sample of the odd years survey). Therefore, the sample size of EAs (
7.Conclusion
This paper discusses the integrated sampling design proposed for agricultural and household socio-economic surveys as promoted by the Integrated Agricultural and Rural Survey Program of the 50x2030 Initiative. The main technical features and requirements of the integrated sampling design are discussed, and specific recommendations provided to improve its efficiency. It was highlighted that in countries where an important proportion of households practice agricultural activities (as is the case in many developing countries), the adoption of the integrated sampling design would be cost effective and presents a number of advantages, including the improvement of data consistency and integration in the rural sector. However, such integration could be complex in some contexts, such as when the different surveys have different numbers of visits and reference periods, and where the overlap between the target populations is relatively low.
The Uganda Harmonized Integrated Survey (UHIS) program is a clear example of an integrated survey that saves time and other resources, without sacrificing data quality and completeness. The agricultural and socio-economic components of two independent surveys (i.e., AAS and UNPS) are well covered and represented in UHIS. The integrated sampling design considers the characteristics of both surveys by merging the target populations and the criteria for obtaining reliable estimates for both sets of key variables, in order to obtain a two-way representative sample. The operational costs of the two surveys are then reduced by implementing just one survey preparation procedure, a single data collection activity and one data analysis phase. The cost of the possible increase of the sample size due to the multiple survey objectives does not outweigh the advantages in terms of cost, efficiency and effectiveness.
Notes
1 Central, Western, Eastern, Northern and Karamoja.
2 Kampala, Buganda North, Buganda South, West Nile, Teso, Bukedi, Elgon (Bugisu), Acholi, Lango, Tooro, Bunyoro, Karamoja, Teso, Ankole Kigezi.
Acknowledgments
The authors thank the reviewers, the English editor and the Uganda Bureau of Statistics (UBOS) for their collaboration.
References
[1] | Groves RM. Three eras of survey research. Public Opinion Quarterly. (2011) ; 75: (5); 861-871. doi: 10.1093/poq/nfr057. |
[2] | UN Economic Commission for Europe (UNECE). A Guide to Data Integration for Official Statistics; 2018. Available at: https://statswiki.unece.org/spaces/flyingpdf/pdfpageexport.action?pageId=129171769. |
[3] | D’Orazio M, Di Zio M, Scanu M. Statistical Matching, Theory and Practice. Wiley: Chichester; (2006) . |
[4] | Donatiello G, D’Orazio M, Frattarola D, Rizzi A, Scanu M, Spaziani M. The statistical matching of EU-SILC and HBS at ISTAT: where do we stand for the production of official statistics. DGINS – Conference of the Directors General of the National Statistical Institutes, 26–27 September 2016, Vienna; (2016) . |
[5] | Karlberg M, Reis F, Calizzani C, Gras F. A toolbox for a modular design and pooled analysis of sample survey programmes. Statistical Journal of the IAOS. (2015) ; 31: : 447-462. |
[6] | Chipperfield JO, Steel DG. Design and estimation for split questionnaire surveys, Journal of Official Statistics. (2009) ; 25: : 227-244. |
[7] | 50x30 Initiative. An introduction to the 50x2030 Initiative. Technical Paper Series #1. Rome: World Bank; (2020) a. |
[8] | 50x30 Initiative. A Guide to the 50x2030 Data Collection Approach: Questionnaire Design. Technical Paper Series #2. Rome: World Bank; (2020) b. |
[9] | 50x30 Initiative. A Guide to sampling. Technical Paper Series. Rome: World Bank; (2020) c. |
[10] | International Household Survey Network (IHSN). Guidelines on Integration of survey instruments; 2021. Available at: http//www.ihsn.org/node/124. [Accessed on July 12, 2021]. |
[11] | Grosh ME, Munoz JA. Manual for planning and implementing the living standards measurement study survey (No. LSM126). Washington, D.C: World Bank; (1996) . |
[12] | FAO. Handbook on the Agricultural Integrated Survey (AGRIS). Global Strategy to improve Agricultural and Rural Statistics. Rome: FAO; (2017) . |
[13] | Valliant R, Dever JA, Kreuter F. Practical tools for designing and weighting survey samples. 1st edition. New York: Springer; (2013) . |
[14] | UN. Designing Household Survey Samples: Practical Guidelines. Studies in Methods Series F, No. 98. New York: UN; (2008) . |
[15] | Cochran WG. Sampling Techniques. 3rd Edition. John Wiley & Sons: New York, USA; (1977) . |
[16] | Falorsi PD, Righi P. Generalized framework for defining the optimal inclusion probabilities of one-stage sampling designs for multivariate and multi-domain surveys. Survey Methodology. (2015) ; 41. |
[17] | Falorsi PD, Righi P. A balanced sampling approach for multi-way stratification designs for small area estimation. Survey Methodology. (2008) ; 34: (2): 223-234. |
[18] | FAO. Handbook on Master Sampling Frames for Agricultural Statistics: Frame Development, Sample Design and Estimation. Global Strategy Handbook: Rome: FAO; (2015) . |
[19] | Barcaroli G, Ballin M, Odendaal H, Pagliuca D, Willighagen E, Zardetto D. Sampling Strata: optimal stratification of sampling frames for multipurpose sampling surveys, R package. Version 1.5-1; (2020) . |
[20] | Bankier MD. Power allocations: determining sample sizes for subnational areas. The American Statistician. (1988) ; 42: : 174-177. |
[21] | Falorsi PD, Bako D, Righi P, Piersante A. Integrated Survey Framework. Rome: FAO; (2015) . |
[22] | Lavallée P. Indirect Sampling. Springer: Ottawa; (2007) . |
[23] | Ponzini G. et al. The integration of the Social Economic and Agricultural Surveys in the National Statistical Agencies: A Case of Uganda Bureau of Statistics; (2021) . |


