
Computing in the statistical office
Abstract
Computing with data is at the hart of the activities statistical office. Yet, the area of technical computing often falls between the two stools of data analysts and IT developers. In this paper we analyze the importance of computational skills in the Generic Statistical Business Process Model. Next, we give an overview of computational topics that are of importance to the statistical office. Many of these skills turn out to be of highly technical nature. After this, we try to provoke a wider discussion on the role of technical computing by 1) introducing the role of the Research Software Engineer into the field of official statistics and 2) propose a six semester bachelor’s curriculum in official statistics.
1.Introduction
It is increasingly clear that computing is becoming an essential skill for statisticians and anybody working with data. Computing is as important as mathematics in both statistical practice and research, yet it occupies a tiny portion of our curricula. Nolan and Temle Lang (2010) [1]
Computing with data is at the hart of official statistics. Whether we are running a production system, designing or building a production component, researching a new method, or analyzing a new data source, we are constantly writing and running statistical software, be it small or large, simple or complex, to generate and analyze our results.
Computing capabilities have received an increased interest in parts of the official statistics community. The curriculum of the European Master in Official Statistics explicitly mentions ‘programming capacities enabling to find professional solutions to complex data processing tasks’ as one of the learning outcomes [2]. Similarly, the fourth European Statistical Training Programme (ESTP [3]) offers several short courses in related topics, including Big Data, and programming in tools like R or Python [4, 5].
Traditionally there have also been efforts for capacity building in computational topics and tools that are specific to the official statistics community. A recent example is the Centre of Excellence for implementation and maintenance of tools for statistical disclosure control and time series analyses in the European Statistical System [6].
Moreover, the official statistics community has put efforts in sharing existing statistical tools, thereby making computational tools available across the community. Prime examples include the Common Statistical Production Architecture (CSPA [7]), projects on statistical services in the European Statistical System [8], and the more informally developed ‘Awesomelist of official statistics software’ [9].
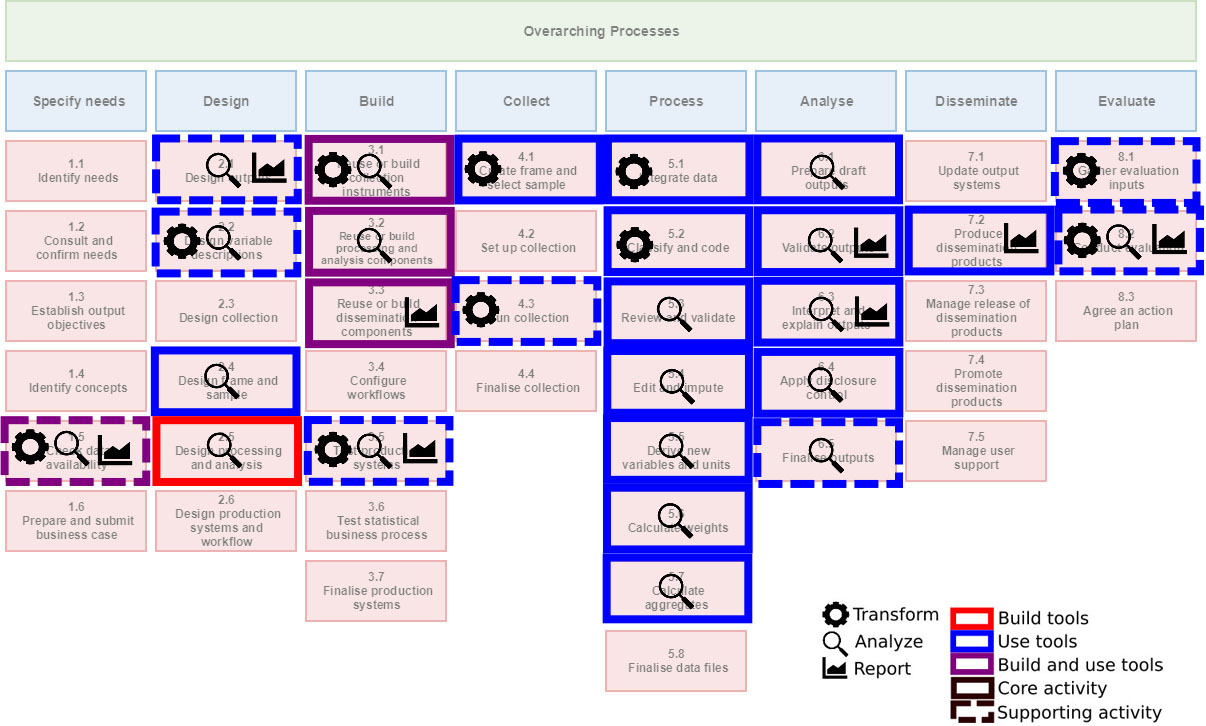
Figure 1.
Statistical computing across the GSBPM. Indicated are which GSBPM sub-processes have are computational at the core, or supported by computation. The type of computation is split between using or building computational tools and between Transforming, Analyzing, and/or Reporting (see Section 2.1).
Although these efforts are related by having some form of computing as a common theme, the community does not seem to value computing as a core competence. Educational efforts are scattered and collaborative projects focus either on infrastructure, methodology, or domain issues. Indeed, the Generic Activity Model for Statistical Organisations (GAMSO [10]), a recent initiative by the ModernStats committee, does not mention ‘statistical computing’, or ‘computing with data’ as a strategic activity to be managed by statistical organizations. Aspects that are mentioned include activities such as ‘management of production’, ‘quality’, and ‘statistical methodology’. Even though realization of any of these topics depends on the availability of sound statistical computing skills and environments, it is not mentioned once in the document. Similarly, the IT section of GAMSO focuses on infrastructural issues, not on capabilities related to managing, manipulating, and analyzing data. If we interpret the GAMSO as the current view on strategic activities and capabilities in official statistics, then computing is sorely missing. Poignant, because it is widely recognized in the official statistics community that the ‘data revolution’ is one of the key drivers for innovation in the statistical office [11].
As an overarching view on computing with data is missing, statistical programming tasks often end up in the hands of either domain experts, methodologists, or IT developers. Neither of them have computing with data as a formal task description, and each of them typically has a subset of the skills necessary to perform these tasks. Domain experts usually have some experience with data analyses, but often lack the software development skills to build a reliable production system. Methodologists with a background in STEM usually have experience in writing numerical code, but lack software development skills to develop solid, production-ready libraries. And IT developers usually know about software development, but often lack insight in numerical issues, data circumstances, and statistical models.
The lack of a helicopter view on ‘computing with data’ can and will result in the wrong match between skills and tasks, which again results in poor design choices, leading to inefficient and hard to maintain code bases. Examples that this author has observed in practice include imputation methods (including estimation of model parameters) implemented in SQL; complex data transformations expressed in SPSS syntax; production systems build in office software (spreadsheets, local databases) that can not be moved from one directory to another without breaking software.
In this paper we first discuss the pervasiveness of computing in the statistical office, based on the Generic Statistical Business Process Model [12] (Fig. 1). We then discuss computational topics relevant to the statistical office in more depth (Fig. 2). We argue that statistical programming is a core competence within statistical organizations. It therefore deserves attention on a strategic level, including a coherent vision on skill sets, educational and personal growth, and career paths. To open the discussion on this topic, we introduce the recently coined role of Research Software Engineer [13] in the area of official statistics. To provoke and guide the discussion and to concretize the importance of computational skills in the office, we also define a six-semester bachelor’s degree curriculum with the aim of teaching students methods that are typical for official statistics, such as disclosure control, data editing, and index numbers.
2.Computing in official statistics
We shall focus on the broad task of computing with data in the statistical office. This includes anything having to do with transforming, analyzing, and visualizing data – including interactive graphics and dashboards. It also includes developing new cross-cutting tools or components that can be reused throughout the office. And it also includes managing data production.
We exclude infrastructural issues, that are not directly related to the production of official statistics. This includes setting up administrative systems, operating systems and (network) infrastructure, hardware configuration, rights management, authentication, website management, and so on. These topics are important to any organization but we consider them as generic IT services that are not specific to data processing.
2.1Types of computing
Computing includes a very broad class of activities, but for this paper we divide it into three rough subgroups: Transformation, Analysis, and Reporting.
With Transformation we mean any operation that either selects data, or leaves the information content intact. The goal of data transformation is often normalizing data into a standard format that can be analyzed. This includes activities such as filtering records based on properties, joining different tables, renaming or restructuring columns, type conversion, renaming the levels of a categorical variable, and so on. It also includes sampling as a form of selection and fuzzy joining as a form of joining. We also consider parsing files, such as JSON, HTML, or XML into a rectangular format part of transformation. Similarly, text extraction (from free text) or deriving a Bag-of-Words representation of a corpus are all considered transformation, since these consist of selecting information from the original data. Translating scanned documents into textual representation using Optical Character Recognition (OCR) also falls under this definition since in the ideal case this operation does not lead to information loss and is merely a change of representation.
The skills involved in Transformation activities include basic data manipulation and management, knowledge of data transmission standards, parsing and text processing, fuzzy matching techniques. It also implies up-to-date knowledge of a wide variety of technical tools, ranging from OCR to XML parsers.
Analysis is here again defined as a very broad class of activities. It includes obvious activities such as estimation, aggregation and modeling, but also statistical disclosure control, seasonal adjustment, benchmarking, and data validation (in the extent to which that can be automated). Deriving new variables from existing ones is also counted as a form of analysis in our current discussion. Finally, we also count optimization and implementing new algorithms and methodology as part of Analysis.
0pt 0pt
Table 1
Importance of statistical computing by phase in the Generic Statistical Business Process Model. N indicates the number sub-processes GSBPM phase. The ‘Activity’ column counts in how many GSBPM sub-processes computing Using existing tools, or Building new tools. The ‘Role’ column indicates in how many cases statistical computing is either a Core or Supporting activity to the GSBPM process. The ‘Type’ column indicates in how many GSBPM processes concern mainly Transformation (T), Analyses (A) or Reporting (R)
| Activity | Role | Type | |||||||
|---|---|---|---|---|---|---|---|---|---|
| GSBPM phase | N | Use | Build | Core | Support | T | A | R | |
| 1 | Specify | 6 | 1 | 1 | 0 | 1 | 1 | 1 | 1 |
| 2 | Design | 2 | 4 | 1 | 2 | 2 | 1 | 4 | 1 |
| 3 | Build | 3 | 4 | 3 | 3 | 1 | 2 | 3 | 2 |
| 4 | Collect | 2 | 2 | 0 | 1 | 1 | 2 | 0 | 0 |
| 5 | Process | 1 | 7 | 0 | 7 | 0 | 2 | 5 | 0 |
| 6 | Analyse | 0 | 5 | 0 | 4 | 1 | 0 | 5 | 2 |
| 7 | Disseminate | 4 | 1 | 0 | 1 | 0 | 0 | 0 | 1 |
| 8 | Evaluate | 1 | 2 | 0 | 0 | 2 | 2 | 1 | 1 |
| Total | 44 | 26 | 5 | 18 | 8 | 11 | 19 | 8 | |
Figure 2.
A broad range of topics that are relevant to statistical computing in official statistics. The image is adapted from [14]. The list is not exhaustive but indicative of the breath of skills needed in the statistical office. The category ‘Official Statistics’ includes topics that are specific to official statistics. The grouping is not absolute, and some topics occur in two groups.
![A broad range of topics that are relevant to statistical computing in official statistics. The image is adapted from [14]. The list is not exhaustive but indicative of the breath of skills needed in the statistical office. The category ‘Official Statistics’ includes topics that are specific to official statistics. The grouping is not absolute, and some topics occur in two groups.](https://content.iospress.com:443/media/sji/2021/37-3/sji-37-3-sji210862/sji-37-sji210862-g002.jpg)
Skills related to the Analysis category as defined in this text, include statistical modeling and aggregation, numerical methods, working with rule-based systems, optimization, and programming for computational efficiency.
The third and last category we use in this work is Reporting. This includes the design and implementation of data visualisations, designing tables, creating interactive graphics, automated reporting, and developing dashboards. This category again implies a wide range of technical skills, including (perception of) color scales, data visualisation principles, event-driven (GUI) programming, technical (web) standards for dashboard development, interactive graphics programming, and more.
Summarizing, the above distinction into Transformation, Analysis, and Reporting splits computing activities very roughly into preparatory actions, data analysis and cross-cutting work, and output-creating activities.
2.2GSBPM
The Generic Statistical Business Process Model (GSBPM) will be used to map in which part of the organisation computing plays a role, what role it plays, and which type of computing takes place. We assume that the reader has some familiarity with the GSBPM, but briefly, this model separates all activities performed by a statistical office into eight phases, such as ‘Specify needs’ (phase 1), ‘Collect’ (phase 4), and ‘Analyze’ (phase 6). Each phase is again subdivided into a varying number of sub-processes. In total, the GSBPM identifies 44 separate sub-processes performed by statistical offices. Examples include ‘Identify concepts’ (sub-process 1.4) and ‘Validate output’ (sub-process 6.2).
In what follows, we study the importance of computing for each sub-process in the GSBPM. We allow ourselves a few small liberties in interpreting the GSBPM, releasing some of the constraints that it (implicitly) imposes. First, the GSBPM is developed with an output-driven statistical office in mind. Roughly, the statistical office specifies statistical needs and outputs in collaboration with external stakeholders and based on that designs its data collection and statistical production process. However, in the era of data ubiquity, data driven approaches have become commonplace since they might allow statistical organizations to produce statistics that are new, of higher frequency, published faster, or more relevant [15]. So we take this approach into account when judging the importance of computing in GSBPM sub-processes. Second, the GSBPM focuses on processing survey and administrative data, with explicit activities for designing samples (activity 2.4) and computing weights (activity 5.6). Where necessary, we interpret GSBPM activities in a broader context. Finally, GSBPM primarily describes production processes. Cross-cutting activities, including long-term research are not included explicitly. We will however find a spot for them, in activity 2.5.
2.3Computing in the GSBPM
Figure 1 shows for which sub-processes in the statistical office computing plays an important role. A distinction is made between computing being the core activity (solid squares), supporting activity (dashed squares) or no computing involved (no square). We also indicate whether the computational activity concerns building computational tools (red), or using them (blue). A violet square indicates that both building and using takes place at the GSBPM activity. Finally, the labels inside the square indicate whether the computing involves mainly Transformation (cogwheel), Analysis (magnifying glass), or Reporting (graph), or a combination thereof. The results are also summarized in Table 1.
In what follows we focus on summarizing this analyses, and highlight a few cases where the classification was less obvious. A complete overview of the rationale behind the labeling found in Fig. 1 can be found in Appendix A.
We find that in 26 out of 44 business processes (60%) computation is either a core or a supporting activity. Unsurprisingly, computing is a core activity mainly in the ‘Build’, ‘Process’, and ‘Analyse’ phases of the GSBPM. One exception is activity 2.5: ‘Design processing and analyses’.
This sub-proces designs the statistical processing methodology to be appied during the ‘process’ and ‘analyse’ phases […].[12]
We interpreted this as to include methodological research and development of generic tools that make new methodology available, for example as an R package or Python module. In that reasoning, both the design (research) and implementing the methodology (building) are core activities in 2.5. The two other places outside of ‘Build’, ‘Process’ and ‘Analyze’ where computing is a core activity are sub-process 4.1, where sampling frames are created and sample selection takes place, and 7.2 where output in the form of graphs, tables, and maps are prepared.
In eight cases (almost 20%), computing is a supporting activity. An important case is sub-process 1.5: ‘Check data availability’. One sub-activity is checking whether traditional data sources can be (re)used to produce desired output. Such checks typically include data exploration and building prototype systems. However this activity also includes “research into potential administrative or other non-statistical sources of data” [12]. For new data sources this might imply a lot of computational work including data exploration, developing and testing new methodologies, and building prototype production systems. Recent examples include work on using new sources such as Mobile Network Operator (MNO) data [16, 17], or Automated Identification System (AIS) data [18]. Indeed, any data-driven approach to official statistics – recent ESS projects on Big Data being prime examples [19, 20], implies an important role for computing with data. Still, we judge that computing has a supporting role here since the subprocess yields a go/no-go decision that is informed by computation amongst other considerations.
Other places where computing has a mostly supporting role include most of the ‘Design’ (2) and ‘Evaluate‘ (8) phases.
The types of computation indicated as ‘Transform’ play a role in nine GSBPM sub-processes, including four core computational sub-processes in the ‘Build’, ‘Collect’ and ‘Process’ phases. Sub-process 4.1 (create frame and select sample), directly falls under the definition of Section 2.1. In sub-process 3.1 (reuse or build collecting instruments), data transformation plays a role for example in developing and testing web scrapers or software for harvesting sensor data. In this case we again interpreted the GSBPM in a context beyond survey and administrative data.
We see that the ‘Analyses’ type of computation, (see Section 2.1) plays a role in no less than nineteen GSBPM sub-processes. Thirteen of those are processes where computation is a core activity and nine of those again are in the ‘Process’ or ‘Analyze’ phase. Analyzing data and building tools for data analyses are clearly and unsurprisingly important skills in the statistical office. Indeed, ‘Analyses’ is a relevant type of computing in every phase except in the ‘Dissemination’ phase. In the ‘Specify needs’, ‘Process’, ‘Analyse’ and ‘Evaluate’ phases, the emphasis is on the modeling and aggregation side of ‘Analysis’, while in the ‘Design’ and ‘Build’ phases, the implementation of new algorithms and configuration of production systems plays a more prominent role.
The most important roles for ‘Reporting’ are in 7.2 where output visualisations are created, and in the Analyse phase where they are used to analyze and interpret the output. In the Specify needs, Design, and Evaluate phases, ‘Reporting’ plays a supporting role.
In summary, we find that computing plays a significant role in more than half of of all GSBPM processes. In 40% of all processes it is a core activity. Transformation as a type of computation plays a role in one out of four GSBPM sub-processes; Analyses in four out of ten, and reporting in almost twenty percent of all GSBPM sub-processes.
3.Skills for computing in the statistical office
Research software is fundamental to today’s research, yet it does not receive the recognition it deserves. Akhmerov et al. (2019) [21]
Given the importance of computing with data in the statistical office, what skills are needed? Inspired by [14], a set of computing-related topics encountered in computing for official statistics are depicted in Fig. 2. The set of topics is not meant to be exhaustive but indicative of the breadth of skills that are needed in the office.
We distinguish a number of overlapping groups of skill sets. The groups on computational statistics (including the ‘official statistics’ group), reporting and visualisation, and computational statistics can be seen as core skill sets, necessary to get the basic work done. The skill sets in software engineering and data management focus on making software that is production-ready. For example, statistical computing includes imperative programming skills, while software engineering includes documenting, testing and version control. Similarly, statistical computing includes data manipulation, but data management also includes information models, metadata, and databases.
Considering the large set of skills, two questions arise. First, how should such skills be embedded in an organization and second, which curriculum supports it?
3.1The research software engineer
The term research software engineer (RSE) is one of the professional roles emerging in academia and data-intensive industries [21, 22]. According to the OECD, “an RSE is responsible for software engineering based on an understanding of the research goals” while a data analyst is responsible for conducting analysis on the data based on an understanding of software [22]. NSIs usually define formal roles for data analysts, IT developers, and methodologists. Without a formal place for RSEs, the tasks that typically fit an RSE must then be divided over those three roles.
Although the role of RSE was originally defined in the context of academic research [13], this role is certainly relevant for a data-intensive field like Official Statistics. After all, statistical offices abide by scientific principles [23] and measuring the state of society should in this sense be interpreted as a long-term research project.
Moreover, as data-driven approaches to producing Official Statistics become more important [24], the process of developing new production systems will mimic development processes that are typical for research software, rather than traditional IT software development processes. The latter is driven by specifications derived from output quality requriements defined by users, while the former is driven by exploration and the question of what can be achieved with a given data source. This means that both understanding the research goals and understanding research as an endevour are important skills for anyone building a modern statistics production system. Neither of these capacities are associated with IT development. On the other hand, the capacities that are associated with IT development, such as solid software engineering skills are not associated with data analysts and methodologists. Thus, the role of RSE is defined to fill that gap.
Indeed, organisations such as the OECD [22] and the Society of Research Software Engineers [25] urge academia and data intensive organisations to formally define a role for RSEs. Explicitly, “There is a need for digitally skilled researchers as well as a new cadre of professional support staff, most notably data stewards and RSEs.” and “There is a need for incentive mechanisms both for researchers and research support professionals to encourage and reward acquisition and application of digital skills. There are a number of published reports that emphasise the lack of incentives and career paths for digitally skilled personnel” [22]. Although the last remark refers to reports that study academic careers [26, 27], we consider it unlikely that the situation is different for Statistical Offices, simply because the role of RSE has yet to be recognized.
At this point it is good to distinguish between an RSE and a data scientist. Although the skill set of a data scientist sits somewhere between those of a data analyst, a methodologist, and an IT developer, the focus of data science is still more on analyzing data using existing software then on delivering new software. As an illustration, a data scientist could train a machine learning model that can be used in a specific production process, while an RSE could write a generic methodological software library that can be used across different production processes.
Although the literature on RSE does mention the lack of career paths, no explicit mention appears to be made on how such a career path might look like. For this we propose a simple junior-medior-senior model to indicate at which levels an RSE might operate in the statistical office.
Following common practice in IT and data science we describe three persona’s: a junior, medior, and senior RSE. This proposal should be understood as a first attempt to start the discussion on the role of RSEs in the official statistics community, and not as the final word on it. We give informal descriptions of both technical and soft skills.
A Junior RSE is capable of programming in several programming languages, including at least SQL, a scripting language like R or Python, and has at least some experience with a compiled language like C/C++ or Java. Junior RSEs have a firm grasp of basic programming constructs including functions, scope control structures, object orientation and perhaps functional programming. They also know about the importance of (unit) testing frameworks, documentation, and version control and are capable of using those when asked. Junior RSEs are assigned development tasks such as programming small-scale data processing systems or parts of larger systems but they do not necessarily design them. A Junior RSE has basic knowledge of data representation, encoding, and numerical issues and knows when problems in these areas may arise. They are proficient with basic digital skills such as working with different file formats, file systems, and operating systems. As somebody who works in official statistics, they have experience with data modeling and analyses and they have at least once learned the math behind it. In projects, a Junior provides input for making (design) decisions but typically does not make them.
A Medior RSE has all the skills of a Junior RSE but is also capable of analyzing user needs and translating that into a technical design for small to medium-sized production systems. This includes setting up formal data base schemas, and defining independent steps with their in- and output in a production process. Mediors have intimate knowledge of at least one or several of the computational topics related to Official Statistics such as advanced survey methods, seasonal adjustment, or SDC. They have sufficient knowledge of numerical methods and optimization to implement a professional and generic library in their area of expertise. There is at least one programming language in which they are so fluent that they can read and write it as if it was their natural language. Mediors can also distinguish between cases where hardware is the bottleneck versus when algorithms need to be redesigned, and can advise on such matters. They have a firm grasp of numerical methods and have at least once learned the math behind it. Juniors will typically ask mediors for advice when facing design or programming problems. Mediors also coach juniors and teach courses in their area of expertise. Mediors can be asked to participate in research for example to create better libraries or better methods in their area of expertise. Some of them (co)author articles and speak at conferences and user meetings. They are, in any case, well informed about the latest progress in their field. In projects, mediors contribute actively to decision making, often providing decisive input.
The Senior RSE has all the skills of a medior RSE, but is capable of designing complex production systems and libraries on both logical and technical level. A Senior is a recognized research-level expert in at least one computational topic of Fig. 2. This recognition is demonstrated by active contributions to the field, inside and outside the statistical office. For example by writing scientific publications and conference contributions. The work of a Senior may include designing or overseeing the design of complex production systems, and defining new research questions. A senior RSE is an experienced coach and leader of (research) projects. In this role, seniors have a network inside the statistical office and beyond. They are are capable of advising senior or strategic management regarding policies related to technical software and long-term research planning.
Needless to say, none of these personas can be represented in a single person. Figure 2 already demonstrates that computing in the statistical office requires teams rather than individuals. However, we hope that the above discussion will help starting a discussion on the role of Research Software Engineers in Official Statistics.
4.A bachelor’s degree in official statistics
What are the skills of the ideal official statistician? And what curriculum will get a student those skills? Part of the answer is given in the learning outcomes defined for the European Master’s of Official Statistics (EMOS) [2]. Although the EMOS program defines a set of very relevant skills for official statisticians, one issue is that the field is very broad and the whole EMOS programme is just two semesters. Together with the fact that students also have to do research and write a MSc thesis, this leaves room for only very short courses on any given topic. For example in the Netherlands, the EMOS courses on Data Management, Statistical Disclosure Control, or Data Editing each are each about one half ECTS11 points or 14 hours of study. Such a short time is sufficient to get somewhat familiar with the most important topics in a subfield but hardly enables one to manage data, perform SDC on a given table, or set up a data editing system. A second issue is that EMOS students come from a wide set of backgrounds, ranging from STEM to social science. The lack of a common basis makes treating (advanced) technical and computational topics such as error localization or survey analyses a challenge.
In this section we will therefore take the liberty, again with the aim of starting a wider discussion, of defining a full three-year bachelor’s degree programme in official statistics. The computational topics mentioned in Fig. 2 are thus embedded into a wider programme that also includes domain knowledge such as demography or macro-economics. However, the curriculum is aimed to be self-contained: it contains methodology that is specific to official statistics and all the basic courses leading up to that. We also pay a lot of attention to programming skills, since as we have seen, producing official statistics is a deeply computational task.22
The curriculum presented below was in part inspired by the curricula that have been proposed in the area of data science [1, 28, 29, 30, 31, 32]. We note that The American National Science Foundation Directorate for Mathematical and Physical Sciences (StatSNSF) defines data science as the science of planning for, acquisition, management, analysis of, and inference from data [29]. Apart from the domain knowledge and policy context, this reads like a job description for official statistics, and it shares the deep need for computational competences.
We present a six semester bachelor’s curriculum, each semester covering 20 ECTS of study material. The curriculum is in part driven by the question: ‘what would it take to properly teach students methodology that is specific or typical to official statistics?’. Such methodologies include at least disclosure control, data editing, and certain time series methodologies. Furthermore, we embed these methodologies into a firm understanding of the statistical domains and the role of official statistics in government and society.
Following [31], we recognize the following basic skills: computational and statistical thinking, mathematical foundations, model building and assessment, algorithms and software foundation, data curation, and knowledge transference. To create an official statistics curriculum we further extend these skills with macro-economics, demography, ontologies and metadata, policy, governance and international context, and privacy and data safety. A broad overview of topics and their weight in the curriculum is given in Fig. 3.
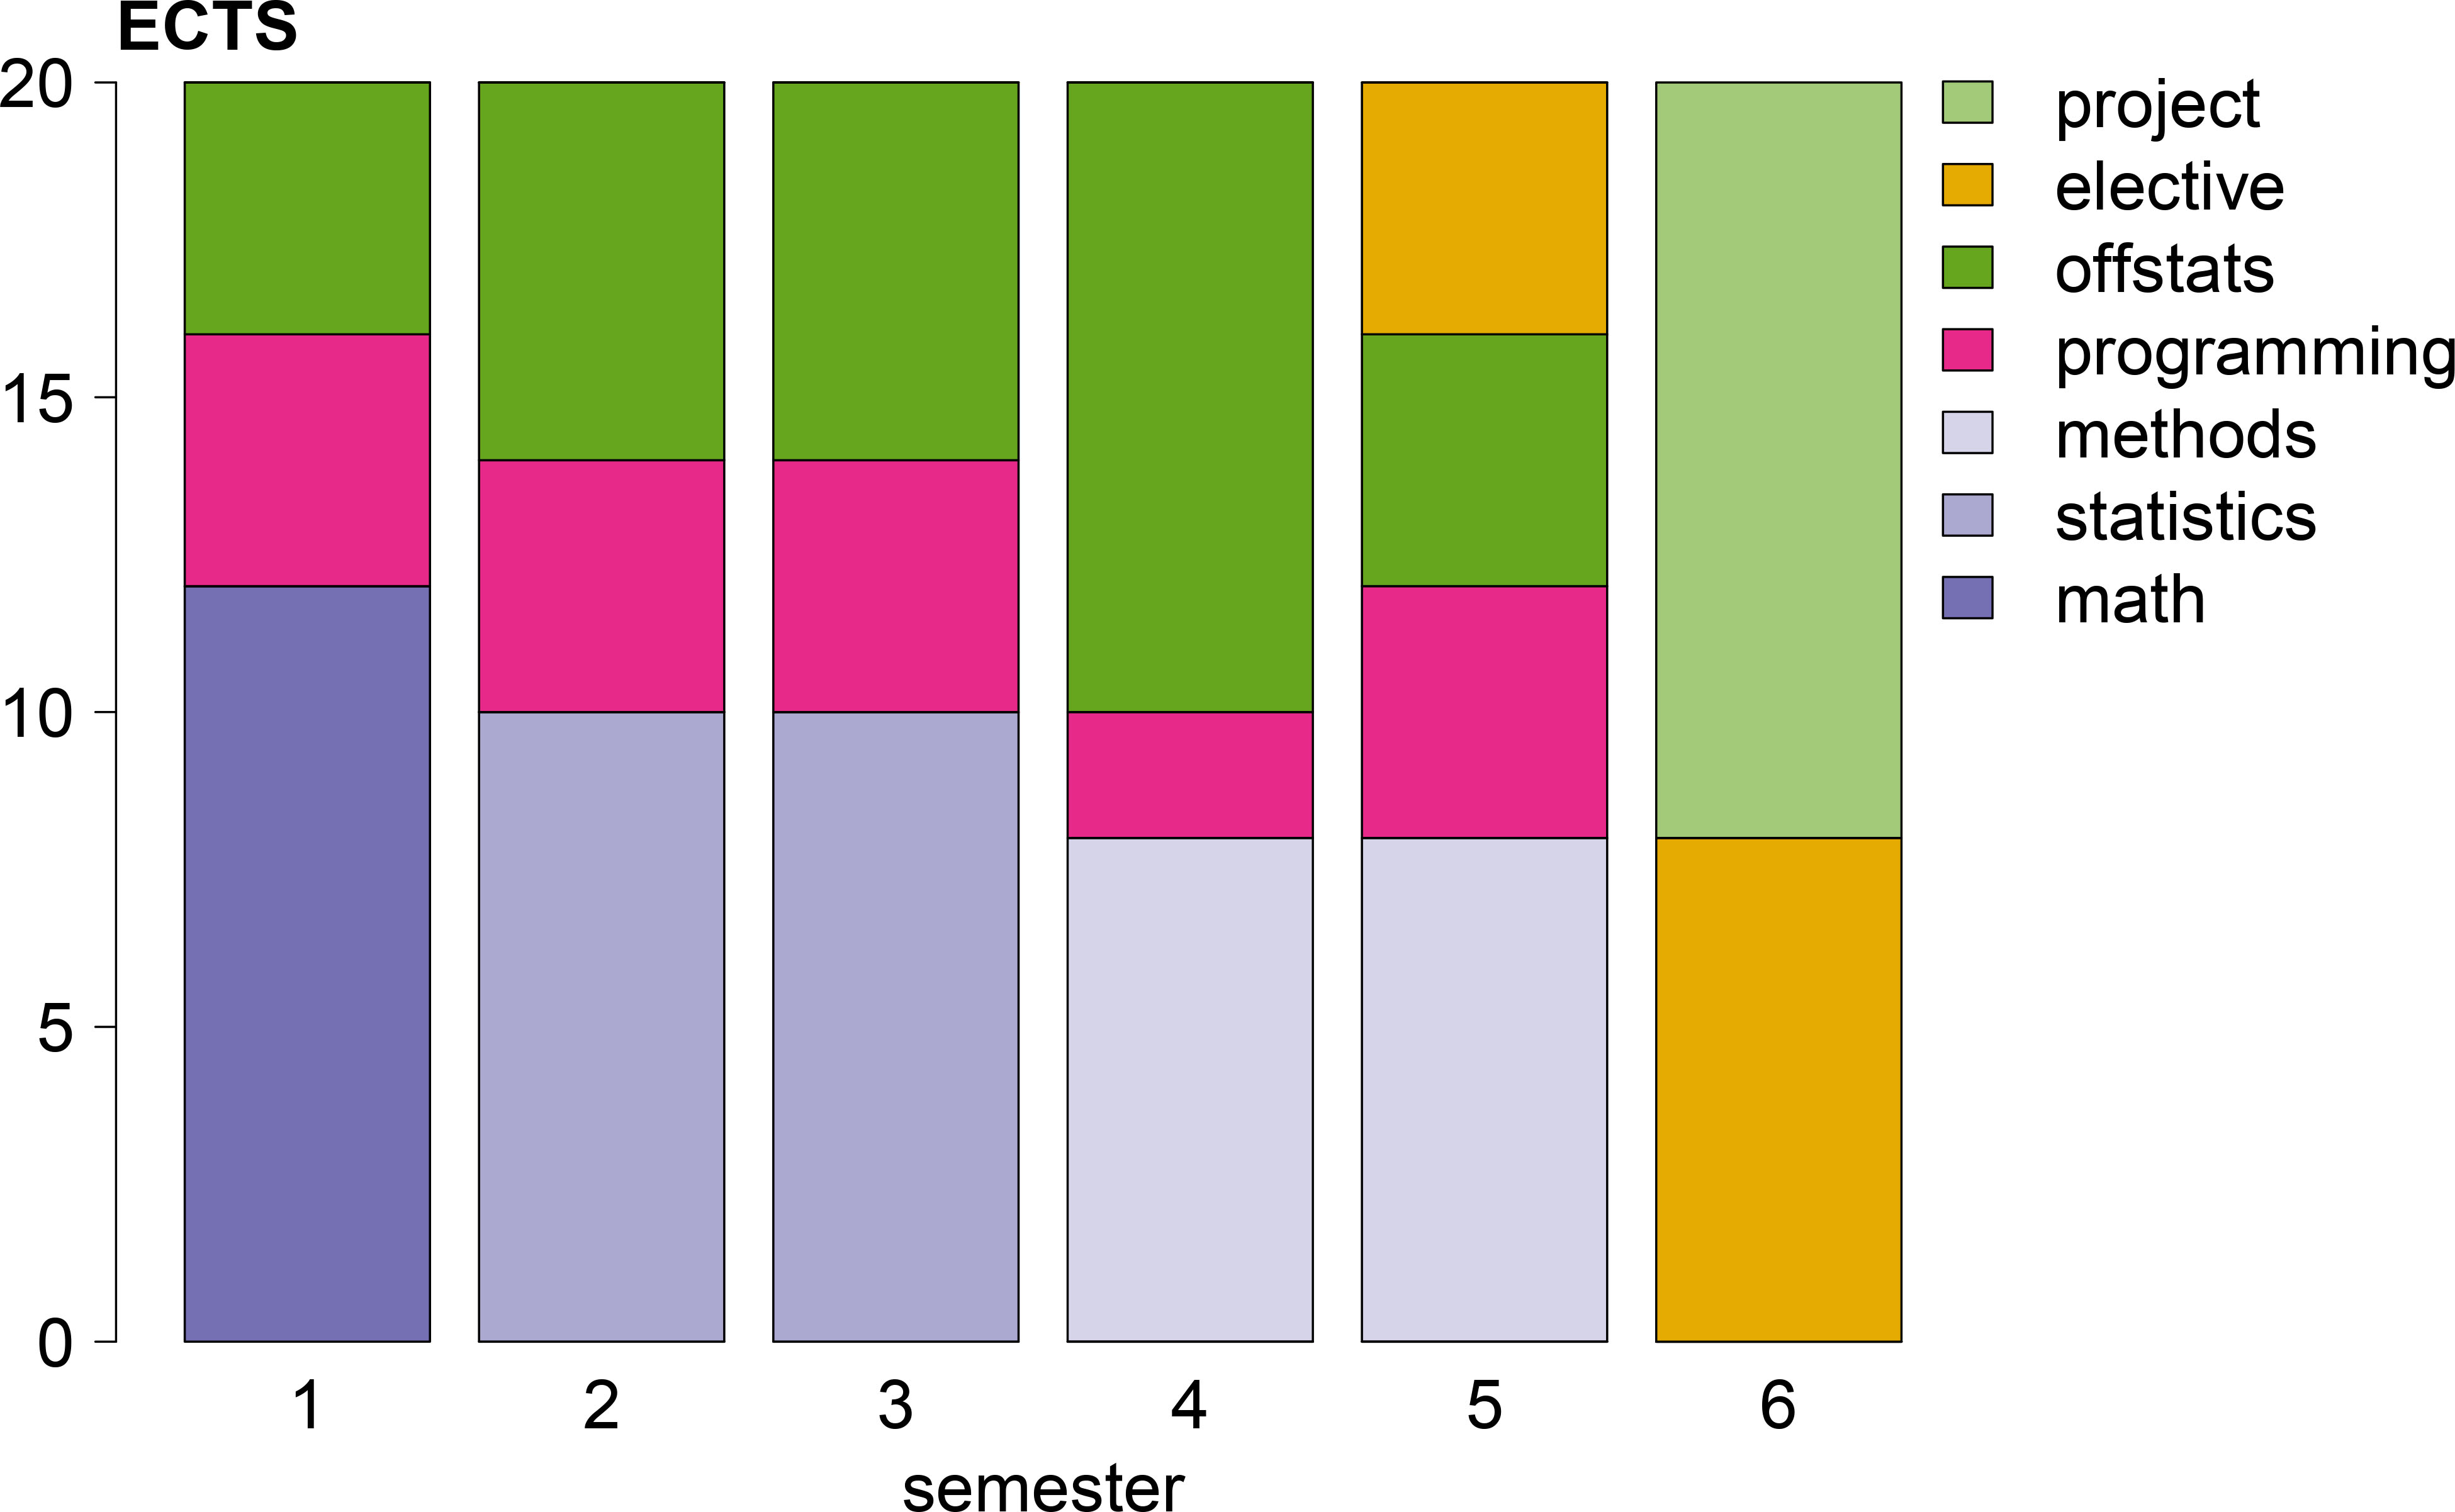
Figure 3.
Overview of the Official Statistics Bachelor’s degree in ECTS points. ECTS points are aggregated to main areas, including mathematics, statistics, official statistics methodology, programming, domain knowledge (offstats), elective courses and projects.
4.1The curriculum
The first semester mostly prepares for topics that follow. It teaches basic mathematical and programming skills, and introduces the students to public administration and the role of official statistics. The calculus course focuses on investigating functions and optimization, since many methodological problems in official statistics can be written as (constrained) optimization problems. Similarly, one of the most important results of the linear algebra course is an understanding of eigenvalues and eigenvectors as this underpins many statistical models, including PCA. In order to make students thoroughly digitally capable, they will be programming throughout almost the whole curriculum. Semester 1 starts with a basic course in programming an algorithmic thinking.
Semester 1
• Calculus (6 ECTS): Set theory, calculus on the real line, investigating functions, multivariate calculus, the Lagrange method.
• Linear Algebra (6 ECTS): Vectors and vector spaces, linear systems of equations and matrices, matrix inverse, eigenvalues, inner product spaces.
• Introduction to programming (4 ECTS): Imperative programming, algorithm design, recursion, introduction to complexity, practical assignments.
• Public policy and administration (4 ECTS): Government structure and institutions, policy-making and implementation, role of official statistics, international context, privacy.
Semester 2 introduces more basic math and programming skills and the first main phenomenon measured in official statistics: economy. Needless to say that this topic is extremely broad and subtopics can not be treated in any depth. However, there is room for electives later on in the curriculum that allow interested students to gain more in-depth knowledge of particular topics. The current economics course focuses on the main macro-economic concepts and discusses how phenomena are measured in practice in official statistics. The Probability and statistics course builds an understanding of probability and survey sampling and prepares for later work on advanced (survey) methods and statistical analyses. The course on linear programming builds on the technical topics from the first semester and will allow students later on to formulate problems concerning for example data cleaning and disclosure control. The course on programming with data brings the probability and statistics course into practice, and starts teaching good programming practices such as reproducibility and version control.
Semester 2
• Probability and statistics I (6 ECTS): Probability, discrete and continuous distributions, measures of location and variation, Bayes’ rule, sampling distributions, estimation of mean and variance, CLT, ANOVA, linear models.
• Linear programming and optimization (4 ECTS): Recognizing and modeling LP problems, simplex method, duality, sensitivity analysis, intro nonlinear optimization. Practical assignments using software tools.
• Programming with data I (4 ECTS): Statistical analysis, data visualisation and reporting, programming skills and reproducibility, version control, testing, project.
• Macroeconomics (6 ECTS): National Accounts and economic classifications, economic growth, labour market, consumption and investments, inflation, macro-economic equilibrium, budget policy and government debt. The main economic surveys.
Semester 3 builds upon the mathematical and programming skills developed in Semesters 1 and 2 by treating advanced modeling and inference. It also introduces the second major phenomenon measured in official statistics: demography. The subtopics are based on the book by Preston [33] and should also include the main demographic surveys (census, household survey, …). The programming course focuses on data representation, data management and metadata.
Semester 3
• Models in computational statistics (6 ECTS): GLM, regularization, Tree models, Random Forest, SVM, unsupervised learning, model selection, lab with practical assignments.
• Probability and statistics II (4 ECTS):Bayesian inference, Gibbs sampling and MCMC, maximum likelihood and Fisher information, latent models.
• Programming with data II (4 ECTS): Relational algebra and data bases, data representation, regular expressions, and technical standards, ontologies and metadata, practical assignments.
• Demography (6 ECTS): Fertility, mortality, life table and decrement processes, age-specific rates and probabilities, stable and non-stable population models, cohorts. The main demographic surveys.
The fourth semester is to a large extend devoted to methods that are specific to official statistics. It builds upon the basic mathematical, programming and optimization techniques that were developed in the previous semesters. Topics include advanced survey sampling methodology and advanced methods for analyzing surveys as well as time series analyses. The time series course should be followed by the course on index numbers, another one of the most important outputs of official statistics. We also introduce big data infrastructure mainly in a short practical project. Finally, there is a course in ethics and philosophy of science since any academic should be able reflect on the value of their field, it’s place in society, and the ethical responsibilities of a scientist.
Semester 4
• Methods for official statistics I (4 ECTS): Advanced survey methods, weighting and estimation, calibration, SAE, handling non-response.
• Methods for official statistics II (3 ECTS): Economic time series, seasonal adjustment, benchmarking and reconciliation, time series models.
• Price and quantity index numbers (3 ECTS): indices of volume and price, Axioms, transitivity, additivity, index formulae (Laspeyre, …), modeling, and decomposition.
• Programming with data III (2 ECTS): Infrastructure for computing with big data, map-reduce, key-value stores, project.
• Communication (2 ECTS): Scientific and technical writing, principles of visualization, dissemination systems.
• Ethics and philosophy of science (2 ECTS).
The fifth semester moves on with more methodology specific to Official Statistics, including SDC, Data Editing, and Questionnaire design. There is a large programming project where a student needs to demonstrate computational knowledge gained across the previous semesters. Furthermore, there is 4 ECTS room for elective courses, allowing the student to prepare for the final assignment in semester six.
Semester 5
• Methods for official statistics III (4 ECTS): Principles of data editing, Fellegi-Holt error localization, methods for imputation.
• Methods for official statistics IV (4 ECTS): Information Security and Statistical Disclosure Control.
• Research methods in social science (4 ECTS): Questionnaire design and field research, measurement models and latent variables.
• Elective course (4 ECTS): In the area of social science, economics, econometrics, computer science, or math & statistics.
• Large programming project (4 ECTS): E.g. a small production system, a dashboard, data cleaning system, an R package or python library.
The last semester consists of 8 ECTS of elective courses in a specialisation chosen by the student. This may be in one of the domains (economy, demography) or in a technical or methodological area. There is also a larger 12 ECTS research project ending with a thesis.
Semester 6
• Elective courses (8 ECTS): Preparing for thesis research.
• Bachelor’s thesis (12 ECTS): Research in Macroeconomy, Demography, or Methodology. Preferably at an NSI or international organization.
5.Summary
Official Statistics is a deeply computational and technical field. If computing is not the core task of Official Statistics, it most certainly is a core competence.
In this paper we have demonstrated, by analyzing activities across the GSBPM, that computing, and more specifically technical computing is a highly needed skill across the Statistical Office. Next, we provided a rough overview of the various computational skills that are employed to fulfill the needs of a statistical office. After this we try to open the discussion on the emerging role of Research Software Engineers in academia and data-intensive industries. We discuss their role in Statistical Offices in relation to IT developers, data analysts, data scientists and methodologists. We also propose to formalize the role of RSEs in statistical offices and as a starting point for the discussion, discuss what might be expected from junior, medior, and senior level RSEs. Finally, in a (hopefully) provocative move, we define a bachelor’s curriculum for the Official Statistician. Based on the question: ‘what does it take to learn methodologies specific to official statistics?’, an attempt is made to show what such an education could look like. It allows one to reflect on the enormous importance of computation and digital skills in the modern Statistical Office, and perhaps serve as a reference for further discussion on how to further develop education in of Official Statistics.
Notes
1 European Credit Transfer and Accumulation System.
2 The curriculum presented here is based on a talk given by the author at the Faculty of Mathematical Sciences at the Complutense University of Madrid in the spring of 2019.
References
[1] | Nolan D, Temple Lang D. Integrating computing and data technologies into the statistics curricula. in: Proceedings of the Eighth International Conference on Teaching Statistics; (2010) . pp. 1-6. |
[2] | ESS. European master in offical statistics; (2018) . https://ec.europa.eu/eurostat/cros/content/emos_en. |
[3] | ESS. European statistical training programme; (2021) . https://ec.europa.eu/eurostat/web/european-statistical-system/training-programme-estp. |
[4] | R Core Team. R: A language and environment for statistical computing. Vienna, Austria; (2021) . Available from: https://www.R-project.org/. |
[5] | Van Rossum G, Drake Jr FL. Python tutorial. Centrum voor Wiskunde en Informatica Amsterdam, The Netherlands; (1995) . |
[6] | ESS. Centre of excellence on statistical methods and tools; (2021) . https://ec.europa.eu/eurostat/cros/content/centre-excellence-statistical-methods-and-tools_en. |
[7] | Modernstats. Common statistical production architecture. United Nations Economic Committee for Europe; (2021) . Version 2.0. |
[8] | ESS. Implementing Shared Statistical Services; (2020) . https://ec.europa.eu/eurostat/cros/content/implementing-shared-statistical-services_en. |
[9] | ten Bosch KO, van der Loo MPJ. Awesome official statistics software; (2017) . https://www.awesomeofficialstatistics.org. |
[10] | Modernstats. Generic activity model for statistical organisations. United Nations Economic Committee for Europe; (2019) . Version 1.2. |
[11] | ESS. ESS vision 2020; (2014) . https://ec.europa.eu/eurostat/web/ess/about-us/ess-vision-2020. |
[12] | Modernstats. Generic statistical business process Model. United Nations Economic Committee for Europe; (2019) . Version 5.1. |
[13] | Cohen J, Katz DS, Barker M, Hong NC, Haines R, Jay C. The four pillars of research software engineering. IEEE Software. (2020) ; 38: (1): 97-105. |
[14] | Nolan D, Temple Lang D. Computing in the statistics curricula. The American Statistician. (2010) ; 64: (2): 97-107. |
[15] | Daas PJ, Puts MJ, Buelens B, van den Hurk PA. Big data as a source for official statistics. Journal of Official Statistics. (2015) ; 31: (2): 249. |
[16] | Salgado D, Oancea B, Sanguiao-Sande L. Inference with mobile network data. in: New Techniques and Technologies; (2019) . https://www.researchgate.net/publication/331630127_Inference_with_mobile_network_data. |
[17] | Tennekes M, Gootzen YAPM, Shah SH. A Bayesian approach to location estimation of mobile devices from mobile network operator data. (2020) ; 6-20. |
[18] | UN. Task team of the UN committee of experts on big data and data science for official statistics; (2021) . https://unstats.un.org/bigdata/task-teams/ais/index.cshtml. |
[19] | ESS. ESSnet on big data; (2016) . https://ec.europa.eu/eurostat/cros/content/essnet-big-data_en. |
[20] | ESS. ESSnet on Big Data II; (2018) . https://ec.europa.eu/eurostat/cros/essnet-big-data-2_en. |
[21] | Akhmerov A, Cruz M, Drost N, Hof C, Knapen T, Kuzak M, et al. Raising the profile of research software: Recommendations for funding agencies and research institutions. Tech. Rep., Netherlands eScience Center, Amsterdam, the Netherlands; (2019) . |
[22] | Barker M, Dumolyn B, van Nieuwerburgh I, Castle D, Arenas M, Repanas K, et al. Building digital workforce capacity and skills for data-intensive science. Organisation for Economic Cooperation and Development (OECD); (2020) . |
[23] | UN. United nations fundamental principles of official statistics: implementation guidelines. United Nations Statistics Division; (2015) . |
[24] | De Broe S, Struijs P, Daas P, van Delden A, Burger J, van den Brakel J, et al. Updating the paradigm of official statistics. CBDS Working Paper 02-20, Statistics Netherlands, The Hague/Heerlen; (2020) . |
[25] | Society of Research Software Engineers; (2021) . Available from: https://society-rse.org/. |
[26] | Berente N, Howison J, King JL, Ahalt S, Winter S. Organizing and the cyberinfrastructure workforce. NSF; (2018) . Available from: https://ssrn.com/abstract=3260715. |
[27] | Buchorn M. Surveying the scale of the research-IT support workforce. Australian Research Data Commons; (2019) . Available from: https://ardc.edu.au/wp-content/uploads/2019/07/ARDC-National-Workforce-report-final-v3.pdf. |
[28] | Ganesh S. Data mining: Should it be included in the statistics curriculum. in: The 6th international conference on teaching statistics (ICOTS 6), Cape Town, South Africa; (2002) . |
[29] | Johnstone I, Roberts F. Data science at NSF: Draft report of StatSNSF committee. NSF; (2014) . https://www.nsf.gov/attachments/130849/public/Stodden-StatsNSF.pdf. |
[30] | Hardin J, Hoerl R, Horton NJ, Nolan D, Baumer B, Hall-Holt O, et al. Data science in statistics curricula: Preparing students to “think with data”. The American Statistician. (2015) ; 69: (4): 343-353. |
[31] | De Veaux RD, Agarwal M, Averett M, Baumer BS, Bray A, Bressoud TC, et al. Curriculum guidelines for undergraduate programs in data science. Annual Review of Statistics and Its Application. (2017) ; 4: : 15-30. |
[32] | Shelley M, Yore L, Hand B. Quality research in literacy and science education. Springer; (2009) . |
[33] | Preston SHP, Heuveline P, Guillot M. Demography: Measuring and modeling population processes. Springer Nature BV; (2001) . |
[34] | Bankier MD. Power allocations: Determining sample sizes for subnational areas. The American Statistician. (1988) ; 42: (3): 174-177. |
[35] | Schouten B, Peychev A, Wagner J. Adaptive survey design. Taylor & Francis; (2018) . |
Appendices
Appendix
Computation per GSBPM sub-process
In this appendix we justify the choices summarized in Fig. 1. We will briefly discuss computational aspects of each GSBPM sub-process. Many of the sub-processes have activities besides computational. We do not discuss these here, except when pointing out that computation plays no key role in a sub-process.
GSBPM 1.1–1.4; 1.6
Sub-processes 1.1–1.4 are about establishing needs, concepts, and output objectives while in sub-process 1.6 develops a business case is developed. Work mainly includes administrative activities, consultation with users of statistics, and reporting, so computing with data plays no important role in here.
GSBPM 1.5: Check data availability
This sub-process checks whether existing or new sources are suited for use. Especially in the case where new sources are investigated intensive computational research is often necessary to establish whether a source is reliable enough to be used as input for official statistics. Recent examples include web scraping, sensor data, mobile phone data, or image data [20]. The type of computational activities are mostly transformation and analyses. As this work is exploratory, the usual triple of activities in this sub-process will include Transformation, Analyses and Visualisation. Hence, we assign all three activities to this sub-process. Computation is a supporting activity here, because the goal output of this process is a decision, not a computational result.
GSBPM 2.1: Design output
To a large extent, activities in this sub-process do not rely on computing with data. However the exceptions are important, as they involve the design of confidentiality rules and quality aspects. Such activities are usually supported by some form of computation in attempts to optimize them. So the ‘Analyses’ type of computation applies here. As output design also incorporates design of visualisation, the ‘Reporting’ type of computation applies as well. The output of the sub-process is a design, not a computational result so we consider computing a supporting activity.
GSBPM 2.2: Design variable descriptions
This activity designs variables to be collected, but also the variables derived from them. Especially in the case of administrative or ‘big data’ sources, designing derived variables will involve computing with data. Deriving new variables falls under ‘Analysis’, and as the output of this sub-process is a design, and not a computational result, we consider computing a supporting activity.
GSBPM 2.3: Design collection
In the GSBPM description this includes organizational work and design of collection instruments such as questionnaires or web scraping tools. Work on tools for harvesting ’big data’ sources were already interpreted as computational work in GSBPM 1.5 so we will not repeat that here to avoid overlap.
GSBPM 2.4: Design frame and sample
For traditional survey-based statistics this involves optimizing the sampling design. This includes both choosing between sampling schemes, for example between equal or unequal probability sampling. It also includes optimizing the sample within a budget, based for example on Neymann allocation or power allocation [34]. This obviously involves computing of type ‘Analyses’. The output of this computational work is a principle output of sub-process 2.4, and hence we label it as a core activity.
GSBPM 2.5: Design processing and analysis
In this process the statistical methodology is created that is to be used in the ‘Process’ and ‘Analyze’ phases. Computing is a supporting activity when designing a methodology for survey-based statistics. For ‘big data’ sources the methodological design consists of algorithmic approaches, that are often based on extensive computational experimentation. In this work, we explicitly include general research into statistical methodology and tools. The output of this process therefore exists not only of (possibly new) methodology, but also of reusable tools implementing methodology. The type of computation is ‘Analyze’ in our definition. Since building reusable tools is part of this process, we deem computation a core activity.
GSBPM 2.6: Design production systems and workflows
The of this sub-process goal is to piece subprocesses together into a production process that runs smoothly and efficiently. Although some computation may in principle be needed when piecing methodological components together, this process is overwhelmingly organisational in nature, so we do not label it as a sub-process where computing is a core or supporting activity.
GSBPM: 3.1–3.3: Reuse or build tools for collection, processing, dissemination
In these sub-processes the tools for collecting, processing, or disseminating data are either reused or custom-build. We interpret this GSBPM sub-process as an activity that is bound to a certain output or production process. This means we exclude building generic, cross-cutting tools: these were included in GSBPM 2.5. We interpret the current GSBPM sub-processes as building data processing scripts for a specific output. These scripts typically reuse tools that are designed and built in sub-process 2.5. In some cases, specific tools will need to be built. For example for processing very large sources or data sources in an unusual format. Since software is one of the main outputs, computing is a core activity.
Regarding the type of activities, it involves ‘Analyses’ in all cases, as building tools is explicitly included in out definition (Section 2.1). In 3.1, which involves collection, Transformation will play an important role as well, and in building dissemination systems, the Reporting activity will be important.
GSBPM 3.4: Configure workflows
This sub-process implements the results of GSBPM 2.6 (design of production systems and workflows). It does not concern computation in the sense of this work.
GSBPM 3.5: Test production systems
This sub-process is strongly connected with sub-processes 3.1, 3.2 and 3.3. One may consider 3.5 as a part of the development cycle where software is build, tested, and improved where necessary. This concerns testing of components as well as their integration and interactions. We consider testing an integral, but supporting activity in phase 3. Since Transformation, Analyses, and Reporting all occur in sub-processes 3.1–3.3, they also occur here.
GSBPM 3.6: Test statistical business process
This involves running the whole production cycle on a small scale with the purpose of testing. Although this necessarily involves computing, the computational components were extensively tested in sub-process 3.5. We therefore deem sub-process mainly organisational and do not label it as a sub-process where computing is explicitly important.
GSBPM 3.7: Finalize production system
This sub-process includes activities such as documenting, training, and moving software components into production environment. We therefore do not label it as heavily relying on computation.
GSBPM 4.1: Create frame and select sample
Both activities mentioned in the title explicitly fall under the definition of the ‘Transform‘ type of computation (Section 2.1). Computation is a core activity as the main output of the subprocess coincides is generated by it.
GSBPM 4.2: Set up collection
This sub-process consists of getting all resources in place to run a collection. It is mainly organisational in nature and does not rely heavily on computing.
GSBPM 4.3: Run collection
This sub-process is difficult to label correctly in our classification, since it depends strongly on the type of collection. In cases of survey samples, computing can be important in adaptive survey designs as discussed by [35]. In such cases, computing is a supporting activity of type ‘Analyze’. For other sources it can involve running web scrapers or other forms of automated data retrieval. In these cases computing is a core activity of type ‘Transform’. We choose the latter as non-survey data sources play an increasingly important role in official statistics.
GSBPM 4.4: Finalize collection
This sub-process includes archiving the data for further use. In the GSBPM description it also includes processing steps such as Optical Character Recognition (OCR) on scanned documents, so formally this implies ‘Transformation’ as a core activity. We deviate a slightly from the GSBPM here and move OCR to the ‘Process’ phase. OCR changes the data, in this case from an image to machine-readable text, and we therefore feel it is a non-trivial data transformation that occurs beyond collecting data.
GSBPM 5.1 and 5.2: Integrate data and classify and code
Data integration combines data from several sources while ‘classify and code’ derives new (classifying) variables based on the raw data. Both are core computational activities that fall under the ‘Transform’ definition.
GSBPM 5.3–5.7: Validation, imputation, derive new variables, compute weights, aggregate
These are computational activities at the core: each step is only possible because computation is involved. They all heavily rely on tools that implement statistical methodology and are therefore mostly of the ‘Analyse’ type.
GSBPM 5.8: Finalize data files
This sub-process gathers data from the steps produced in 5.1–5.7. Although this does involve data handling, it is in this context mainly an administrative task and we therefore do not label it as a computational activity.
GSBPM 6.1–6.3: Prepare, validate, and interpret outputs
These are all computational core activities that analyze data prepared in phase 5 and create validated outputs. Activities include time series analyses such as seasonal adjustment, index calculation, or trend-cycle decompositions. It also includes validating outputs by analyzing them and comparing with previous outputs, outputs in related domains, or checking consistency with domain knowledge. All these activities require computational analyses of data.
GSBPM 6.4: Apply disclosure control
Application of disclosure control is a computational activity, that we classified under ‘Analyses’.
GSBPM 6.5: Finalize outputs
This sub-process involves several activities that are mostly of administrative nature, aimed at preparing the output for the dissemination phase. It includes for example translating outcomes (in multilingual countries), preparing documentation and determining release levels. Computing does not play an important role in this sub-process.
GSBPM 7.1; 7.3–7.5
These sub-processes are concerned with updating production systems, managing releases, promoting dissemination products and manage user support. These are mainly administrative or organisational in nature and do not involve computing.
GSBPM 7.2: Produce dissemination products
In this subprocess, the user-facing data products such as tables, visualisations and dashboards are produced. This a core computational task of type ‘Reporting’.
GSBPM 8.1 and 8.2: Gather evaluation inputs and conduct evaluation
The evaluation phase has a very broad definition in the GSBPM. It involves anything from incidental audits and peer reviews to continuous process mining. Looking at the computational side, we can interpret 8.1 and 8.2 as a business intelligence process where, data is gathered and analyzed with the purpose of improving processes and output: it is the statistical office applying statistics to itself. Since computation is only one of the many ways in which evaluation can take place, we allot it a supporting role here.
GSBPM 8.3: Agree on an action plan
This is an administrative activity, spelling out the actions to improve the current situation. Computation plays no important role in this subprocess.

