
Strengthening the competencies of policy makers for better use of data in public policy design1
Abstract
Statistical literacy is one of the main areas of work of the Global Network of Institutions for Statistical Training (GIST) established in 2017. While the scope of statistical literacy initiatives will range greatly from those intended for school children and teachers to those aimed at media representatives or general public, one of the areas where a dedicated Task Team of the GIST set out to undertake a more detailed analysis was related to the core data competencies for policy makers. The adoption of the Sustainable Development Goals by UN member States has led to a growing awareness around the importance of timely, robust, quality and disaggregated data for informing public policies and decisions and providing a solid evidence to address a number of complex policy issues related to ensuring more equitable policy outcomes and more coherence decision-making across different dimensions of sustainable development and different levels of governance from global to national and local. This article presents the results of a survey conducted by the GIST Task Team on Statistical Literacy back in 2018 with the participation of policy makers from various UN Member States, reviews core data competencies for policy makers, presents the free, self-paced e-learning course developed by UN Institute for Training and Research (UNITAR), UN Statistics Division and UN Economic Commission for Africa (UNECA) with support from the Swiss Government and using UNITAR’s Quality Assurance Framework, and discusses the ongoing work of the GIST on the inventory of statistical literacy initiatives as a new product developed by the dedicated Task Team.
1.Introduction
The Global Network of Institutions for Statistical Training (GIST) established in 2017 by a number of founding members with the stewardship from UN Statistics Division has identified the support to National Statistical Offices (NSOs) on statistical literacy of the intended users of official statistics as one of the core areas for its work. A Task Team was established in 2018 to initiate work in this area. One of the first things that the task team set out to do was to improve the understanding of the needs of the policy makers when it comes to a more effective and accurate use of data and the related competencies that need to be developed. The team has developed a statistical literacy survey questionnaire combining predominantly perception-based questions with a small number of objective assessment questions. The structure of the questionnaire was inspired by the earlier work of UN Economic Commission for Europe (UNECE) on the statistical literacy competencies. The questionnaire was sent to all Ministries in charge of coordinating the implementation of the Sustainable Development Goals (SDGs) in all United Nations Member States. In addition, the questionnaire was distributed to policy makers during the Voluntary National Review (VNR) workshop for the 2019 VNR countries, the 2018 Incheon workshop, a national workshop conducted by UNITAR in one of the African countries, and the second World Data Forum held in 2018 in Dubai. The results of the survey completed by the end of December 2018 showed that there was significant interest in leveraging new data sources and there was a need to strengthen core competencies related to the effective and accurate use and communication of data by policy makers. Based on that work and thanks to the partnerships and networking opportunities created through GIST, three United Nations agencies – United Nations Institute for Training and Research (UNITAR), United Nations Statistics Division (UNSD) and United Nations Economic Commission for Africa (UNECA) – worked together to develop, with funding support from the Swiss Development Cooperation, a dedicated e-learning resource to strengthen the core competencies of policy makers to enable better use of data for the achievement of the SDGs. The course has also benefitted from the peer review by the then Chair of the GIST.
2.Results of the survey on statistical literacy of policy makers
The competencies approach provides a helpful framework for thinking about the learning needs and structuring a learning response when it comes to improving the statistical literacy of data users. Competencies are defined in many different sources as the demonstrated abilities to apply knowledge, skills and attitudes for achieving results or performing a job22 [1].
UN Economic Commission for Europe (UNECE) developed a very valuable piece of work as part of its series “Making data meaningful” developed and published between 2009 and 2014 through engagement with a number of world leading experts. One of the series volumes, “Making data meaningful. Part 4. A guide to improving statistical literacy” [2], was dedicated precisely to statistical literacy and addressed the issues specific to decision-makers in one of its sections. The concept of “decision-makers” used in the UNECE guide was broader in scope than that reviewed in this article and covered both public and private sectors. The study identified the following abilities as key to decision-makers’ statistical literacy: data awareness, the ability to understand statistical concepts, the ability to analyse, interpret and evaluate statistical information, and the ability to communicate statistical information and understandings.
In this article, we focus more specifically on policy makers and the adaptation of these abilities as competencies for this group of decision-makers. Drawing on the UNECE’s landmark work, the GIST Task Team on Statistical Literacy developed and rolled out in 2018 a qualitative survey [3] with a view to understanding better the perceived and assessed needs of policy makers – primarily from national governments – to use data more effectively in support of the implementation of the SDGs. The survey comprised five sections. The first section looked at the current opportunities for strengthening statistical literacy, including questions on what kind of new data sources policy makers would like to use, related statistical literacy needs, access to relevant training resources and their statistical training as part of their previous formal education background. The second section was about data sources and awareness looking at what kind of data respondents currently use, how often, for what purposes, how they access it and what kind of data they would like to use but could not find. The third section looked at their ability to understand statistical concepts, including basic concepts as well as the meaning of official statistics covering examples of key UN Fundamental Principles of Official Statistics. The focus of the fourth section was on the ability to analyze, interpret and evaluate statistical information, including the type of data analysis the policy maker may be performing, how she/he assesses the fitness-for-purpose of the data considering data sources, sample size and how representative it is, and how she/her interprets the margin of error. The last section reviews the ability to communicate statistical information such as how often the respondent has to communicate statistical information, to whom and what challenges she/he encounters as well as good practices related to the communication of absolute versus relative measures and visualization of data using charts and tables. The last three sections included both perception-based – what does the respondent think about her/his ability – and objective assessment questions in form of a test question.
Figure 1.
Which region are you from? (% of respondents).
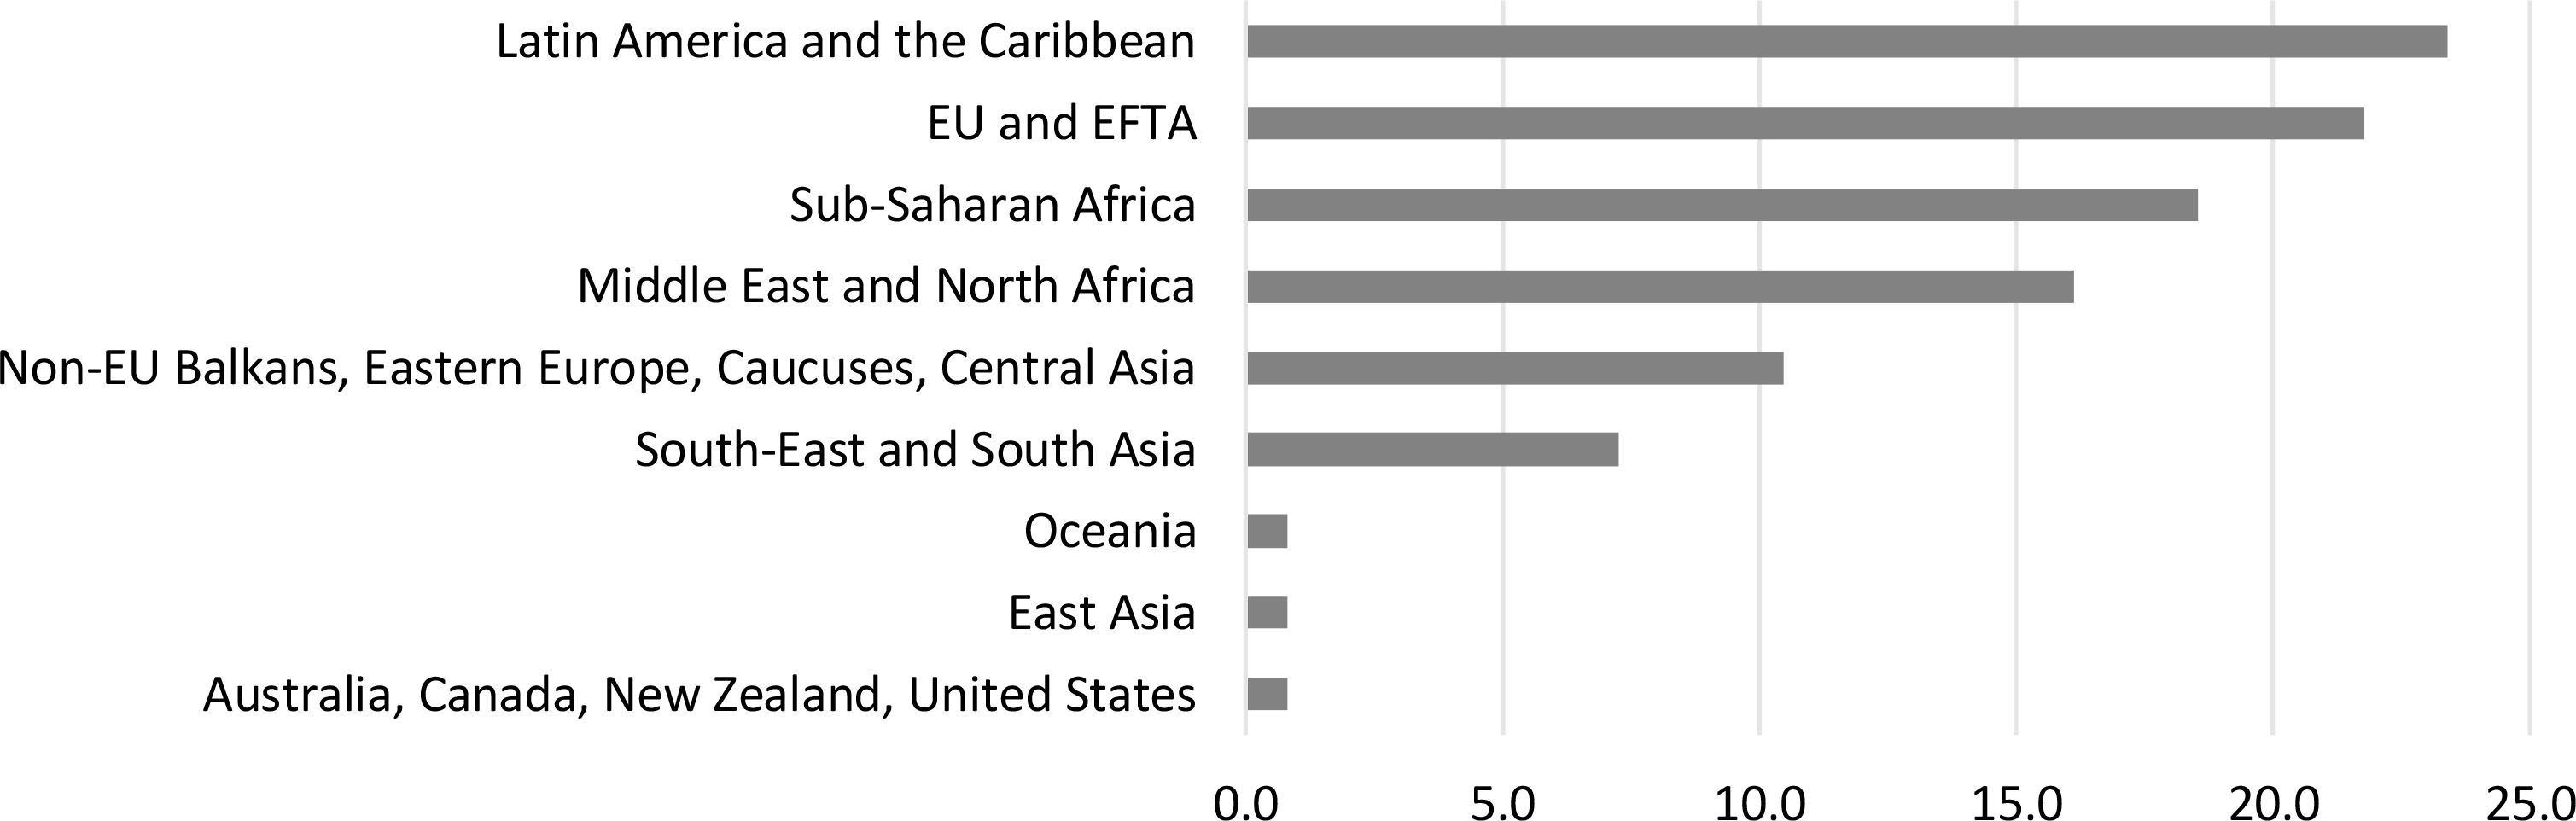
Figure 2.
You use data from… (% of respondents).
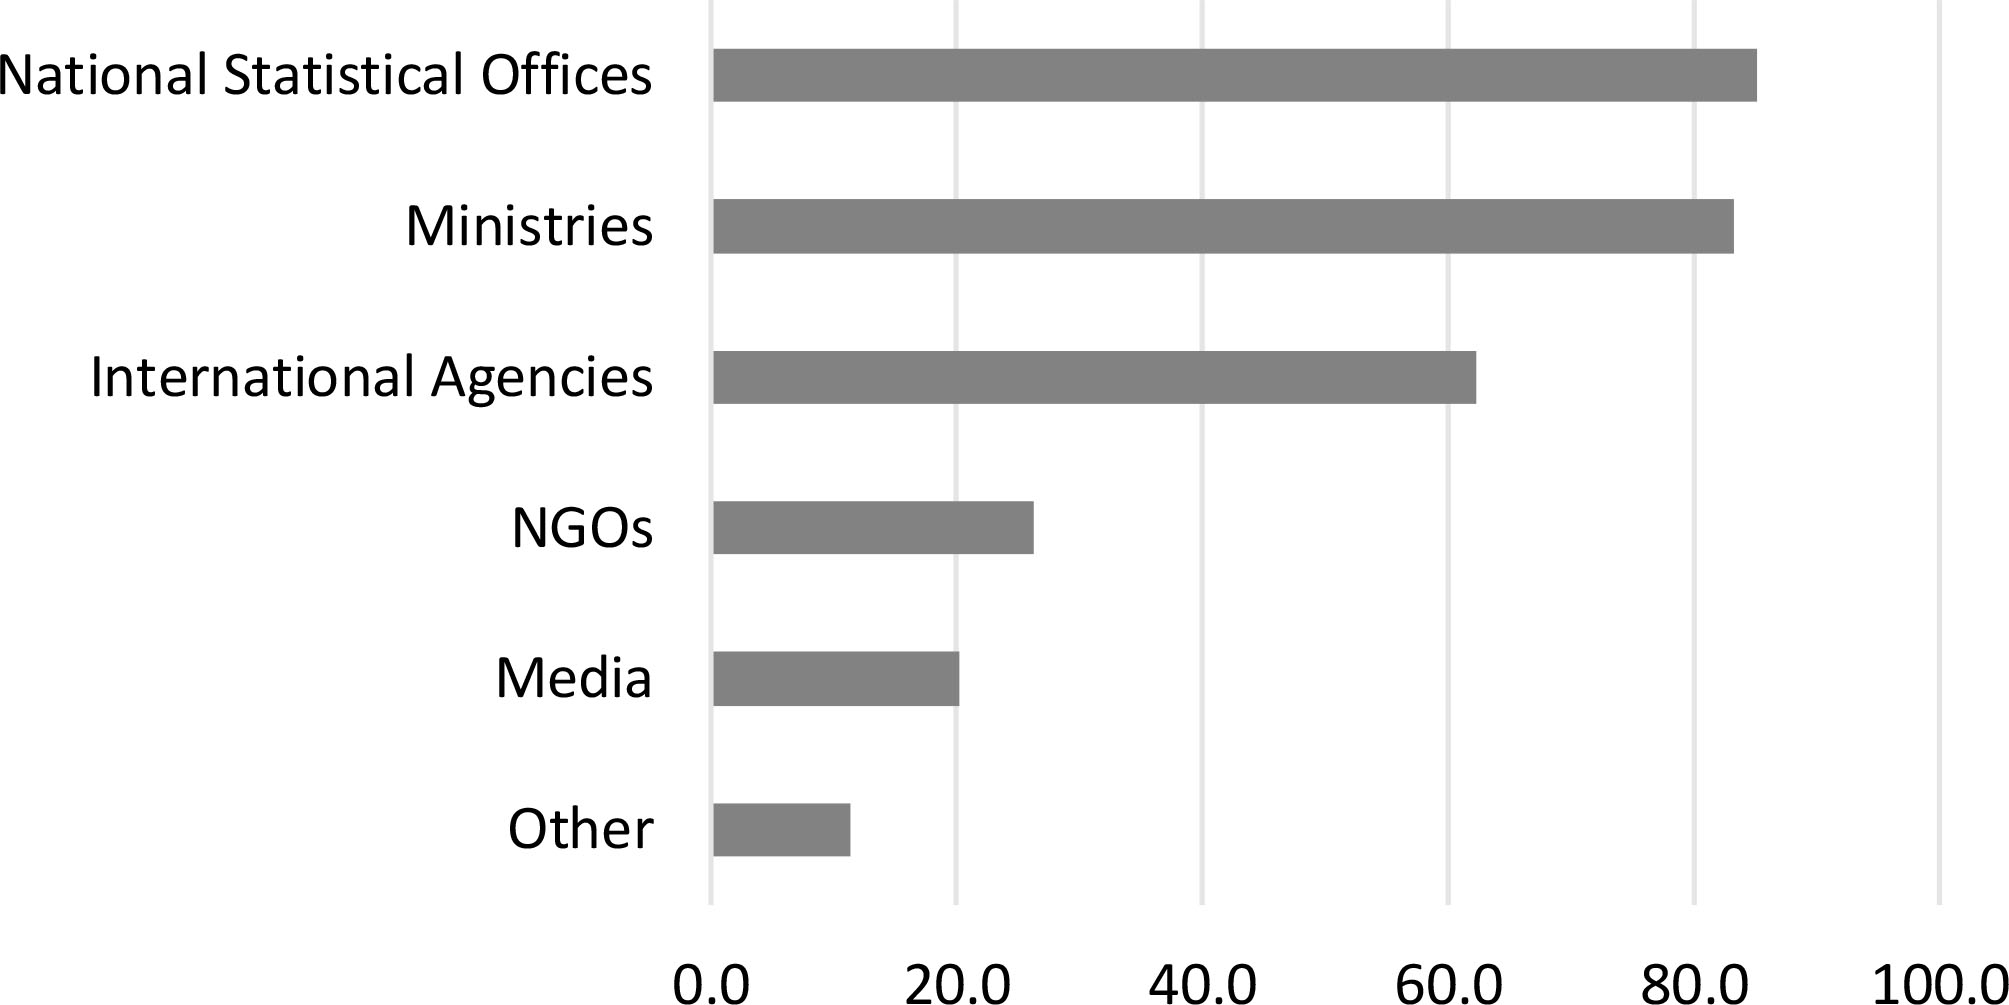
Figure 3.
You use data for… (% of respondents).
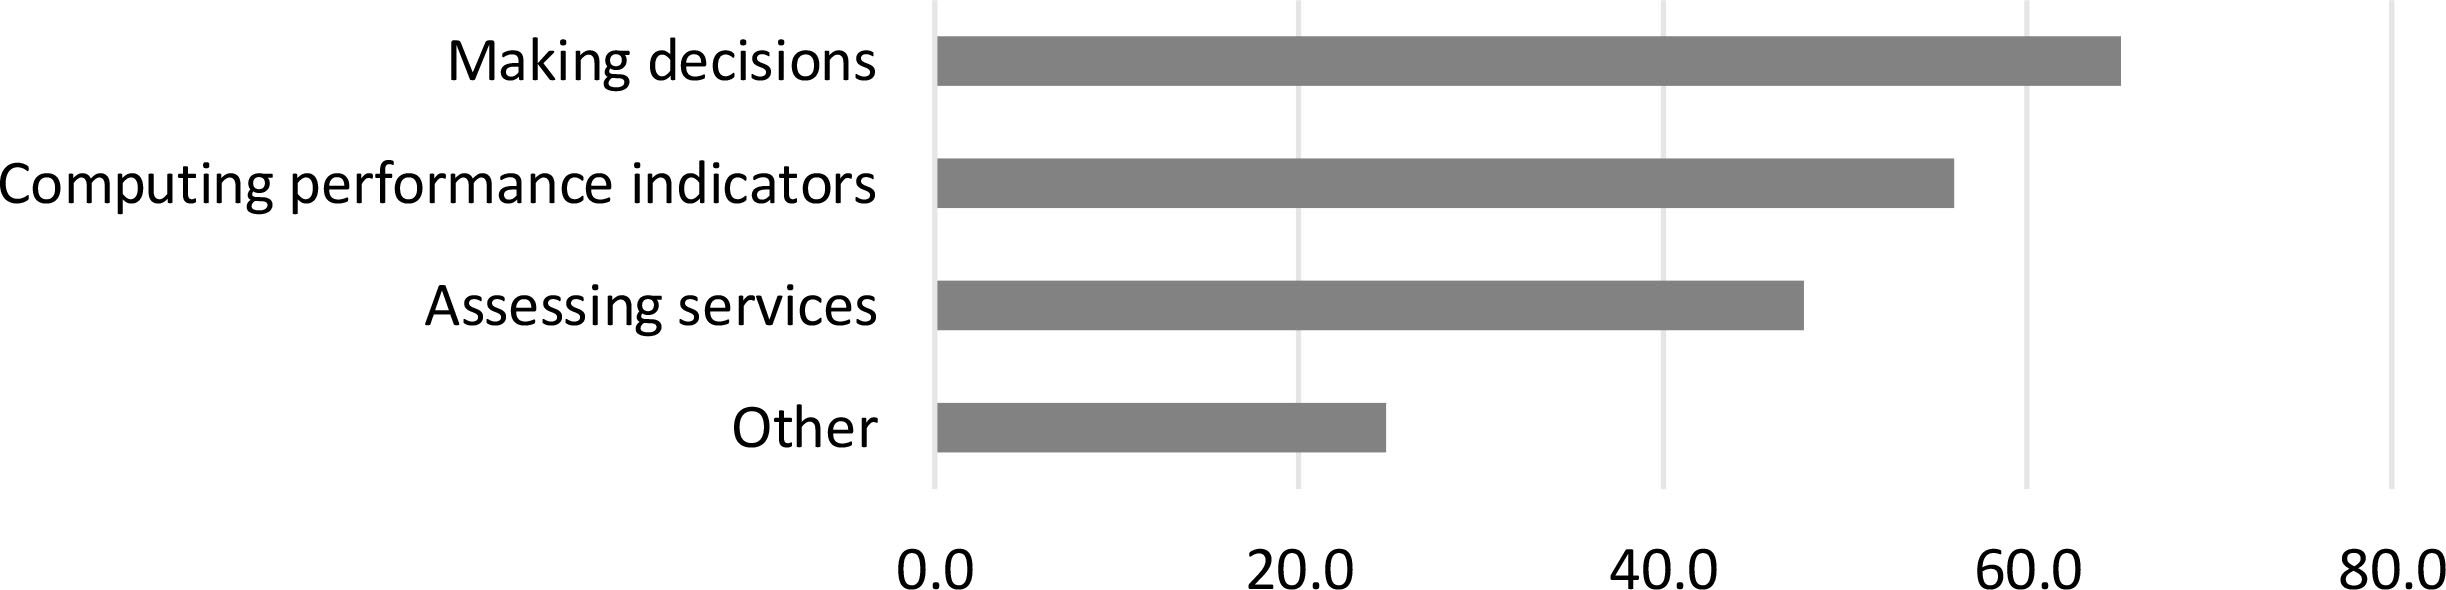
Figure 4.
What data sources do you use? (% of respondents).
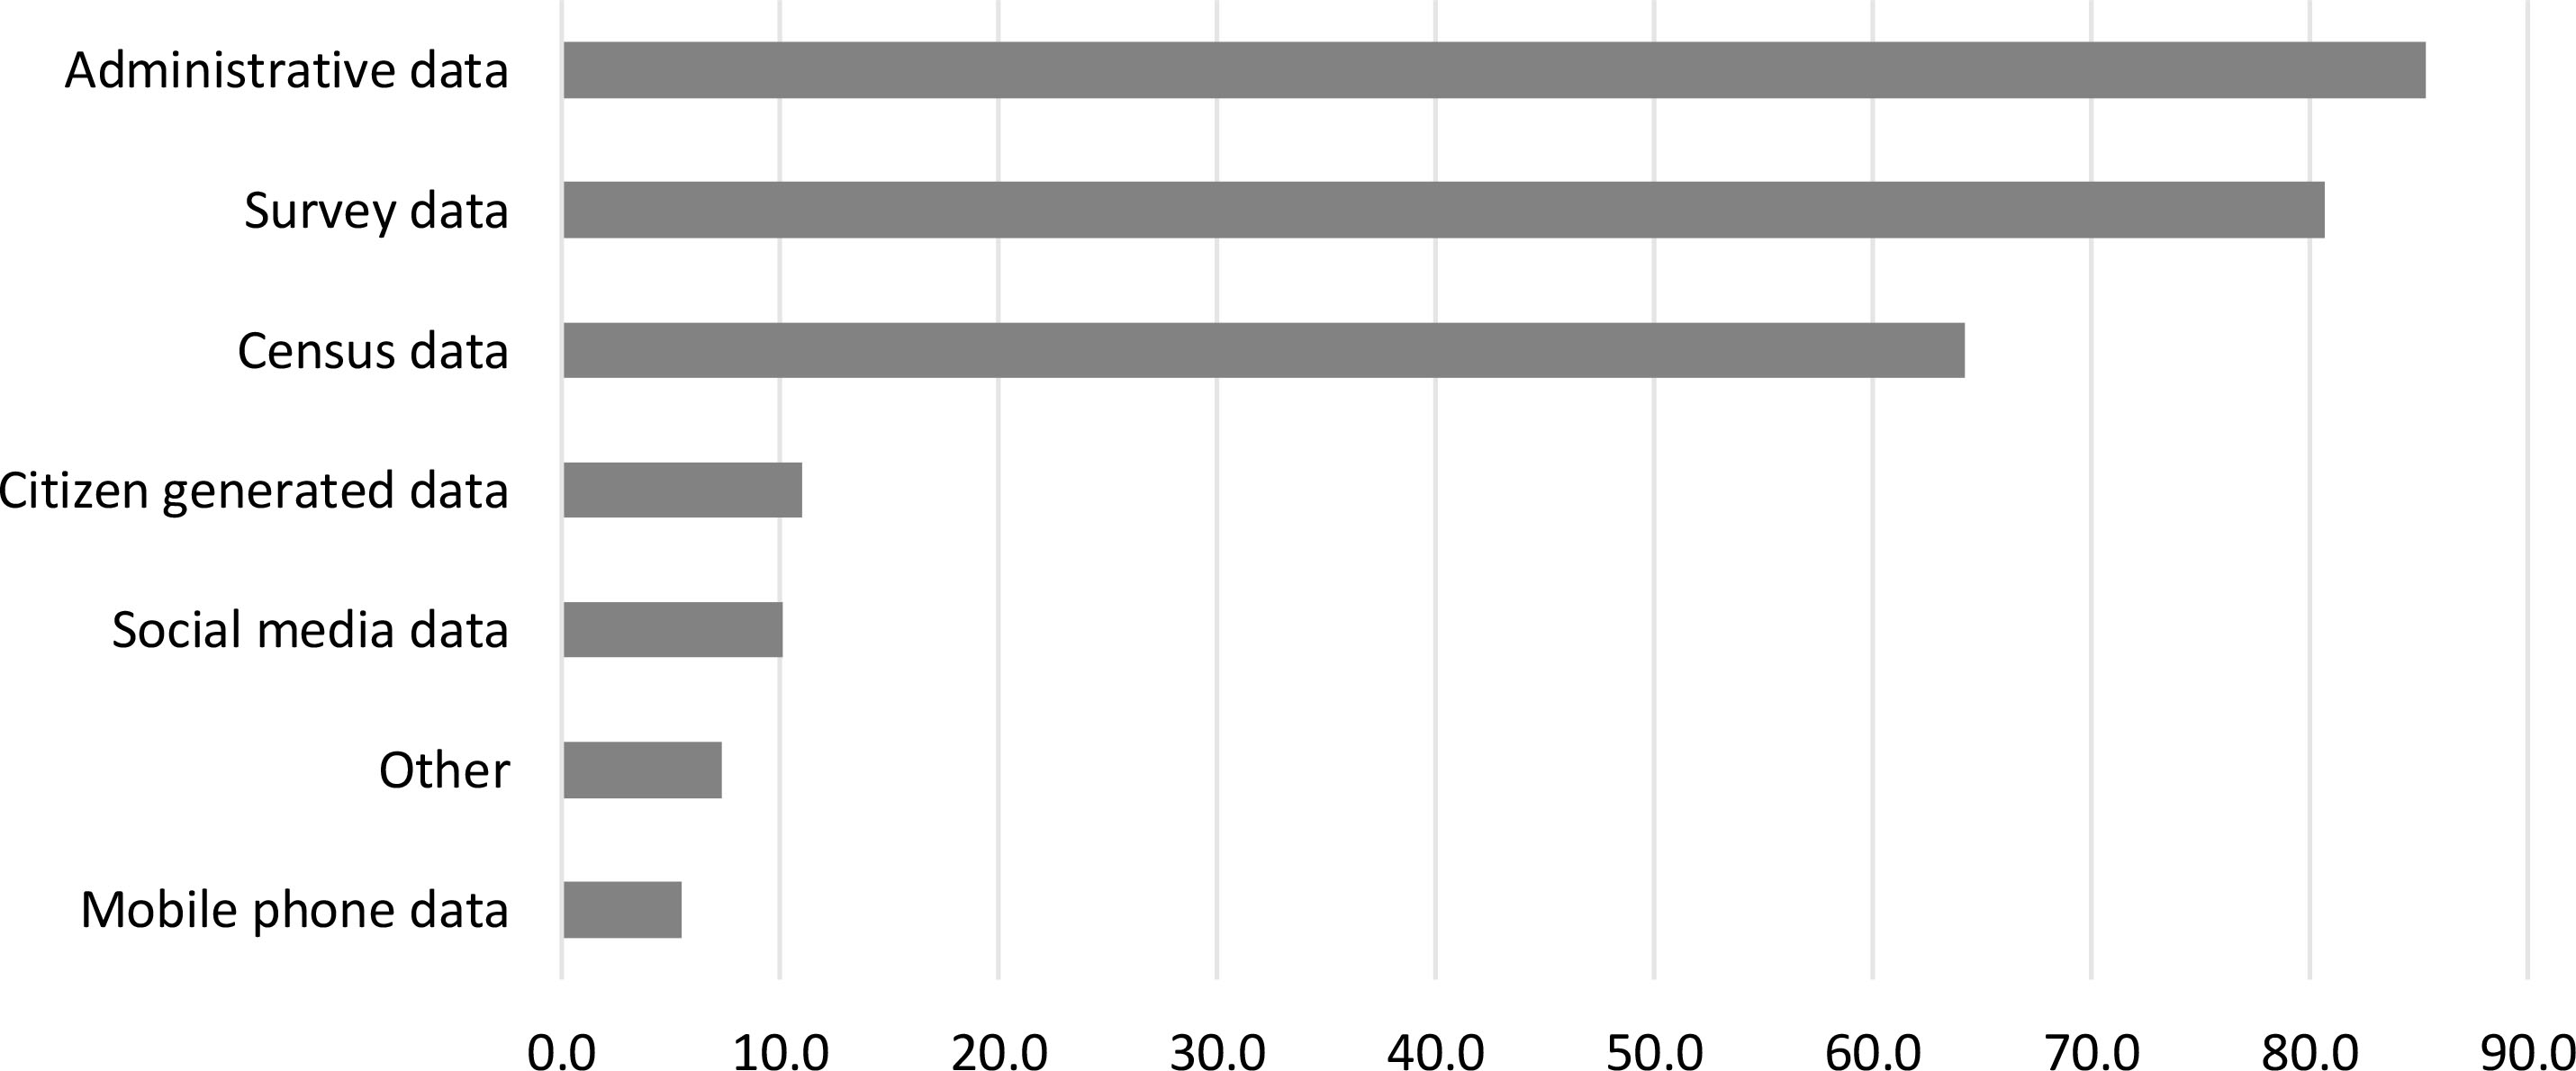
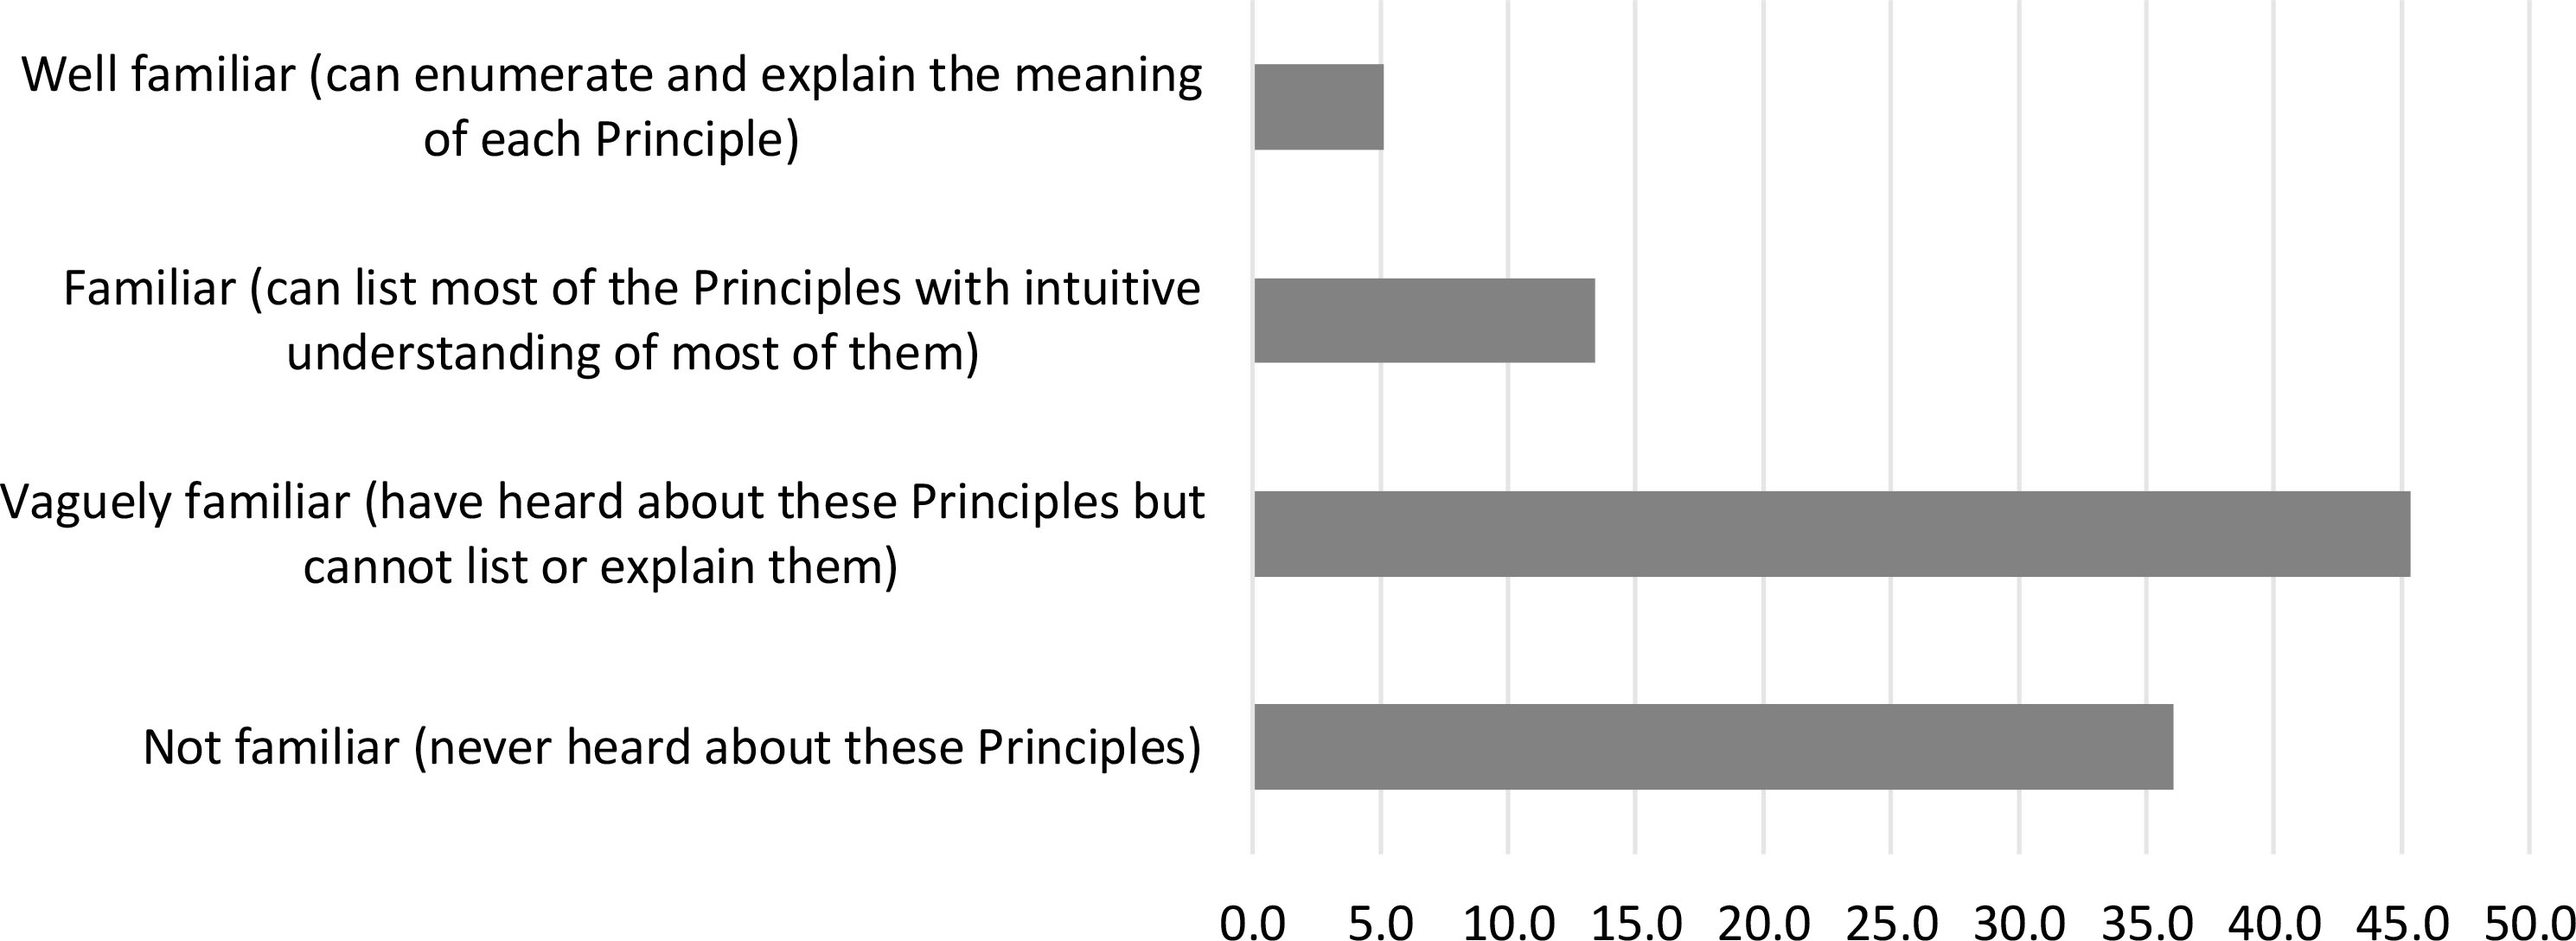
Figure 5.
Are you familiar with UN Fundamental Principles of Official Statistics? (% of respondents).
118 persons participated in the survey. This includes 83 respondents who have received the survey link via a letter from UNITAR sent to SDG Coordinating Ministries and NSOs in all UN Member States, 9 responses from the Incheon workshop, 9 from VNR workshop, 16 from one of the national workshops conducted by UNITAR for senior government officials together with the country’s national administration school in one of the African countries, and 1 from the 2018 UN World Data Forum. Most of the questions were answered by at least 80 or more respondents. More than 95 percent of respondents were from the national Government. Around 12 percent were high-raking government officials, close to 42 percent were senior government officials, 33 percent – mid-level, and only 13 percent were junior government officials. The regional breakdown looks as follows: around 23.4 percent from Latin America and the Caribbean region, 21.8 percent from the EU and EFTA region, 18.6 percent from Sub-Saharan Africa, 16.1 from the Middle East and North Africa, 10.5 per cent from non-EU Balkans, Eastern Europe, Caucuses and Central Asia, 7.3 percent from South-East and South Asia, and 0.8 percent for each of the following groups: the group comprising Australia, Canada, New Zealand and United States, the group comprising East Asian countries and the group of countries in Oceania. 59.4 per cent of respondents were male. Only 61.2 percent of respondents had taken previously a formal course in statistics.
The main data producers from whom the respondents used data were National Statistical Offices (85.1 percent), Government ministries (83.4 percent), and International Agencies (62.3 percent). 26 percent also used data from NGOs and 20 percent from media. 11.4 percent pointed to other data sources such as academia, regional organizations, and private sector.
65.1 percent of respondents used data for making decisions, 56 – for computing performance indicators, 47.7 for assessing services, and 24.8 – for other purposes such as preparing policy proposals and policy briefs, undertaking analysis and writing reports and studies, drafting national plans and strategies, writing speeches, etc.
85.3 percent of respondents used administrative data, 80.7 percent household surveys data, and 64.2 percent – census data. The use of new data sources was much lower: 11 percent for citizen generated data, 10.1 – for social media data, 5.5. – for mobile data.
Most of the respondents indicated the use of both tabular and micro-data: 86.3 and 71.6 percent respectively. The latter was used, for example, for measuring vulnerability and computing indicators for specific groups of people or areas or for a deeper analysis of correlations between outcomes and characteristics such as, for example, labor productivity and employee-based variables. It was noted by several respondents that they used tabular data because micro-data were less frequently available. Finally, in terms of the major gaps where policy makers participating in the survey could not find needed data were highlighted: disaggregated data for different population groups, incl. ethnic groups, migrants, people with disabilities; geo-referenced data from local governments such as irrigation, land property, disaster risk; damage assessment data; environmental, biodiversity, air pollution and solid waste statistics; crime rates and justice administration related data; tourism and remittances data, etc. respondents were generally interested in using more new data sources such as civil society data, data produced by private pollsters companies, social media data, geospatial data, and Big Data. Some pointed out they would like to be able to use more of administrative data.
Less than 20 percent of respondents were familiar or well familiar with UN Fundamental principles of Official Statistics (UNFPOS). 72.9 percent felt they knew whether their NSO was independent with many having indicated yes, and several respondents having provided answers that sounded ambiguous as to the understanding of the meaning of independence of official statistics. 27.1 per cent could not answer the question.
Figure 6.
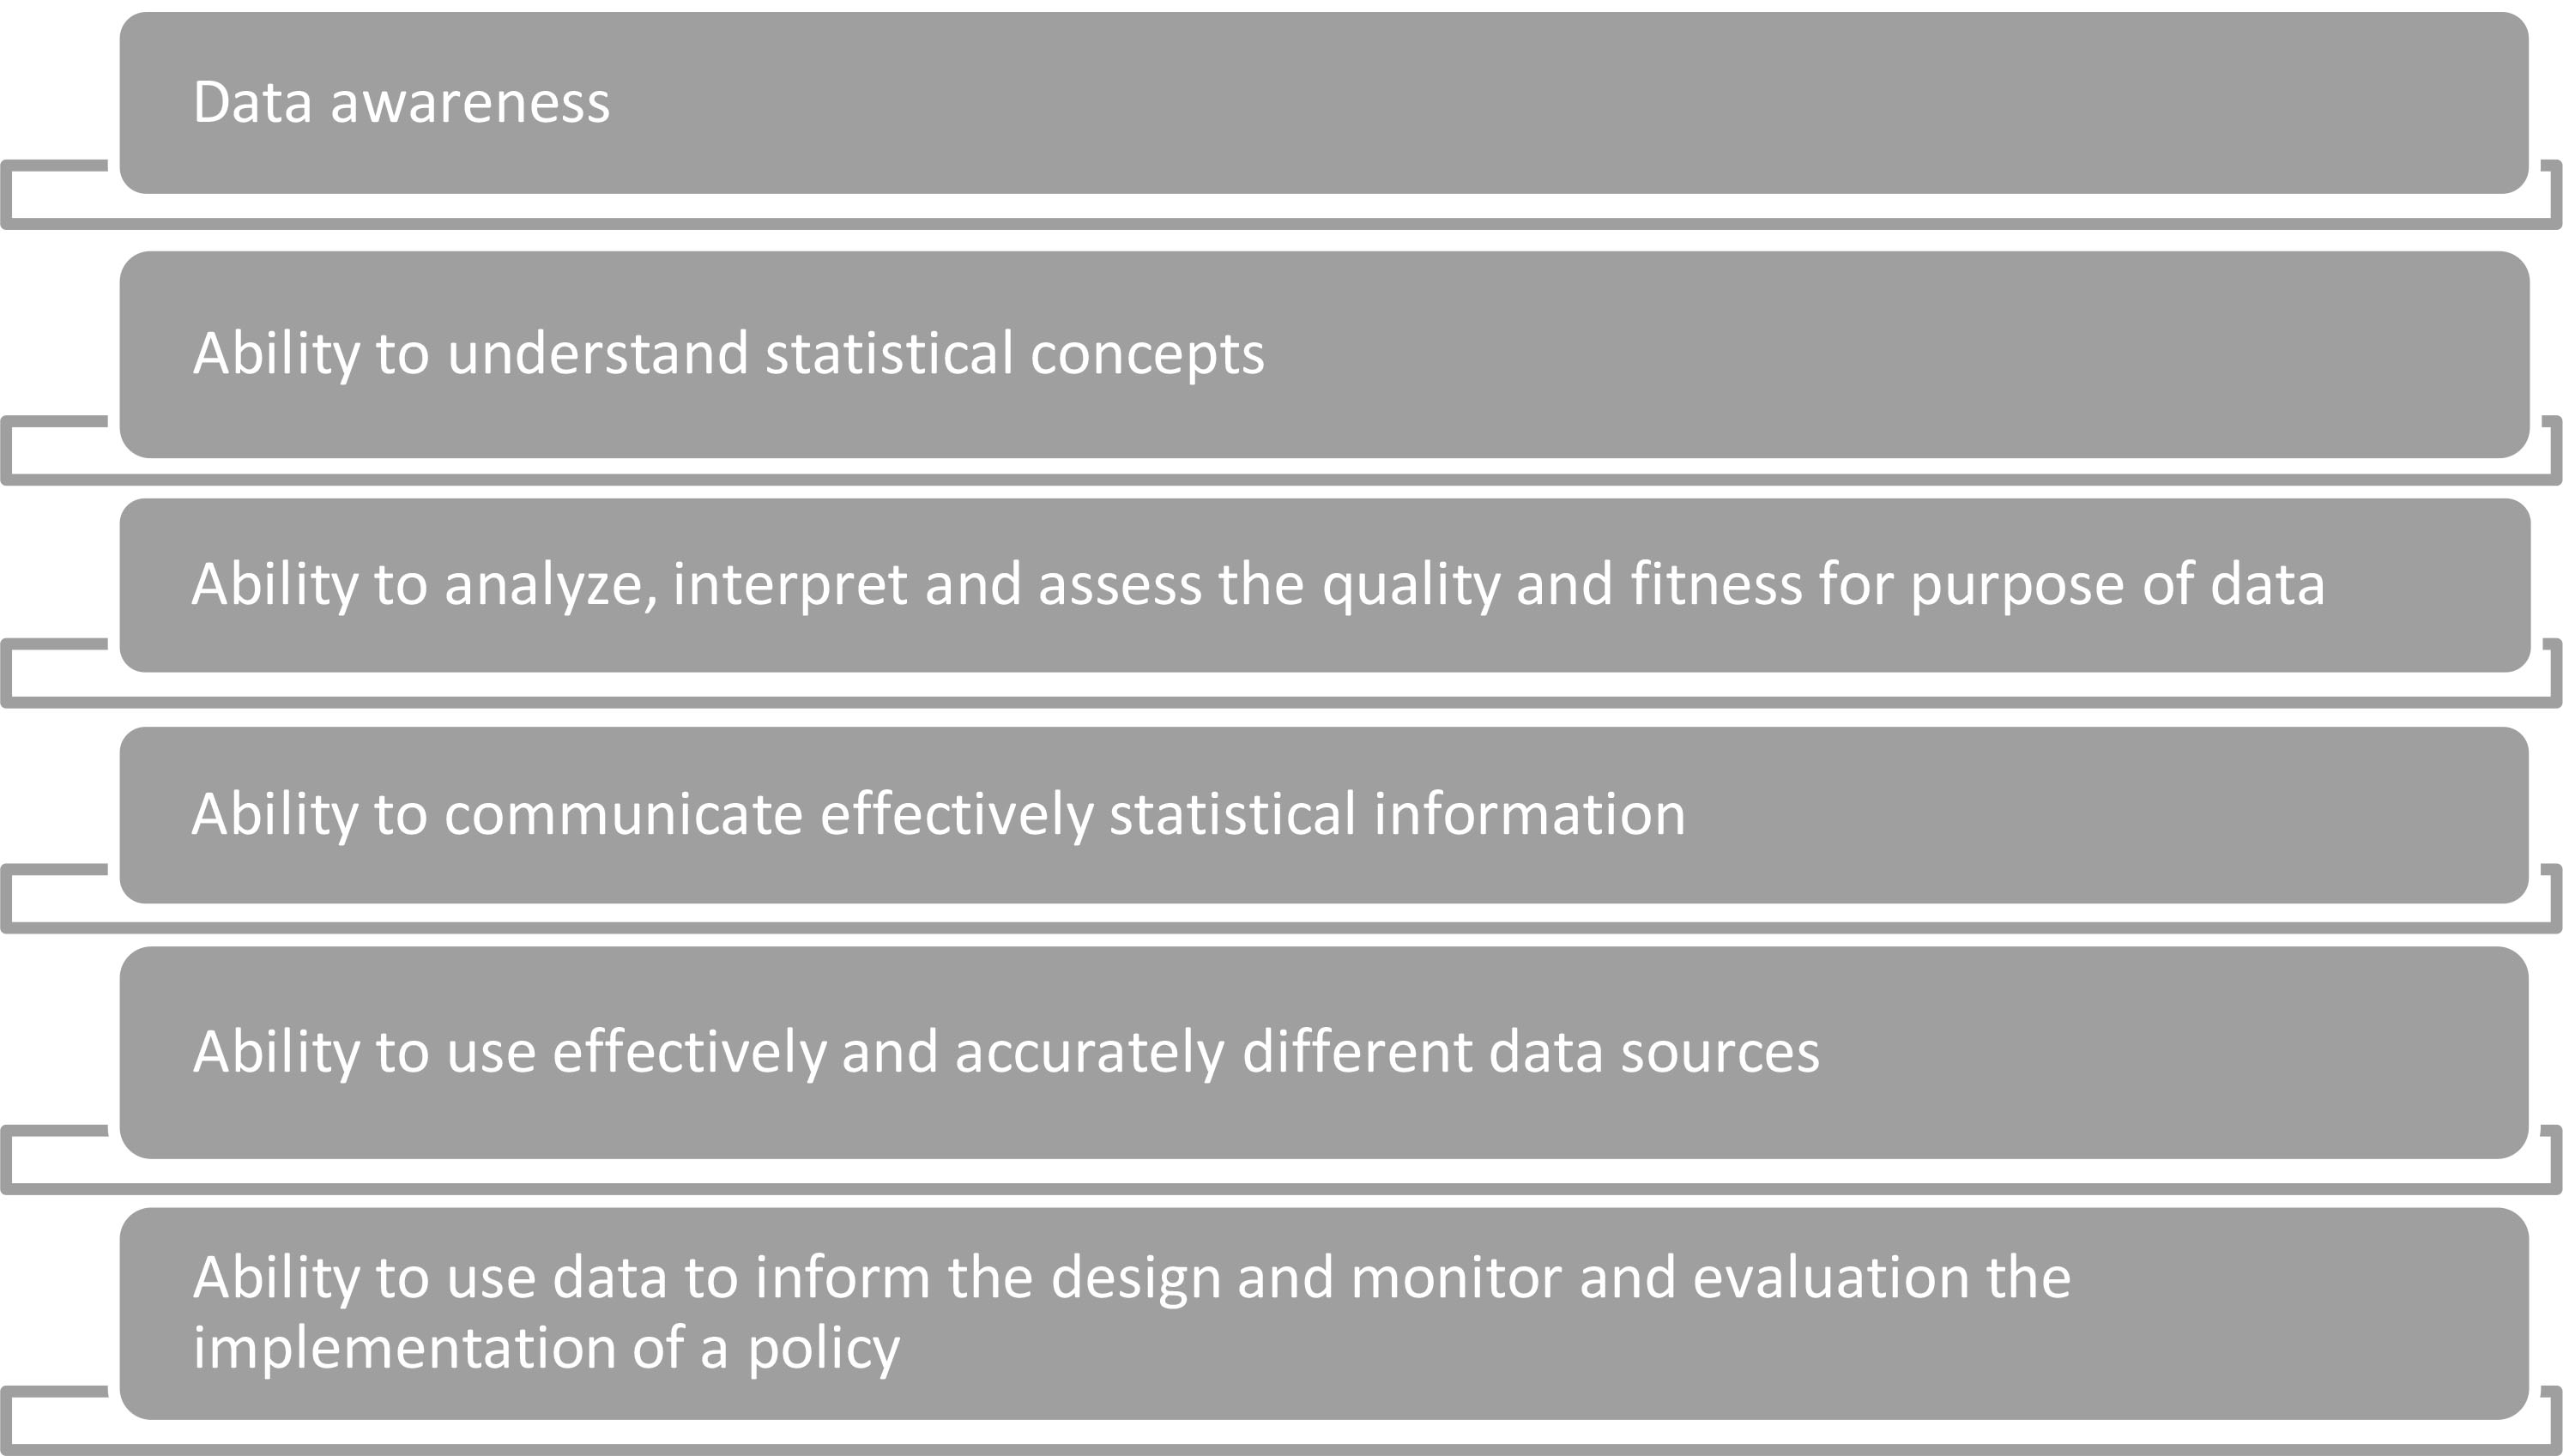
Core data competencies for policy makers.
64 percent indicated that they have systematically looked at the metadata to assess the fitness for purpose of their data while several did it from time to time. Many of the respondents could not define what the principle of confidentiality in official statistics meant, however, most had at least an approximate understanding of what a representative sample means. Around 14.9 percent believed that correlation between 2 phenomena always implied causation. 23.7 percent indicated they could provide definitions of basic statistical concepts such as distribution, trend, variability, probability, causality, inference, etc. and the same share felt they had an intuitive understanding of those. More than half of respondents had no proper understanding or had an intuitive understanding of only some of these concepts.
Around 54.4 percent indicated they were carrying out data analysis themselves, however, the understanding of what analysis means varied. More than half of respondents analyzed data to interpret a trend of one variable at a time (mean values, dispersion, change over time), interpret cross-tabulation, or the connections between two or more variables. Around 40 percent used data to interpreting the results of a regression analysis to see how changes in one variable may affect the other. Less than third were carrying out themselves statistical modeling, regression and correlation analysis or even simple frequency distribution analysis. More than 50 percent of respondents had to communicate statistical information either daily or frequently, mostly to colleagues from other Departments or Ministries or the leadership of their Organization, with only a small share of those who had to engage with media and constituencies using statistics.
3.Core data competencies for policy makers
Drawing on this earlier work by UNECE and the above survey results, the following competencies had been identified and used for guiding the design of the dedicated learning offer: data awareness, the ability to understand statistical concepts, the ability to analyse, interpret and assess the quality and fitness-for-purpose of data, the ability to communicate statistical information, the ability to use effectively and accurately different data sources, and the ability to use data to inform the design of a policy, and the monitoring and evaluation of its implementation.
In the rest of the section, we will discuss each of these competencies and how they can be strengthened. Data awareness for policy makers means essentially that there is a good understanding why using data in their work is not only beneficial but critical. Impactful stories about successful use of data to influence public policies and achieve positive change, as well as those where the failure to use data had led to problematic results are good means of raising awareness.
The competency related to the ability to understand statistical concepts implies a proper use of numbers, foundational mathematical skills, the understanding of central tendency and variability measures, and an appreciation of the concepts related to probability and causality. A proper use of numbers includes an ability to distinguish between different types of numbers among other. Proportions are very important but at times represent a challenge for those long time out of school and should be covered in foundational mathematical skills. So are absolute versus relative numbers which are an extremely important topic to help policy makers both communicate objectively and appreciate where the choice of absolute or relative number by others is a disguised way to influence the opinions and perceptions. Understanding probability and conditional probabilities is a pre-requisite for any discussions on statistical inference. The calculation of central tendency measures such as mean and median, and variability measures such as range, interquartile range, standard deviation and variance are also essential basics that any policy maker should know. Finally, policy makers should have a very clear understanding of the difference between correlation and causality to avoid hasty conclusions about whether a specific policy works or what the driver of the challenge is.
Thirdly, it is important that policy makers can apply statistical concepts to their specific problems and assess the quality of the data they plan to use on their fitness for purpose: the ability to analyse, interpret and assess the quality and fitness-for-purpose of data. First and foremost, the concept of official statistics is essential and needs to be introduced to help improve the understanding between any data and official statistics. It is extremely important that policy makers get exposure to UN Fundamental Principles of Official Statistics to understand better how their colleagues in NSOs and NSSs do their work. A number of misconceptions exist on the data user side such as for example those related to confidentiality (it is often not known that confidentiality is a fundamental principle a producer of official statistics has to respect and NSOs typically have well established procedures and techniques to anonymize data and comply with confidentiality), and learning about UNFPOS can help address them. Another important concept is that of Quality Assurance Framework that most NSOs possess and that guides the production of official statistics. Understanding the differences between various sources of data such as censuses, surveys, administrative data, geospatial imagery, social media data, Big Data, and citizen-generated data is also important. Knowing that all key information to make a judgment can be found in the metadata should enable a policy maker to assess the data he or she plans to use on its fitness given his or her objectives. Finally, an understanding of the sample surveys, confidence intervals and statistical inference methods is needed to enable him or her to interpret correctly the results of studies and regression analysis.
Fourthly, the ability to communicate effectively statistical information using a number of means is key for all those policy makers who use data in public presentations, written communications and reports. Telling a story with data is a very valuable skill to ensure one gets message across effectively and that this leads to a desired action/change. It is also important that the communication is objective and transparent and that the information is not omitted or presented in a partial way intentionally or unintentionally as a means to create a favorable opinion in support of a given policy option. Using absolute numbers is a frequent example of omitting key information – i.e., the denominator – to the rest of the picture. Beyond storytelling, visual presentation of data using tables, graphs and maps plays a very important role. Knowing how to build those so they reflect information correctly and in a user friendly manner is an important skill, which will also enable policy makers to read similar visual presentation knowingly, with a critical eye. As part of its “Making data meaningful” series, UNECE has also published a guide – in fact the first publication in the series – about telling stories with numbers [4]. The latter provides an excellent introduction into the topic with a number of “good” and “bad” examples. Another publication worth mentioning is the one developed by Statistics Norway and PARIS21 [5]. It provides a lot of helpful examples of tables, piecharts, graphs, and maps discussing and explaining in an accessible manner the “dos” and the “don’ts”.
Fifthly, policy makers should know where they can and should look for data and statistics depending on the objective they pursue: the ability to use effectively and accurately different data sources. The overall rule of thumb is to encourage the use of official statistics that can be found on the websites of NSOs or some ministries members of National Statistical Systems if the objective is to track national progress on a given indicator or a set of indicators. Here typically more disaggregated information can also be found for different regions and provinces of the country. The traditional sources of data for official statistics are censuses and surveys, but administrative data and other alternative data sources are or can be used to produce official statistics with a related quality check or can be used for monitoring in the absence of official statistics but the quality question then needs to be addressed. NSOs host national SDG reporting platforms, some produce SDG progress reports or statistical annexes for Voluntary National Reviews, as well as reports and databases related to the household surveys and censuses that may help answer specific data questions. The websites of international organizations become handy when one wishes to compare his country’s progress to another country or searches for data not available on NSO/NSSs websites. Knowing what survey/dataset to look at be at the NSO or International Organization website is also important depending on your area of interest be it poverty, trade, finance, health or environment. Finally, understanding the difference between panel data, cross sectional data, time series and micro-data is essential when the policy maker tries to find a data source to answer a specific question: studying progress overtime, between comparing progress administrative units at a given point or over time, or undertaking a more detailed analysis by looking at correlations is important. Understanding how scientific studies are designed and to what extent they go deep enough in the analysis can be of help in selecting a given policy option.
Lastly, the most advanced ability for a policy maker would be the ability to use data to actually inform the design of a policy, and ensure the monitoring and evaluation of its implementation. At this competency level, policy maker should be able to evaluate what kind of data he or she needs to answer his/her policy question. Some of the key statistics may be considered such as demographic composition and trends, GDP growth and composition, savings and investment, balance, debt, exchange rate, interest rate, Consumer Price Index (CPI) and unemployment rate. One of the key tasks is the design of a policy accounting for the national context and selecting appropriate options often by studying the experiences of other countries. To accomplish the latter, a policy maker would use data by looking across different variable and disaggregation dimensions to identify patterns and see correlations. At a more advanced level, he or she should be able to identify relevant studies and evaluations establishing causal links between policies and change and examine the extent to which their conclusions are robust and they can provide a basis for him or her to draw conclusions. Another task may be related to the identification of performance indicators. The effectiveness of the monitoring of a policy will depend on the choice of the appropriate indicators. The third task may be related to costing and budgeting a policy. Finally, a proper evaluation of a policy will not only look at whether we are meeting the targets but also at whether the policy works or not or what work and what does not work so well and why. For large public programmes or interventions, an impact assessment may be considered/commissioned by policy makers to do – if conditions allow – a proper causality analysis and draw conclusions. Randomized Control Trials popularized with the 2019 Nobel Prize winners are one way of ensuring the study can attempt answer those questions, but these designed experiments are not always possible except if your programme was deliberately or accidentally designed in a such a way from the outset and a policy maker has two comparable groups: one treatment and one control. Econometricians have however come up with a number of other methods that can be used post-factum to evaluate policy impacts provided certain conditions are met such as difference-in-difference, propensity score matching, to name just a few. When a policy maker commissions an independent evaluation or impact assessment, he or she should be aware or the requirements and limitations of the proposed methodologies.
4.Design of learning
The e-learning course developed by UNITAR, UNSD and UNECA entitled “Understanding data and statistics better – for more effective SDG decision making” aims to help build those competencies among policy makers. It is delivered for free in a self-paced format to all those interested in taking the course and comprises 5 modules that gradually lead learners to build up those competencies. Certification is provided to those learners who have met the specific requirements on objective assessments offered at the end of each module. The course includes examples from different regions of the world and in different SDG areas. It was developed with contributions and inputs of several experts: Aniket Bhushan, Sharleen Forbes, John Harraway, Helen MacGillivray, Leandre Ngogang Wandji, Vibeke Nielsen, and Elena Proden (myself).
The work on this course has demonstrated how important it is to ensure a thorough instructional design approach from the outset. UNITAR’s quality assurance framework (QAF) has been applied and helped guide the development of the course.
The key components of UNITAR’s QAF [6] include a. Learning needs, b. Target audience, 3. Nomenclature and title, 4. Learning objectives, 5. Content and structure, 6. Methodology, 7. Learning/instructional material, 8. Training expertise/qualifications, 9. Event announcement information, 10. Evaluation.
Some of them while critical to the quality of the course are often overlooked or under-estimated. Understanding the gap and related learning need is a must for an effective learning product or service. Yet, many courses have been designed in the past guided by the supply side – a specific topic or based on a publication produced as a result of the research – without deeper analysis what learning needs exactly they address and missing out on a learner-centered perspective. Similarly, learning objectives should guide the development of the structure of the course and the choice of methodologies. Bloom’s taxonomy has been a valuable framework used by the learning industry to identify relevant learning objectives and formulate them correctly depending on the level of knowledge the course designer tries to work with. The choice of methodologies should be guided by the type of knowledge to be strengthened: cognitive that includes declarative and procedural components, socio-emotional or behavioural. The actual instructional material for e-learning may be very diverse but many include the use of authoring tools such as Articulate Storyline application. Finally, course evaluation is very important. Here, the Kirkpatrick’s 4-level model is used by many institutions distinguishing between reaction-based evaluation (Level 1), objective assessment or self-assessment using ex-ante and ex-post tests to measure increase in knowledge/skills (Level 2), the evaluation of the application of knowledge and skills in the professional context (Level 3), and – rarely measured due to a limited size of training projects – impact evaluation (Level 4). UNITAR uses this four-level approach as reflected in its Monitoring and Evaluation Policy Framework. Levels 1 (perception-based feedback) and 2 (intermediate outcomes) are used for all learning events that last for 2 days or more, Level 3 (institutional outcomes) evaluations are conducted for all projects budgeted 300’000 USD or more. Moreover, additional Level 3 measurements are undertaken annually by the Institute’s Planning, Performance Monitoring and Evaluation Unit using samples of participants. Independent evaluation is mandatory for all projects budgeted 1.5 million USD and above and often aims at measuring Level 4 – impact level [7].
All these components had been taken into consideration while developing the course on the more effective use of data for decision-makers. The 2018 data literacy needs assessment has provided valuable information for defining the learning needs reflecting the gap between the core abilities described in the previous section and the state of knowledge/skills. This has informed in turn the design of the overall learning objectives for the course as well as specific learning objectives for five modules. The overall learning objectives included are described below.
It is expected that, by the end of the course, participants will be better positioned to:
• Explain the importance of timely, quality and disaggregated data for informing policies and decisions in support of the SDGs;
• Interpret and assess the fitness-for-purpose of different sources of data depending on the objective and task at hand;
• Effectively and correctly communicate data to tell a story using tables, graphs and maps;
• Identify potential data sources from among official, scientific and new types of data for monitoring SDG indicators using a set of criteria;
• Discuss how data should be used to formulate evidence-based policies or conduct M&E activities.
The learning objectives follow the core data-related ability for policy makers. They shaped up the structure of the course organized in 5 modules to be followed in a proposed sequence. The first two modules address the first two abilities while gradually helping the course participants to review some key concepts in mathematics, statistics and probability theory. The subsequent modules build on this foundational knowledge created in the first 2 modules to gradually build the capacities to also communicate, search and effectively and accurately use data to inform their policy work and make choices grounded in data and evidence.
The choice of methodology for the modules reflected the level of learning objectives. For example, data awareness can be effectively addressed through story-telling, while practicing some procedural knowledge – computations – requires exercise. The exercises had been adjusted to work in an automated-response context. Or else, using effectively data to address a policy question requires, among other, being able to navigate platforms, find relevant data and evaluate it on how well it responds to your need and whether its quality is sufficient.
Finally, the course includes an ex-ante and an ex-post test to measure the increase in knowledge by the end of the course in addition to the summative assessments included for each module as a basis for certification. A feedback questionnaire is provided for learners to complete online to share their perceptions of how relevant learning objectives are and how effective the course was in helping them achieve these learning objectives. Finally, the application of knowledge and skills will be evaluated towards the end of 2021 through an online survey.
The course is currently hosted on the Learning Management System of UNITAR [8] but is also featured and promoted through the UNSDG: Learn gateway. The advantage of this approach is by reaching the NSOs through the statistics community page so they can share the course link with the data users – their counterparts in the Government and outside – and by reaching policy makers directly through the generic entry on the gateway that hosts all courses, including many on policies more generally. It is expected that the course will be periodically reviewed and enriched with more up-to-date examples from different world regions.
Further, it is worth noting that the non-facilitated, self-paced format was chosen for this course for two reasons: to allow as many participants as possible to take it and to enable those who may be busy with other tasks to follow it at their own pace when they can find time. Both were essential in increasing the outreach to as many as possible policy makers across the globe. Other services may be considered by NSOs and other stakeholders such as workshops, events and the use of online microlearning tools – to complement this offering and provide services more tailored to the needs of their country’s policy makers and other data users. A series of micro-learning videos is also being developed by UN Statistics Division and UNITAR and will provide additional useful resources as part of statistical literacy campaigns raising awareness around the value of official statistics and other aspects.
5.Statistical literacy for other stakeholders
Beyond policy makers, strengthening the statistical literacy of societies in general is important. As citizens, we play a lot of important roles – voting, making lifestyle choices, contributing to the economy, using essential services and infrastructure, participating in community activities – and can influence the future directions of our countries. It is important therefore that the whole of society should be able to benefit from statistical literacy initiatives. While some of the stakeholders such as media representatives may find the course for policy makers well adapted in content, examples and methodologies to their needs, this may not be the case for others. Kids and teenagers may need, for example, the adaptation of language and examples and can benefit from gaming to keep attention and strengthen engagement. Business community would need a different set of examples and learning content on the application of skills to make it more pertinent to these learners influencing the future of our societies through different channels.
To address this need, GIST Statistical Literacy Task Team has started an online inventory of statistical literacy initiatives. The proto-type version features examples from members of the Task Team such as, for example, the IBGEeduca platform of the Brazilian Institute of Geography and Statistics aimed at children, teenagers and teachers, Census Academy and Statistics in Schools initiatives of the United States Census Bureau – the new data education and training hub for adult learners and materials for school students using real-world Census Bureau statistics at all grade levels, or yet the e-learning course discussed in this article [9, 10, 11]. However, the objective is to reach out to the broader GIST membership, NSOs, statistical training institutes and other stakeholders with interesting examples. It is hoped that this sharing of practices can boost statistical literacy activities in many countries either through direct replication of applicable experience or by inspiring similar approaches. A dedicated session is planned during the upcoming UN World Data Forum in Bern, Switzerland, in October 2021.
6.Conclusion
E-learning represents a significant opportunity for strengthening the statistical literacy and better use of data in the design and implementation of policies. A self-paced course with examples from different world regions and different types of National Statistical Systems enables an almost unlimited outreach for policy makers from different countries to register and take – for free – the different modules when they have time. For the e-learning to be an effective means it is important, however, that the course design ensures that lessons – theory and explanations, activities and assessments – help build well formulated competencies which are in turn linked to job tasks or results that policy makers may be expected to achieve. The competencies discussed in this article build on an earlier work undertaken by the UN Economic Commission for Europe and further refined and validated through a survey of policy makers conducted with the participation of government officials from UN Member States from different world regions. These competencies build on each other ranging from simpler data awareness to the more advanced competence of using data accurately and effectively to inform policy design, monitoring and evaluation and support the implementation of the SDGs at the national level, and have served as the structuring principle and design framework for the e-learning course developed by UNITAR, UNSD and UNECA.
Notes
2 This or similar definition can be found in the EU e-competence framework, Australian Higher Education, etc. See a more detailed discussion of the competencies approach in comparison to the capabilities approach in (1). It refers among other to the definition provided by the OECD-led DeSeCo project: a competence is defined as the ability to successfully meet complex demands in a particular context through the mobilization of psychosocial prerequisites (including both cognitive and non-cognitive processes).
References
[1] | Lozano JF, Boni A, Peris J, Hueso A. Competencies in higher education: A critical analysis from the capabilities approach. Journal of Philosophy of Education. (2012) ; 46: (1): 132-147. |
[2] | United Nations Economic Commission for Europe. Making data meaningful. Part 4. A guide to improving statistical literacy. New York and Geneva: United Nations; (2014) [cited 2021 Jul 9]. 65 p. Report No.: ECE/CES/33. Available from: https://unece.org/DAM/stats/publications/2013/Making_Data_Meaningful_4.pdf. |
[3] | Global Network of Institutions for Statistical Training. Preliminary findings from surveys conducted by task team on statistical literacy. New York: UNSD; (2018) [cited 2021 Jul 9]. 4 p. Available from: https://unstats.un.org/gist/resources/Task-Teams/2018/. |
[4] | United Nations Economic Commission for Europe. Making data meaningful. Part 1. A Guide to writing stories about numbers. New and Geneva: United Nations; (2009) [cited 2021 Jul 9]. 21 p. Report No. : ECE/CES/STAT/NONE/2009/4. Available from: https://unece.org/DAM/stats/documents/writing/MDM_Part1_English.pdf. |
[5] | PARIS21, Statistics Norway. User-friendly presentation of statistics: Guide to creating a dissemination strategy and dissemination guidelines for developing and transition countries. Paris and Oslo : PARIS 21 and Statistics Norway; (2009) [cited 2021 Jul 9]. 70 p. Available from: https://www.ssb.no/en/oms-sb/samarbeid/internasjonalt-utviklingssamarbeid/_attachment/117795?_ts=13f15ca60c0. |
[6] | United Nations Institute for Training and Research. AC/UNITAR/2017.11. Quality Assurance Framework, Revision. (2017) [cited 2021 Jul 9]. Available from: https://unitarnetunitar.org. |
[7] | United Nations Institute for Training and Research. AC/UNITAR/2017.08. Revised Monitoring and Evaluation Policy Framework. (2017) . [cited 2021 Jul 9]. Available from: https://unitarnetunitar.org. |
[8] | United Nations Institute for Training and Research, United Nations Statistics Division, United Nations Economic Commission for Africa. E-course on understanding data and statistics better – for more effective SDG decision making [Internet]. Available at: https://www.unsdglearn.org/courses/understanding-data-and-statistics-better-for-more-effective-sdg-decision-making/. |
[9] | Instituto Brasileiro de Geografia e Estatstica. IBGEeduca [Internet]. Rio de Janeiro: Instituto Brasileiro de Geografia e Estatstica; (2021) [cited 2021 Jul 9]. Available from: https://educa.ibge.gov.br/. |
[10] | U.S. Census Bureau. Census Academy [Internet]. Washington: U.S. Census Bureau; (2021) [cited 2021 Jul 9]. Available from: https://www.census.gov/data/academy.html. |
[11] | U.S. Census Bureau. Statistics in Schools. [Internet]. Washington: U.S. Census Bureau; (2021) [cited 2021 Jul 9]. Available from: https://www.census.gov/programs-surveys/sis.html. |

