
Data science training for official statistics: A new scientific paradigm of information and knowledge development in national statistical systems
Abstract
The ability to incorporate new and Big Data sources and to benefit from emerging technologies such as Web Technologies, Remote Data Collection methods, User Experience Platforms, and Trusted Smart Statistics will become increasingly important in producing and disseminating official statistics. The skills and competencies required to automate, analyse, and optimize such complex systems are often not part of the traditional skill set of most National Statistical Offices. The adoption of these technologies requires new knowledge, methodologies and the upgrading of the quality assurance framework, technology, security, privacy, and legal matters. However, there are methodological challenges and discussions among scholars about the diverse methodical confinement and the wide array of skills and competencies considered relevant for those working with big data at NSOs. This paper develops a Data Science Model for Official Statistics (DSMOS), graphically summarizing the role of data science in statistical business processes. The model combines data science, existing scientific paradigms, and trusted smart statistics, and develops around a restricted number of constructs. We considered a combination of statistical engineering, data engineering, data analysis, software engineering and soft skills such as statistical thinking, statistical literacy and specific knowledge of official statistics and dissemination of official statistics products as key requirements of data science in official statistics. We then analyse and discuss the educational requirements of the proposed model, clarifying their contribution, interactions, and current and future importance in official statistics. The DSMOS was validated through a quantitative method, using a survey addressed to experts working at the European statistical systems. The empirical results show that the core competencies considered relevant for the DSMOS include acquisition and processing capabilities related to Statistics, high-frequency data, spatial data, Big Data, and microdata/nano-data, in addition to problem-solving skills, Spatio-temporal modelling, machine learning, programming with R and SAS software, Data visualisation using novel technologies, Data and statistical literacy, Ethics in Official Statistics, New data methodologies, New data quality tools, standards and frameworks for official statistics. Some disadvantages and vulnerabilities are also addressed in the paper.
1.Introduction
The use of novel statistical techniques (e.g., machine learning, artificial intelligence, natural language processing [1] and approaches to get additional insight and understanding in every field of human activity from analysing traditional and new sources of (Big) data (e.g., administrative databases, data collected from digital activity – web activity, social networks, online payments, transportation systems – mobile phone usage, remote sensing networks, satellite imagery, Internet of Things (machine-generated data)) and to build tools to inform decision-making has become a crucial challenge (and opportunity) for national statistical offices (NSOs).
A profound disruptive digital transformation in society and economy is taking place worldwide, with governments, private enterprises, and the public demanding quicker access to real-time quality data for better decision-making and social good, an output that often goes well beyond traditional statistical production capabilities. The life cycle of traditional statistical information is becoming increasingly shorter. The longer an end-user must wait for statistical information, the less valuable it becomes for decision-making.
In an increasingly complex and global environment of growing demands for trusted information, fast-developing and accessible technologies, and increasing competition between companies and economies, collecting, analyzing, and disseminating more frequent and timely data with a reduced burden on respondents challenges NSOs to embrace data science technologies and methodologies.
Among the many challenges faced by NSOs, the use of new sources of granular data in a cost-saving manner implies taking advantage of the potential of mobile technologies machine learning, augmented intelligence and fast-growing (including cloud) computing capabilities. These new approaches are not expected to replace traditional methodologies at NSOs. Contrariwise, they have the potential to become an important complement to official statistics in meeting their objectives of providing timely, and accurate evidence for public and private decision-making.
Some authors argue that automatic data processing and smart technologies are the future of official statistics and that traditional data sources, namely administrative data (secondary sources) and survey data (primary sources) represent a valuable but small portion of the global data stock (see, e.g., [2]). New data sources and data science techniques have the potential to empower national statistical systems. The use of new data and methods may ultimately allow official statistics to disregard data aggregation processes and to directly use the new sources of granular data to reveal hidden information. It is costly for the NSOs to gather high-quality granular data matching all end-user requirements through traditional methodologies (e.g., surveys), ignoring the benefits of new data science approaches, which are potentially able to reduce the costs of collecting, processing, analysing and disclosing data without compromising the highest standards and quality of statistical information [3, 4, 5, 6, 7].
To meet the expectations of society, statistical offices will need to change and continue to adapt, developing more efficient ways of working. They will be called to identify and assess new data sources, to set up new partnerships and collaboration agreements with multiple stakeholders. They will need to build appropriate information and communications technology infrastructure for data storage (offsite and onsite) and analytics, including processing power, integrating files from numerous sources different formats, arriving potentially at different times with a different degree of reliability. They will be asked to revisit old and new legal and ethical dilemmas on data access and sharing (privacy and data protection), particularly outside government data.
Creating, upskilling, developing and retaining the set of skills knowledge and talent required to extract all the potential from using Big Data acquisition, processing, analysis and visualization in the statistical production process are critical challenges NSOs will have to quickly address. This will have to be done both at the organizational level, identifying strengths and weaknesses, setting goals, establishing a roadmap and a strategic plan for training programmes, and at the individual level, identifying gaps in core and soft skills and competencies, updating personal development plans.
Against this background, this paper proposes a primary research model to study the impact of data science in producing official statistics and trusted smart statistics to satisfy the needs of end-users. The model combines data science, existing scientific paradigms, and trusted smart statistics, and develops around six main constructs: (i) new requirements assessment, (ii) methodological improvements, (iii) statistical engineering, (iv) software development, (v) official statistics product deployment and (vi) dissemination strategies. We considered a combination of statistical engineering, data engineering, data analysis, software engineering and soft skills such as statistical thinking, statistical literacy and specific knowledge of official statistics and dissemination of official statistics products as the requirements of data science in official statistics.
In the empirical part of the paper, the research model was validated through a quantitative method, using a survey addressed to experts working at European statistical offices. The questionnaire was designed to collect the participant’s positions on the need, the proficiency level, and the current and future usage of several factors to produce official statistics. We consider Academic disciplines, Data Engineering for official Statistics, Statistical Engineering and official Statistics, Data Analysis for official Statistics, Software and tools for official Statistics, Dissemination of official Statistic, Literacy of official Statistics, Software and tools for official Statistic, and Trusted Smart Official Statistics as the main factors. To operationalize the proposed model, we used tested scales to increase the validity while accounting for reliability.
The empirical results reveal the need to develop core Statistics and data science skills and competencies at NSOs. Appropriate knowledge of high-frequency data, spatial data, Big Data, microdata/nano-data are considered important for the future of data stewardship in official Statistics, which would support the value-added of new data infrastructures. Developing core competencies in new data methodologies and in new data quality tools and frameworks are critical for the success of this change. Regarding general (soft) skills, empowering problem-solving skills, data and statistical literacy, and all indicators of ethics are considered important for the adoption of Big Data-related competencies in the statistical production process. The use of machine learning and data visualization tools is projected to growth exponentially in preparing official statistics. The empirical results also show that the massive use of traditional software such as SAS might decrease and the popularity of open-source programming languages such as R software are expected to increase at NSOs. The results also suggest that regardless of the positive benefits of data science for official statistics, there is a risk of less transparency in official statistics in future.
The remainder of the paper is organized as follows. Section 2 summarizes the literature and previous related studies. Section 3 presents the primary research model to study the impact of data science in producing official statistics and trusted smart statistics. Section 4 presents and analyses the empirical results obtained in this study. Section 5 discusses the policy and managerial implications of the research results and highlights the mains conclusions and further research points.
2.Literature review and earlier studies
2.1Statistical business process and new technologies
The increasing number of new data sources is the result of many electronic devices physically surrounding us, which are connected widely on the internet. These devices provide novel additional information to empower traditional design-based inference of official statistics by improving the random samples, frameworks, estimates, nonresponse bias, and measurement errors.
Figure 1 exhibits a statistical business process based on technology to create official statistics from gathering raw data from data providers to produce digital products, electronic services, interactive maps and dashboards. As we can see in Fig. 1, the data collection is the first step. The available Big Data sources such as mobile data [8], spatial data, social media data, web data, sensors data [9], process generated data, crowdsourcing data, user-generated maps, search engine queries, posted comments, transaction data mobile Call Detail Records (CDRs) and computer systems data (Logs) could feed the next steps of the flow to achieve an algorithmic inference. Non-traditional data has shown proper performance to reduce the respondent’s burden and algorithmic inference has introduced new real-time indicators to improve the timeliness and quality of official statistics [10]. They have the potential to assist NSOs in providing more integrated services and professional statistical products to their end-users. In 2013, the leaders of the European Statistical System (ESS) clearly emphasized the necessity of compiling official statistics from Big Data in the Scheveningen Memorandum [11].
Figure 1.
Graphical summary of the statistical business process flow with new technologies – Source: Author’s preparation.
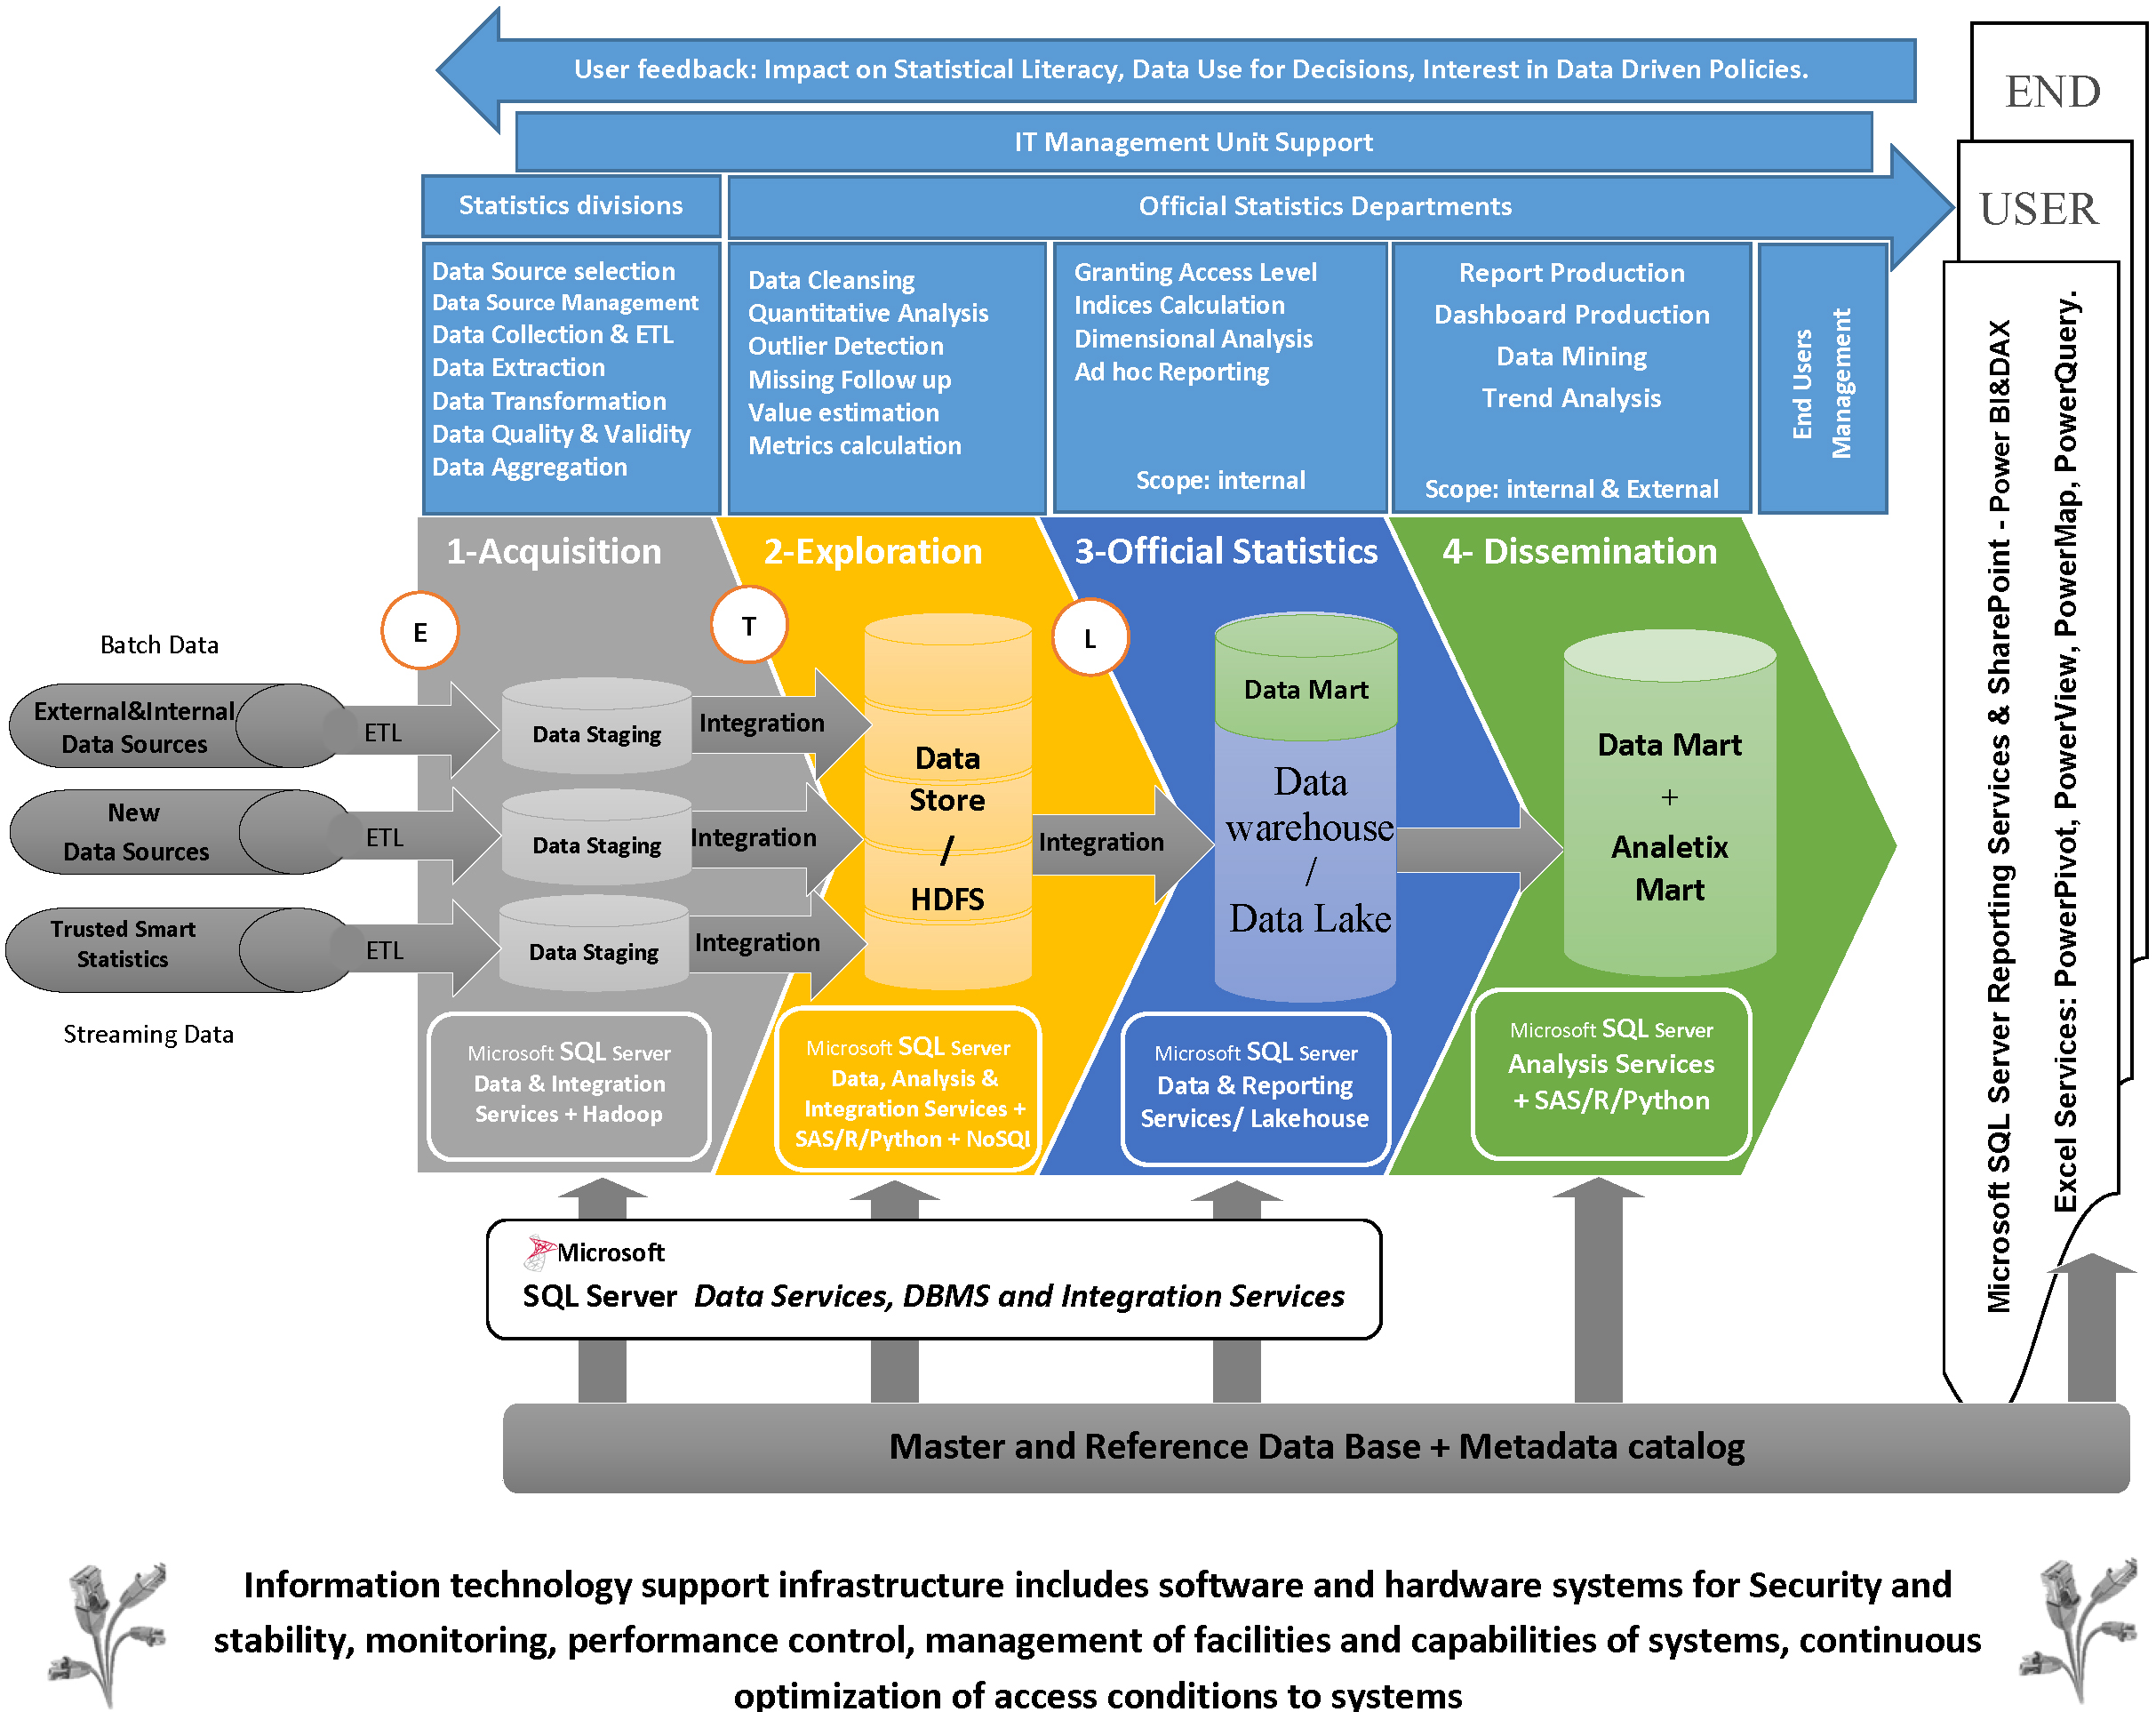
Despite its potential benefits, the use of non-traditional data and algorithmic inference should be treated carefully because of the potential threats of adding new sources of error without the possibility of measuring and recognizing the proper bias adjustments in statistical projects. This is because some of these systems were not designed specifically for statistical purposes, something that in a few cases may generate difficulties covering the definitions, standards and classifications required by traditional statistical products. Researchers should apply heavy data pre-processing for preparing good data and for inferencing the different algorithms. This might be costly and computationally expensive. Typically, the available computing facilities at NSOs are not sufficient to store and handle such high volumes of data and to manage the internal private cloud.
Consequently, developing parallel computing facilities (datacentres) at NSOs to tackle the course of dimensionality problem may be required, breaking down larger chunks of data and problems into smaller slices that can be executed concurrently by multiple processors connected via shared memory. Empowering current employees through data science training and recruiting professional data scientists with a background in official statistics are key to the success of data science at NSOs. The focus of statistical systems is to shift from data sources to data systems, which are imposing additional costs on the process. Therefore, since applying new technologies in official statistics is costly in both hardware and software, especially for statistical offices with low budgets, there is still a trade-off between the quality, cost response rate, response burden, and time when compared to traditional (e.g., census, statistical survey, secondary use of administrative data) production processes.
2.2Official statistics and data science
For many decades, NSOs have been collecting, processing, analysing and disseminating data results following comprehensive standards and frameworks. However, in view of the potential advantages from using a new data science approach for collecting diverse data and saving them into a memory to extract more timely and/or feasible information and/or to reduce the costs involved, NSO must consider its incorporation in the statistical production process. Combining computer science, modelling, statistics, analytics, and math skills with a sound knowledge of existing standards and frameworks could uncover novel (reliable) methods of producing official statistics. However, since many of these new data sources are large scale non-survey data, NSOs face a variety of statistical problems, whose resolution would benefit from the adoption of data science paradigms for the benefit of official statistics [12].
The growing volume of administrative data, granular data and registered based statistics with continuous flows are an attractive opportunity for NSOs to produce real-time quality statistics delivering on expectations of public institutions, the business community and the public at a lower cost when compared with traditional methods [13]. For this purpose, data science offers new approaches to process data systematically applying both traditional statistical techniques and new data mining and machine learning methodologies to describe and illustrate, condense, and evaluate data. To take advantage of this potential, a substantial investment must be made in software engineering for developing, maintaining and creating new software and to apply new technologies for producing official statistics. Finally, it includes the concept of deployment results, which refers to put the new official statistics into action and make proper reports for stakeholders, decision-makers and target end-users in public.
2.3Statistical engineering
Statistical engineering aims to study how to best utilize statistical concepts, methods, and tools, and how to integrate them with information technology and other relevant disciplines to achieve enhanced results [14]. Statistical engineering algorithms and principles are discussed by Steiner and Mackay [15] and have been developed recently by adopting more general and recent principles and definitions [16].
Statistical engineering utilizes existing concepts, methods, and information technology tools to find a novel solution for a high impact complex problem, through a multi-step strategy based on context and problem structure. It combines engineering and statistics using scientific methods to analyse data. For instance, data engineering could be considered as part of statistical engineering for managing micro-data and nano-data. Micro-data is a single record that refers to an individual data subject, and this term is used to distinguish them from macro-data as an aggregate indicator referred to groups and populations at the super-individual level. These granular data are manageable by new technologies to produce official statistics. Nano-data also refers to data records at the sub-individual level (event-based) [2, 17].
For managing the data at this level of granularity, data engineering could support statistical engineering. As an aspect of data science, this stage focuses on practical applications of data collection [18] and data cleaning (Fig. 1). Producing reliable official statistics using large information sets demands appropriate collection and validation mechanisms, which should be organized by both statistical departments and technical data management departments [19]. For instance, sharing statistical methods as powerful tools and services could be considered to improve standardisation and industrialization of statistical processes, fostering adoption, operationalization. This improvement of statistical standards is aligned with stimulating the development of services that are more modular and information technology-based [20].
Figure 2.
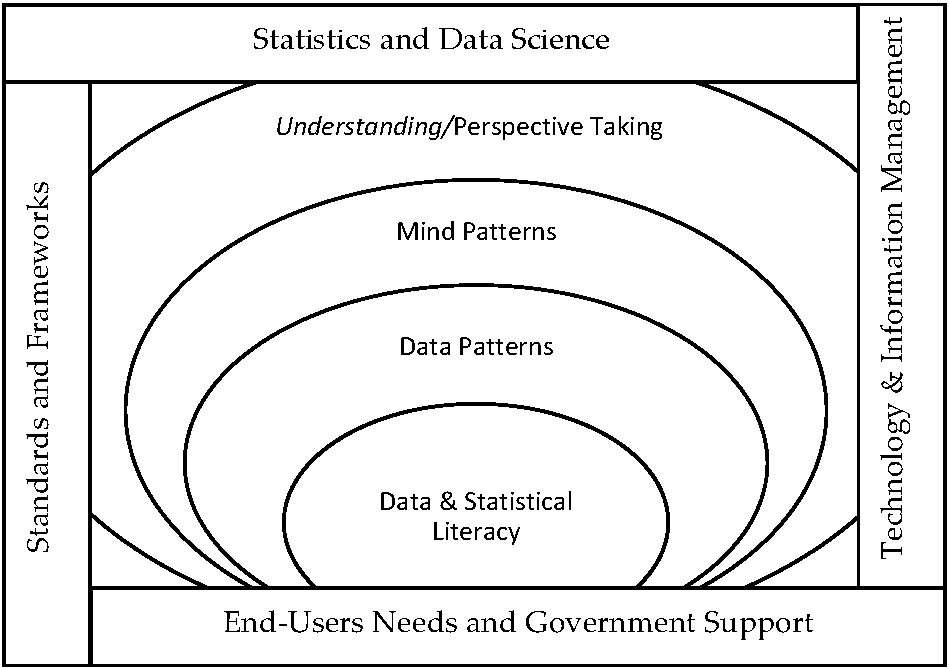
From data and statistical literacy to perspective taking and the limitations – Source: Author’s preparation.
2.4Data and statistical literacy and soft skills
Knowledge of data and statistics is considered a basic requirement to extract patterns from data to improve knowledge, to tackle problems and to develop solutions. We consider the shape of the relationship between the improved understanding and statistical literacy as a tornado whose narrow end or base touches statistical literacy (Fig. 2). It means statistical literacy is the input of this system, and the result or output would be a better contribution and understanding of official statistics. However, there are four restriction items, whose maturity confines this tornado system. The restriction items are: (i) the maturity of the technology and information management systems, (ii) the knowledge of statistics and data science, (iii) the requirement to follow both international and local standards and frameworks, and (iv) supporting public needs through government policies. If official statistics systems make an effort to improve on these restriction items, then this system will develop. The result would be an increase of the understanding of the public about the official statistics and better perspective-taking of NSOs about how their products appear to their end-users and how their users are reacting cognitively to their new products of official statistics.
In special circumstances such as the ongoing COVID-19 public health emergency, NSOs were challenged by the need to exploit information from multiple conventional and non-conventional sources, ensuring timely decision-making on public health policies geared to control the epidemics. They were also challenged by the need to tackle the problems in the next phases of the pandemic crisis management (e.g., economic recovery plans, collateral illnesses), as well as to address societal topics such as the UN Sustainable Development Goals, reducing poverty and inequality, climate change and biodiversity challenges [21]. People’s attention to official statistics increased, revealing the importance of understanding statistical concepts and terminology, not only for the professionals but also for society. National and international statistical systems have stepped up to address the urgent need for good data, contributing to reduce the “pandemics of fear”, misinformation and “fake news” which erode the trust in public institutions and democratic systems [22].
Data and statistical literacy could facilitate and accelerate the introduction of new working processes for every entity involved in the national statistical systems. It seems necessary to ensure data quality and data production when we are in an unprecedented complex situation [23].
2.5Trusted Smart Statistics
Trusted Smart Statistics (TSS) is a secure architecture for the cooperation between NSOs and the private sector, in areas such as shared computation facilities, control, code, logs, and final statistics, without necessarily sharing the raw input data. The development of TSS focuses on data that may be pre-processed by data providers or data sources, preparing it for immediate use for official statistics. This usually means combining this data with existing surveys or administrative data [17]. Trusted Smart Statistics is a natural evolution of official statistics in the new datafied world. Trusted Smart Statistics is not about replacing existing sources and processes but augmenting them with new ones. However, such augmentation will not be only incremental: the path towards TSS is not about tweaking some components of the legacy system but about building an entirely new system that will coexist (and eventually integrate) with the legacy one [2]. It means that the traditional data sources and methodologies are still the most reliable and valid methods as we can see for instance in Eurostat launched ESS Vision 2020 ADMIN (Administrative data sources) which provide information for wider and better use of administrative sources in the production of official statistics [24].
Although there are benefits from cooperating with these new data providers, there are some quality and ethical concerns that cannot be ignored [25]. These concerns are eventually greater than technical or technological challenges faced. These quality and ethical concerns include, for instance, the lack of a legal right to access to fair data, i.e. findability, accessibility, interoperability and reusability [26], concerning fairness, privacy, security, inclusiveness, transparency and accountability. Some frameworks address specifically ethnicity problems such as the Diverse, Equitable, and Inclusive framework (DEI) [27] or the Privacy, Security, Accountability, Reliability, Safety, Fairness, Inclusiveness, Transparency (PARFIT) of Microsoft’s responsible AI principles and guidelines [28]. These are important in producing official statistics to serve the public needs not only by data and information but also by empowering social responsibility, social awareness, and sustainability. There should not be a trade-off between data ethics and the needs for official statistics to make a balance between the ethical guidance on the use of data science and the public benefit by providing better official statistics as a public good.
Recently, the term ‘smart surveys’ has been used to refer to surveys based on smart personal devices, typically smartphones. Smart surveys involve (continuous, low-intensity) interaction with the respondent and with his/her personal device(s) [29]. For these new data gathering methods, it seems necessary to cover up all essential steps for checking the quality of data, providing proper algorithms with reasonable accuracy, and deploying the results understandably and with good interpretability to the end-user all-in-one [30]. Data scientists have developed methods such as the Shapley Additive Explanations (SHAP) [31] or the Local Interpretable Model-agnostic Explanations (LIME) [32] to discuss “how” or “why” something is going on, more than “what”. This is essential for solving ethical concerns of the non-parametric models to be used for checking the quality of these new approaches and producing the results as public goods.
Figure 3.
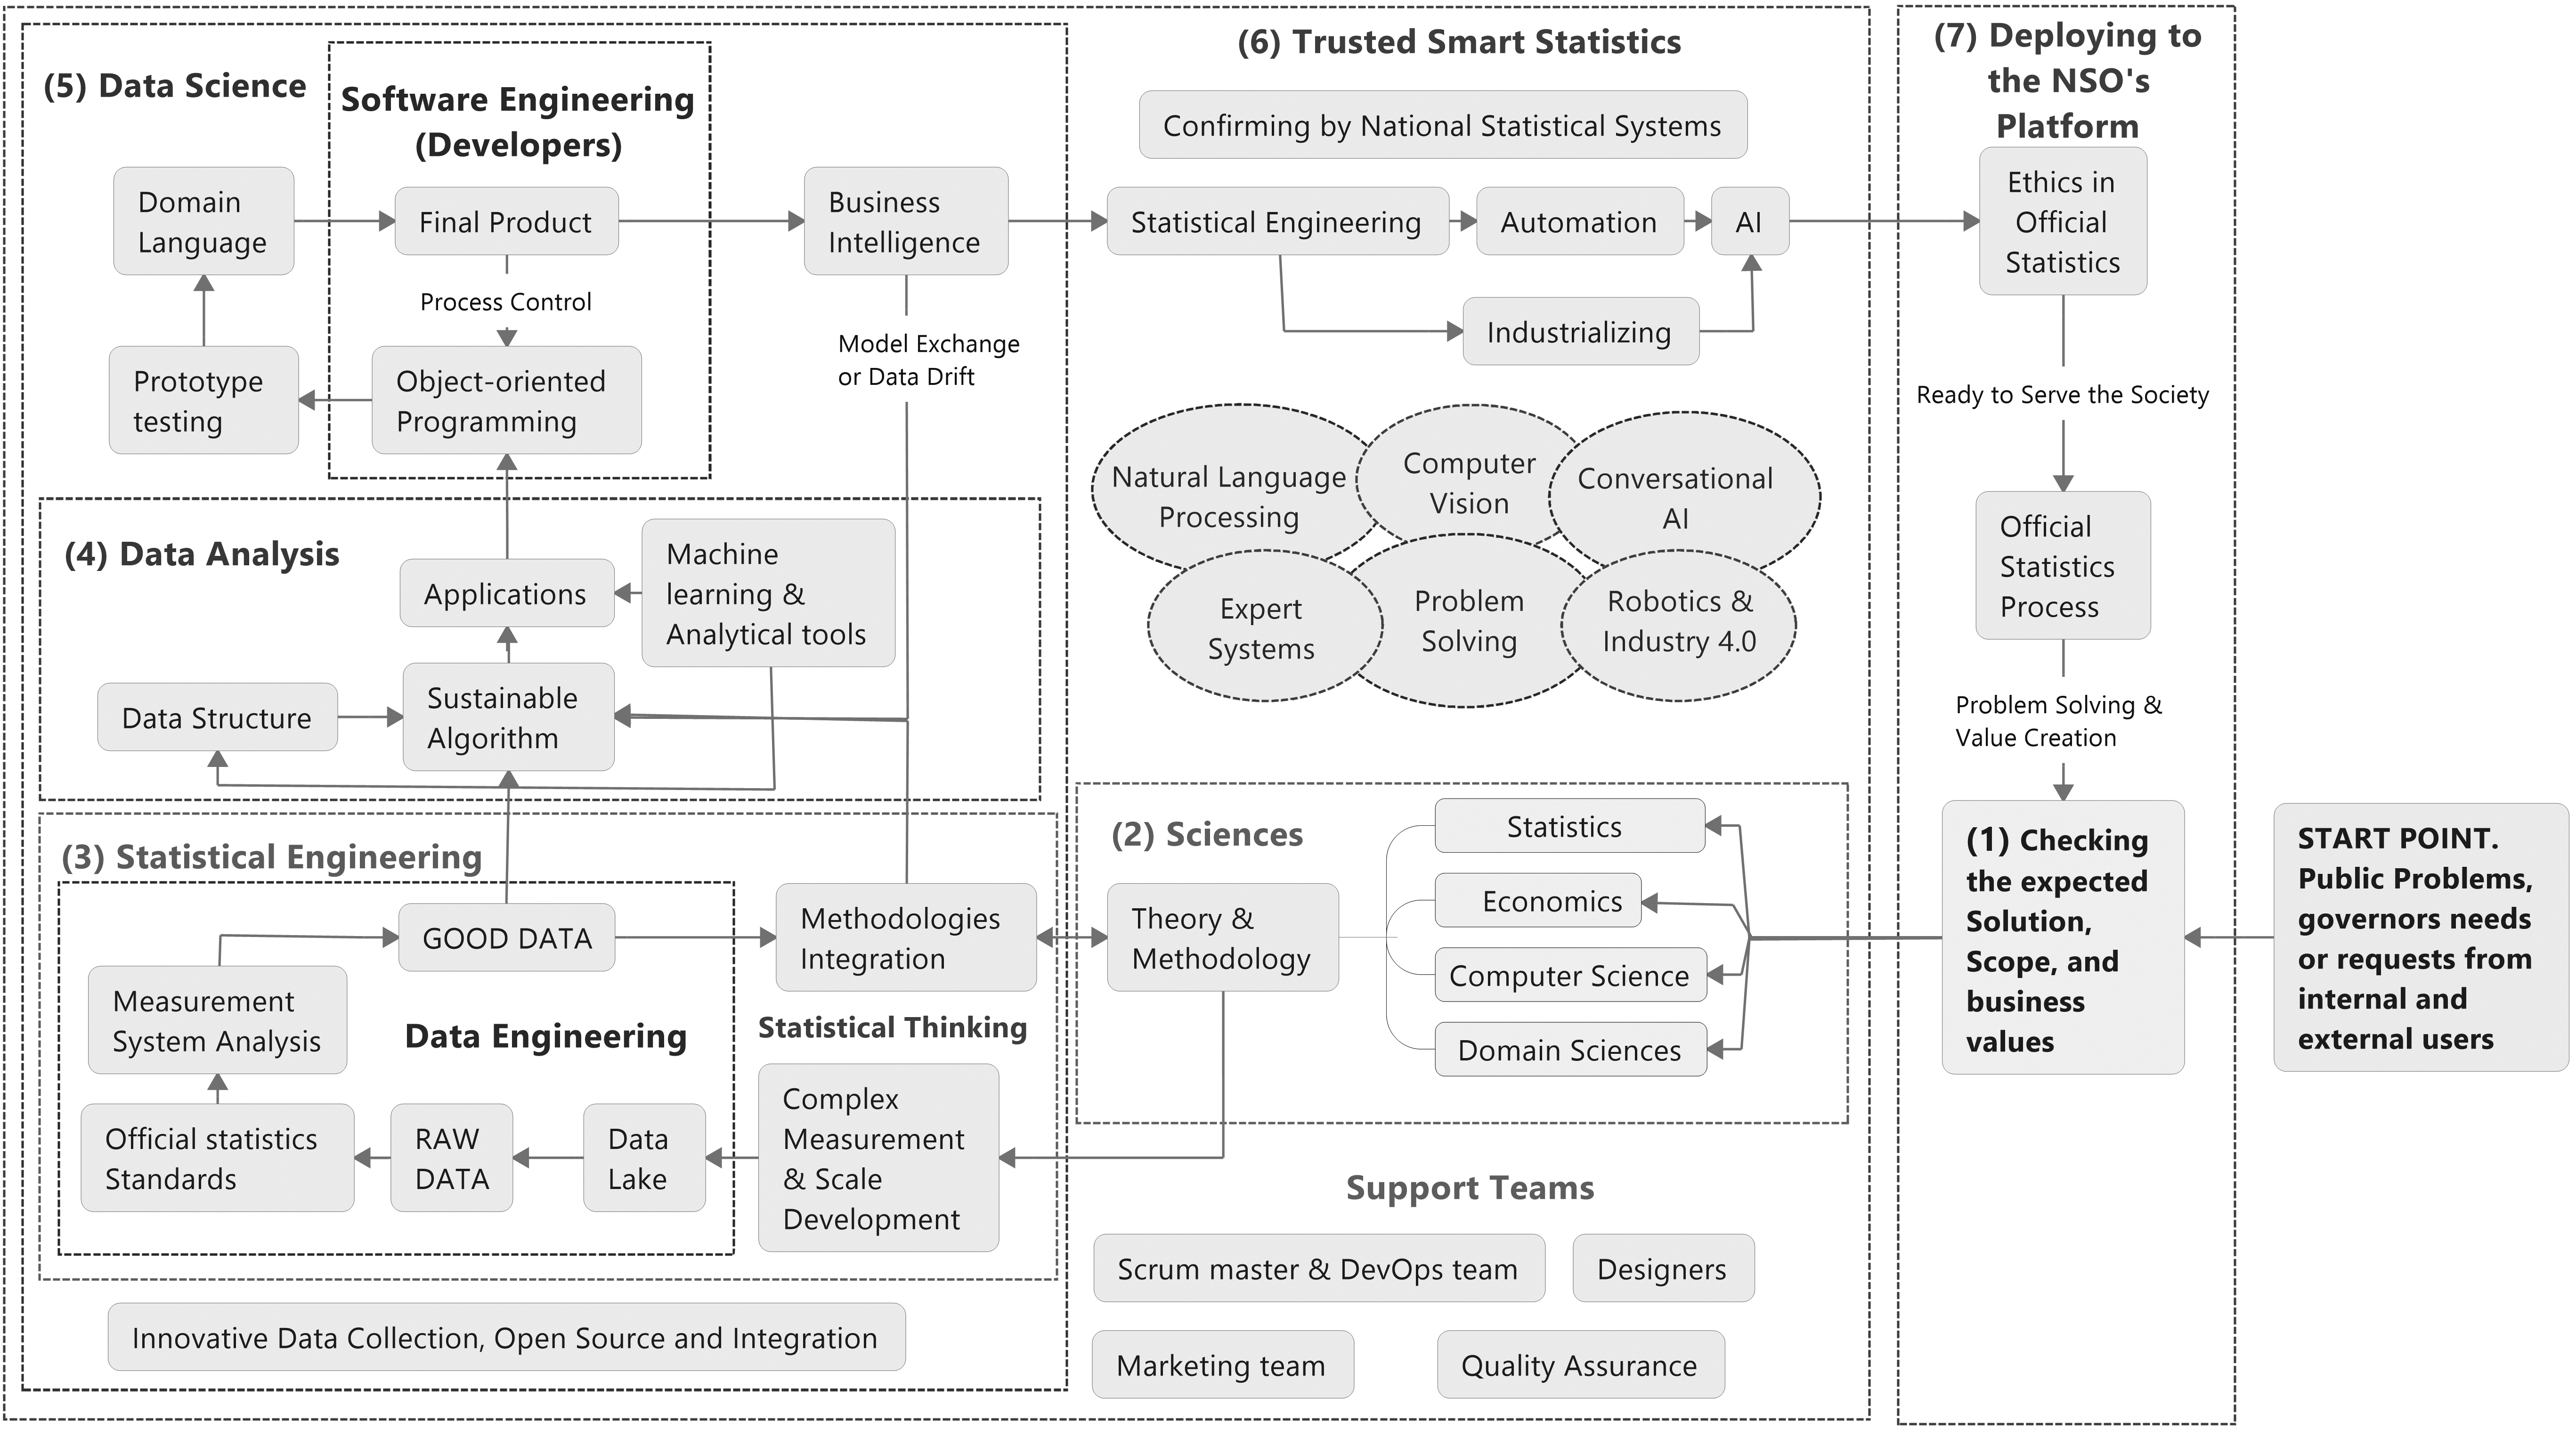
Primary model based on literature review and before experts’ reviews; Source: Author’s preparation.
Furthermore, to strip sufficient elements from data such that the data subject can no longer be identified, national statistical systems should respect the disclosure avoidance11 and use pseudonymization for sensitive data and anonymization to authorize access safely to individual confidential data according to regulations such as Directive 95/46/EC [33]. Data scientists specialized in official statistics should have skills in defining proper algorithms to control the disclosure risks and to fulfil the cybersecurity, SDL and legislation requirements.
3.Construct Data Science Model for Official Statistics (DSMOS)
We have developed a research model for analyzing the impact of data science on official statistics based on the main current developments in official statistical theory. The model was complemented with expert’s opinions as described in the following sections. It could be considered as a baseline for studying the impact of data science in producing official statistics and trusted smart statistics to satisfy the needs of end-users. The primary model, illustrated in Fig. 3 consists of data science, existing scientific paradigms, and trusted smart statistics, and comprises six main constructs: (i) new requirements assessment, (ii) methodology improvement, (iii) statistical engineering, (iv) software development, (v) official statistics product deployment and (vi) dissemination [34].
Figure 3 shows that the starting point of the process is a cost-benefit analysis of the requests from internal or external users. If the new request is approved with reasonable business value, then the required methodology and theories are constructed by pure sciences and standards and frameworks related to official statistics. The next step would be the starting point for the activities of data scientists with ‘methodology integration’ and statistical engineering. It includes scale development and preparing the appropriate data based on standards to extract a sustainable algorithm. In this phase, data scientists investigate the data structure and the use of new analytical tools such as machine learning algorithms to construct proper applications. The programming skills of data scientists help to build smart surveys based on these applications. They will then need to be examined and validated by bringing forward other data science competencies and skills in official statistics such as checking for standards, frameworks. Finally, statistical literacy skills are essential to produce proper data visualization for dissemination.
Table 1
Primary factors and indicators
| Factors | Indicators |
|---|---|
| 1. Academic training | 1.1. The European Master in Official Statistics (EMOS); 1.2. Statistics |
| 2. Data Engineering for official Statistics | 2.1. Data Lake; 2.2. Big Data (such as Citizen Data); 2.3. Data reuse and sharing; 2.4. Semantic web; 2.5. Data on-the-go (such as Travel Data); 2.6. High Frequencies data (such as Scanner Data); 2.7. Spatial data (such as grid data or mesh); 2.8. OpenSource Data (Satellite Data (e.g., Statistical Sections), Telco data (e.g. population counts), etc.); 2.9. Micro-data and nano-data |
| 3. Statistical Engineering and official Statistics | 3.1. Domain knowledge and subject matter theory; 3.2. Problem solving strategy; 3.3. Data pedigree; 3.4. Sequential approaches; 3.5. Problem context or request context |
| 4. Data Analysis for official Statistics | 4.1. Machine Learning; 4.2. Deep Learning [35]; 4.3. Natural language processing (NLP); 4.4. Web Intelligence; 4.5. Spatio-temporal models |
| 5. Software and tools for official Statistics | 5.1. Code replicability & reusability; 5.2. R for official statistics; 5.3. Python for official statistics; 5.4. SAS for official statistics; 5.5. Shared statistical services |
| 6. Dissemination of official Statistics | 6.1. Data Visualisation by recent technologies; 6.2. Model deployment for end-users; 6.3. Virtual Reality (VR) for complex visualisations [36, 37] |
| 7. Literacy of official Statistics | 7.1. Data Literacy; 7.2. Statistical Literacy; 7.3. Computer Literacy; 7.4. Citizen Science; 7.5. Statistical thinking |
| 8. Ethics in Official Statistics | 8.1. Privacy & Confidentiality; 8.2. Racial Equity; 8.3. Fairness and Fair data; 8.4. Security; 8.5. Inclusiveness; 8.6. Transparency; 8.7. Accountability |
| 9. Trusted Smart Official Statistics | 9.1. Internet of Things (IoT); 9.2. Trusted Smart Surveys; 9.3. Cell phone Applications and Operation Systems; 9.4. New data methodologies for official statistics; 9.5. New data quality for official statistics |
The model combines statistical engineering, data engineering, data analysis, software engineering and soft skills such as statistical thinking, statistical literacy and specific knowledge of official statistics and dissemination of official statistics products as requirements for the adoption of data science in official statistics. Section 6 of Fig. 3 highlights that smart systems could be built automating the survey and dashboards and checking for eligibilities within the national statistical system. Checking the ethics in official statistics is necessary before deploying the new system to conclude a sustainable official statistics product. This primary model was considered as the basis of negotiation with experts. The questionnaire was designed to not only complete the model with the feedback of experts but also to extract and incorporate new insights on the skills and competencies required to adopt the data science paradigm in official statistics.
4.Empirical methodology
4.1Measurement instrument
To operationalize the research model, we used tested scales to increase validity. We considered the model main factors and for each one of them, we generated some indicators in line with the literature review and recent professional discussions (e.g., Conference on new techniques and technologies for statistics, NTTS2021) The complete list of indicators is presented in Table 1.
The research model was validated through a quantitative method, using a survey addressed to experts working at Statistical Offices in the European Union countries and Eurostat. The questionnaire was composed of the model with an open question about the participant’s opinion and experience, and several questions to characterize the respondents, answering on numerical rating scales of five-points (1-very low, to 5-very high). For each factor/construct, four questions were asked about the:
1. Necessity Level: to assess to what extent the factor is considered necessary for staff working in official statistics production.
2. Proficiency Level: to evaluate which level of proficiency is considered necessary for staff working in production official statistics.
3. Current Usage: to address the current use of this factor by NSOs.
4. Future Usage: to foresee the expected use of this factor by NSOs in future.
Additionally, we asked experts to suggest more indicators if they believed important factors or indicators were missing. For each factor, the indicators were ranked according to their importance and priority. Based on the answers to this part of the questionnaire, we included the important indicators and concluded their priority in each factor of the model.
Table 2
Sample characterization
| Factors/construct | Number of selected experts | Number of replies |
|---|---|---|
| 1. Academic training | 167 | 38 |
| 2. Data Engineering for official Statistics | 22 | 4 |
| 3. Statistical Engineering and official Statistics | 21 | 2 |
| 4. Data Analysis for official Statistics | 20 | 3 |
| 5. Software and tools for official Statistics | 21 | 10 |
| 6. Dissemination of official Statistics | 17 | 4 |
| 7. Literacy of official Statistics | 21 | 5 |
| 8. Ethics in Official Statistics | 22 | 4 |
| 9. Trusted Smart Official Statistics | 22 | 6 |
| Primary Model Criticism (Fig. 3) | 167 | 36 |
| Explanatory Responses without filling up the questionnaire | 10 |
4.2Data collection
The survey was operationalized through an online contact via email. To guarantee the quality of the data and the responding experts’ profile, we reviewed the research papers and the presentations made at the 2021 Conference on New Techniques and Technologies for Statistics (NTTS2021), selecting 167 experts on new technologies in official statistics from different NSOs in Europe and the Eurostat. We considered the link between the topics addressed in their communications and our model’s factors. Contact information was collected from publicly available information (email address) at NSOs websites. From the 167 email addresses, 10 emails were not correct and were eliminated from the list for further contacts. For each selected article, the e-mail containing the name of the author, title of the contributed article in NTTS2021, questionnaire and description was directed to all authors individually.
Since the complete questionnaire included two open questions, ranking 45 items and 180 close questions, it was clear that the response burden could be problematic. As a result, we divided the complete questionnaire into nine questionnaires and divided the 167 selected experts into 9 different categories, roughly assigning 21 experts for each factor, according to the relevance of the selected respondent’s article with the selected factor22 (Table 2).
To assure the perfect understanding of its content, we conducted a pilot test with 27 experts, which randomly were chosen from candidates for each factor (3 respondents for each factor). After applying the pilot test, some questions and description of the items were simplified and improved.33 We did not use the pilot test results in the main analysis. The pilot measurement model was evaluated assessing the constructs and indicator’s reliability, which were satisfactory, indicating that the questionnaire could be used to collect the full sample. All data were provided voluntarily, and the data were treated with strict confidentiality and anonymity.44 After sending the questionnaire for the selected experts, we also sent two follow up emails. Additionally, we promptly answered all questions asked by respondents clarifying some doubts. Finally, we received 38 completed questionnaires from 15 European statistical authorities including Eurostat, in addition to descriptive answers of 10 respondents, who preferred to express their ideas and general comments in an open format (Table 2).
The DSMOS was reviewed by 34 experts. The revised model and the questionnaire results are presented in the next section.
4.3Results
The mains respondents’ suggestions on the data science for the official statistics model (DSMOS) were:
• In addition to the data engineering methods, assessment of data source existence and data collection for official statistics [38] should be considered from the beginning of each survey to reduce data burden to statistical units and costs to taxpayers. It goes in the direction of re-using existing data, high-frequency data, and open-source data or data lakes. Following this recommendation, we added checking the availability of data, especially administrative registers to stage one of the DSMOS.
• Anonymised data transmission from private registries (preferably transaction data) should be considered as a priority for future access to higher quality data with less burden to statistical units. Following this suggestion, we added anonymization of data transmission to the raw data box in stage 3, the statistical engineering stage.
• One expert from Eurostat suggested considering communication, presentation, and languages knowledge as necessary soft skills.
• Some experts suggested considering the Generic Statistical Business Process Model (GSBPM) to describe the statistics production process in the DSMOS. They recommended the use of the GSBPM terminology as a standard in our model. Following this recommendation, we added the eight phases of the GSBPM to our model, and we modified terminology where necessary to improve consistency with the GSBPM standards. Additionally, based on the terminology of the GSBPM we re-named some processes and stages to improve clarity.
• It was recommended that international requests and standards should be considered at the start point of the DSMOS. In stage 2, it was recommended to consider international workgroups and cross-international work between statistical agencies such as centres of excellence and working groups such as the UN Machine Learning Group as a part of the scientific base on official statistics. Reference to Quality Management or Assurance stage was suggested in stage seven.
• Two experts recommended including a mention stating that not all of DSMOS steps may needed, and that they may be conditioned to the number of resources involved. The authors agree with this point in that the model is flexible and not rigid and static and that its steps do not always need to be followed in a strict sequential order. The elements of the DSMOS model may occur in different orders in different circumstances. The authors’ description of the model presents one of the possible logical sequences of steps in applying data science and new technologies in the statistical business process.
• The review of the DSMOS in Fig. 3 incorporates the changes considered to represent an important improvement in the different model stages. The changes refine the initial proposal, improve its clarity and target a widespread adoption and use of the model by statistical offices.
As a result of the modifications introduced in the primary model, the revised DSMOS begins with the needs of users and comprises six main levels namely methodology, statistical engineering, data analysis, data science, trusted smart statistics, and deploying. They are not independent levels, and the borderlines indicate the coverage of each one. For instance, statistical engineering and data analysis are independent. However, both are subsets of data science. As a result, the borderline of data science included statistical engineering and data analysis.
The flow has eight phases and is similar to the GSBPM. It includes specifying needs, design, build, collect, process, analyze, dissemination, and evaluate.
The DSMOS recognizes two main overarching processes to support the whole process. The first one is named “underlines”, and includes Information Management, Regulations & Standards, Data Governance, Data Literacy, Statistical Literacy, Information technology, Ethical Codes, Meta Data & Reference Data, Open source, Innovative Data Collection and Integration, and Project Management (Business case, Scope, Cost management, Timeline, Quality management, HR management, Communication Management, Procurement Management, Stakeholder Management, Integration Management, Risk Management, ROI monitoring).
Figure 4.
Data Science Model for Official Statistics (DSMOS) based on literature review and after experts’ reviews; Source: Author’s preparation.
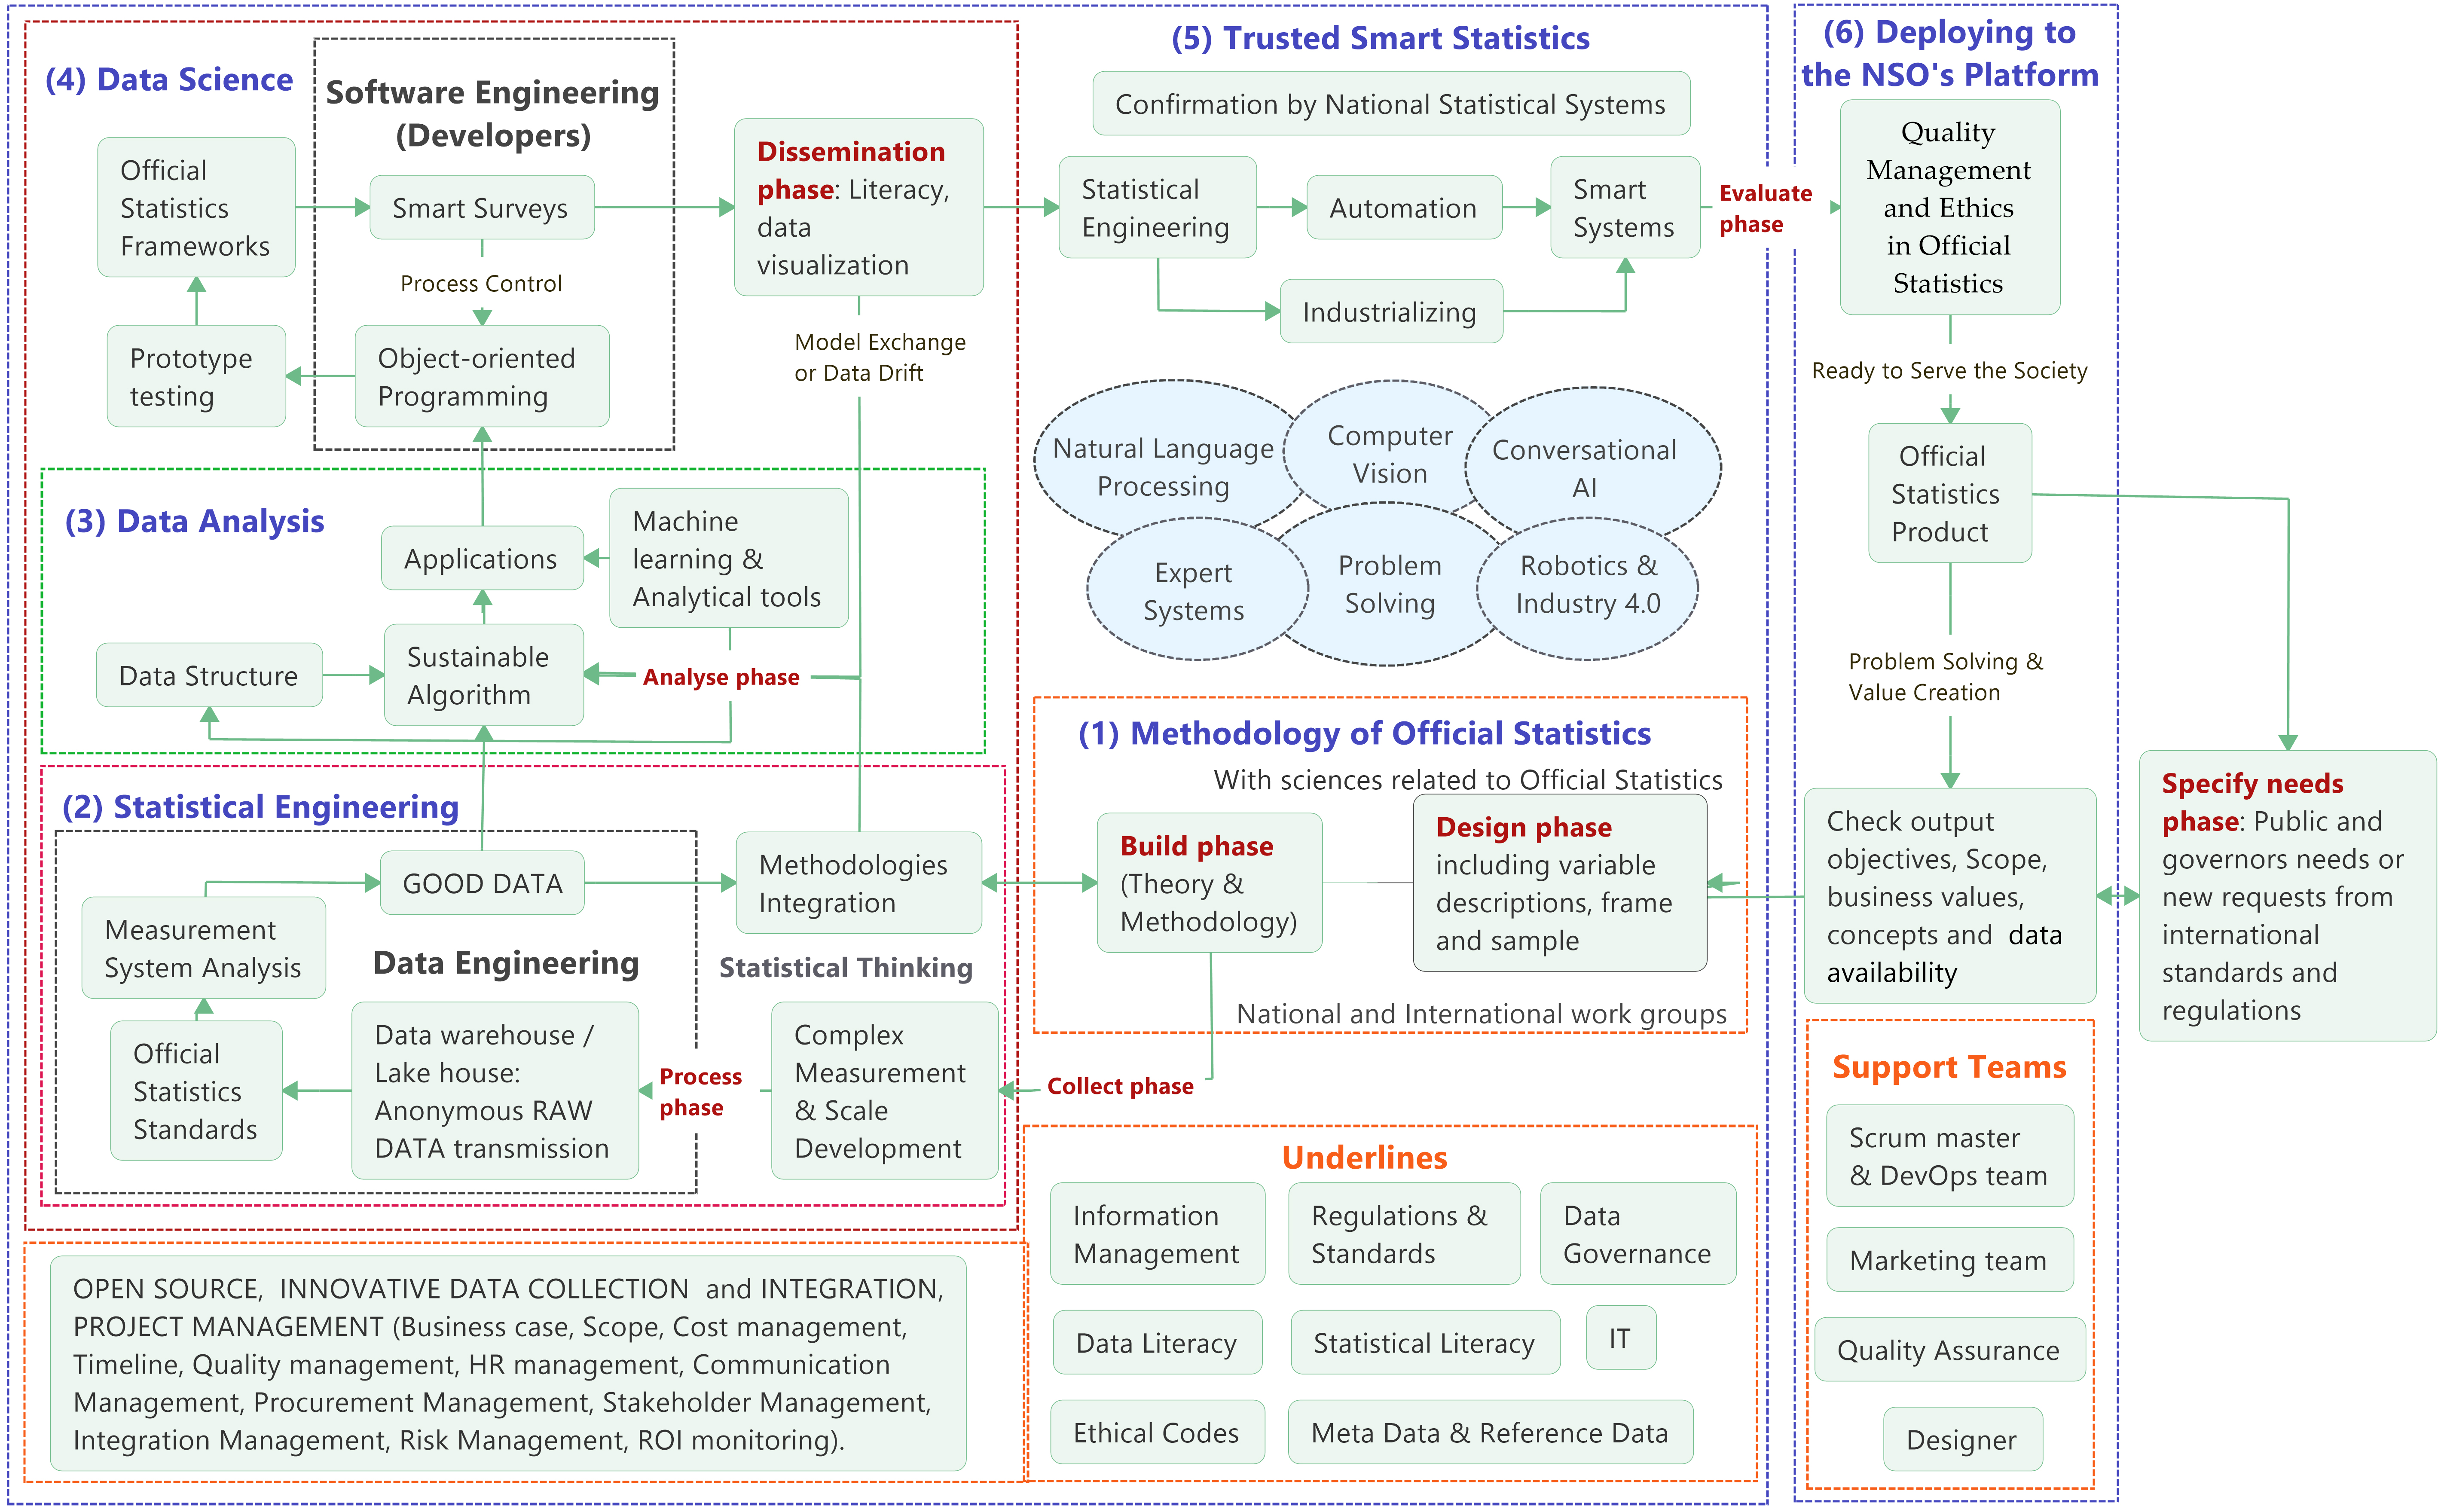
Figure 4 represents the levels and phases of the proposed DSMOS:
– Specify needs phase: Check output objectives; Scope; business values; concepts; check data availability; if the request is confirmed we then can continue with the loop of levels and sub-levels.
* Design phase: including variable description, frame and sample.
* Build phase: developing the theory if necessary and build methodology.
* Statistical Engineering: Statistical thinking should be considered in the following dependent sub-sections even in the pure engineering ones.
* Data Analysis
* Software Engineering
* Prototype testing
* Official Statistics Frameworks
* Smart Surveys
* Dissemination Phase: this phase has a drawback to analyze phase in the case of data drift or model exchange. This loop shows the necessity of casual revisions of methods to save the accuracy, which could be degraded over time.
* Quality Management
* Ethics in Official Statistics
The software engineering section in Fig. 4 refers to the developers who are known as the framework users with no idea about the machine learning details. It could be merged with data analytics to refer to the framework developers who are professionals in programming and machine learning.
Table 3
Revised factors and indicators
| Factors | Indicators |
|---|---|
| 1. Academic training | 1.1. The European Master in Official Statistics (EMOS); 1.2. Statistics; 1.3. Information Technology (IT); 1.4. Artificial Intelligence (AI); 1.5. Data science; 1.6. Economy; 1.7. Mathematics; 1.8. European Statistical Training Programme (ESTP); 1.9. Social science |
| 2. Data Engineering for official Statistics | 2.1. Data Lake; 2.2. Big Data (such as Citizen Data); 2.3. Data reuse and sharing; 2.4. Semantic web; 2.5. Data on-the-go (such as Travel Data); 2.6. High Frequencies data (such as Scanner Data); 2.7. Spatial data (such as grid data or mesh); 2.8. OpenSource Data (Satellite Data (e.g. Statistical Sections), Telco data (e.g. population counts), etc.); 2.9. Micro-data and nano-data; 2.10. Visual data (such as Images from Satellite) |
| 3. Statistical Engineering and official Statistics | 3.1. Domain knowledge and subject matter theory; 3.2. Problem solving strategy; 3.3. Data pedigree; 3.4. Sequential approaches; 3.5. Problem context or request context |
| 4. Data Analysis for official Statistics | 4.1. Machine Learning; 4.2. Deep Learning; 4.3. Natural language processing (NLP); 4.4. Web Intelligence; 4.5. Spatio-temporal models |
| 5. Software and tools for official Statistics | 5.1. Code replicability & reusability; 5.2. R for official statistics; 5.3. Python for official statistics; 5.4. SAS for official statistics; 5.5. Shared statistical services; 5.6. Statistical Data and Metadata Exchange (SDMX); 5.7. Web Intelligence Hub; 5.8. Time series tools; 5.9. Statistical disclosure tools; 5.10. Remote sensing and satellite imagery software |
| 6. Dissemination of official Statistics | 6.1. Data Visualisation by recent technologies; 6.2. Model deployment for end-users; 6.3. Virtual Reality (VR) for complex visualisations |
| 7. Literacy of official Statistics | 7.1. Data Literacy; 7.2. Statistical Literacy; 7.3. Computer Literacy; 7.4. Citizen Science; 7.5. Statistical thinking |
| 8. Ethics in Official Statistics | 8.1. Privacy & Confidentiality; 8.2. Racial Equity; 8.3. Fairness and Fair Data; 8.4. Security; 8.5. Inclusiveness; 8.6. Transparency; 8.7. Accountability |
| 9. Trusted Smart Official Statistics | 9.1. Internet of Things (IoT); 9.2. Trusted Smart Surveys; 9.3. Cell phone Applications and Operation Systems; 9.4. New data methodologies for official statistics; 9.5. New data quality for official statistics; 9.6. Web scraping applications for official statistics; 9.7. Machine Learning |
Table 4
Comparison between EMOS and Master in Statistics certifications
| Indicators | Comparison | |
|---|---|---|
| Frequency | Percentage | |
| 1.1. The European Master in Official Statistics | 4 | 20% |
| 1.2. Statistics | 16 | 80% |
The numbering of the levels of the DSMOS is not started from the phase of specifying the needs, because usually there are many new requests from users to the NSOs, which could not be responded to. The real process of producing official statistics are triggered by identifying a meaningful request for new statistics and the cost, possibility and necessity of the new product should be confirmed by NSOs. Therefore, stage one of the model is initiated after production possibility approval from the official statistics systems.
Additionally, as we can see in Table 3, the indicators of the phases and the sub-processes have been updated according to the experts’ suggestions to be less survey-centric. Activities related to each factor have been added where necessary.
The main changes are as follows:
• For factor 1, academic training, the experts suggested adding “Information Technology (IT)”, “Artificial Intelligence (AI)”, “Data Science”, “Mathematics”, “Economics”; “European Statistical Training Programme (ESTP)” and “Social Science” as indicators. As a result, the number of indicators for this factor was increased to 8.
• For factor 2, Data Engineering for official Statistics, the experts suggested adding one additional indicator “Visual data (such as Images from Satellite)”. As a result, this factor now includes ten indicators.
• For factor 5, Software and tools for official Statistics, the experts suggested including the indicators “Statistical Data and Metadata Exchange (SDMX)”, “Web Intelligence Hub”, “Time-series tools”, “Statistical disclosure tools”, “Remote sensing and satellite imagery software”.
• For factor 9, Trusted Smart Official Statistics, it was recommended to consider web scraping applications for official statistics and Machine Learning as new indicators [21, 39].
Table 5
Current and future importance of Education and Academy Certificates indicators for official statistics.
| Indicators | N | P | C | F |
|
| S | |
|---|---|---|---|---|---|---|---|---|
| Education and Academy | Statistics | 4.26 | 4 | 4.14 | 4.29 | 56% | 58% | 1 |
| Certificates | Data science | 4.25 | 3.86 | 2.25 | 4.25 | 30% | 56% | 1 |
| Economy | 4 | 3.33 | 3.75 | 4 | 40% | 43% | 1 | |
| The European Master in Official Statistics | 3.29 | 3.56 | 3 | 3.83 | 28% | 36% | 1 | |
| European Statistical Training Programme | 3.33 | 3.67 | 3 | 3.33 | 29% | 33% | 1 | |
| Mathematics | 3.4 | 3.4 | 3.5 | 3.5 | 32% | 32% | ||
| Artificial Intelligence | 3.67 | 3 | 2 | 3.33 | 18% | 29% | 1 | |
| Information Technology | 3.8 | 3 | 3 | 3 | 27% | 27% | ||
| Social science | 2.33 | 2.33 | 2 | 2.5 | 9% | 11% | 1 |
Notes: (1) Necessity (2) Proficiency (3) Current usage (4) Future usage (5) Current importance (6) Future importance (7) Sign.
The results in Table 4 suggest, based on the responses from 20 experts, that regular academic training in Statistics should be prioritized when compared to pursuing EMOS certification. The significant difference between the two demonstrates the interest of NSOs in the educational structure and in courses in Statistics, and its crucial role in producing official statistics. Additionally, the predominance of Statistics was directly emphasized by three respondents in their comments.
Table 5 investigates these results in detail and compares the importance of Statistics with all recommended disciplines in the education and academy certificates category. In the table, CI represents the current importance of each item, whereas FI indicates what is believed to be its importance level in future. Equations (2) and (2) indicate the scale of both CI and FI, which ranges in both cases from zero to 100.
(2)
As education is a long-term investment, we considered the importance of each item in the future as a sorting factor. Therefore, we sorted the table according to the FI, and we calculated the difference between the current importance and the future importance as an indicator function of expected positive or negative growth of the item as follows.
(3)
Table 5 reports that the current three first certificates for official statistics are Statistics, Economy and Data Science. However, the results also suggest that experts believe the importance of data science in official statistics will increase significantly in future. Experts believe, nonetheless, that Statistics will continue to play the main role in official statistics. The results in the last column in Table 5 reveal the expected increase or decline in the importance of key disciplines in official statistics.
We repeated the same computation for all of the remaining factors, the results being presented in the tables below.
Table 6
Current and future importance of data engineering for official statistics indicators for official statistics
| Indicators | N | P | C | F |
|
| S | |
|---|---|---|---|---|---|---|---|---|
| Data Engineering for | HighFrequency data (such as Scanner Data) | 4.5 | 5 | 3 | 4.5 | 54% | 81% | 1 |
| official Statistics | Spatial data (such as grid data or mesh) | 4.5 | 5 | 3.5 | 4.5 | 63% | 81% | 1 |
| Big Data (such as Citizen Data) | 4.5 | 4.5 | 3.5 | 4.33 | 57% | 70% | 1 | |
| Micro-data and nano-data | 4 | 4.5 | 2.5 | 4 | 36% | 58% | 1 | |
| Open-Source Data | 3.5 | 4 | 2 | 3.5 | 22% | 39% | 1 | |
| Data reuse and sharing | 3 | 3 | 2.5 | 3 | 18% | 22% | 1 | |
| Visual data (such as Images from Satellite) | 2 | 4 | 1 | 2.5 | 6% | 16% | 1 | |
| Data on-the-go (such as Travel Data) | 2.5 | 2.5 | 2 | 3 | 10% | 15% | 1 | |
| Data Lake | 2.5 | 2 | 1.5 | 2.5 | 6% | 10% | 1 | |
| Semantic web | 2 | 2 | 2 | 2 | 6% | 6% | 0 |
Notes: (1) Necessity (2) Proficiency (3) Current usage (4) Future usage (5) Current importance (6) Future importance (7) Sign.
The results in Table 6 suggest that data engineering skills on highfrequency data, spatial data, Big Data and microdata/nano-data are considered to be very important in the future of official statistics. It is foreseen that these three indicators would be the most important ones for producing official statistics in future.
Table 7
Current and future importance of Statistical Engineering indicators for official statistics
| Indicators | N | P | C | F |
|
| S | |
|---|---|---|---|---|---|---|---|---|
| Statistical Engineering | Problem solving strategy | 4 | 5 | 3 | 4 | 48% | 64% | 1 |
| Problem context or request context | 3.5 | 3.5 | 4.5 | 4.5 | 44% | 44% | 0 | |
| Domain knowledge and subject matter theory | 4 | 3.5 | 3.5 | 3 | 39% | 34% |
| |
| Data pedigree | 3 | 4 | 2.5 | 3 | 24% | 29% | 1 |
Notes: (1) Necessity (2) Proficiency (3) Current usage (4) Future usage (5) Current importance (6) Future importance (7) Sign.
A key result of the analysis is the high importance attached to problem-solving strategy, problem context/request context and domain knowledge (Table 7). However, experts anticipate that problem-solving skills will be more dominant in comparison with domain knowledge. The results also suggest that experts believe the importance of domain knowledge and subject matter theory will decline in future. One possible explanation for this result is the notion that technology may be evolving faster than the human ability to deal with it, demanding needs agile and flexible solutions to the challenges posed to official statistics.
Table 8
Current and future importance of Data Analysis indicators for official statistics
| Indicators | N | P | C | F |
|
| S | |
|---|---|---|---|---|---|---|---|---|
| Data Analysis for | Spatio-temporal models | 4.33 | 4 | 3 | 4.67 | 42% | 65% | 1 |
| official Statistics | Machine Learning | 4.33 | 4 | 2.33 | 4.33 | 32% | 60% | 1 |
| Deep Learning | 3.33 | 4 | 1.67 | 3.67 | 18% | 39% | 1 | |
| Web Intelligence | 3 | 3.33 | 1.33 | 3 | 11% | 24% | 1 | |
| Natural language processing (NLP) | 2.67 | 3.33 | 1.33 | 2.67 | 9% | 19% | 1 |
Notes: (1) Necessity (2) Proficiency (3) Current usage (4) Future usage (5) Current importance (6) Future importance (7) Sign.
The results in Table 8 show that Spatio-temporal models and machine learning techniques are predicted to have a more important role in the future of official statistics, particularly when compared to the importance attached to the other indicators of data analysis for the official statistics factor. Although the results show that machine learning is still in the early steps of adoption by official statistics, the discipline is considered to be one of the dominant concepts in the future.
Table 9
Current and future importance of Software and Tools indicators for official statistics
| Indicators | N | P | C | F |
|
| S | |
|---|---|---|---|---|---|---|---|---|
| Software and Tools for | Code replicability & reusability | 4.38 | 4.25 | 3.25 | 4.63 | 48% | 69% | 1 |
| official Statistics | R for official statistics | 4.33 | 4.11 | 3.56 | 4.56 | 51% | 65% | 1 |
| Statistical Data and Metadata Exchange | 4 | 3.33 | 2.33 | 4 | 25% | 43% | 1 | |
| Time series tools | 4.33 | 3.33 | 3 | 3.67 | 35% | 42% | 1 | |
| Python for official statistics | 3.5 | 3.38 | 2.13 | 3.5 | 20% | 33% | 1 | |
| SAS for official statistics | 4 | 3.86 | 3.71 | 2.57 | 46% | 32% |
| |
| Web Intelligence Hub | 3.67 | 3 | 1.33 | 3.33 | 12% | 29% | 1 | |
| Statistical disclosure tools | 3.67 | 3 | 3 | 3.33 | 26% | 29% | 1 | |
| Shared statistical services | 3.2 | 3 | 2.6 | 3.6 | 20% | 28% | 1 | |
| Remote sensing and satellite imagery software | 3 | 3 | 1.67 | 3 | 12% | 22% | 1 |
Notes: (1) Necessity (2) Proficiency (3) Current usage (4) Future usage (5) Current importance (6) Future importance (7) Sign.
The results of the software and tools factor for official statistics in Table 9 show that the indicators would get close to each other in the future, although SAS and software R are playing the central role now. The adoption of open-source technologies is spreading but there is still significant room for growth [40, 41]. The SAS software has a negative sign, which indicates that experts believe it is going to be less important in the future for producing official statistics. It could be considered for methodology departments of NSOs to use the potential of open-source programming languages more rapidly than the other departments; however, the NSOs are showing interest to switch to R software [42]. From Table 9, we can recommend the inclusion of R software, SAS and opensource technologies [43] in current and future educational plan in official statistics.
Table 10
Current and future importance of Dissemination indicators for official statistics
| Indicators | N | P | C | F |
|
| S | |
|---|---|---|---|---|---|---|---|---|
| Dissemination of | Data Visualisation by recent technologies | 4 | 3.75 | 3.5 | 4.25 | 42% | 51% | 1 |
| official Statistics | Model deployment for end-users | 3 | 3 | 2 | 3 | 14% | 22% | 1 |
| Virtual Reality (VR) for complex visualisations | 2 | 3 | 1.25 | 2.5 | 6% | 12% | 1 |
Source: Author’s preparation. Notes: (1) Necessity (2) Proficiency (3) Current usage (4) Future usage (5) Current importance (6) Future importance (7) Sign.
Data visualisation by recent technologies is recognized as the most important indicator of modern official statistics dissemination (Table 10). Visualisation of a large amount of complex data could facilitate the use of official statistics products as public goods [44].
Table 11
Current and future importance of Literacy indicators for official statistics
| Indicators | N | P | C | F |
|
| S | |
|---|---|---|---|---|---|---|---|---|
| Literacy of | Data Literacy | 4.8 | 4.6 | 2.6 | 4.5 | 46% | 79% | 1 |
| official Statistics | Statistical Literacy | 4.8 | 4.6 | 2.8 | 4.25 | 49% | 75% | 1 |
| Statistical thinking | 4.6 | 4.6 | 2.8 | 4 | 47% | 68% | 1 | |
| Computer Literacy | 3.2 | 3.6 | 1.6 | 3.75 | 15% | 35% | 1 |
Notes: (1) Necessity (2) Proficiency (3) Current usage (4) Future usage (5) Current importance (6) Future importance (7) Sign.
Table 12
Current and future importance of Education and Academy Certificates indicators for official statistics
| Indicators | N | P | C | F |
|
| S | |
|---|---|---|---|---|---|---|---|---|
| Ethics in | Privacy & Confidentiality | 4.5 | 4.25 | 4.5 | 5 | 69% | 77% | 1 |
| Official Statistics | Security | 4.25 | 4.5 | 4.5 | 4.75 | 69% | 73% | 1 |
| Accountability | 4.25 | 4.75 | 3.5 | 3.75 | 57% | 61% | 1 | |
| Racial Equity | 4.25 | 4.25 | 3 | 3.75 | 43% | 54% | 1 | |
| Inclusiveness | 3.5 | 4.25 | 3.5 | 4.25 | 42% | 51% | 1 | |
| Fairness and Fair Data | 3.75 | 3.75 | 4 | 4 | 45% | 45% | 0 | |
| Transparency | 4.25 | 4.25 | 3.5 | 3 | 51% | 43% |
|
Notes: (1) Necessity (2) Proficiency (3) Current usage (4) Future usage (5) Current importance (6) Future importance (7) Sign.
Table 13
Current and future importance of Education and Academy Certificates indicators for official statistics
| Indicators | N | P | C | F |
|
| S | |
|---|---|---|---|---|---|---|---|---|
| Trusted Smart | Machine Learning | 4 | 4 | 2.33 | 5 | 30% | 64% | 1 |
| Official Statistics | New data methodologies for official statistics | 4 | 4 | 2.75 | 4.75 | 35% | 61% | 1 |
| New data quality for official statistics | 3.67 | 3.8 | 2.75 | 4.25 | 31% | 47% | 1 | |
| Trusted Smart Surveys | 2.67 | 3.2 | 1.75 | 4 | 12% | 27% | 1 | |
| Cell phone Applications and Operation Systems | 2.67 | 3 | 1.75 | 4 | 11% | 26% | 1 | |
| Webscraping applications for official statistics | 3 | 3 | 2 | 3.33 | 14% | 24% | 1 | |
| Internet of Things (IoT) | 2.33 | 3 | 2 | 4 | 11% | 22% | 1 |
Notes: (1) Necessity (2) Proficiency (3) Current usage (4) Future usage (5) Current importance (6) Future importance (7) Sign.
Table 11 strongly recommends the data and statistical literacy have been considering for official statistics. The CI and FI of data literacy and statistical literacy show maximum importance among all indicators. As we can see, the importance of 79% is the highest importance rate among all factors, and there is only one indicator with the future importance of 77% in Table 12, namely Privacy & Confidentiality, which is higher than the 75% of statistical literacy. It emphasizes the crucial importance given by experts to data and statistical literacy in the future of official statistics.
Regarding the importance of ethics in official statistics (Table 12), the main conclusion that can be drawn is that respondents believe there will be no significant change in the importance of the key indicators, with CI and FI exhibiting close scores in almost all cases.
Transparency is the only indicator with a negative sign, which indicates a reduction in its importance in future. The explanation for this result may be in the “black-box” nature of many machine learning algorithms.
The fairness indicator is almost in the same situation, an outcome that has already been discussed in Section 2.2.3. As a result, choosing some indicators from the list is not easy, and we have opted to consider them all, summarized in the “ethics in official statistics” term.
The three top items in Table 13 are machine learning, new data methodologies, and new data quality for official statistics, which exhibit significantly higher CI and FI scores when compared to the remaining indicators.
5.Discussion and conclusion
Producing official statistics is a difficult and multifaceted sequence of operations, in which multiple entities participate. It begins with inquiries about the general information needs of several public and private users, and continues with the selection of only a few operations, following multi-year programmes, balancing the needs of larger groups with available resources and priority setting at the national and supra-national level. It involves determining the statistical objects, the corresponding information sources, the design of statistical surveys or the use of administrative data, data collection, processing the data, analysing the results and the quality parameters. It involves the dissemination of pre-defined and on-demand results in various forms, documenting in detail all the stages of the operation. Increasing the quality and timeliness of the statistical production process in a cost-effective way for better decision-making and social good challenges NSOs to adopt data science technologies and methodologies. In addition, producing statistical outputs is no longer an exclusive activity of designated NSOs. Technological innovation capacitated new players (private companies, civil society organisations) to engage in data collection, analysis and dissemination activities Accessing and using big data in official statistics demands a new skill set.
This paper proposes a data science for official statistics research model (DSMOS) to investigate the impact of data science in producing official statistics. The model is a collection of related and structured activities and tasks combining data science, trusted smart statistics and prevailing scientific paradigms and develops around a restricted number of constructs. The model seeks to combine data science and official statistics production in an era of datafication. The most important concepts of data science for official statistics training considered in the paper were extracted from the literature review and experts’ opinions. Work phases of the model are indicated by red colour and stages are in blue in a sequence of (1) Methodology of Official Statistics, (2) Statistical Engineering; (3) Data Analysis; (4) Data Science; (5) Trusted Smart Statistics and (6) Deploying to the NSO’s Platform. The dotted lines delimit specific portions of a given stage. For instance, data science includes data analysis and statistical engineering among others. The model starts with the goal of satisfying national and international end user’s needs and requests, and is supported by items mentioned as support teams and underlines.
The results show that Statistics and data science are expected to play a crucial role in the future of official statistics. The strong link between Statistics and data science suggests that experts working at NSOs are fully aware of the technical assets they have accumulated over time and they are planning to update it with new technologies and methodologies.
The results suggest that the core syllabus (set of competencies and skills) in data science for official statistics should include the following areas:
• Concrete knowledge of Statistics;
• Highfrequency data, spatial data, Big Data, micro data/nano-data;
• Problem-solving strategy;
• Spatio-temporal models and machine learning;
• Software R and SAS;
• Data visualisation by recent technologies;
• Data and statistical literacy;
• Ethics in Official Statistics;
• Machine learning;
• New data methodologies;
• New data quality tools and frameworks for official statistics.
These areas could be included in formal training and capacity building at the university level, expanding the existing collaboration activities with academic partners, or in informal training sessions at training units of NSOs. In most countries there is a long tradition of collaboration between NSOs and universities in developing methodological and technical solutions for concrete problems, in training current and future staff, in research and innovation partnerships funded by targeted grants. Leveraging on these partnerships to cover data science educational gaps seems a natural solution, participating in the design of the competency framework and course contents. In addition, NSOs should establishing and reinforcing the collaboration activities inside the community of official statistics to build new skills and embracing new data science methodologies. Initiatives in that direction have already started and common support is available through, for instance, the activities of the United Nations Global Working Group (GWG) on Big Data for Official Statistics through the UN Global Big Data Platform (UNBigData),66 the Global Partnership for Sustainable Development Data (GPSDD), through capacity building initiatives set up by UNECA, ONS UK, The Federal Statistical Office (FSO) of Switzerland77 and others On top of this, NSOs will need to extend their collaboration activities outside the community of official statistics, particularly with providers of Big Data (e.g., mobile phone companies, banking and insurance companies, Google, Facebook, Amazon).
Our findings suggest that data science has the potential to significantly improve the official statistics process alongside traditional methodologies from Statistics. Moreover, the empirical results highlight the principal factors and indicators in the DSMOS model.
Regardless of all the positive benefits of data science for official statistics, there are some risks involved (e.g., reduced transparency, data protection issues, cybersecurity, data impartiality) that need to be tackled to ensure the society continues to always have access to good statistical information. The massive use of traditional software such as SAS is expected to decrease by increasing the popularity of open-source programming languages such as R software. The study revealed the necessity of concrete knowledge about Statistics for training data science in official statistics. Developing competencies and skills in highfrequency data, spatial data, Big Data, microdata/nano-data is considered to be important for the future of data stewardship in official Statistics, which would support the value-added of new data infrastructures. Increasing the knowledge of new data methodologies and new data quality tools and frameworks is also considered important [45].
For soft skills, empowering problem-solving skills, data and statistical literacy, and all indicators of ethics in official statistics could be considered especially via learning management systems (LMS) for larger audiences. Producing multi-lingual educational videos, simulations of statistical activities, virtual workshops and using the capacity of remote learning could improve the soft skills and statistical literacy of the public, reduce the costs and increase their contribution in producing new official statistics products based on new technologies of training from home (TFH).
Machine learning and data visualisation novel tools have already started to serve official statistics products [46]. However, the future usage of these two concepts is expected to experience a rapid increase. For future study, we remark that the relevance and applicability of the Data Science Model for Official Statistics (DSMOS), expressed in this paper, is mostly limited to the European context, and the ideas gathered in this work might need to be revised and tested in other geographies.
Notes
1 Statistical Disclosure Limitation (SDL).
2 Among the respondents, two experts with more than 15 years of experience in official statistics accepted to answer the complete questionnaire.
3 For instance, we moved the open question related to the model to the last part of the questionnaire.
4 Remarkably, the results do not necessarily represent any official opinion of NSOs.
5 For a discussion of statistical ethics see, e.g., [47].
7 For instance, the FSO recently launched a Data Science Competence Centre which will assist all government departments of Switzerland in these domains.
Acknowledgments
The authors are grateful to the anonymous reviewers for their constructive comments and experts who provided timely and detailed comments on a preliminary version of our model and responded to our questionnaires. Their critical and constructive remarks were precious to improve the final model and valuable to recognize the priorities and future anticipation for the research items of the present paper.
Jorge M. Bravo was supported by Portuguese national science funds through FCT under the project UIDB/04152/2020-Centro de Investigação em Gestão de Informação (MagIC).
References
[1] | Laureti T, Benedetti I, Palumbo L, Rose B. Computation of consumer spatial price indexes over time using Natural Language Processing and web scraping techniques. In: Conference on New Techniques and Technologies for Official Statistics (NTTS) [Internet]. (2021) [cited 2021 May 14]. Available from: https://coms.events/NTTS2021/data/abstracts/en/abstract_0032.html. |
[2] | Ricciato F, Wirthmann A, Giannakouris K, Reis And F, Skaliotis M. Trusted smart statistics: Motivations and principles. In: Statistical Journal of the IAOS. IOS Press; (2019) . pp. 589–603. |
[3] | Clark C, Maron M, Patel D, Radford T, Soden R, Uithol P. Open Mapping for the SDGs? A practical guide to launching and growing open mapping initiatives at the national and local levels. Glob Partnersh Sustain Dev Data [Internet]. (2016) [cited 2021 Jun 19]; 1–71. Available from: https://www.data4sdgs.org/resources/open-mapping-sdgs. |
[4] | Balestra C, Fleischer L. Diversity statistics in the OECD: How do OECD countries collect data on ethnic, racial and indigenous identity? [Internet]. Vol. 2018/09, OECD Statistics. (2018) [cited 2021 Mar 7]. Report No.: 2018/09. Available from: https://www.oecd-ilibrary.org/docserver/89bae654-en.pdf?expires=1615146594&id=id&accname=guest&checksum=F52DB8EB2582320D18CD742CE06C2C0A. |
[5] | Gavin E. How to Collaborate Effectively to Improve Data Quality and Use in Revenue Administration and Official Statistics [Internet]. Vol. 2021, IMF How To Notes. International Monetary Fund; (2021) May [cited 2021 Jun 19]. Available from: https://www.elibrary.imf.org/view/journals/061/2021/005/article-A001-en.xml. |
[6] | OECD. Development Cooperation Report 2017: Data for Development, Organisation for Economic Co-Operation and Development [Internet]. (2017) . Available from: doi: 10.1787/20747721. |
[7] | OECD. Development Co-operation Report 2018: Joining Forces to Leave No One Behind [Internet]. Paris; (2018) . Available from: doi: 10.1787/dcr-2018-en. |
[8] | Šuštar Č, Eremita M. The Integration of Administrative Data for the Identification of the Ownership of Agricultural Land. In: Conference on New Techniques and Technologies for Official Statistics (NTTS) [Internet]. (2021) [cited 2021 May 14]. Available from: https://coms.events/NTTS2021/data/abstracts/en/abstract_0025.html. |
[9] | Stoltze P. An application of BREAL to sensor data. In: Conference on New Techniques and Technologies for Official Statistics (NTTS) [Internet]. (2021) [cited 2021 May 14]. Available from: https://coms.events/NTTS2021/data/abstracts/en/abstract_0036.html. |
[10] | Daas P, Puts M. Towards Big Data methodology: a generic Big Data based statistical process. In: Conference on New Techniques and Technologies for Official Statistics (NTTS) [Internet]. (2021) [cited 2021 May 14]. Available from: https://coms.events/NTTS2021/data/abstracts/en/abstract_0033.html. |
[11] | Regulation (EU) No 99/2013. Scheveningen Memorandum Big Data and Official Statistics [Internet]. (2013) Jan [cited 2021 Mar 6]. Available from: https://ec.europa.eu/eurostat/documents/7330775/7339365/Scheveningen-memorandum-27-09-13/2e730cdc-862f-4f27-bb43-2486c30298b6. |
[12] | Struijs P, Braaksma B, Daas PJH. Official statistics and Big Data [Internet]. Vol. 1, Big Data and Society. SAGE Publications Ltd; (2014) [cited 2021 Jun 19]. Available from: http://www.uk.sagepub.com/aboutus/. |
[13] | Thompson ME. Dynamic data science and official statistics. Can J Stat [Internet]. (2018) Mar 1 [cited 2021 May 7]; 46: (1): 10–23. Available from: doi: 10.1002/cjs.11322. |
[14] | Hoerl RW, Snee RD. Moving the statistics profession forward to the next level. Am Stat [Internet]. (2010) [cited 2021 Apr 1]; 64: (1): 10–4. Available from: doi: 10.1198/tast.2010.09240. |
[15] | Steiner S, Mackay J. Statistical Engineering: An Algorithm for Reducing Variation in Manufacturing Processes: Steiner, Stefan H., Mackay, R. Jock: 9780873896467: Amazon.com: Books. (2005) . 1–360. |
[16] | Hoerl RW, Snee RD. Statistical engineering: an idea whose time has come? Am Stat [Internet]. (2017) Jul 3 [cited 2021 Apr 1]; 71: (3): 209–19. Available from: doi: 10.1080/00031305.2016.1247015. |
[17] | Ricciato F, Wirthmann A, Hahn M. Trusted Smart Statistics: How new data will change official statistics. Data Policy [Internet]. (2020) [cited 2021 Apr 1]; 2. Available from: https://www.cambridge.org/core. |
[18] | Aguilera EA, Di Meglio E. Social indicators’ update and modernization: the case of low work intensity. In 2021 [cited 2021 May 14]. Available from: https://coms.events/NTTS2021/data/abstracts/en/abstract_0023.html. |
[19] | Brenzel H, Muehlhan J. MikroSim – Developing a Microsimulation Data Center. In: Conference on New Techniques and Technologies for Official Statistics (NTTS) [Internet]. (2021) [cited 2021 May 14]. Available from: https://coms.events/NTTS2021/data/abstracts/en/abstract_0012.html. |
[20] | Cotton F, Rouppert B, Bruno M. Implementing shared statistical services. In: NTTS-2021 [Internet]. (2021) [cited 2021 Apr 1]. Available from: https://coms.events/NTTS2021/data/abstracts/en/abstract_0052.html. |
[21] | Ashofteh A, Bravo JM. A study on the quality of novel coronavirus (COVID-19) official datasets. Stat J IAOS [Internet]. (2020) Jan 1 [cited 2021 Mar 29]; 36: (2): 291–301. doi: 10.3233/SJI-200674. Available from: www.officialstatistics.com. |
[22] | Fu H, Hereward M, Macfeely S, Me A, Wilmoth J. How COVID-19 is changing the world: a statistical perspective from the committee for the coordination of statistical activities. Stat J IAOS [Internet]. (2020) Jan 1 [cited 2021 Jun 12]; 36: (4): 851–60. Available from: https://unstats.un.org/unsd/ccsa/docum. |
[23] | Di Gennaro L. Unprecedented situation, unprecedented official data and unprecedented quality of official data. In: Conference on New Techniques and Technologies for Official Statistics (NTTS) [Internet]. (2021) [cited 2021 May 15]. Available from: https://coms.events/NTTS2021/data/abstracts/en/abstract_0096.html. |
[24] | ESS Vision 2020 ADMIN. Administrative data sources [Internet]. [cited 2021 Mar 6]. Available from: https://ec.europa.eu/eurostat/cros/content/ess-vision-2020-admin-administrative-data-sources_en. |
[25] | Seltzer W. Official Statistics and Statistical Ethics: Selected Issues. (2005) [cited 2021 Mar 7]; 55th Session. Available from: https://www.stat.auckland.ac.nz/∼iase/publications/13/Seltzer.pdf. |
[26] | Collins S, Genova F, Harrower N, Hodson S, Jones S, Laaksonen L, et al. Turning FAIR into reality: Final report and action plan from the European Commission expert group on FAIR data [Internet]. (2018) [cited 2021 May 14]. Available from: https://op.europa.eu/en/publication-detail/-/publication/7769a148-f1f6-11e8-9982-01aa75ed71a1/language-en/format-PDF. |
[27] | Schwabish J, Feng A. Applying Racial Equity Awareness in Data Visualization. In: NTTS2021 [Internet]. Eurostat; (2021) [cited 2021 Mar 7]. Available from: https://coms.events/NTTS2021/data/abstracts/en/abstract_0001.html. |
[28] | Microsoft. Responsible AI. Microsoft AI principles [Internet]. (2021) [cited 2021 Jun 12]. Available from: https://www.microsoft.com/en-us/ai/responsible-ai?activetab=pivot1:primaryr6. |
[29] | Ruppert E, Grommé F, Ustek-Spilda F, Cakici B. Citizen data and trust in official statistics. Econ Stat. (2018) ; 2018: (505–506): 179–93. |
[30] | Ashofteh A, Bravo JM. A conservative approach for online credit scoring. Expert Syst Appl. (2021) Aug 15; 176: : 114835. |
[31] | Lundberg S, Lee S-I. A Unified Approach to Interpreting Model Predictions. Adv Neural Inf Process Syst [Internet]. (2017) May 22 [cited 2021 Jun 12]; 2017-December: 4766–75. Available from: http://arxiv.org/abs/1705.07874. |
[32] | Ribeiro MT, Singh S, Guestrin C. “Why should i trust you?” Explaining the predictions of any classifier. In: Proceedings of the ACM SIGKDD International Conference on Knowledge Discovery and Data Mining. Association for Computing Machinery; (2016) . pp. 1135–44. |
[33] | European Community (EC). Directive 95/46/EC of the European Parliament and of the Council of 24 October 1995 on the protection of individuals with regard to the processing of personal data and on the free movement of such data [Internet]. Guidance document. (1955) [cited 2021 Jun 12]. Available from: http://eur-lex.europa.eu/LexUriServ/LexUriServ.do?uri=CELEX%3A31995L0046%3Aen%3AHTML. |
[34] | Karlberg M, Czumaj E, de Heer HJ, Moraleda AG, Hagenkort-Rieger S, Martins JP, et al. DIGICOM – an unprecedented collaboration on the dissemination and communication of European statistics. In: Conference on New Techniques and Technologies for Official Statistics (NTTS) [Internet]. (2021) [cited 2021 May 14]. Available from: https://coms.events/NTTS2021/data/abstracts/en/abstract_0092.html. |
[35] | Leuenberger M, Milani G, Facchinetti C. ADELE: Overview of a deep learning application for land use and land cover change detection and classification in Switzerland. In: Conference on New Techniques and Technologies for Official Statistics (NTTS) [Internet]. (2021) [cited 2021 May 14]. Available from: https://coms.events/NTTS2021/data/abstracts/en/abstract_0091.html. |
[36] | Karlberg M. Piloting Virtual Reality for Official Statistics [Internet]. [cited 2021 Mar 8]. Available from: https://coms.events/NTTS2021/data/x_abstracts/x_abstract_20.pdf. |
[37] | Olshannikova E, Ometov A, Koucheryavy Y, Olsson T. Visualizing big data with augmented and virtual reality: challenges and research agenda. J Big Data [Internet]. (2015) Dec 1 [cited 2021 Mar 8]; 2: (1): 22. Available from: http://www.journalofbigdata.com/content/2/1/22. |
[38] | Ninka E, Pasanen J. An inventory of innovative tools and sources for smart Time Use and Household Budget Surveys. In: Conference on New Techniques and Technologies for Official Statistics (NTTS) [Internet]. (2021) [cited 2021 May 14]. Available from: https://coms.events/NTTS2021/data/abstracts/en/abstract_0027.html. |
[39] | Amarone M, Di Torrice M. Developing software for web scraping: the Italian experience on portals offering tourist accommodation. In: Conference on New Techniques and Technologies for Official Statistics (NTTS) [Internet]. (2021) [cited 2021 May 14]. Available from: https://coms.events/NTTS2021/data/abstracts/en/abstract_0090.html. |
[40] | Kowarik A, de Cillia G, Meraner A, Fröhlich M. Persephone, Production-Ready Seasonal Adjustment in R with RJDemetra. In: Conference on New Techniques and Technologies for Official Statistics (NTTS) [Internet]. (2021) [cited 2021 May 14]. Available from: https://coms.events/NTTS2021/data/abstracts/en/abstract_0062.html. |
[41] | Smyk A. New R tools for JDemetra+ software: Seasonal adjustment made easier. In: Conference on New Techniques and Technologies for Official Statistics (NTTS) [Internet]. (2021) [cited 2021 May 14]. Available from: https://coms.events/NTTS2021/data/abstracts/en/abstract_0066.html. |
[42] | Calian V, Zuppardo M. Correcting for population overestimates by using statistical classification methods. In: Conference on New Techniques and Technologies for Official Statistics (NTTS) [Internet]. (2021) [cited 2021 May 14]. Available from: https://coms.events/NTTS2021/data/abstracts/en/abstract_0069.html. |
[43] | Ricciato F, Stocchi M, Bach F, Kloek W, Aleksandra B. An open-source tool for experimenting with noise-based perturbation schemes. In: Conference on New Techniques and Technologies for Official Statistics (NTTS) [Internet]. (2021) [cited 2021 May 14]. Available from: https://coms.events/NTTS2021/data/abstracts/en/abstract_0014.html. |
[44] | Brandmuller T, Corselli-Nordblad L, Oennerfors A. Bee swarms, barcodes and bubbles – what do they have in common? Visual data narratives on regional development. In: Conference on New Techniques and Technologies for Official Statistics (NTTS) [Internet]. (2021) [cited 2021 May 14]. Available from: https://coms.events/NTTS2021/data/abstracts/en/abstract_0011.html. |
[45] | Ashofteh A, Bravo JM. A non-parametric-based computationally efficient approach for credit scoring. In: Atas da Conferencia da Associacao Portuguesa de Sistemas de Informacao [Internet]. Associacao Portuguesa de Sistemas de Informacao; (2019) [cited 2021 Mar 29]. Available from: https://www.scopus.com/record/display.uri?eid=2-s2.0-85086641145&origininward&txGid=0e87a8c228db37a09073b1441dfffe9e. |
[46] | Zaccardi J, Infante E. A systematic approach for data validation using data driven visualisations and interactive reporting. In: Conference on New Techniques and Technologies for Official Statistics (NTTS) [Internet]. (2021) [cited 2021 May 14]. Available from: https://coms.events/NTTS2021/data/abstracts/en/abstract_0100.html. |
[47] | Rosenski N, Köhlmann M. Towards the Use of Smart Systems Data for Official Statistics. In: Conference on New Techniques and Technologies for Official Statistics (NTTS) [Internet]. (2021) [cited 2021 May 14]. Available from: https://coms.events/NTTS2021/data/abstracts/en/abstract_0037.html. |


