
Well-being in urban and rural areas, challenges, general policies, and their monitoring: Some evidence for Germany before and during the COVID-19 pandemic1
Abstract
Major changes in society, the economy, the natural environment and the government haven taken place. The current pandemic demonstrates even more their social importance and positive or negative effects worldwide. In particular, an increasingly cross-generational awareness of sustainability, new information and communication channels and growing international interdependencies as well as comprehensive policies fostering well-being are gaining worldwide importance and pervade all activities. Germany has – as many nations worldwide – besides its national strategies committed to implement major strategies at United Nations’ and European Union’s levels. In the following, it will be examined which differences exist in the living conditions from a spatial point of view. Using selected indicators and current data mainly from the Federal Statistical Office of Germany, an urban-rural comparison is made for Germany at the lowest federal level ‘Kreise’ (NUTS 3 of the European spatial classification). Even if it is still unclear what the long-term consequences of the drastic measures of the current global COVID-19 pandemic will be, current trends will be briefly presented. Furthermore, this study presents the latest data mainly before the worldwide outbreak of the pandemic and thus will offer starting points for later analysis of opportunities and risks for urban or rural areas post COVID-19.
1.Introduction
All people strive for a good life or well-being as the Greek philosopher Plato already stated in his talks Politaia more than 2000 years ago [1, p. 343]. Though, this is fundamental for politics in general respectively all governmental activities at national and international level. Thus, the major aim of politics is to foster well-being in its various dimensions. Even more, well-being has found its way into basic legal acts, especially constitutions, under different terms such as welfare, equality of living conditions or well-being. For example, in the Constitution of 1788 for the United States is declared: ‘We the people of the United States … promote the general Welfare …’ [2]. Article 2, paragraph 2 of the Swiss Constitution says ‘It (the Swiss Confederation, author’s insertion) … shall promote the common welfare … of the country’ [3]. In the Basic Law of the Federal Republic of Germany, Article 72, paragraph 2 aims at ‘… establishing equal living conditions within the Federal territory …’ [4]. Article 3 (1) of the Lisbon Treaty for the European Union stipulates: ‘The Union’s aim is to promote peace, its values and the well-being of its peoples’ [5]. In the following well-being should be used in accordance with its widespread usage in every-day language.
Since the turn of the millennium, comprehensive political strategies for improving the living conditions of the population have gained importance worldwide. The spatial dimension is increasingly considered. But the spatial disparities, i.e. the dichotomy between urban and rural areas pose particular challenges for politics. Even though urban and rural areas can be distinguished in several ways, in general the population density, i.e. the number of inhabitants per km
While urban areas in general are densely populated – in rural areas the population density is much lower. That means on the one hand that the population in urban areas is much more heterogenous as regards to its demographic, economic and educational characteristics – to mention only the most important ones – than in rural areas. On the other hand, urban areas have to fulfil much more functions than rural ones for instance offering workplaces, shopping opportunities, education facilities and the promotion of culture – as explained in more detail in part 3. In rural areas the offerings are often much smaller and predominantly concentrated on housing in a pleasant natural environment. For working, shopping and enjoying cultural events instead, people often have to leave their hometown and drive to another place.
Thus, the major aim of politicians and people responsible for political measures at municipal level in urban areas is to balance the interests of their inhabitants, in particular to provide sufficient and affordable housing in a safe and clean environment with enjoyable recreational facilities. For a peace- and respectful coexistence a good mixture is a real challenge in urban development. In rural areas instead inhabitants are mostly interested in minimizing their transaction activities and cost related to work, education etc. Hence, politicians responsible for the development of rural areas have to look for a sufficient infrastructure including the institutions serving the basic needs of families, elderly and ill people such as kindergartens, schools, hospitals etc. with respect to future developments. For identifying deficits a broad spectrum of research methods exists. Very common is the construction and implementation of indicators – as mentioned in part 2 – both for planning and measuring progress over time.
Even if Germany is predominantly rurally structured – as many other countries – almost 70 out of a total of 401 districts (‘Kreise’) had more than 100,000 inhabitants. These are German bigger and big cities meaning the district comprises only the official urban area, i.e. there are no surrounding areas included apart from two exemptions: the Hanover region (including Hanover, the capital of Lower Saxony with more than 530 000 inhabitants) and the region of the city of Aachen, a city with about 248,000 inhabitants on December 31, 2019 [9]. The remaining 39 smaller independent cities count a total of another 2.3 million inhabitants or 2.7% of the total population. This means that nearly a third (32.3%) of Germany’s population lives in bigger cities covering an area of 15 657 km
The aim of this article is to show whether and to what extent the theoretically postulated differences in urban and rural living conditions can be observed for Germany, too in having a look at the bigger independent cities on the one hand representing the more urban regions of Germany and the districts out of which most are more or less rural on the other hand. There are several political strategies which are important for the German Federal Government fostering overall living conditions at national, European and international level; they are also increasingly being used at subnational level, i.e. the federal states and municipalities. The currently outstanding strategies are briefly presented in the second part. The indicators recommended for their monitoring are of particular importance, especially those with regards to the spatial dimension. What matters most when measuring regional disparities is briefly explained in the third part. In the fourth part, some examples for Germany with selected indicators predominantly from Official Statistics, i.e. the Federal Statistical Office of Germany in collaboration with the Laender Offices, are presented. A brief outlook is given in the fifth part.
2.Political strategies for improving overall living conditions
For Germany the following strategies pursuing overall sustainability respectively well-being are relevant. Worldwide first and foremost there is United Nations ‘2030 Agenda for Sustainable Development’ adopted by the General Assembly of the United Nations (UN) in 2015 for the period 2016–2030 [10]. It is directly or indirectly determining all other strategies at European and national levels that have been agreed previously (see Fig. 1). The aim of the strategy is comprehensive and sustainable development in a globalized world, including the regional and local dimension [11, p. 11]. For its monitoring a total of 17 goals and 169 subgoals (targets) developed in parallel by a group of official statisticians worldwide play an important role for measuring progress regularly. Finally, a total of 232 indicators were defined [12] as well as supported at the subnational level [13], regardless of criticism of their large number [14].
Figure 1.
Comprehensive policies fostering well-being.
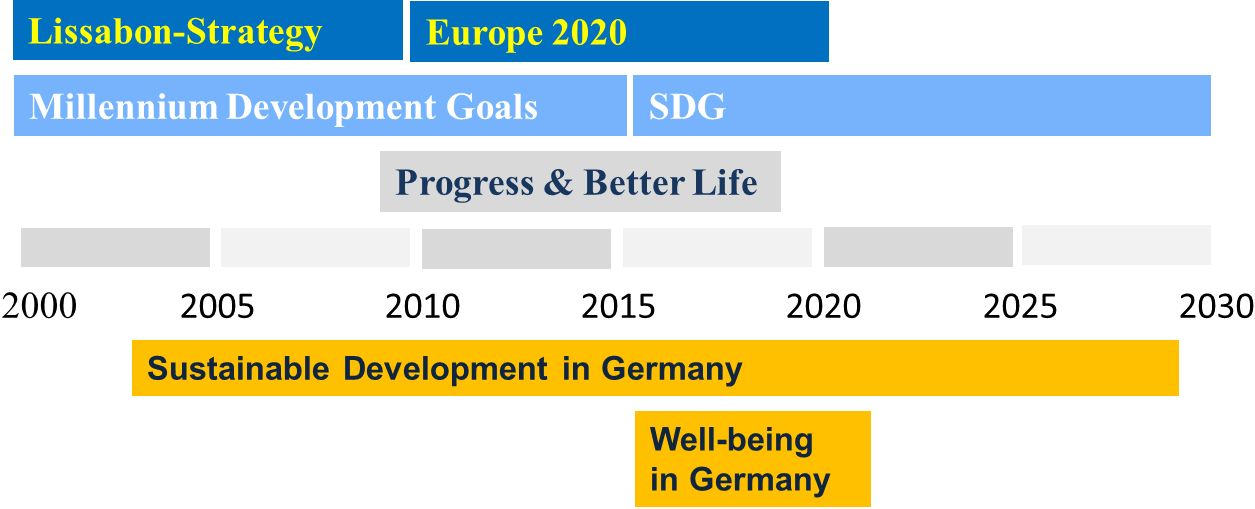
Currently there are four different strategies that are relevant for Germany. Firstly, there is the strategy ‘Sustainable Development in Germany’. It was adopted by the Federal Government in 2004 with originally four pillars and a total of 38 indicators [15]. In 2016 it has been modified according to the 17 UN goals and consists now of 62 indicators. It is marked as ‘new edition’ representing the linkage between the long tradition and the SDGs worldwide [16].
The 16 Federal States of Germany, some of which had already pursued their own sustainability strategies, have also adapted them to the SDGs. The website of the Federal Statistical Office of Germany [17] gives an overview of sustainability strategies at Laender levels. Numerous mayors of big German cities have also agreed to implement this strategy, as explained in more detail on the ‘Positions on Sustainability’ website [18]. Furthermore, there is an interactive SDG dashboard referring to the SDG for all municipalities in Germany with more than 5,000 inhabitants on the Internet [19].
The German strategy ‘Living well’ has a different focus and is directly based on the people’s perceptions of a good life that have been discussed in various talks directly with all ministers of the German Federal Government including the chancellor [20]. This strategy consists of three dimensions – our lives, our surroundings, our country. The dimensions and objectives were directly derived from the answers citizens gave in meetings from April to September 2015 when asked (1) What is important to you personally in your life? (2) What do you think constitutes quality of life in Germany?
Accordingly, objectives have been defined and policies discussed and to some extent implemented for aiming at a good life. While the first dimension refers directly to a human being’s individual well-being such as health, his or her working conditions, skills and income etc., the second dimension ‘Our surroundings’ is more or less related to the interactions with other people such as neighbourhood, safety and security, the specialties of living in urban and rural areas etc. In the third dimension ‘Our country’ more general and important aspects even with regard to future generations are addressed. In particular, the economy, the natural environment, freedom and equality before law and global responsibility are explicitly named. For achieving and monitoring the 12 objectives independent experts proposed and discussed the pros and cons of possible indicators to find a limited set of the most appropriate ones for measuring each objective. For the dimensions with the twelve objectives which are monitored regularly by 46 indicators see the Tables 1 and 2 [21]. Despite all the differences to the modified German sustainability strategy, there are some similarities regarding the objectives and the monitoring.
Table 1
Structural elements of comprehensive political strategies for better living conditions
| Organisation | United Nations | Germany | European Union | OECD |
|---|---|---|---|---|
| 2030 Agenda for sustainable development | Living well – What is important to us | Europe 2020 | How’s life? – Measuring progress | |
| Determination | Politically determined | Based on dialogues with citizens | Politically determined | Scientifically based |
| Duration | 2016–2030 | Since 2016 | 2010–2020 | Since 2011 |
| Structure | 17 goals and 169 targets | 3 domains, 12 dimensions | 3 priorities, 5 goals | 3 domains, 11 dimensions |
| Indicators for monitoring | 232 | 46 | 8 | 49 |
| Dimensions | Goals 1–5 No poverty, zero hunger, good health and well-being, quality education, gender equality Goals 6–7 Clean water and sanitation, affordable and clean energy Goals 8–12 Decent work and economic growth, industry, innova- tion and infrastructure, re- duced inequalities, sustainable cities and communities, reponsible consumption and production Goals 13–15 Climate action, life below water, life on land Goals 16–17 Peace, justice and strong institutions, partnerships for the goals | 1. Our liveshealthy life, good work,equal education time for family and work, secure income2. Our surroundingslife in security and freedom at home in urban and rural areas, standing together 3. Our countryeconomy and investment, nature and environment, freedom and equality before law, global responsibility and peace | Smart, sustainable and inclusive growth1. 75% of the populatlion aged 20–64 in employment 2. 3% of EU’s GDP for re- search & development 3. Greenhouse gas emissions to be reduced by 20% compared with 2020, increase of renewable energy sources in final consumption to 20%, improvement of energy efficiency by 20% 4. Early schoolleavers | 1. Material living condi- tionsincome and earnings, employment and wage, housing 2. Quality of lifehealth, work-life balance,education and skills,social connections, civic engagement and gover-nance, environmental quality, personal security subjective, well-being 3. Ressources for future well-being natural capital, human capital, economic capital, social capital |
For the European Union holistic strategies aiming at sustainable development have also a long tradition. In particular, the so-called Lisbon Strategy for the first decade of the 21st century was modified after its expiry and has been continued since 2010 named ‘Europe 2020’ [22]. This strategy contains five objectives for smart, sustainable and inclusive growth: employment, research and development, climate protection, education and poverty reduction which are linked to five EU headline targets. These have so far been reviewed annually based on eight so called headline indicators for which as well the current national targets for EU 27 (before Brexit) can be retrieved from the internet; for the latest data see for instance [23].
In addition, a comprehensive review is carried out at European level subnationally every seven years. The so-called Cohesion Reports – currently the 7th Cohesion Report – provide an overview over the effectiveness of European funding policies, particularly in the context of the European Cohesion and Structural Funds [24]. There, many results for various indicators for the regions of the European Union including ‘Europe 2020’, mainly at NUTS2 level are shown; for Germany NUTS2 presents the administrative districts and statistical regions in accordance with the respective legal acts [6, 8].
Even though a continuation of that strategy in a modified manner was aimed at (European Commission [25], with an adaptation to the SDG [26] and to the global climate protection agreement COP21 [27], there are no concrete indications yet for updating it [28, chapter 2]. In addition, the EU also provides evaluations for the SDGs [29].
And finally, the OECD, the Organization for Economic Cooperation and Development an institution with predominantly advanced industrialised nations, pursues its own scientifically based approach. This approach is essentially based on the findings of the Stiglitz-Sen-Fitoussi Commission, named after the last names of its members. In their report, they presented a description of all important determinants of well-being at a time when the European Community was going through the most severe financial economic crisis since its foundation [30]. However, it became clear that despite numerous other factors influencing well-being, it is essential to take the economic situation, in particular economic growth and employment into account. For this approach, the OECD so far releases regularly every two years reports on ‘How’s Life? Measuring Well-being’, the first one in 2011 and the last one in 2020 [31, 32]. The approach consists of three areas and eleven dimensions with a total of 49 indicators for monitoring. An extension to the sub-national regional level is described for the OECD countries and previously for Germany [33, 34]. Furthermore, the OECD offers an interactive tool on the internet called ‘Better Life Index’ which allows individual weightings of the determinants of well-being as well as for comparison purposes at subnational level for 402 regions [35]. For Germany, the regional units are based on aggregations of NUTS3, i.e. districts or ‘Kreise’ in German. Additionally, the OECD supports the SDG through various measures, for instance webinars for cities and regions [36].
Table 1 gives an overview over the structure of these different strategies to improve people’s well-being. Table 2 shows to what extent attention is paid to the regional dimension predominantly in terms of statistical indicators. There are a lot of similarities especially regarding the indicators and the data sources: As far as
Table 2
Indicators for regional monitoring (selection)
| Organisation | United Nations | Germany | European Union | OECD |
|---|---|---|---|---|
| 2030 Agenda for sustainable development | Living well – What is important to us | Europe 2020 – 7th cohesion report | How’s life? – Measuring progress | |
| Indicators refering to subnational levels | Yes, see a selection of place based indicators1.1. 1 Proportion of population below the international poverty line, 2.5.2 Proportion of local breeds, 3.6.1 Death rate due to road traffic injuries, 5.2.2 Proportion of women … subjected to sexual violence … by place of occurence, 5.4.1 Proportion of time spent on unpaid domestic and care work by sex, age and location, 6.b.1 Proportion of local administrative units with established policies … in water sanitation management, 9.1.1 Proportion of the rural population who live within 2 km of an all-season road, 11.4.1 Total expenditure (public and private) p.c. spent on preservation … of all cultural and natural heritage … by level of government, 11.6.1 Proportion of urban solid waste … by cities, 11.7.2 Proportion of persons victim of physical harassment … by place of occurence, 11.a.1 Proportion of population living in cities by size of cities, 16.1.4 Proportion of population that feel safe walking around the area they live,17.19.2 Proportion of countries that (a) have conducted at least one population and housing census in the last 10 years, …. | Yes, see interactive Government Report on Wellbeing in Germany
| Yes, see 7th Cohesion Report of the European Commission, here a selection out of 56 maps for each chapter:
| Yes, see How’s Life in your region? OECD, 2014
|
| Composite Indeces and other indices | Yes, indices are used for some goals and targets, for instance 2.a.1 Agriculture Orientation Index, 2.c.1 Indicator of food price anomalies, 12.3.1 Global food loss index, 14.1.1 Index of Coastal eutrophication, 15.4.2 Mountain Green Cover Index, 15.5.1 Red List Index. | No | Yes, see 7th Cohesion Report, for instance
| Yes, see Better Life Index. |
possible, data from Official Statistics should be used, especially because of their objectivity and neutrality, scientific foundation and quality and their comparability with the rest of the world. For assuring these general principles at international, European and national level standards exist such as the United Nations’ Fundamental Principles, the European Union’s Statistics Code of Practice and the German Federal Statistics Act ‘Bundesstatistikgesetz’ [37, 38, 39]. Most of the standards can be assured more or less easily and can be seen as a necessary precondition for releasing statistical data of the quality in its several dimensions that is needed for the purpose to be used for which can vary. If statistical data are used just for information the quality requirements can be less stringent than for decision making because of the higher risk of misallocation of time, money and resources in the latter. Without going into further details it should be only mentioned here that a major part of the discussions how to monitor specific political strategies by indicators was dedicated to the statistical indicators and how they can reflect best the goals and targets politically aimed at.
3.Regional particularities of urban and rural areas
Well-being is closely connected to human beings as earlier mentioned. Academia and researchers are interested in finding out what is does mean to people and societies. In modern times the reflections and findings by Adam Smith in 1776 [40, Book 3] Abraham Maslow 1943 [41, p. 372] or Daniel Kahnemann in the late 1990s [42, pp. 117–138] to name only some very prominent ones, are basic. The increasing impact of well-being globally triggered substantial discussions about the meaning of well-being individually, societally and globally. The major aspects should be briefly outlined as follows.
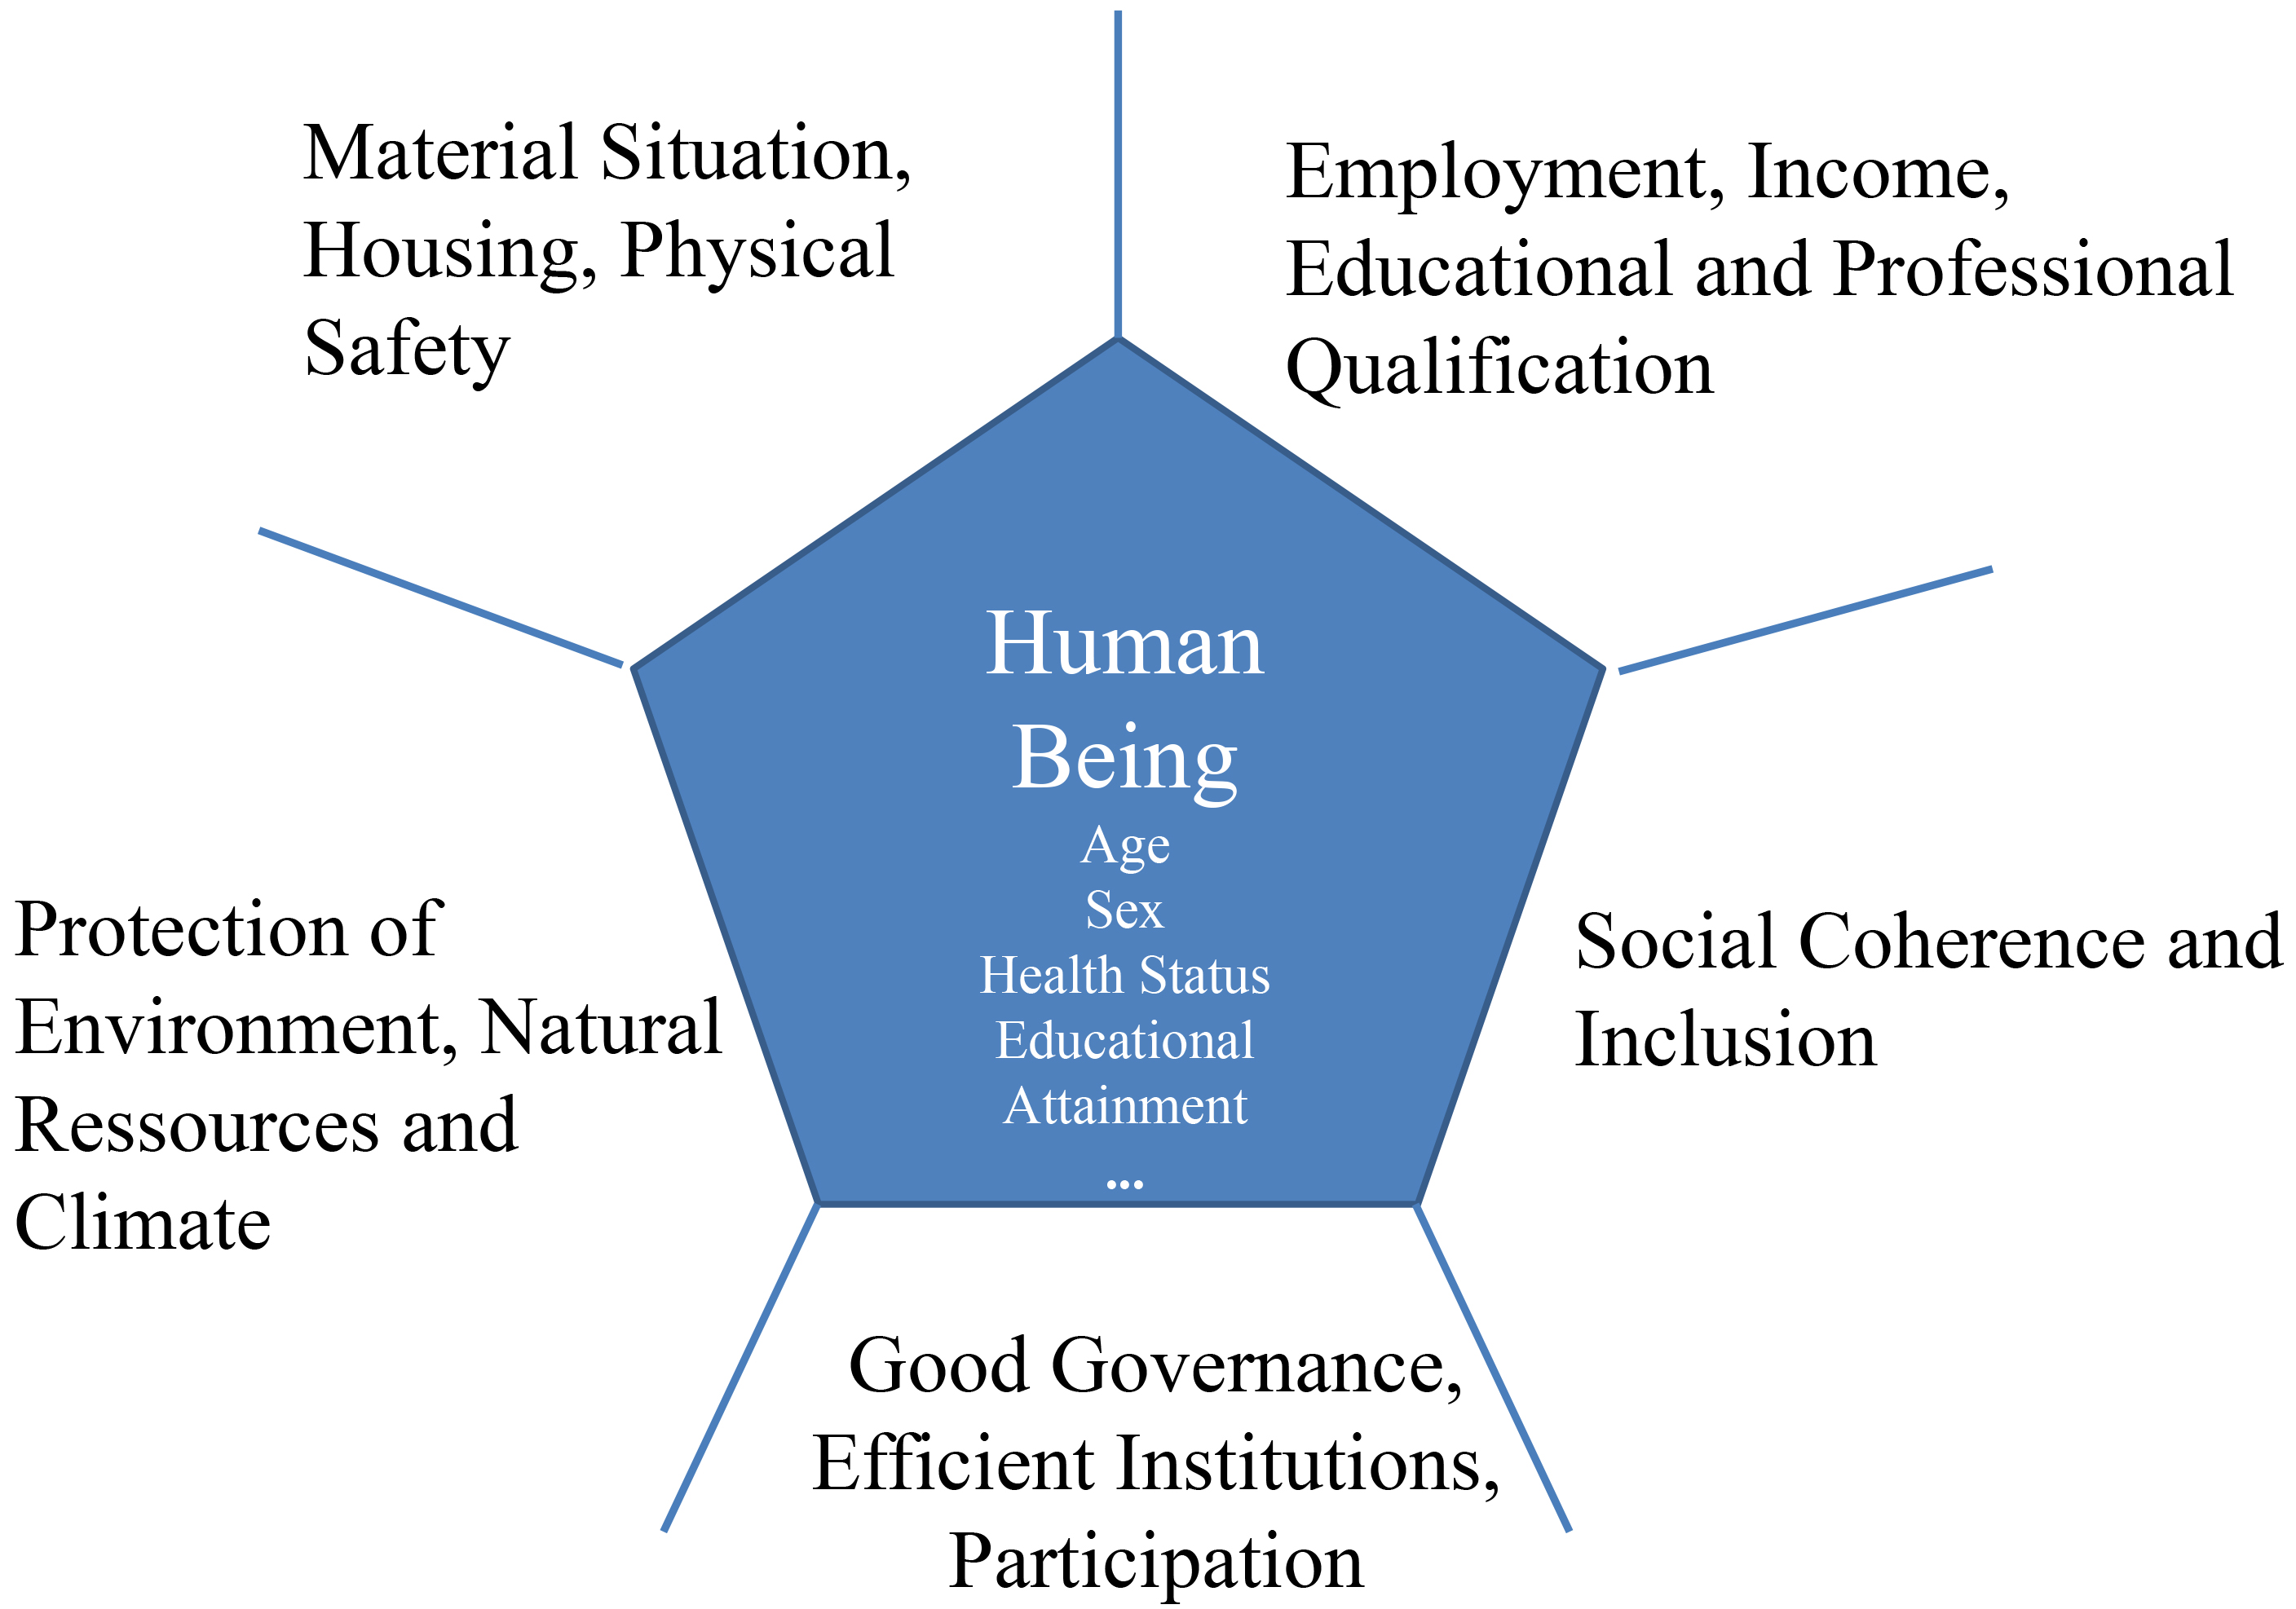
In summary (see Fig. 2), a person’s basic needs for a good life require sufficient food, safe housing and the integrity of body and property.
In addition, there are factors such as education. Schooling and vocational training are important preconditions for qualified employment and thus sufficient earnings. In social terms, cohesion, inclusion and integration are important for people’s well-being, too. A high-quality environment, especially with respect to air, water, noise, the protection of natural resources of all kinds with appropriate habitats for people, animals and plants and a pleasant climate are as well determinants of well-being not only for the present living generation but even more for future generations. And, as more recent studies such as those by Acemoglu and Robinson or McAfee show, good governance, a reliable legal system, effective public administrations, and appropriate participation of citizens in political processes also contribute to people’s well-being [43, 44, chapter 9].
Figure 2.
Dimensions of well-being.
These individual aspects are outstanding determinants of well-being. How important they are, can be observed during the current pandemic, in particular the serious measures and discussions helping to overcome the crisis.
Even if there is some common understanding with respect to the various facets of well-being, it should be borne in mind that individual preferences are partly spatially determined. And they are always based on subjective evaluation. Additionally, they do not have to be stable over time nor do they have to correspond to objective i.e. fact based, conditions. For political planning and decision making, especially for the improvement of living conditions, it is important that the real situation is in accordance with its individual assessment.
While in the past well-being of people left behind in some or other way mattered most, the current pandemic shows that in times of a severe crisis any citizen can be affected. Even if the same aspects are important at the macro level, i.e. at the level of society as a whole, as at the micro level, there may be differences in appreciation at the regional and local level. Particularly in an urban-rural comparison, there are various aspects of well-being that are valued differently by the population living or working there.
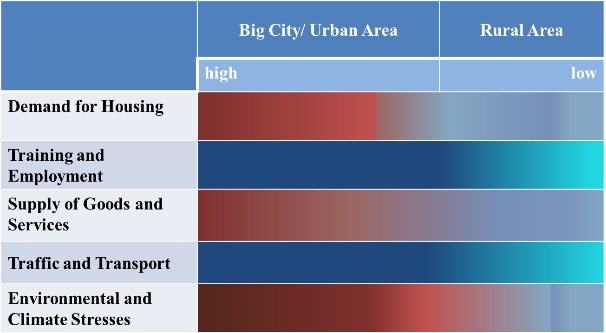
Summing-up, in science and practice the following aspects are of special interest [33, 45]. Big cities or urban regions are often characterised by a big number of people living, working, or spending their leisure time side by side in densely populated areas. Big cities are particularly valued for their broad range of job offers for several qualifications, working hours and earnings. There are also various possibilities for education and training, which are particularly important for young people. The wide range of goods and services in the broadest sense, including health care and public administration, makes a big city an attractive place to live and work. And finally, there is often a wide range of cultural and sporting facilities and events attracting day trippers and tourists from far and near, too.
Due to the high population density in big cities and their attractiveness for other people to live there, adequate and affordable housing is usually scarce and expensive. In addition, the high volume of traffic caused by both individual and commercial traffic in big cities often leads to congestion and traffic jams. According to a press release by the traffic information provider INRIX, in 2019 motorists in large German cities spent an above-average number of hours in traffic jams [46]. For the city of Munich, which is at the top of this study, they reported 87 hours per year, almost double the national average of 45 hours. Berlin and Duesseldorf followed in second and third place with 66 and 50 hours of congestion. The high volume of traffic as well as the energy consumption for heating and cooling of apartments and offices with traditional energy sources generate negative externalities in the form of environmental degradation including air and noise pollution, accidents and congestion. In addition, the microclimate can further intensify the natural climatic conditions, especially in summer, through high rises or other sealing of open spaces, as shown, for example, by the Climate Plan Atlas for the city of Frankfurt/Main [47].
In contrast, rural areas offer a higher quality of life in terms of housing and the natural environment. There are more spacious dwellings available, often with larger open spaces and at a lower price. The quality of the natural environment as well as the microclimatic conditions and thus the recreational opportunities in the open countryside are usually better than in a big city. However, the supply of jobs in rural areas is often limited in numbers and qualifications and earnings. Furthermore, the supply of goods and services is often focused on meeting basic needs. Despite these benefits rural areas offer, participation in cultural or sporting events, as well as many other activities, going for work or shopping, or benefitting from services and leisure time activities, require a certain degree of mobility. Time and money needed are often substantially higher for people living in rural areas.
In general, the above mentioned advantages of big cities or urban regions can be seen as disadvantages of rural areas or vice versa, as shown in Fig. 3.
Figure 3.
Regional aspects of well-being for urban and rural areas.
Whether and to what extent the increasing digitisation in all areas of political, economic and social life contributes to an improvement and thus more balanced relationship between urban and rural areas has been discussed since the beginning of the internet. New business models, new priorities and greater flexibility in working conditions allow a certain separation of time and place. Especially the drastic measures to combat the COVID-19 pandemic have triggered a digitalisation push at least in Germany and led to a rapid and fundamental change in almost all areas of life. To what extent the lockdowns in Germany in spring and autumn/winter 2020 and the first quarter of 2021, with their far-reaching shutdowns of all kinds of plants and institutions and their obligation for finally everyone of carrying out – as far as possible – all activities from home and reducing social contacts to a minimum, will lead to changing preferences and thus to changes in spatial behaviour in the long term, is currently hardly to say.
4.Selected examples
The aspects mentioned above are examined in more detail using as far as possible the latest data available. These indicators are in line or similar to those recommended for monitoring policies for improving overall well-being as shown in Table 2.
In order to differentiate between urban and rural areas ‘Kreise’, i.e. the smallest administrative regional units according to NUTS3 of European Union’s regional typology were chosen. The maps optionally show the borders of each Federal State, the name of the Federal State in bold for the maps retrieved from the Regional Atlas – a joint interactive publication online provided by the Federal Statistical Office of Germany (‘Destatis’) and the Statistical Offices of the Laender – and the name of its capital, which is often its biggest or at least second biggest city [48]. Different time references seem to be acceptable, as the indicators should illustrate structural changes that are often only observable over a longer period. The maps and figures refer to the latest data before the pandemic for presenting the situation in Germany in terms of statistical indicators just before the worldwide crisis hit Germany early in 2020. For more thorough analyses of the developments over time the use of time series is recommended. For all the indicator systems in part 2 this is done officially on a regular mainly yearly basis in particular for assessing the effects of political measures for improving citizen’s well-being. For gaining some impression what has happened at first glance the developments over time can be shown in a visual manner using for instance maps or bar charts.
In general, for more detailed analyses time series with tables and figures are the best way to track developments. They are also needed in an up-todate, reliable and comparable manner in particular when a closer look into the effects caused by the pandemic is aimed at later on. This type of analysis is currently too difficult and goes beyond the aim of this article. Even though it is not yet clear what changes the current pandemic will bring about in the long term, an attempt is being made to refer to current trends by statistical data mainly mentioned in the text as far as they are still obvious.
• Population and economic growth
First, some information on the spatial distribution of population and economic growth is given: The population density, i.e. the number of inhabitants per km
Figure 4.
a. Population density in 2019. b. GDP per capita in 2017. c. Peak of new COVID-19 infections in Germany on December 23rd, 2020.
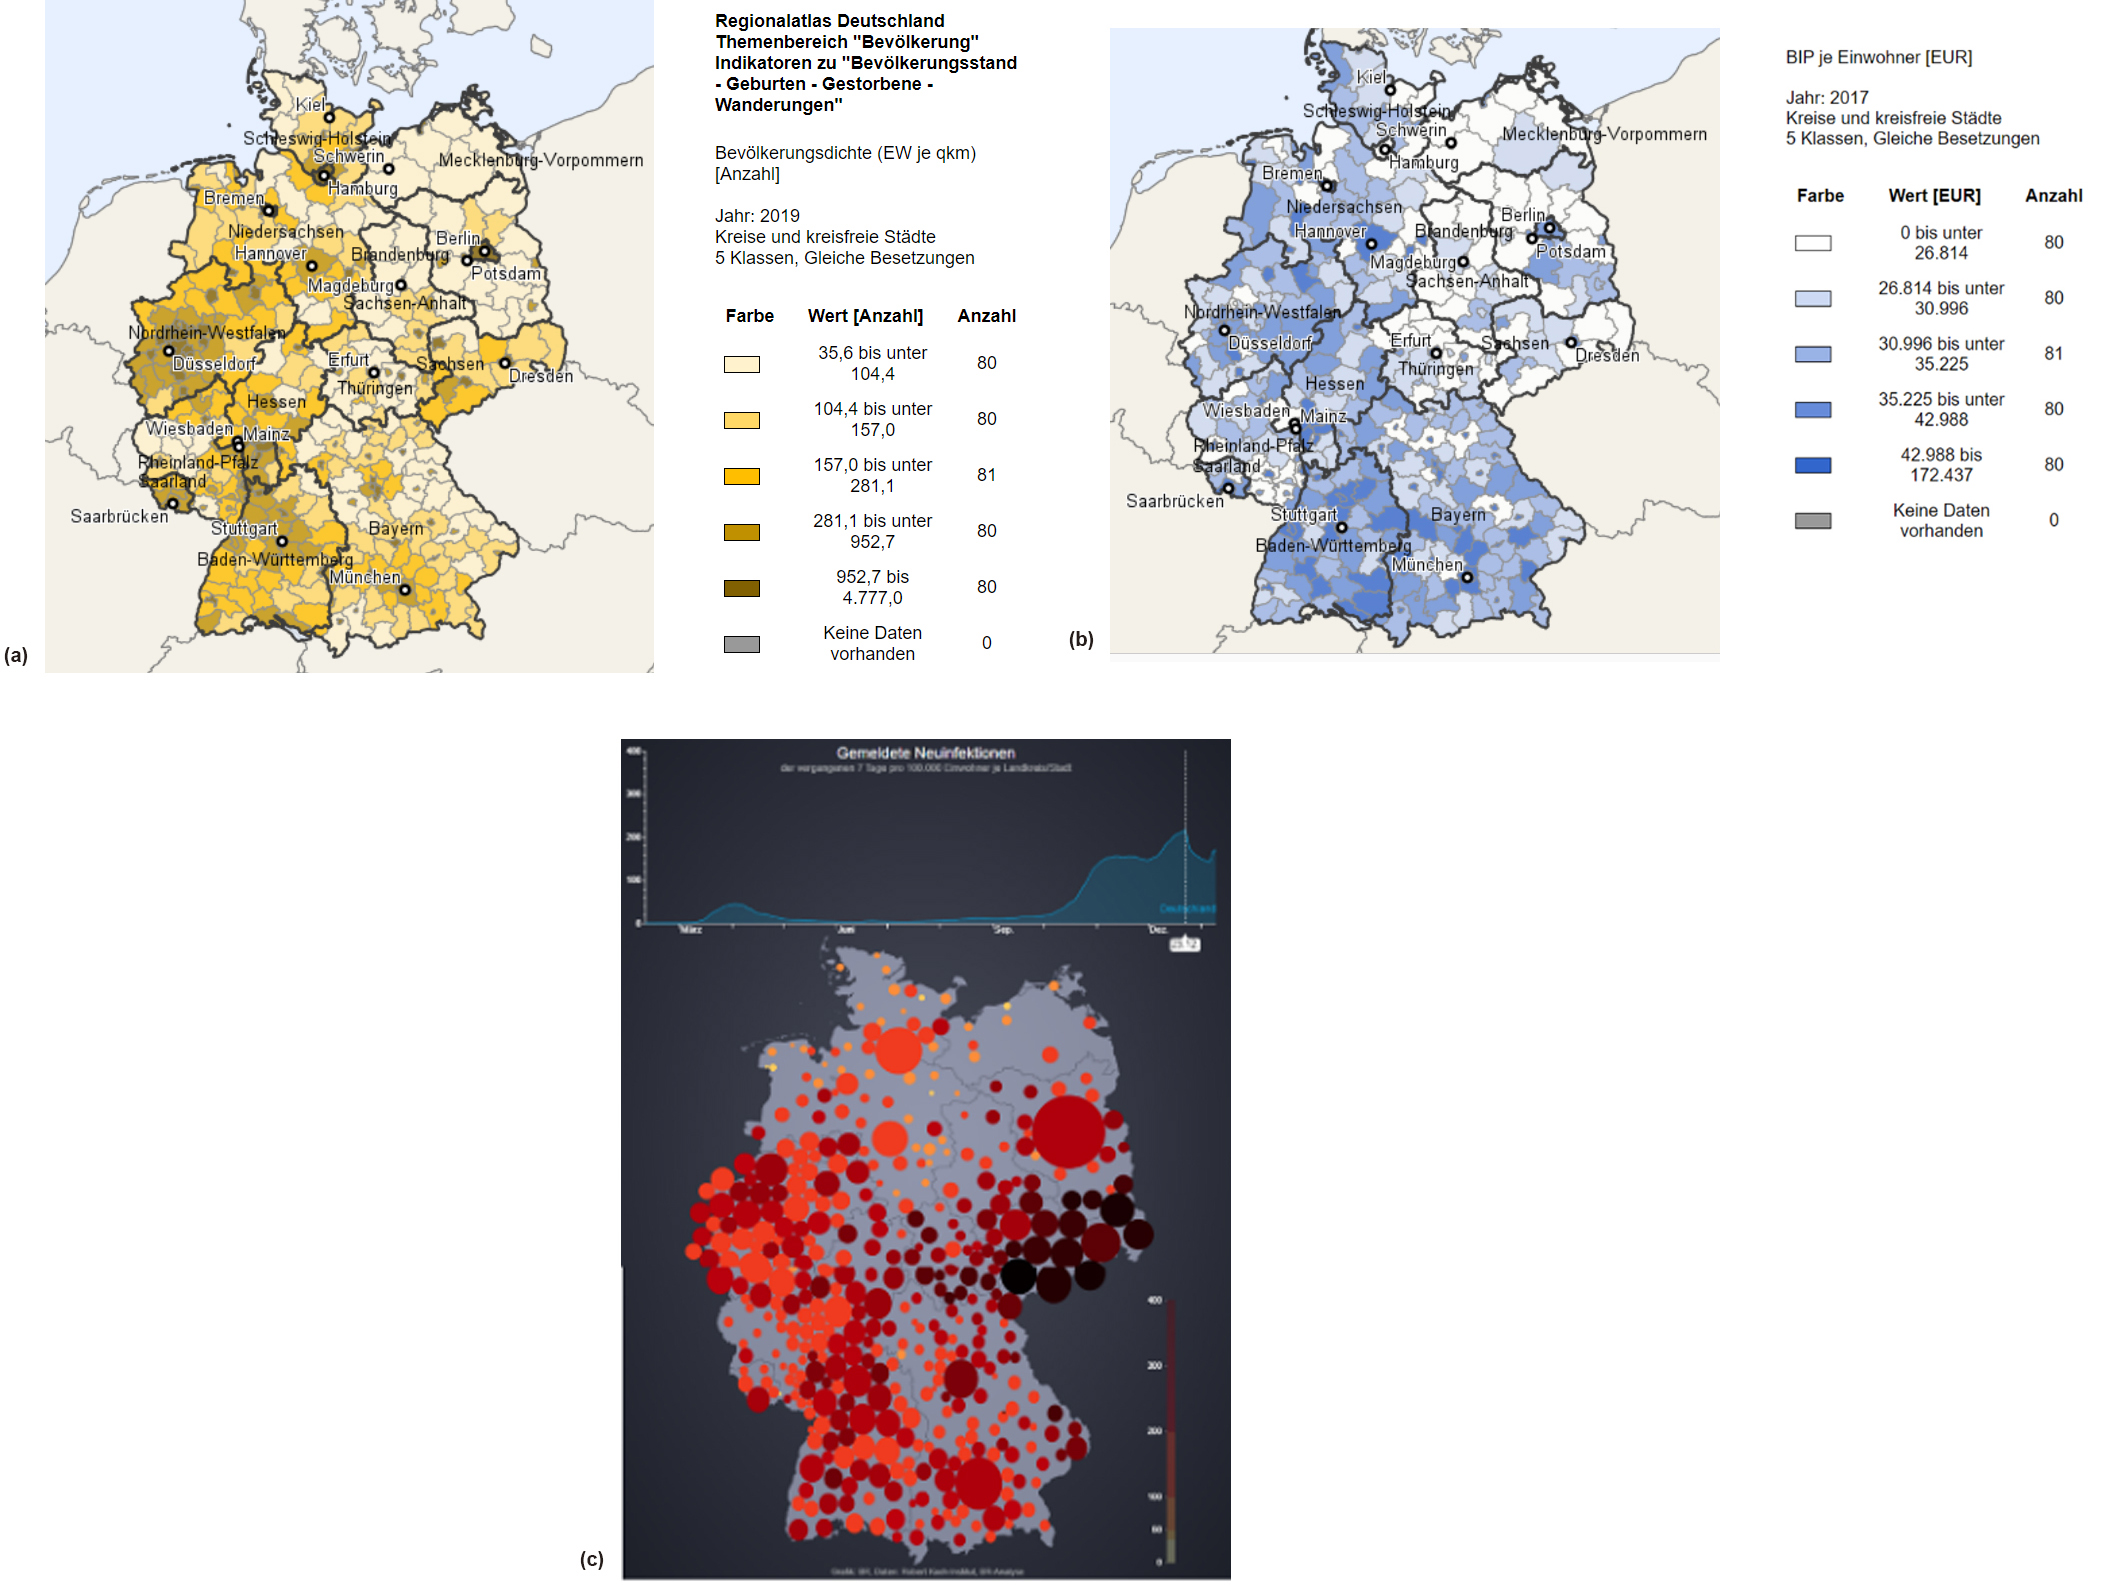
Figure 4a shows that the western part of Germany is relatively densely populated, with 952.7 to 4777.0 inhabitants per km
The situation is similar to the gross domestic product per inhabitant (Fig. 4b). In 2017 these figures range between EUR 26 814 and EUR 172 437 per capita. The higher values are often concentrated in big cities, often a state’s capital. In addition, the values are usually significantly higher in regions with a higher population density than in less populated areas. This is particularly true for North Rhine-Westphalia, the most populous German state, Baden-Württemberg in the south-west, Bavaria in the south-east and Berlin in the north-east.
Figure 4c is a screenshot from an interactive map with official numbers for COVID-19 cases where the incidence values among others could be retrieved on a daily basis provided by a regional public German broadcaster [50, 51]. It shows the development and the peak of new infections in the second wave in Germany for 2020. A rapid increase (see the graph on top – could be observed since October 2020). The peak in 2020 was reached on December 23rd, 2020. In most big cities new infections were around 200 persons per 100 000 inhabitants (for instance for Cologne: 170.4, Hamburg: 190.8, Berlin 236.2, Munich: 240.1). At that time there were only a few regions with less than 100 new infections – see the light yellow and orange spots, which were mostly located in rural areas (the lowest values are recorded on December 23rd, 2020 for Uelzen with 37.9, a small NUTS3 region northwest of the state’s capital Hanover. And, on this day low rates were also registered for two big Laender cities: Rostock in Mecklenburg-Western-Pomerania in the north east at the coast of the Baltic Sea with 40.6 and Potsdam in Brandenburg with 72.6 south west of Berlin while in the Laender south of Berlin, particularly next to the border with Poland and Czech Republique these values were highest (see dark red and nearly black spots with Zwickau: 688.9 at highest). So, it became clear that after the holydays at the end of the year the heads of the Laender together with the Chancellor agreed to continue the lockdown in January 2021 and to tighten up the measures, in particular closing of most shops, schools and restricting all social contacts to a minimum.
What the economic impact of these measures will be in the long run is current difficult to say. After the first lockdown in spring institutes predicted after some recovery in summer and early autumn a decline of the GDP about 5%. For instance, the German Council of Economic Experts (SVR) forecasted in its annual report for 2020/21, a year-on-year decline in gross domestic product of 5.1% for 2020 and a decline of 3.7% for 2021 [52]. It remains to be seen what consequences this will have for the various regions in Germany, particularly the cities and rural districts. However, it can be assumed – like the economic and financial crisis in 2008/09, when real GDP fell by 5.6% [53, Table 1.1] – that the various regional units will be affected differently. While in the crisis of 2008/09 mainly the industrial centres were affected [54, slide 9], it can be assumed that this time the big cities will be particularly much more hit because of the long lasting shut down of nearly all activities that make big cities attractive; especially the economic sectors of trade, hotels and restaurants as well as transport, tourism and culture are severely affected.
• Housing supply and future price developments
Adequate housing supply is a major challenge for big cities. Land is scarce and expensive and housing is expensive. Expanding the supply requires large investments from either private or public investors. Additionally the planning processes are usually complex and time-consuming.
Figure 5.
a. Completed housing in 2018. b. Real purchase prices of residential property in 2020. c. Projected real price growth for 2019–2030.
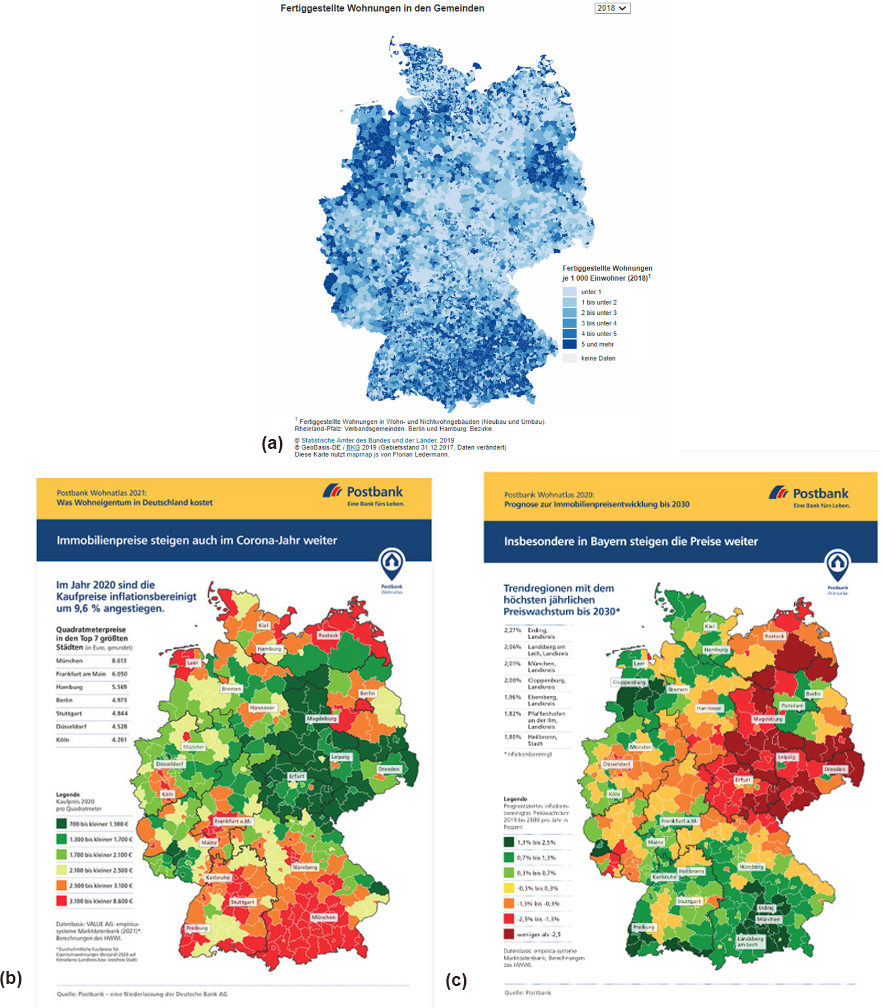
For 2018 Fig. 5a shows a map released by Dest-atis [55] that, predominantly in rural areas, relatively more housing has been completed than in bigger cities. With five dwellings and more per 1000 inhabitants, the highest density of completions in 2018 were the regions around Berlin in the east, in the north-west on the border with the Netherlands and numerous regions of Bavaria on top. Unfortunately, the exact values can only be retrieved interactively. Thus, many housing units per 1000 inhabitants were completed in 2018 in big cities such as Hamburg, Munich, or Stuttgart, too.
Information on the current and future development of real prices is provided by a large German bank, the Postbank (see Fig. 5b and c) [56, 57]. According to these maps, in 2020 the prices per square metre for residential property were highest in Munich, followed by Frankfurt/Main, with 8613 and 6050 euros per square metre (Fig. 5b). Papon shows similar results in her report on a housing market analysis undertaken by the real estate service provider McMakler for the first three quarters of 2020 [58]. Regarding future developments it is predicted (Fig. 5c) that prices will rise in almost all regional capitals and other bigger cities in nearly all federal states. This applies equally to more rural regions in the west along the borders with neighbouring countries and in the south of Cologne along the river Rhine. Price increases are also expected for the areas on the southern border of Germany. In the east these were mainly areas of Berlin and Brandenburg. It is striking that Rostock, the biggest city in Mecklenburg-Western Pomerania, is expected to see a sharp drop in prices by 2030, although there has been no significant increase in completed housing at least for 2018 and peak values reported for prices per square metre of residential property in 2020. The main reasons for the price decline, especially in eastern German cities – according to Papon –, are the ageing population and differences in infrastructure.
The COVID-19 pandemic is even partly seen as an accelerator for price developments on the housing market, also in rural areas. Even for 2020 prices for residential property were rising as The Institute of the German Economy reports [59]. The experience of living intensively together in multi-person households, especially during the first lockdown with the closure of all educational institutions and kindergartens as well as forced or recommended exercise of professional activities from home wherever possible was boosting the preferences for affordable residential property in the countryside. And, the continuing favourable conditions on the financial markets, in particular low interest rates for loans and the lack of attractive alternative capital investments are encouraging and supporting these developments.
• Employment and training
Formal education and vocational training are essential for qualified employment and income. Conversely, inadequate school education, especially a lack of a school-leaving certificate, is often regionally accompanied by high youth unemployment (see Fig. 6a and b). In 2019, youth unemployment, i.e. of people aged 15–24, was high in rural areas. At around 6.4–13.2%, it was highest in the eastern and north-eastern regions of Germany. However, it was lowest in the southern Laender with less than 3.6% for young people (see the areas coloured in white and light pink).
Figure 6.
a. Unemployment of persons aged 15–24 in 2019. b. School leavers without lower secondary school leaving certificate in 2019.
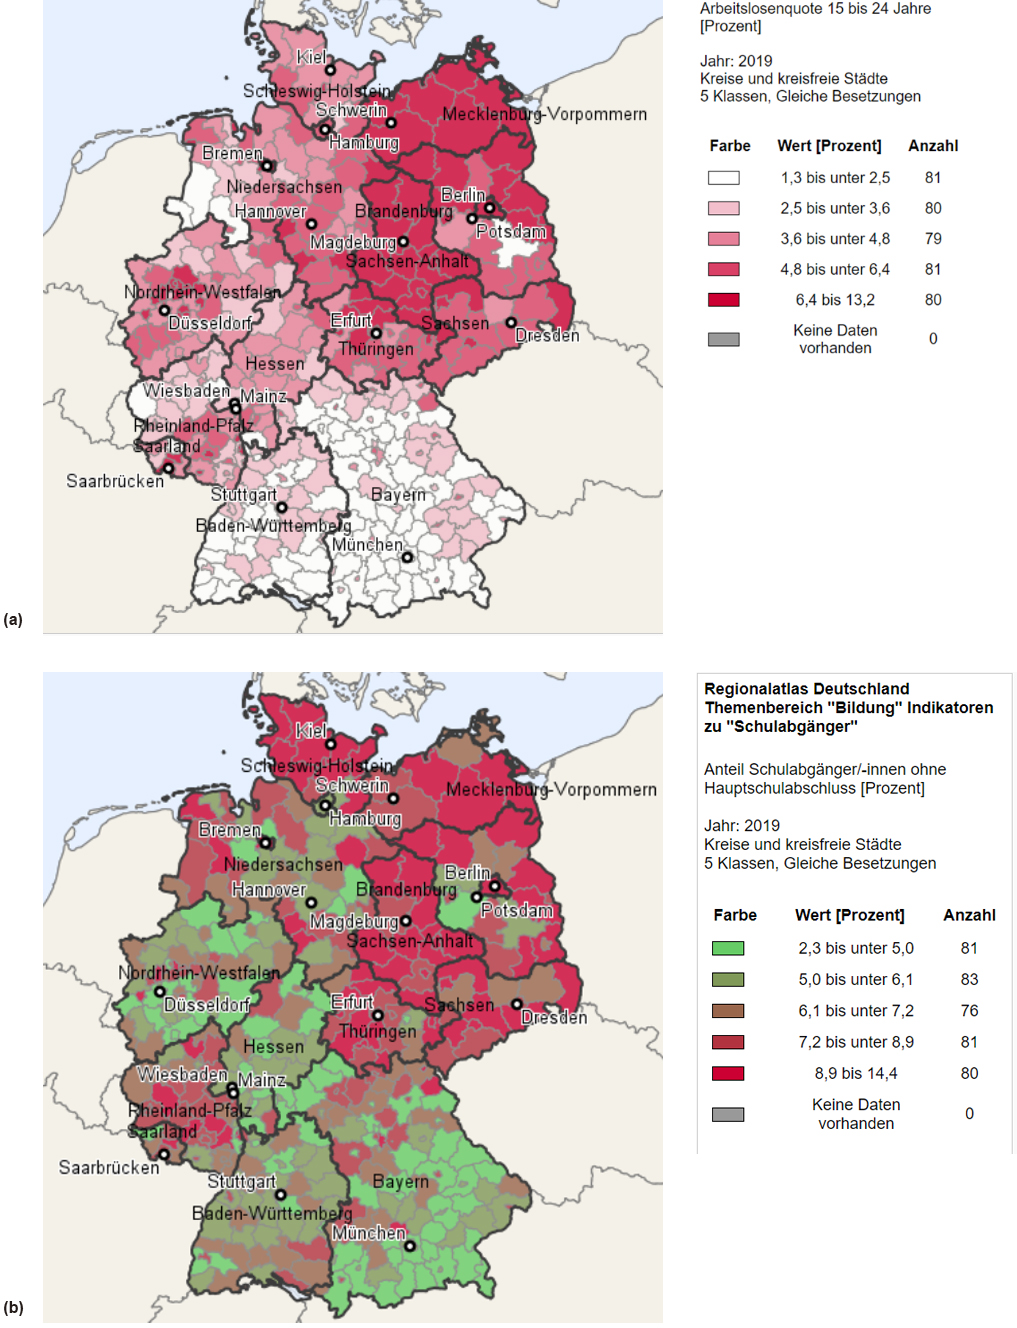
A comparison of the regions with high youth unemployment in 2019 with the number of early school leavers (Fig. 6b) shows similar regional patterns for pupil leaving a secondary school without any certificate for Germany’s north-east except for Berlin and parts of Brandenburg for 2019. There, the rates of school leavers without a lower secondary school leaving certificate (in short: early school leavers) were also extremely high with 8.9–14.4%. In other German Laender there are also districts with a high rate of early school leavers. And, it seems to be at least for some of them a visual correlation with youth unemployment. On the contrary for some districts in Baden-Wuerttemberg and Bavaria with a higher share of early school leavers (even in the highest classes with 7.2 to 14.4%), youth unemployment was almost less than 3.6%. These developments may already be due to a stronger orientation of the economy towards services, often industry-related services, which could be provided by remote work given an appropriate IT infrastructure.
Another effect of the current pandemic could be that traditional health workers who play an important role currently are getting more respect, meaning that these professions will become more attractive to young people, especially regarding demographic changes, in particular the ageing society. Thus, the job opportunities for young people even without a lower secondary school leaving certificate might open up allowing a certain decoupling from the labour market. What the effects of the strict measures on limiting the pandemic, particularly the closing of schools and kindergartens will have for pupils with unfavourable home-based learning conditions and later their chances in the labour market should be carefully monitored.
• Provision of family doctors and public services
Health and fitness services are especially important for people when assessing quality of life. General practitioners (GP) are essential for health care, especially in rural areas with relatively less specialised doctors or hospitals. Figure 7a shows the supply of GPs per 100 000 inhabitants for 2017 [60]. More than 65 general practitioners per 100 000 inhabitants – see the areas in darker blue – were available in many regions of the country, including rural areas. In some parts even there were more than 75 general practitioners per 100 000 inhabitants. In urbanised areas, however, especially in the north and south-west and in some parts of Lower Saxony and Bavaria, there were larger contiguous areas with less than 60 GPs per 100 000 inhabitants (coloured pink). This also applies to some more rural areas, although these are mainly dispersed. A different picture would probably emerge, at least for big cities when the total number of doctors i.e. all independent doctors of all specialties were considered. They are probably more concentrated locally and can be found predominantly in urban areas. Further analyses will have to show which other reasons could be relevant for the regional distribution in Fig. 7a.
Figure 7.
a. Supply of GPs per 100 000 inhabitants in 2017. b. Satisfaction of citizens with public services for retirement in 2017.
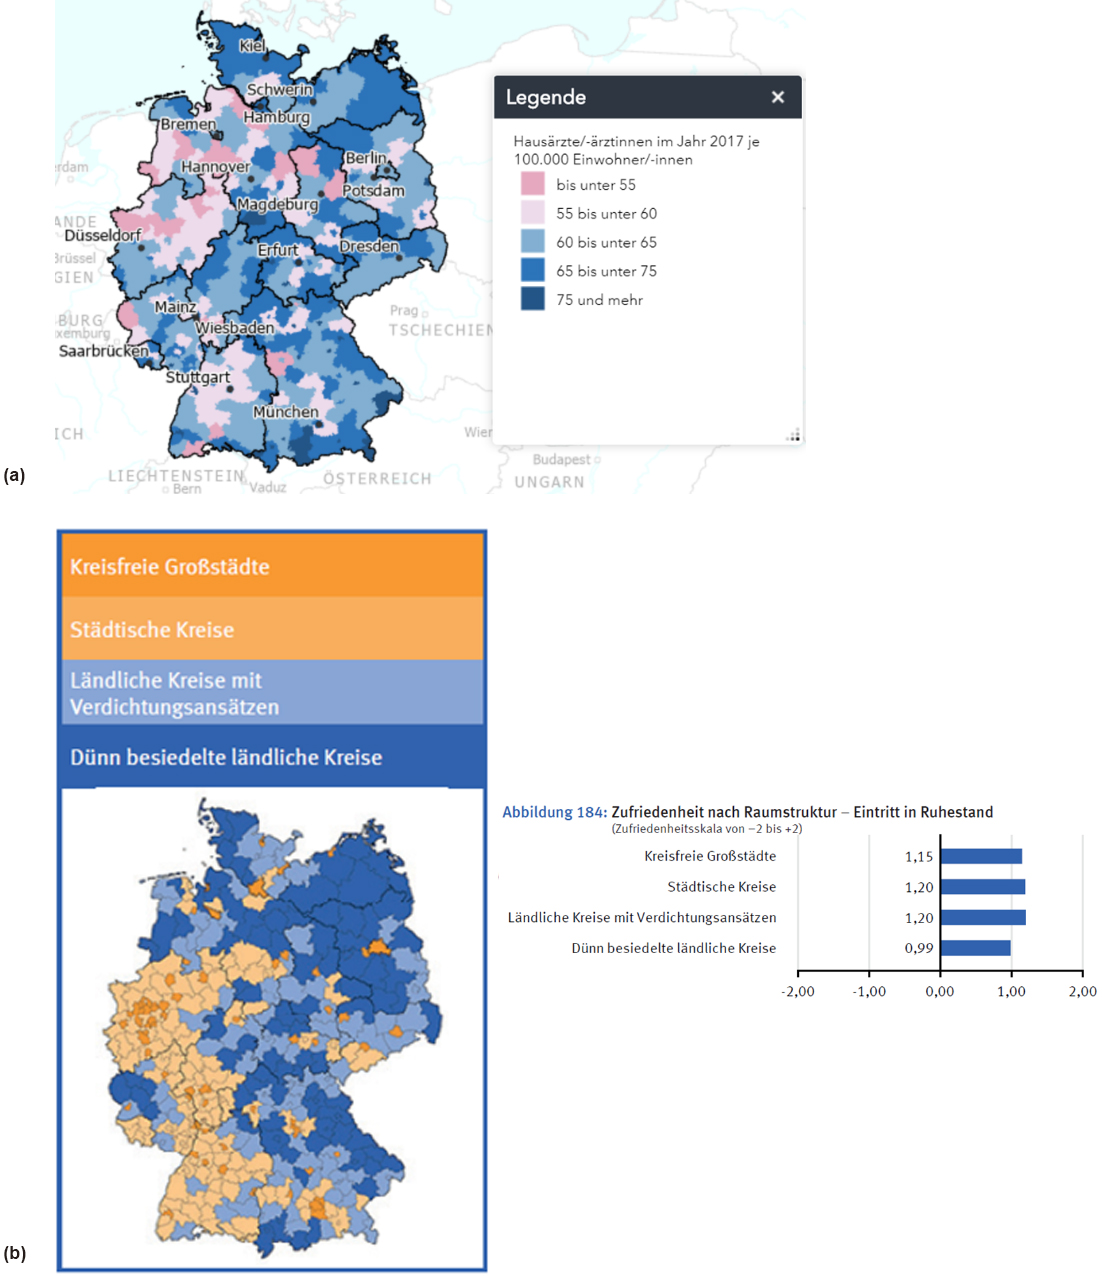
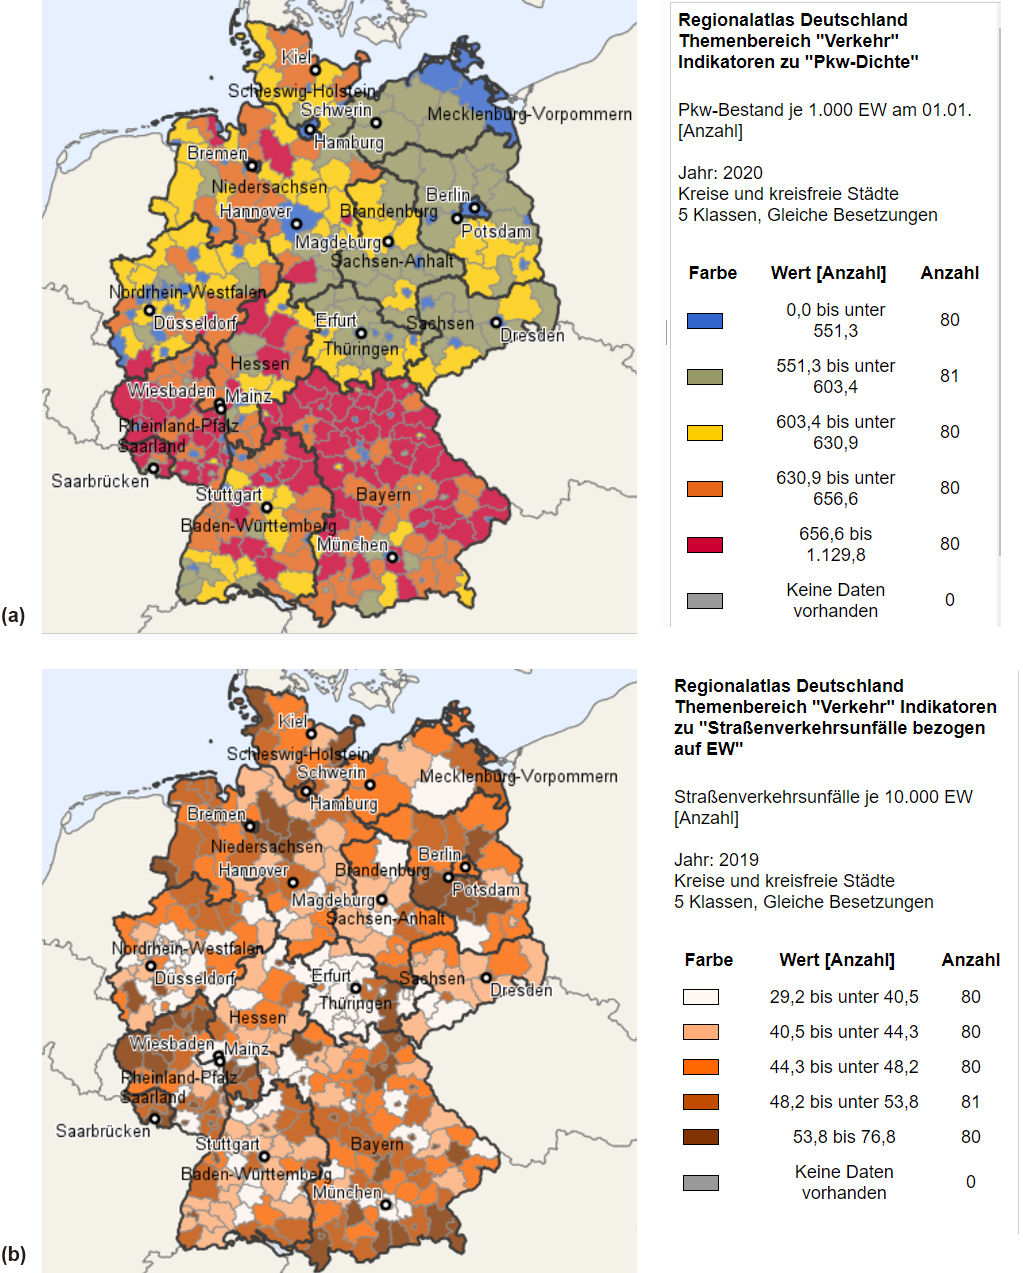
Figure 8.
a. Car density in 2020. b. Road traffic accidents in 2019.
Another determinant of well-being is availability and access to public services. To get more information on its impact the Federal Statistical Office of Germany launched a survey in 2017 and classified some of the results by region, too [61]. Figure 7b shows how people are satisfied with public services, when getting retired and leaving the labour market. For this purpose, they have to contact authorities, for example apply for social benefits at the Office of Social Affairs or register with the health insurance fund for health insurance for pensioners. They have to submit applications to the pension insurance fund for regular old-age pensions or to submit an account declaration or report additional earnings and so on [61, p. 80]. For assessing their satisfaction people could choose between
The current COVID-19-pandemic has accelerated digitisation in all areas of life including health care and public services, both for the providers of those services and for the citizens who use them. It can be assumed that digitisation in these areas will continue to progress. This is likely to be accompanied by improvements including in health care as well, as postulated [62].
• Private car ownership and road accidents
Getting around by car or public transport is basic for various activities, for example to get to work, shop, meet friends and so on. Having your own car or some kind of bike makes the individual independent of departure times and stops. But it also causes often high costs and non-productive times when the vehicle is parked at work or overnight.
The share of private cars per 1 000 inhabitants is an indicator of how important this is in terms of the spatial dimension. Results from Germany’s Federal Statistics show for 2020 (Fig 8a) that in big cities such as Berlin or Hamburg there were only a rate of up to 551 private cars per 1000 inhabitants. This is different for rural areas. While in the south of Germany, at least more than one car per capita is statistically accounted (1129 cars per 1 000 inhabitants), these figures are much lower in the north and east. For the north-eastern Laender, the numbers were between 551 and 603 cars per 1 000 inhabitants in 2020 while for the north-western areas they were on average slightly higher, with peaks of up to 656 cars per 1 000 inhabitants (see the areas in orange).
The number and gravity of road traffic accidents are aspects that are taken into account in all comprehensive political strategies about overall well-being. As the Regional Atlas shows, there were no clear differences between rural and urban regions for 2019 (Fig. 8b). The lowest values, with fewer than 33 accidents per 10 000 inhabitants were recorded for the district of Fuerth (29.2), the city of Remscheid (32.3), the district Ennepe-Ruhr (32.5), the city of Muehlheim/Ruhr (32.5) as well as the district of Stendal with 32.7 accidents per 10 000 inhabitants. The maximum values were dispersed across the country. The five cities and districts where the most accidents 2019 occurred were the city of Koblenz (76.8), the city of Speyer (73.1) as well as the city of Landau/Pfalz (71.6) all in the Rhineland-Palatinate, the city of Memmingen (71.6) and the city of Rosenheim (70.0) both in Bavaria.
For most Laender capitals the values were lower than 50.0 such as Stuttgart (41.8), Munich (42.2), Schwerin (43.6) or Berlin (46.2). For all other Laender capitals the values did not exceed 58 (for Saarbruecken with 57.7 accidents per 10 000 inhabitants).
Due to the pandemic private transport has declined significantly in the first half of the year because of the lockdown. As reference, the latest data available from the Federal Statistics Germany on the use of public transport, an important mode of transport especially in big cities, shall be mentioned here. According to these figures public transport [63] which accounts normally for 99% of regular transport showed a decline of more than 20% in the first half of 2020 – according to provisional data. But these percentages are likely to be higher as the Federal Statistical Office states in its press release of 28 October 2020. Long-distance transport, which brings commuters from more distant places into big cities fell by almost 50%. The decline in private transport is also likely to be within this range because of fearing to be infected by COVID-19 there.
Due to the decline in private transport, there were correspondingly fewer road accidents in the first half of 2020 as DEKRA, a European vehicle inspection company, reports with reference to the data of Official Statistics Germany [64]. But there were also fatal road traffic accidents.
While on average 15 people died in a road accident in Germany per 1 m inhabitants, the risk of road death was highest in Brandenburg with 27 road deaths, followed by Saxony-Anhalt with 24 and Lower Saxony and Schleswig-Holstein each with 22 road deaths per 1 million inhabitants. In Hamburg and Berlin, contrarily, these figures were lowest with 4 and 8 deaths per million inhabitants. The figures for the federal states of North Rhine-Westphalia and Saarland, with 11 each, as well as Baden-Württemberg with 13 and Hesse with 14 road accident fatalities per million inhabitants were also below the national average in the first half of 2020.
It is conceivable that a lower traffic volume and thus fewer road accidents will settle at a lower level in the long term. This is because the current pandemic has shown that many professional activities in an industrialised service-oriented society can still be carried out by remote work from home a modern and powerful IT infrastructure provided.
• Land consumption and domestic waste generation
Land is needed for settlements, industrial areas and infrastructure facilities such as motorways, streets, parking lots etc. However, the sealing of open spaces or the designation of new residential, commercial or transport areas is generally at the expense of natural areas which are of great benefit not only to humans but to all living creatures and the climate. For this reason, the indicator ‘land consumption’ is used in numerous comprehensive political strategies on well-being to illustrate how interventions by today’s society will influence the living conditions of future generations.
As Fig. 9a illustrates for 2019, in most big cities an area of almost about one-fourth to more than the half of their total area was sealed. In rural areas on the other hand, especially in the south and in the north-east, the percentages were much lower, some with less than 5.0%. Even though various measures to improve the housing situation and create environmentally friendly urban living conditions are currently being discussed, for instance a redensification of existing buildings or the greening of facades or roofs. It remains to be seen what effects that will have in the long term.
Figure 9.
a. Land consumption for settlement and transport areas in 2019. b. Household waste per inhabitant in 2018.
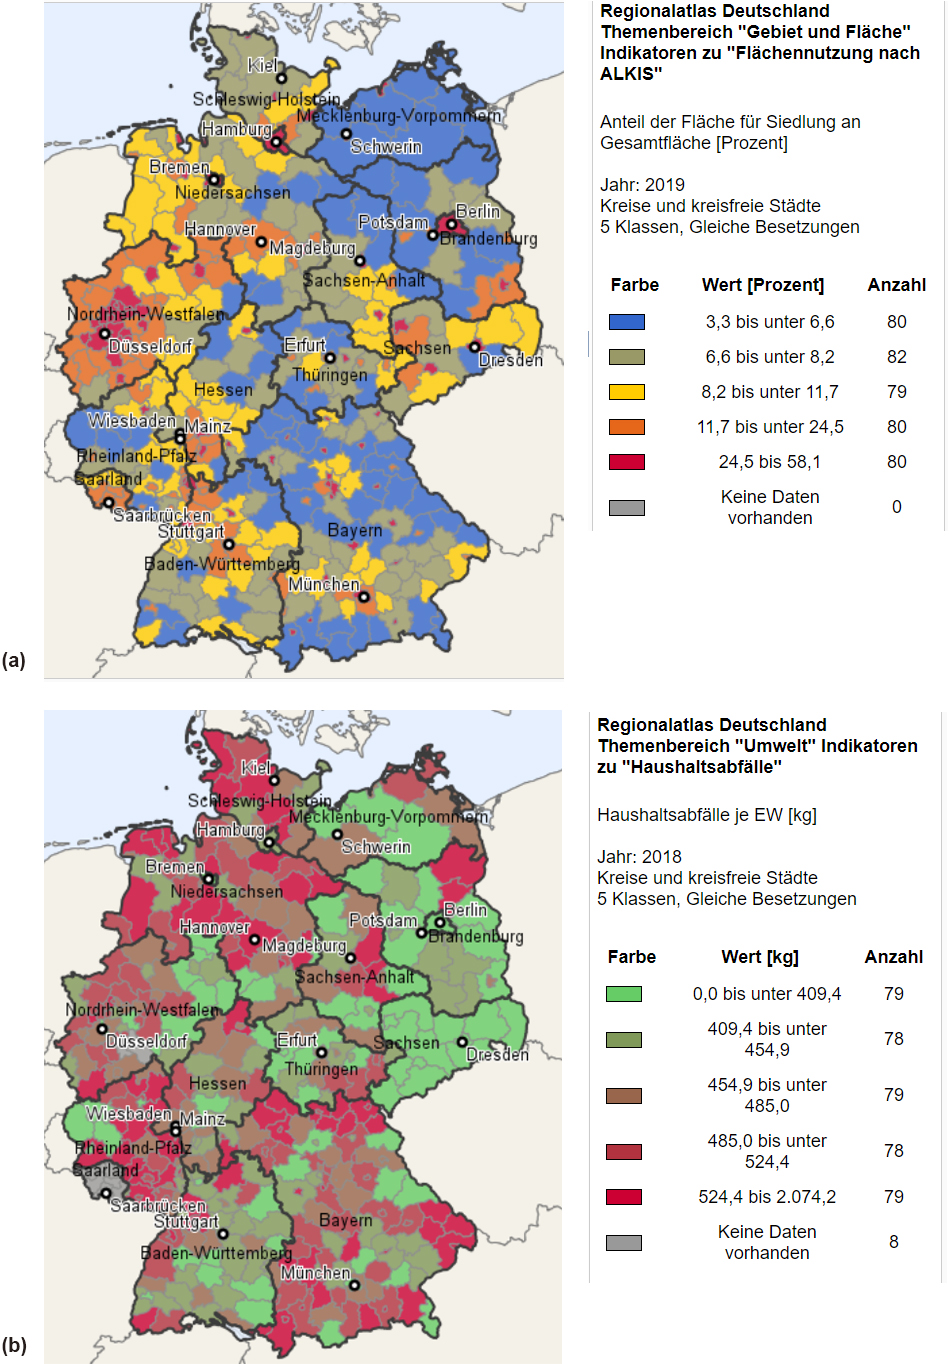
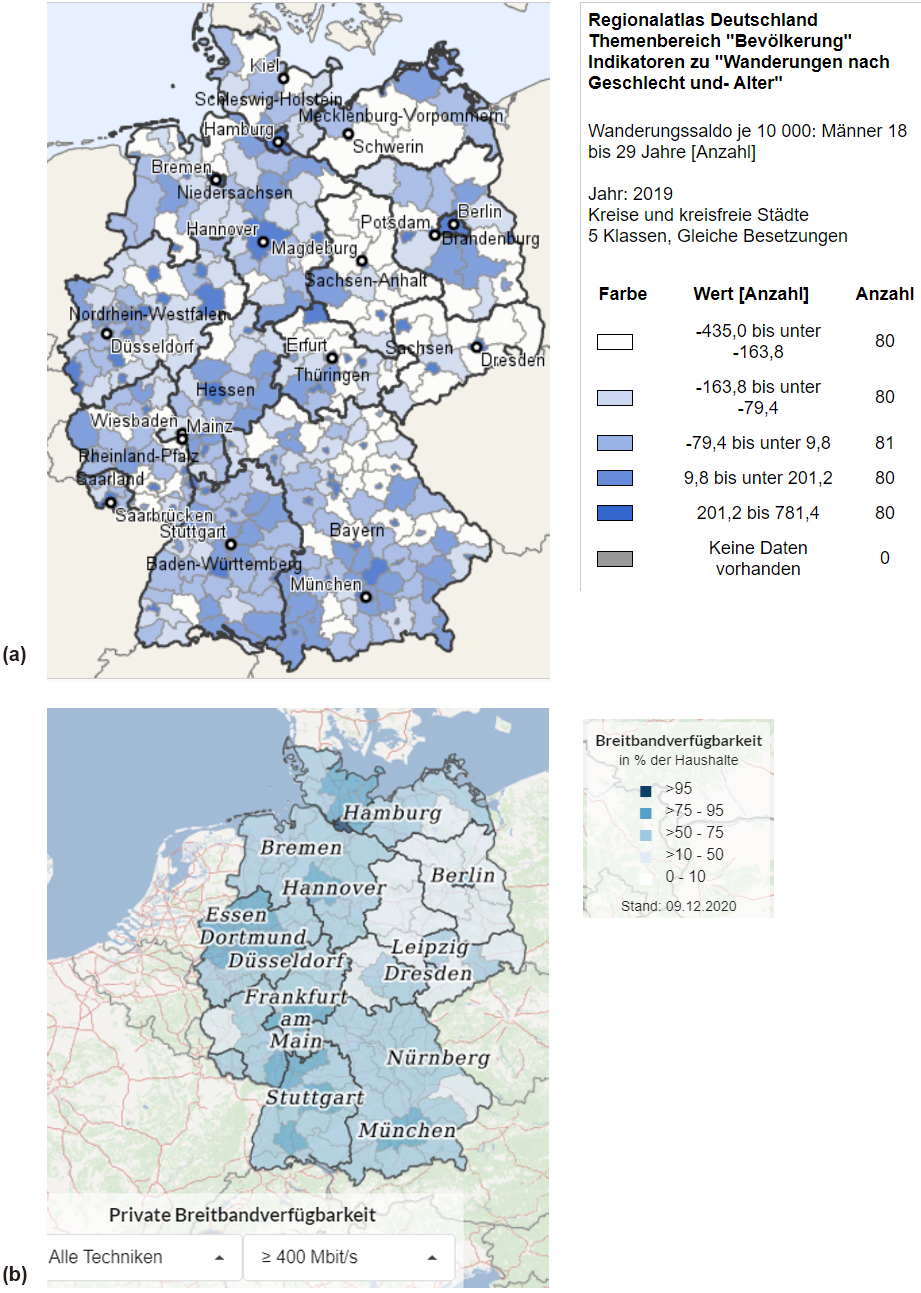
Figure 10.
a. Net migration of young men in 2019. b. Broadband availability in private households on December 9, 2020.
Another important aspect of well-being is the amount of household waste generated, which is likely to be higher in big cities than in rural areas due to the large number of people living and working there. Because of the broad categories of incidence, especially the extreme values in the lowest and highest categories in Fig. 9b, the exact values per capita for the independent cities and districts were retrieved from the Regional Atlas.33 In 2018, the amount of waste generated per inhabitant ranged from 251.2 kg in the district of Mittelsachsen to 756.2 kg in the city district of Baden-Baden. Accordingly, the lowest volume of waste was generated in eastern Germany with less than 409.4 kg per capita. For big cities the values were partly lower and partly higher. Overall, they ranged from 316.3 kg for Dresden to 471.5 kg per capita for Munich. High values were also observed for some rural regions, such as the districts of Bad Kissingen 551.4 kg or Oberallgäu with 558.9 kg per capita. Thus, further analyses will have to show which other factors could be responsible for this, for instance these regions are tourism regions.
Due to the hygiene and protection measures during the COVID-19 pandemic an increased volume of household waste is expected at least for 2020 as the DGAW, the German association for waste management, reported [65, section 6]. However, a significantly greater decrease in industrial and commercial waste is predicted, this study assumes an overall decrease in the total waste volume. Against the background of long-term developments – a long-term decline in waste volumes as described by McAfee [44, p. 100] at least for the USA – it is questionable whether a higher level of household waste will last in the long term, i.e. will remain even after the pandemic has been overcome.
• Future developments
This section presents two indicators that can be used as drivers of future developments. One is the willingness of young people to move to another city for instance for education, training or employment.
Figure 10a shows for 2019 that the biggest German cities have more in-migrations than out-migrations. In statistical terms that means more men aged 18–29 are moving in than out in relation to all men in this age group. Similar developments can be observed for women, too.
In detail, the Regional Atlas shows the following developments: in some parts of Germany, out-migration is dominant as shown by the white and light blue areas. These include above all the federal states in the north and east as well as some regions in North Rhine-Westphalia and Saarland, a few regions in southern Germany and selected ones in the middle of Germany (such as Lower Saxony, Hesse and Thuringia). Big cities such as Berlin, Munich and the surrounding areas as well as Stuttgart and Hamburg are particularly attractive and record an increase ranging from 442.0 men for Hamburg to 781.4 men per 10 000 men of the same age group for Munich in 2019. According to a study by the Hamburg-based GEWOS Institut für Stadt-, Regional- und Wohnforschung GmbH, an independent consulting and research institute in the housing and real estate market, this trend is likely to continue until 2035, albeit with declining growth rates [66].
Technical developments, especially the provision of high-speed broadband are also often used when assessing readiness to future developments, especially in rural areas. The Broadband Atlas of the Federal Ministry of Transport and Digital Infrastructure (BMVI) illustrates for early 2020 in which regions high-speed broadband is currently available [67]. Among the options the Atlas provide, here connections with more than 400 Mbit/s for private households (see Fig. 10b) and 1000 Mbit/s – not shown here – were chosen. High performance internet is particularly needed for the upcoming 5 G technology, in particular for predictive traffic control, precise control of robots or more generally for interfacing virtual information with real-time reality. The atlas shows that more than 75% of private households in the Rhine-Main area with a significant number of IT service providers, and in the Ruhr area, the largest agglomeration of big cities in Germany as well as in Hamburg, Munich and Stuttgart and their surrounding areas, had access to high-speed internet. In all other urban and rural areas only half to three quarters of private households could use such a fast internet on December 9
There is no doubt that the COVID-19 pandemic has given a major boost to digitisation in all areas and may have contributed significantly to ensuring that at least some degree of social and economic life is possible under both politically imposed and self-imposed restrictive measures, particularly during the periods of lockdown.
5.Conclusions
The indicators used in numerous comprehensive political strategies for improving people’s well-being are suitable for small-scale analyses, in particular for illustrating regional dichotomy between urban and rural areas. Thus, high economic growth, low unemployment, here of young people with regular school-leaving qualifications were predominantly observed in the more densely populated western and southern Laender of Germany And, big cities were traditionally more attractive to young adults – both men and women – and encourage them to leave their hometowns for instance for training or employment. The provision of high-speed internet is essential. Car ownership is less pronounced in big cities than in rural areas where it is fundamental for traveling around. The intensive land use in big cities and closely related areas, the scarcity of affordable housing including the high costs for rent or private property are serious disadvantages. However, those who are willing to pay for a dwelling in a big city might have a chance of maintaining or even increasing its value in the long term.
For the indicators road traffic accidents and household waste there is no clear evidence of the settlement structure. These issues are probably too complex – as outlined in the fourth part – and require more detailed analyses especially some knowledge about the regional and local conditions.
Finally, the examples suggest that there are some factors that require urban surroundings but not as large as in a big city as the examples for family doctors or public services show. However, these aspects seem to be more appreciated by residents living in smaller towns than in bigger cities, presumably because of a better accessibility. Again, further research would be needed to better assess the importance of these aspects for people’s well-being regionally.
The current worldwide pandemic makes clear that well-being is something that strikes nearly everyone no matter where he or she lives. It has changed nearly everything to the better or the worse at least in the short run. Not everything was bad, that has been undertaken to limit the adverse impact on individuals or the society itself. Some inventions gained momentum, in particular the widespread usage of IT and the internet at least in Germany and the inventiveness in areas that are most hit by the pandemic, such as in retail trade, hotels and restaurants and the cultural sector. What the COVID-19 pandemic’s impact in the long term will be is currently difficult to say. Finally, it can be assumed, however, that people living in rural areas tend to be less affected by the pandemic – objectively and subjectively. This means that the disadvantages for the urban population are more severe due to the extensive shutdown of businesses in many sectors of the economy. And families living in big cities often suffer from a limited living space in which they had to accommodate all activities from home office to home schooling and fitness. In addition, there is an increased risk of getting infected by COVID-19 because of the huge number of people living side to side in a big city.
Of further interest seem to be the following questions. Only one for each dimension of well-being – as presented in the beginning – should be mentioned: Will urbanisation grow as in the past or will people increasingly prefer living in the countryside, even in remote areas? Will working from home, which has widely spread during the pandemic, last? How will children, pupils or in general all young girls and boys, in particular those who are deprived, be affected in their further career in the labour market? What are the effects of working remotely and travel difficulties on traffic, the different means of transport and the traffic volume on the whole and what does it mean regarding to the protection of the natural environment and the climate?
And finally, what will be the effects of the rapid changes in the usage of modern information and communication techniques (ICT) on the public sector and other areas where ICT and automation has been still lacking? All these questions could be also asked for all other countries, that are badly hit by the pandemic. Besides these effects at national level the most urgent question in an era of globalisation might be: Will the progress made during the last decade worldwide suffer and to what extent in particular in emerging countries? More research and probably new data of high quality are needed to track the developments and their interdependencies over time requiring long time series preferably from Official Statistics in particular from organisations and institutions fostering the harmonisation and coherence of statistical data at EU and UN level. The political strategies presented, in particular the SDGs seem to be a good starting point. Thus, further analysis seems to be urgently necessary to how people’s wellbeing has been affected by the pandemic, how they will overcome the drawbacks how long it will last until a ‘new normal’ will be reached and what the ‘new normal’ will be. Many of the relevant foundations for this are already in place.
Notes
3 Four districts in the Eifel region including the independent city of Trier were not taken into account, for which a waste generation of 0 kg was shown in the table. For the district of Trier-Saarburg, the seat of the Zweckverband Abfallwirtschaft Region Trier, on the other hand, a waste generation of 2074.2 kg per inhabitant was reported in 2018, a value that is approximately 1300 kg higher than the second highest value for Baden-Baden.
References
[1] | Plato. Politeia (Dialogum de Republica): Der Staat. Accessed from http://www.opera-platonis.de/Politeia1.pdf. |
[2] | National Constitution Center of the United States. The Constitution of the United States. Accessed from https://constitutioncenter.org/media/files/constitution.pdf. |
[3] | Bundesverfassung der Schweizerischen Eidgenossenschaft vom 18. April 1999; Stand am 1. Januar (2018) . Accessed fromhttps://www.admin.ch/opc/de/classified-compilation/19995395/201801010000/101.pdf. |
[4] | Grundgesetz für die Bundesrepublik Deutschland. Zuletzt geändert durch Artikel 1 des Gesetzes vom 13. Juli (2017) . BGBl. I S. 2347. |
[5] | Consolidated Versions of the Treaty on European Union and the Treaty on the Functioning of The European Union. Official Journal of the European Union C 326/01; 26.10.2012. |
[6] | Regulation (EC) No 1059/2003 of the European Parliament and of the Council of 26 May 2003 on the establishment of a common classification of territorial units for statistics (NUTS). Official Journal of the European Union L 154; 21.6.2003. Accessed from https://eur-lex.europa.eu/legal-content/EN/TXT/?uri=CELEX%3A32003R1059. |
[7] | European Commission. Eurostat regional yearbook 2010. Chapter 15: A revised urban-rural typology. Accessed from https://ec.europa.eu/eurostat/documents/3217494/5726181/KS-HA-10-001-15-EN.PDF/5499ee07-b61e-4615-9631-ed76e2a31f81?version=1.0. |
[8] | Regulation (EU) 2017/2391 of the European Parliament and of the Council of 12 December 2017 amending Regulation (EC) No 1059/2003 as regards the territorial typologies (Tercet). Official Journal of the European Union L 350/1; 29.12.2017. |
[9] | Federal Statistical Office of Germany. Kreisfreie Städte und Landkreise nach Fläche, Bevölkerung und Bevölkerungsdichte am 31.12.2019. Wiesbaden; 2. September (2020) . Accessed from https://www.destatis.de/DE/Themen/Laender-Regionen/Regionales/Gemeindeverzeichnis/Administrativ/04-kreise.html. |
[10] | United Nations General Assembly. Transforming our world – The 2030 Agenda for Sustainable Development. Resolution A/RES/70/1. Seventieth session agenda items 15 and 116, 70/1. New York; 25 September (2015) . |
[11] | United Nations High-Level-Panel of Eminent Persons on the Post-2015 Development Agenda. A new global partnership – Eradicate Poverty and Transform Economies through Sustainable Development. New York; (2013) . |
[12] | United Nations General Assembly. Work of the Statistical Commission pertaining to the 2030 Agenda for Sustainable Development. Resolution 71/313, A/RES/71/313. New York; 6 July (2017) . |
[13] | United Nations Development Programme, UN-Habitat, Global Task Force. Are you looking for tools and solutions to achieve the SDGs at the local level? Accessed from http://localizingthesdgs.org/about-us.php. |
[14] | Development – The 169 commandments – The proposed sustainable development goals would be worse than useless. The Economist. (2015) ; March 26th–April 3 |
[15] | Federal Statistical Office of Germany. Nachhaltige Entwicklung in Deutschland – Indikatorenbericht. Wiesbaden, June (2014) . |
[16] | Federal Statistical Office of Germany. Nachhaltige Entwicklung in Deutschland, Indikatorenbericht 2018. Wiesbaden, December (2018) . |
[17] | Federal Statistical Office of Germany. Nachhaltigkeitsstrategien und-indikatoren der Bundesländer. Accessed from https://www.destatis.de/DE/Themen/Gesellschaft-Umwelt/Nachhaltigkeitsindikatoren/Deutsche-Nachhaltigkeit/nachhaltigkeit-laender.html;jsessionid=54D38A4295ADAEB118584CBB6544434D.internet8732. |
[18] | German Council for Sustainable Development (RNE). Positionen zur Nachhaltigkeit – Beschluss des Oberbürgermeister Dialoges Nachhaltige Stadt vom 15. März (2017) . Accessed from https://www.nachhaltigkeitsrat.de/wp-content/uploads/2017/11/20170330_Positionspapier_OB-Dialog.pdf. |
[19] | Bertelsmann-Stiftung, Bundesinstitut für Bau-, Stadt- und Raumforschung, Deutscher Landkreistag, Deutscher Städtetag, Deutscher Städte-und Gemeindebund, et al. SDG-Indikatoren für Kommunen. Accessed from https://sdg-portal.de/de?etcc_med=SEA&etcc_par=Google&etcc_cmp=SDG-Portal-De&etcc_grp=77610014078&etcc_bky=%2Bsdg&etcc_mty=b&etcc_plc=&etcc_ctv=372525925652&etcc_bde=c&etcc_var=Cj0KCQiAhZT9BRDmARIsAN2E-J0GISNxdh9nTSbytnchr4ul2BT081rPdnHAATyrIzoKy23W1lgj2zkaAj-gEALw_wcB&gclid=Cj0KCQiAhZT9BRDmARIsAN2E-J0GISNxdh9nTSbytnchr4ul2BT081rPdnHAATyrIzoKy23W1lgj2zkaAj-gEALw_wcB. |
[20] | German Federal Government. Government Report on Wellbeing in Germany. The Federal Press Office, Berlin, May (2017) . Accessed from https://www.gut-leben-in-deutschland.de/downloads/Government-Report-on-Wellbeing-in-Germany.pdf. |
[21] | Schnorr-Baecker S. Datenangebote aus der Bundesstatistik. Erfurt; October (2019) : 49–75. Accessed from https://wirtschaft.thueringen.de/fileadmin/user_upload/Publikationen/Pub_Sammelband_Wohlfahrtsmessung.pdf. |
[22] | Schnorr-BaeckerS., Politikbegleitendes statistisches Monitoring zur Förderung von wirtschaftlichem Wohlstand und gesellschaftlichem Fortschritt für die EU und die OECD, Europa 2020 und die ‘Better Live Initiative’ der OECD im Vergleich. Nova Acta Leopoldina. 2018; NF(417): 63–101. |
[23] | Eurostat. Europe 2020 – Headline Indicators. Accessed from https://ec.europa.eu/eurostat/web/europe-2020-indicators/europe-2020-strategy/headline-indicators-scoreboard. |
[24] | European Commission. My Region, My Europe, Our Future – Seventh report on economic, social and territorial cohesion. Luxembourg, Publications Office of the European Union, (2017) . |
[25] | European Commission. Fact Sheet ‘Regional Development and Cohesion Policy beyond 2020: Questions and Answers’. Strasbourg. (2018) May 29. Accessed from https://europa.eu/rapid/press-release_MEMO-18-3866_en.htm. |
[26] | European Committee of the Regions. Localizing the SDGs – Developing sustainability strategies at the local level. Accessed from https://cor.europa.eu/de/events/Pages/localizing-SDGs.aspx. |
[27] | United Nations Climate Change. The Paris Agreement – Essential elements. Accessed from https://unfccc.int/process-and-meetings/the-paris-agreement/the-paris-agreement. |
[28] | European Commission. White Paper on the Future of Europe, Reflections and scenarios for the EU27 by 2025, COM (2017). Brussels, 1 March (2017) . Accessed from https://ec.europa.eu/commission/sites/beta-political/files/white_paper_on_the_future_of_europe_en.pdf. |
[29] | Eurostat. Sustainable Development Goals – Overview. Accessed from https://ec.europa.eu/eurostat/web/sdi/overview. |
[30] | Stiglitz JE, Sen A, Fitoussi JP. Report by the Commission on the Measurement of Economic Performance and Social Progress. Accessed from https://www.economie.gouv.fr/files/finances/presse/dossiers_de_presse/090914mesure_perf_eco_progres_social/synthese_ang.pdf. |
[31] | OECD. How’s Life? Measuring Well-being. Paris: OECD Publishing; (2011) . |
[32] | OECD. How’s Life? (2020) . Measuring Well-being. Paris: OECD Publishing. doi: 10.1787/9870c393-en. |
[33] | OECD. How’s Life in Your Region? Measuring Regional and Local Well-being for Policy Making. Paris: OECD Publishing, Paris; (2014) . |
[34] | Schnorr-BaeckerS., BoemermannH., Regionalstatistisches Datenangebot zur Fortschrittsmessung – Zum OECD-Ansatz ‘How’s Life – Measuring Well-Being’, Zeitschrift für amtliche Statistik Berlin Brandenburg, 2013; Ausgabe 2: 30–50. |
[35] | OECD. Better life index: Accessed from http://www.oecdbetterlifeindex.org/#/11111111111. |
[36] | OECD. Roundtable on Cities and Regions for the SDGs. Accessed from http://www.oecd.org/cfe/regionaldevelopment/sdgs-cities-regions-roundtable. |
[37] | United Nations Statistics Division. Fundamental Principles of National Official Statistics. Accessed from https://unstats.un.org/unsd/dnss/gp/fundprinciples.aspx. |
[38] | European Statistical System Committee. European Statistics Code of Practice – revised edition 2017. Accessed from https://ec.europa.eu/eurostat/documents/4031688/8971242/KS-02-18-142-EN-N.pdf/e7f85f07-91db-4312-8118-f729c75878c7?t=1528447068000. |
[39] | Gesetz über die Statistik für Bundeszwecke (Bundesstatistikgesetz – BStatG Bundesstatistikgesetz). Accessed from https://www.gesetze-im-internet.de/bstatg_1987/BJNR004620987.html. |
[40] | SmithA., The Wealth of Nations – Untersuchung über das Wesen und die Ursachen des Volkswohlstandes (Der Wohlstand der Nationen), Neu-Isenburg: Lizenzausgabe für Zweitausendeins; 2009. |
[41] | MaslowAH., A theory of human motivation, Psychological Review. 1943; 50(4): 370–396. |
[42] | Kahnemann D. Thinking, fast and slow. New York: Farrar, Straus and Giroux; (2011) . |
[43] | AcemogluD., RobinsonJA., Why Nations Fail – The Origins of Power, Prosperity and Poverty. London: Profile Books; Books, 2012. |
[44] | McAfeeA., More from less: the surprising story of how we learned to prosper using fewer resources – and what happens next, New York: First Scribner trade paperback edition; October 2020. |
[45] | Schnorr-BaeckerS., Ein Simulationsansatz zur Beurteilung der Güterversorgung der Bevölkerung unter räumlichem Aspekt, Gießen; 1984. |
[46] | INRIX. Stau verursacht Kosten in Milliardenhöhe. Pressemitteilung 2020; 9. März. Accessed from https://inrix.com/press-releases/2019-traffic-scorecard-german/. |
[47] | City of FrankfurtM., Klimaplanatlas für 2016, Accessed from https://www.frankfurt.de/sixcms/detail.php?id=3060&_ffmpar[_id_inhalt]=5786529. |
[48] | Federal Statistical Office and the statistical offices of the Laender. Regionalatlas. Accessed from https://www-genesis.destatis.de/gis/genView?GenMLURL=https://www-genesis.destatis.de/regatlas/AI002-1.xml&CONTEXT=REGATLAS01. |
[49] | Schnorr-BaeckerS., Regional statistical data for Germany, Europe and the world. Statistical Journal of the IAOS. 2016; 32(4): 515–535. |
[50] | Robert Koch-Institut. COVID-19-Dashboard. Accesssed from https://experience.arcgis.com/experience/478220a4c454480e823b17327b2bf1d4. |
[51] | Bayrischer Rundfunk 24. Corona-Fallzahlen in Bayern und Deutschland. Accessed from https://www.br.de/nachrichten/aktuelle-corona-zahlen-fuer-bayern-und-deutschland,SSrP9L5. |
[52] | German Council of Economic Experts (Sachverständigenrat zur Begutachtung der gesamtwirtschaftlichen Entwicklung). Overcoming the Coronavirus Crisis Together, Strengthening Resilience and Growth – Annual Report 2020/21. Wiesbaden. (2020) . Accessed from https://www.sachverstaendigenrat-wirtschaft.de/en/jahresgutachten-2020.html. |
[53] | Federal Statistical Office of Germany. Volkswirtschaftliche Gesamtrechnungen, Inlandsproduktberechnung, Lange Reihen ab 1970, Fachserie 18 Reihe 1.5. Wiesbaden; 4. September (2020) . Accessed from https://www.destatis.de/DE/Themen/Wirtschaft/Volkswirtschaftliche-Gesamtrechnungen-Inlandsprodukt/Publikationen/Downloads-Inlandsprodukt/inlandsprodukt-lange-reihen-pdf-2180150.pdf?__blob=publicationFile. |
[54] | Schnorr-Baecker S. Geospatial data for measuring, economic growth – what can we learn from official statistics? Geospatial World Forum, Rotterdam; (2016) . Accessed from https://geospatialworldforum.org/speaker/SpeakersImages/geospatial-data-for-measuring-economic-growth.pdf. |
[55] | Federal Statistical Office of Germany. Fertiggestellte Wohnungen in Gemeinden 2018. Accessed from https://www.destatis.de/DE/Service/Statistik-Visualisiert/Gemeindekarte.html. |
[56] | Postbank. Wohnatlas 2020. Accessed from https://www.presseportal.de/pm/6586/4565061. |
[57] | Postbank. Postbank Wohnatlas 2020 – Langfristiger Aufwärtstrend am Immobilienmarkt. Accessed from https://www.presseportal.de/pm/6586/4706834. |
[58] | PaponK., Immobilien im Osten sind viel günstiger, Frankfurter Allgemeine Zeitung. 2020; 11. November: 23. |
[59] | ScherffD., Der Immobilienmarkt ist stabil wie Beton, Frankfurter Allgemeine Sonntagszeitung. 2020; 8. November: 24. |
[60] | Federal Ministry of the Interior, Building and Community. DerDeutschlandatlas. Accessed from https://www.deutschlandatlas.bund.de/DE/Karten/Unsere-Gesundheitsversorgung/123-Versorgungsgrad-Hausaerzte.html. |
[61] | Federal Statistical Office of Germany. Zufriedenheit der Bürgerinnen und Bürger mit behördlichen Dienstleistungen. Wiesbaden; April (2018) . |
[62] | UhrAE., Telemedizin bereichert die Gesundheitsversorgung, Frankfurter Allgemeine Zeitung. 2020; 11. November: V3. |
[63] | Federal Statistical Office of Germany. KORREKTUR – 46% weniger Fahrgäste im Fernverkehr mit Bussen und Bahnen im 1. Halbjahr 2020. Pressemitteilung Nr. 424. 2020; 28. Oktober. Accessed from https://www.destatis.de/DE/Presse/Pressemitteilungen/2020/10/PD20_424_461.html. |
[64] | DEKRA. Destatis: Weniger Verkehrstote und Verletzte. 21 August (2020) . Accessed from https://www.dekra.net/de/destatis-verkehrstote-verletzte/. |
[65] | German Association for Waste Management. Position: Auswirkungen der Corona-Krise auf die Abfallwirtschaft in Deutschland, Die DGAW wagt eine Prognose zur Mengenentwicklung der Abfallströme. Berlin; (2020) . Accessed from https://www.vku.de/fileadmin/user_upload/Verbandsseite/Sparten/Abfall/Corona_Abfallwirtschaft/2020-04-21_Prognose_zu_den_Auswirkungen_der_Coronakrise_auf_die_Abfallwirtschaft_in_Deutschland_final.pdf. |
[66] | GEWOS. Prognose: Deutsche Metropolen wachsen nicht mehr so stark. Wirtschaftswoche; 20. November (2020) . Accessed from https://www.wiwo.de/politik/deutschland/prognose-deutsche-metropolen-wachsen-nicht-mehr-so-stark/26643174.html. |
[67] | Federal Ministry of Transport and Digital Infrastructure. Der Breitbandatlas. Accessed from https://www.bmvi.de/DE/Themen/Digitales/Breitbandausbau/Breitbandatlas-Karte/start.html. |


