
Seasonal adjustment of Irish official statistics during the COVID-19 crisis
Abstract
As experienced worldwide, the COVID-19 outbreak has had a severe impact on Irish society and the economy. The impact of the pandemic is evident in most of the Irish infra-annual socio-economic times series statistics. In terms of seasonal adjustment these effects cannot be ignored. The COVID-19 effects on time series data need to be identified and treated to ensure that seasonally adjusted data is trustworthy, accurate and reliable. Dealing with the COVID-19 effects poses both statistical and logistical challenges. The Central Statistics Office (CSO) in Ireland has taken a pro-active approach to seasonal adjustment during this crisis, using intervention models from the onset of the pandemic. Adopting intervention models from the beginning of the pandemic provides meaningful real-time statistics to our users as the impact of this crisis unfolds and will hopefully avoid large scale future revisions. This paper outlines the statistical framework that underpins our seasonal adjustment response and describes how the CSO responded to the COVID-19 crisis in terms of seasonal adjustment.
1.Introduction
COVID-19 is a deadly disease and has been devastating in terms of lives lost worldwide. Within Ireland the official emergency response to the virus has been in line with the advice of the World Health Organisation and the European Centre for Disease Prevention and Control. In managing the risks posed by the pandemic severe restrictions have been placed on both society and economic activities. To produce meaningful real-time data during the crisis, it is of critical importance to users of official statistics that the socio-economic effects of COVID-19 are fully reflected in the infra-annual time series.
Most of the short-term statistics produced by the CSO are seasonal in nature. Seasonal adjustment, the statistical process used to identify and filter out seasonal fluctuations and calendar effects, is a central process in the analysis and interpretation of time series data. Seasonal fluctuations and calendar effects, if present in the data, tend to mask short and long-term movements in a time series and can impede a clear understanding of the underlying evolution of the data.
The COVID-19 effects, if evident in time series data are obviously atypical events and when proven to be statistically significant are regarded as outliers in the data. However, atypical events pose challenges to the estimation of high quality seasonally adjusted data. Firstly, their presence impedes the accurate and reliable estimation of the seasonal components. Secondly, the failure to accurately estimate the seasonal component, results in the impact of these outliers not being fully reflected in the final seasonally adjusted data. Therefore, if COVID-19 effects are ignored, published seasonally adjusted data may be of poor quality and may provide misleading signals on the state of the economy and society.
However, within official statistics, the field of seasonal adjustment has continually developed over the past number of years aided in no small part by international collaboration. Continuous improvements have provided statistical agencies with the seasonal adjustment techniques, support and open source software to tackle the challenges posed by the COVID-19 crises.
The COVID-19 pandemic has obviously placed constraints on the production of official statistics for example; normal communication channels have been fragmented, data collection has been disrupted and statistical offices have closed with workers operating remotely.
This paper outlines how Ireland addressed these logistical and statistical challenges in terms of the seasonal adjustment of official statistics. The structure of the remainder of the paper is as follows. Section 2 outlines the broad statistical framework the CSO operates under in terms of seasonal adjustment. Section 3 highlights the statistical challenges encountered, as well as providing potential solutions when seasonally adjusting time series impacted by COVID-19. Section 4 explains how Ireland are addressing the statistical and logistical seasonal adjustment challenges posed by the crisis. Section 4 also provides specific examples of seasonal adjustment models developed by the CSO during the crisis.
2.The seasonal adjustment statistical framework
2.1The European Dimension
The CSO, Ireland operates within the European Statistical System (ESS) seasonal adjustment framework. Over the years, many CSO statisticians have benefited from the European Statistical Training Programme (ESTP) courses and workshops on seasonal adjustment methods and software tools. The training courses have allowed our statisticians to network with some of the foremost seasonal adjustment experts and practitioners in Europe and further afield. The ESTP training and networking opportunities have been invaluable in building the statistical capacity of the CSO in terms of seasonal adjustment and have been a major catalyst in the improvements of the CSO’s practices, policies and procedures in this area.
The CSO has been actively involved in the ESS Seasonal Adjustment User Group (SAUG) and has benefitted greatly from the work and expertise offered by the ESS Seasonal Adjustment Centre of Excellence (SACE) and the ESS Seasonal Adjustment Expert Group (SAEG). These groups, working collaboratively, have championed best practice in seasonal adjustment and have delivered tangible tools and resources in the form of; training delivered, a seasonal adjustment helpdesk, workshops, updated ESS guidelines on seasonal adjustment [1], a comprehensive handbook on seasonal adjustment [2] and the open source seasonal adjustment software package JDemetra+ [3].
2.2The CSO’s seasonal adjustment approach
The CSO has developed its own seasonal adjustment policy [4] which is fully compliant with the principles outlined in the ESS guidelines on seasonal adjustment. The CSO uses the semi-parametric X-13ARIMA-SEATS program [5] to conduct seasonal adjustment. This program initially fits a regARIMA regression model to a time series, adjusting for outliers, trading-day effects and holiday effects, and then forecasts the series forward. This extended series is then seasonally adjusted using the Census Bureau’s X-11 algorithm. A comprehensive explanation of the X-11 method is provided by Ladiray and Quenneville [6]. TRAMO-SEATS is the other seasonal adjustment approach recommended in the ESS guidelines. The CSO’s preference for the X-13ARIMA approach is based purely on the continual use of the X-11 family of methods within the office over many years.
Divisions and individual Sections/Domains within the CSO are normally responsible for the seasonal adjustment of their time series. The Methodology Division provides support and guidance to these areas. In general, the CSO adopts a partial concurrent adjustment approach to seasonal adjustment. With this approach, ARIMA models, filters, outliers and calendar regressors are re-identified once a year and then fixed for the year. With this method the parameters and seasonal factors are re-estimated and updated every time new or revised data becomes available.
The CSO’s Methodology Division supports two seasonal adjustment software packages within the office. JDemetra+ is widely used throughout the office, however, many divisions also use WIN-X13, the software package developed by the US Census Bureau.
3.Modelling the statistical impact of COVID-19 on seasonal adjustment
3.1Seasonal adjustment with the presence of outliers
A time series (Y) may be decomposed into 5 separate distinct components: seasonal components (S), trading day effects (D), moving holidays effects (H), a trend-cycle (C) and an irregular component (I). Trading days and moving holidays are referred to as calendar effects. The trend-cycle is estimated in X-13ARIMA-SEATS as one component as opposed to two separate components. These components are traditionally modelled as either an additive decomposition or a multiplicative decomposition as follows:
(1)
(2)
Dagum and Mazzi [7] provide a comprehensive description of the composition of time series components.
Seasonal adjustment is concerned with identifying the seasonal fluctuations and calendar effects within a time series and then subsequently removing these fluctuations from the data. To achieve this goal the process of seasonal adjustment may be viewed as occurring in two distinct phases. In the first pre-treatment phase calendar effects are identified and removed from the data and in the second seasonal adjustment phase algorithms are applied to identify the seasonal components in the time series. The identified seasonal components are then subsequently removed and the final seasonally adjusted data, stripped of the seasonal components and calendar effects, therefore contains just the trend-cycle component and the irregular component.
However, the accurate estimation of both calendar effects and the seasonal components can be impacted by the presence of outliers. Outliers are abnormal values in the data. Therefore, outliers, if present in the data, also need to be removed from the data before the seasonal adjustment components can be accurately estimated. Outliers are estimated in the first phase of the seasonal adjustment together with any calendar effects that are present in the data. Both X-13-ARIMA-SEATS and TRAMO-SEATS use RegARIMA models to estimate and remove the calendar effects and the outliers in first phase of the seasonal adjustment process. Mehrhoff [8] provides a detailed description of RegARIMA models and their application in the pre-treatment of seasonal data.
In general, outliers should be visible in the final seasonally adjusted data. Therefore, once the seasonal components have been identified and removed from the data the outliers are reintroduced back into the data. Depending on the nature of the outliers their effect will form part of either the trend-cycle component or the irregular component of the final seasonally adjusted data. The seasonal adjusted data should then reflect some noise, some real news, and the trend evolution including any turning points.
3.2Seasonal adjustment with the presence of COVID-19 effects
The COVID-19 crisis has caused severe disruptions to socio-economic activity and these disruptions are evident in the data. If left untreated, these disruptions will also have a severe impact on the quality of any seasonal adjustment. The COVID-19 distortions are unlikely to be seasonal or calendar effects and must therefore be handled as outliers. When tackling the COVID-19 crisis in terms of seasonal adjustment we are primarily focused on the RegARIMA part of the process and more pragmatically, in real-time, we are concerned with the regression component of the pre-treatment.
X-13-ARIMA-SEATS and TRAMO-SEATS have several built-in regression variables in their respective programs that effectively model specific types of outliers. The software allows these outlier variables to be easily included into the RegARIMA models. Once the models are estimated the statistical significance of the regression parameters can then be assessed using standard
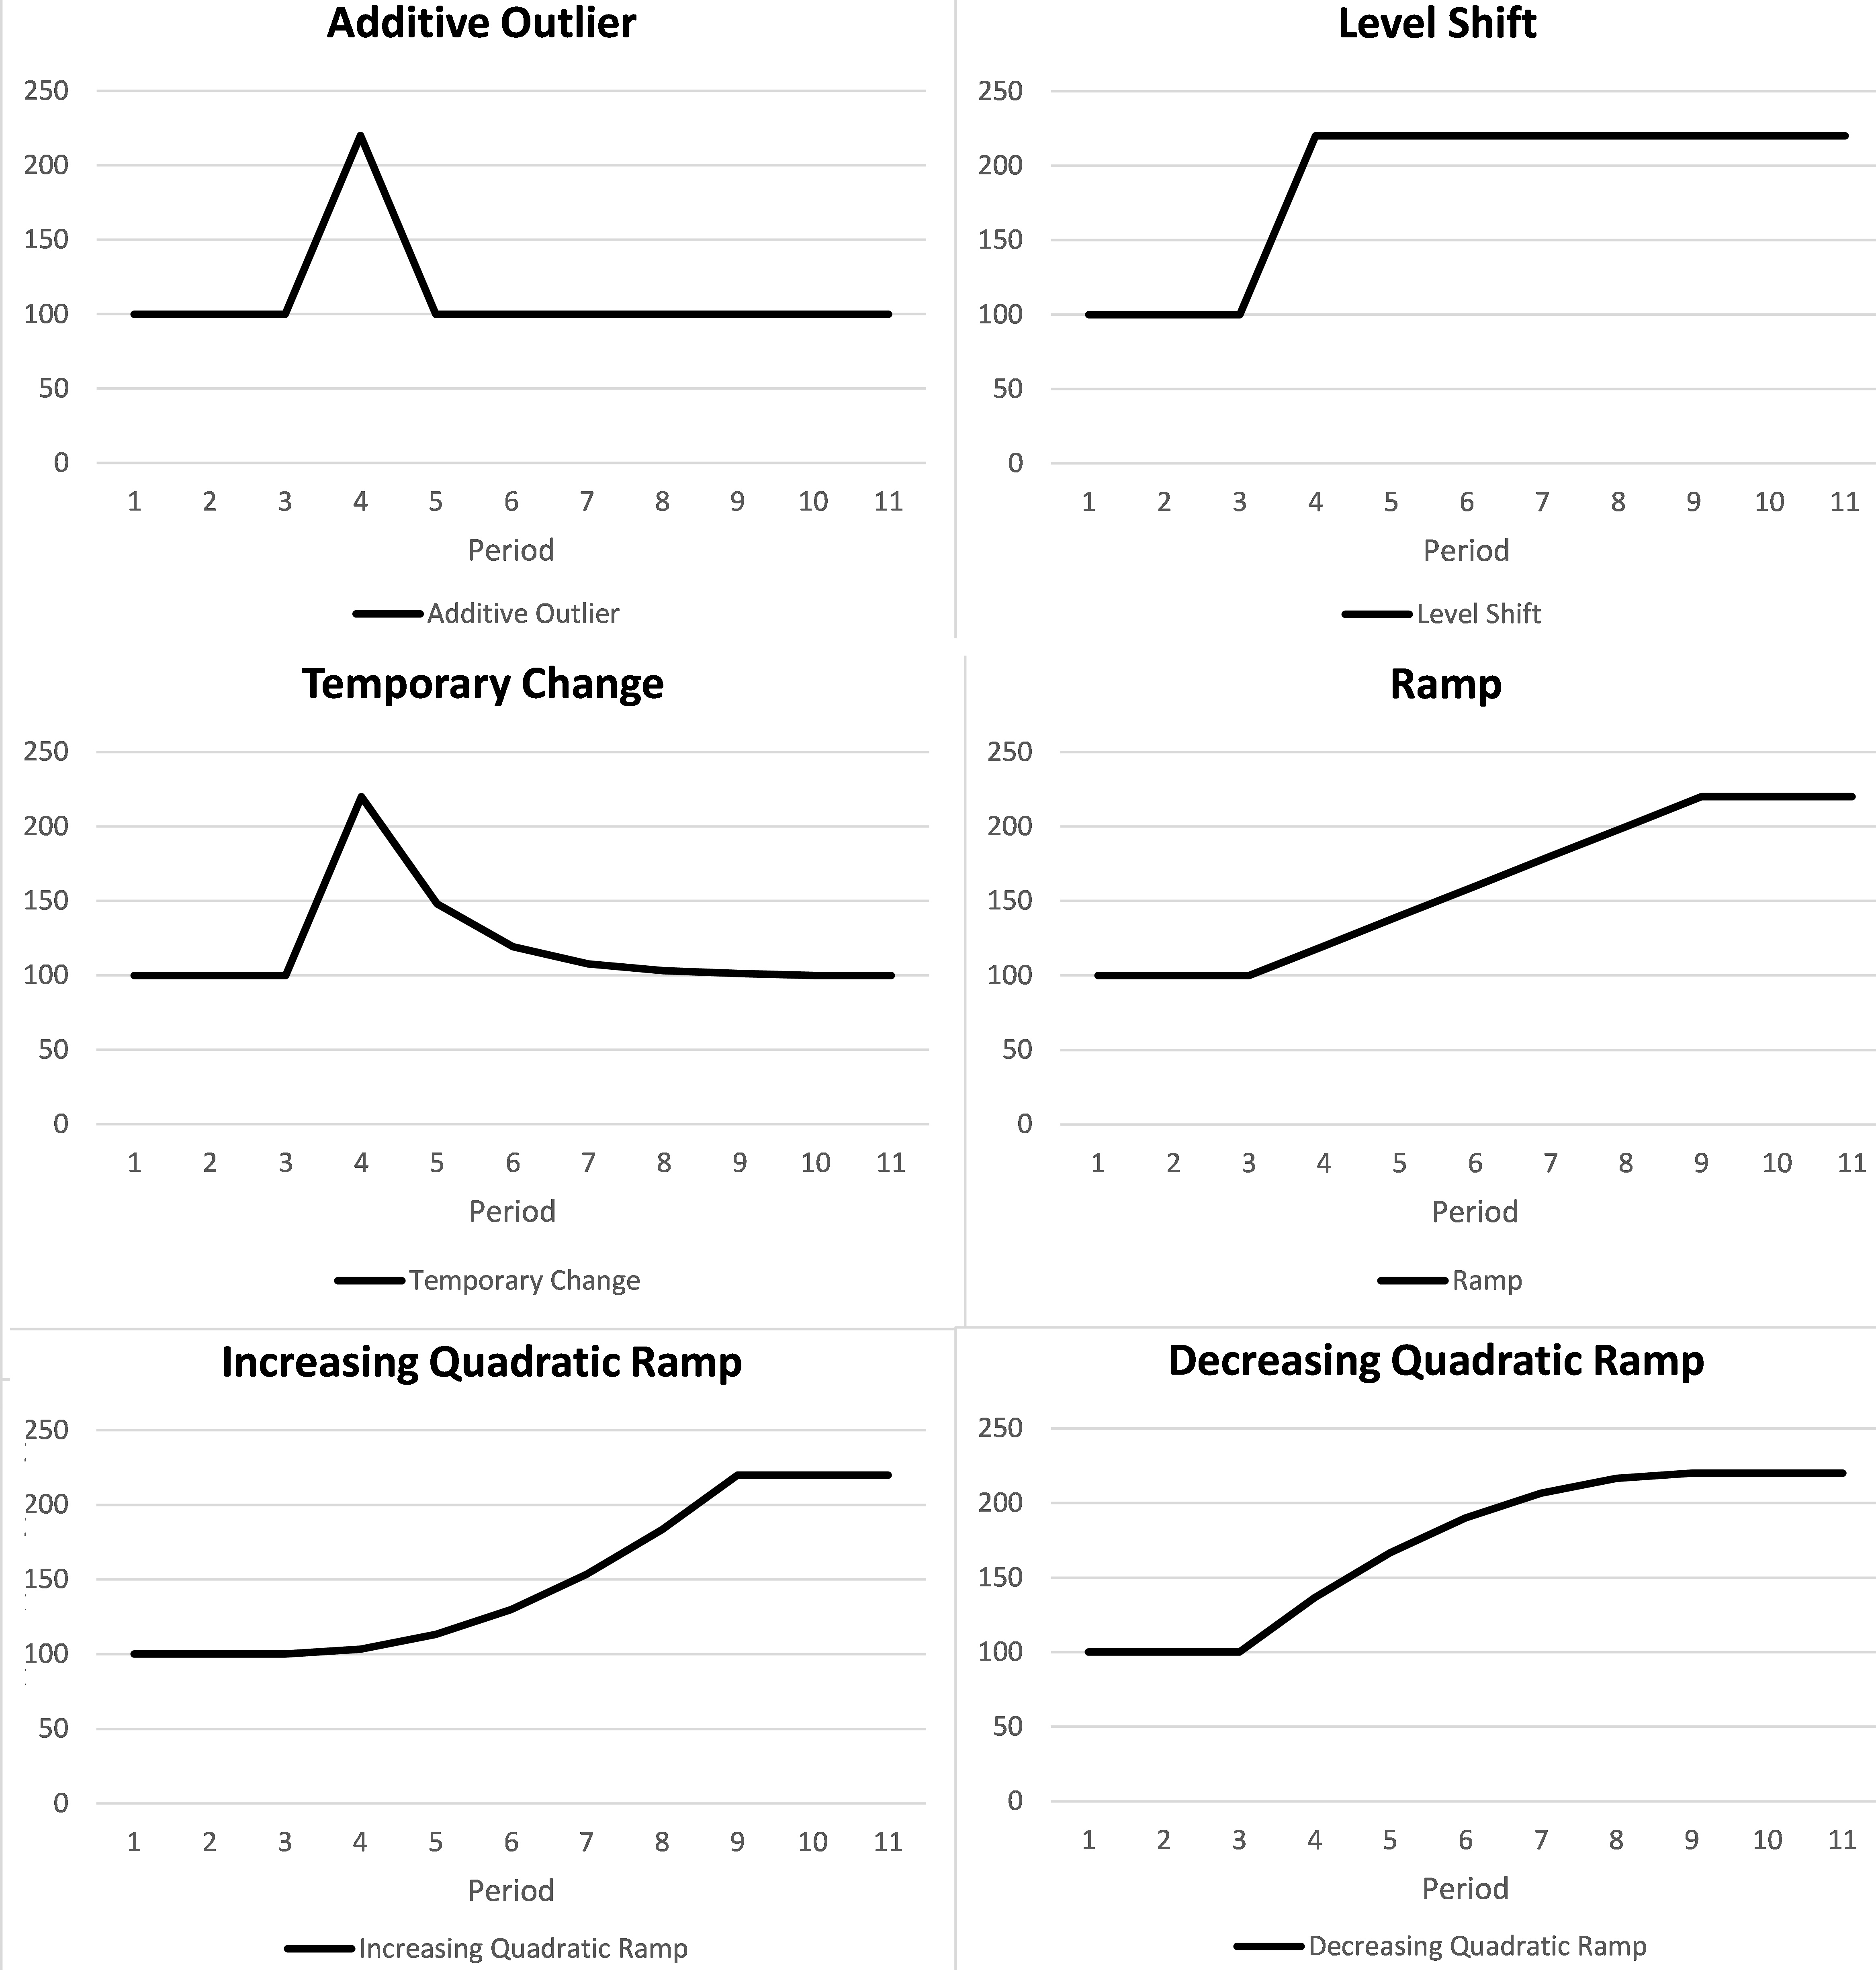
In terms of modelling the COVID-19 crisis, the most relevant prespecified outliers available in the software are; additive outliers (AOs), temporary changes (TCs), level shifts (LSs), linear ramps (RPs) and quadratic ramps (QDs and QIs). These outliers are simplified forms of the intervention effects outlined by Box and Tiao [9]. These outliers, in isolation or in a sequence, can provide reasonable approximations of more complex dynamic intervention effects [5]. A schematic of these outliers is provided in Fig. 1.
Figure 1.
Schematic of six prespecified outliers.
A more detailed discussion of the nature, detection and treatment of outliers may be found in Mehrhoff [8] and in U.S Census Bureau [5].
Briefly, an AO is an abnormal value that occurs at an isolated point in the series. Any abnormal event at the last point of a time series is modelled as an AO. AOs at the endpoint of a series should be reviewed as additional data points become available to see if they can plausibly be replaced by another type of outlier.
A TC is a non-sustained change in the level of a time series. In the case of a TC, after the initial change in the level of the series, the series returns to its the original level, rapidly and at an exponential rate.
A LS represents an abrupt but sustained or permanent change in the underlying level of a time series. Ramps are like a LS but allow for a less abrupt smoother transition from one level to another over a specified period. The ramps can be modelled as either linear or quadratic ramps. The linear ramp allows for a constant rate of change in the level over the specified period while quadratic ramps allow for a non-constant rate of change. With the increasing quadratic ramps (QI) the rate of change increases over time and in the case of the decreasing quadratic ramps (QD) the rate of change decreases over time [5, 10]. Therefore, QIs and QDs have different shapes.
Outliers should be evident in the final seasonally adjusted data. AOs and TCs are assigned to the irregular component and therefore should not be evident in the trend. LSs, RPs, QDs and QIs are, on the other hand, assigned to the trend.
Other than dealing with the intervention effects caused by COVID-19 the seasonal adjustment models are in general being fixed until the next annual reviews. This is in keeping with CSO policy and the partial concurrent approach to seasonal adjustment. ARIMA models and calendar effects are not being changed prior to the next scheduled annual model reviews. In real-time, model criteria such as the AICC are not being used as a criterion for determining the appropriateness of including or excluding any COVID-19 intervention effect.
When modelling any abnormal event, it may be challenging to establish with certainty the exact nature or form of the outlier to include. Subject matter expertise, statistical tests and pragmatism should be helpful in establishing the plausibility of a particular type of outlier. It may also be required to change the outlier’s type as more information becomes available. However, it should be noted that in official statistics we are primarily tasked with disseminating seasonally adjusted data rather than with the publication of the trend-cycle or the irregular component separately. Mehrhoff [8] concludes that from a seasonal adjustment point of view it is more important that interpretable outliers are not assigned to the seasonal component, rather than differentiating whether the effect of an outlier should be assigned to the trend-cycle or the irregular component.
3.3Determining the statistical significance of COVID-19 outliers
Under normal circumstances, an attractive feature of the seasonal adjustment software is the automatic detection and insertion of outliers into the RegARIMA models. However, when modelling the COVID-19 crisis this approach is not recommended. The threshold set for the automatic inclusion of an outlier is deliberately set at a much higher levels than what is considered typical in time series analysis. A t-statistic value approaching 4 or higher is usually required before an outlier is automatically included.
However, because we have a-priori expectations of the existence and the location of COVID-19 effects, a more standard approach of manually identifying and including the COVID-19 adjustments into our RegARIMA models should be adopted. Therefore, we initially identify potential COVID-19 effects based on expert knowledge of the data and then test these intervention effects for their statistical significance at the 5% level of significance, i.e. a critical
4.COVID-19 adjustments in seasonal adjustment models, the CSO approach
4.1Logistical issues
The impact of COVID-19 hit Ireland in mid-March 2020, a few weeks after it had already begun to dramatically affect other countries in Europe. At this time, the Irish economy went into lockdown and the vast majority of CSO staff were instructed to work from home. What was evident at this early stage of the pandemic was that whilst it was extremely challenging to operate in this remote working environment it was also of critical importance that robust, reliable and timely infra-annual statistics be made available to our users. Both our data providers and the CSO staff charged with collecting and cleaning this data are meeting this challenge. In fact, so far, throughout the crisis the timeliness of the CSO’s short-term statistics has not deteriorated
Early in the crisis the Methodology Division of the CSO identified that seasonal adjustment would be a critical component in the production of high-quality meaningful short-term statistics. A communication from Methodology was sent around to all Divisions involved in the dissemination of short-term statistics highlighting the seasonal adjustment challenges in modelling the unfolding crisis correctly. Within this note it was made clear that the CSO, and more specifically the Methodology Division, had the expertise, methods and tools to deal with the seasonal adjustment challenges. Eurostat also released a comprehensive methodological note [11], widely circulated within the CSO, providing excellent guidance on the treatment of COVID-19 in seasonal data. The CSO’s response is very much aligned with Eurostat’s note and is built on the guidance provided.
The Methodology Division offered to play a more pro-active role in the seasonal adjustment within the office. This offer was widely accepted and resulted in Methodology taking on the seasonal adjustment of most series, for the period of the crisis. In other cases, Methodology have worked alongside the survey owners providing guidance and support.
The centring of the process of seasonal adjustment around a small team in the Methodology Division has ensured a harmonised and coherent approach to modelling the crisis within the CSO. A major benefit of Methodology’s direct involvement in the seasonal adjustment process was that it presented specialists the opportunity to ensure all important series were compliant with ESS and CSO guidelines. Series that had not undergone an annual review or had some other addressable quality issues were updated in accordance with best practice prior to dealing with the COVID-19 effects. Therefore, when it came to modelling the crisis the analysts could focus their efforts solely on the COVID-19 adjustments required.
Table 1
COVID-19 models for selected series, CSO, Ireland
| Series nam | Period | Span | ARIMA mode | COVID-19 adjustments | COVID-19 adjustments |
|---|---|---|---|---|---|
| Monthly Services Index: Accommodation and Food Service Activities (NACE 55, 56) | Monthl | 2009.01 to 2020.10 | (0 1 1)(0 1 1) | LS2020.Mar LS2020.Apr LS2020.Jun LS2020.Jul LS2020.Aug AO2020.Oct | [t |
| Retail Trade | Monthl | 2005.01 to 2020.10 | (0 1 2)(0 1 1) | LS2020.Apr LS2020.May LS2020.Jun | [t |
| Production in Building & Construction Inde | Quarterl | 2000.01 to 2020.03 | (1 1 2)(0 1 1) | TC2020.2 | [t |
| Vehicle Licencing: New Private Car | Monthl | 1998.01 to 2020.11 | (1 1 2)(0 1 1) | LS2020.Mar LS2020.Apr QD2020.May-2020.Sep AO2020.No | [t |
Figure 2.
Monthly Services Index: Accommodation and Food Service Activities (NACE 55, 56) CSO.
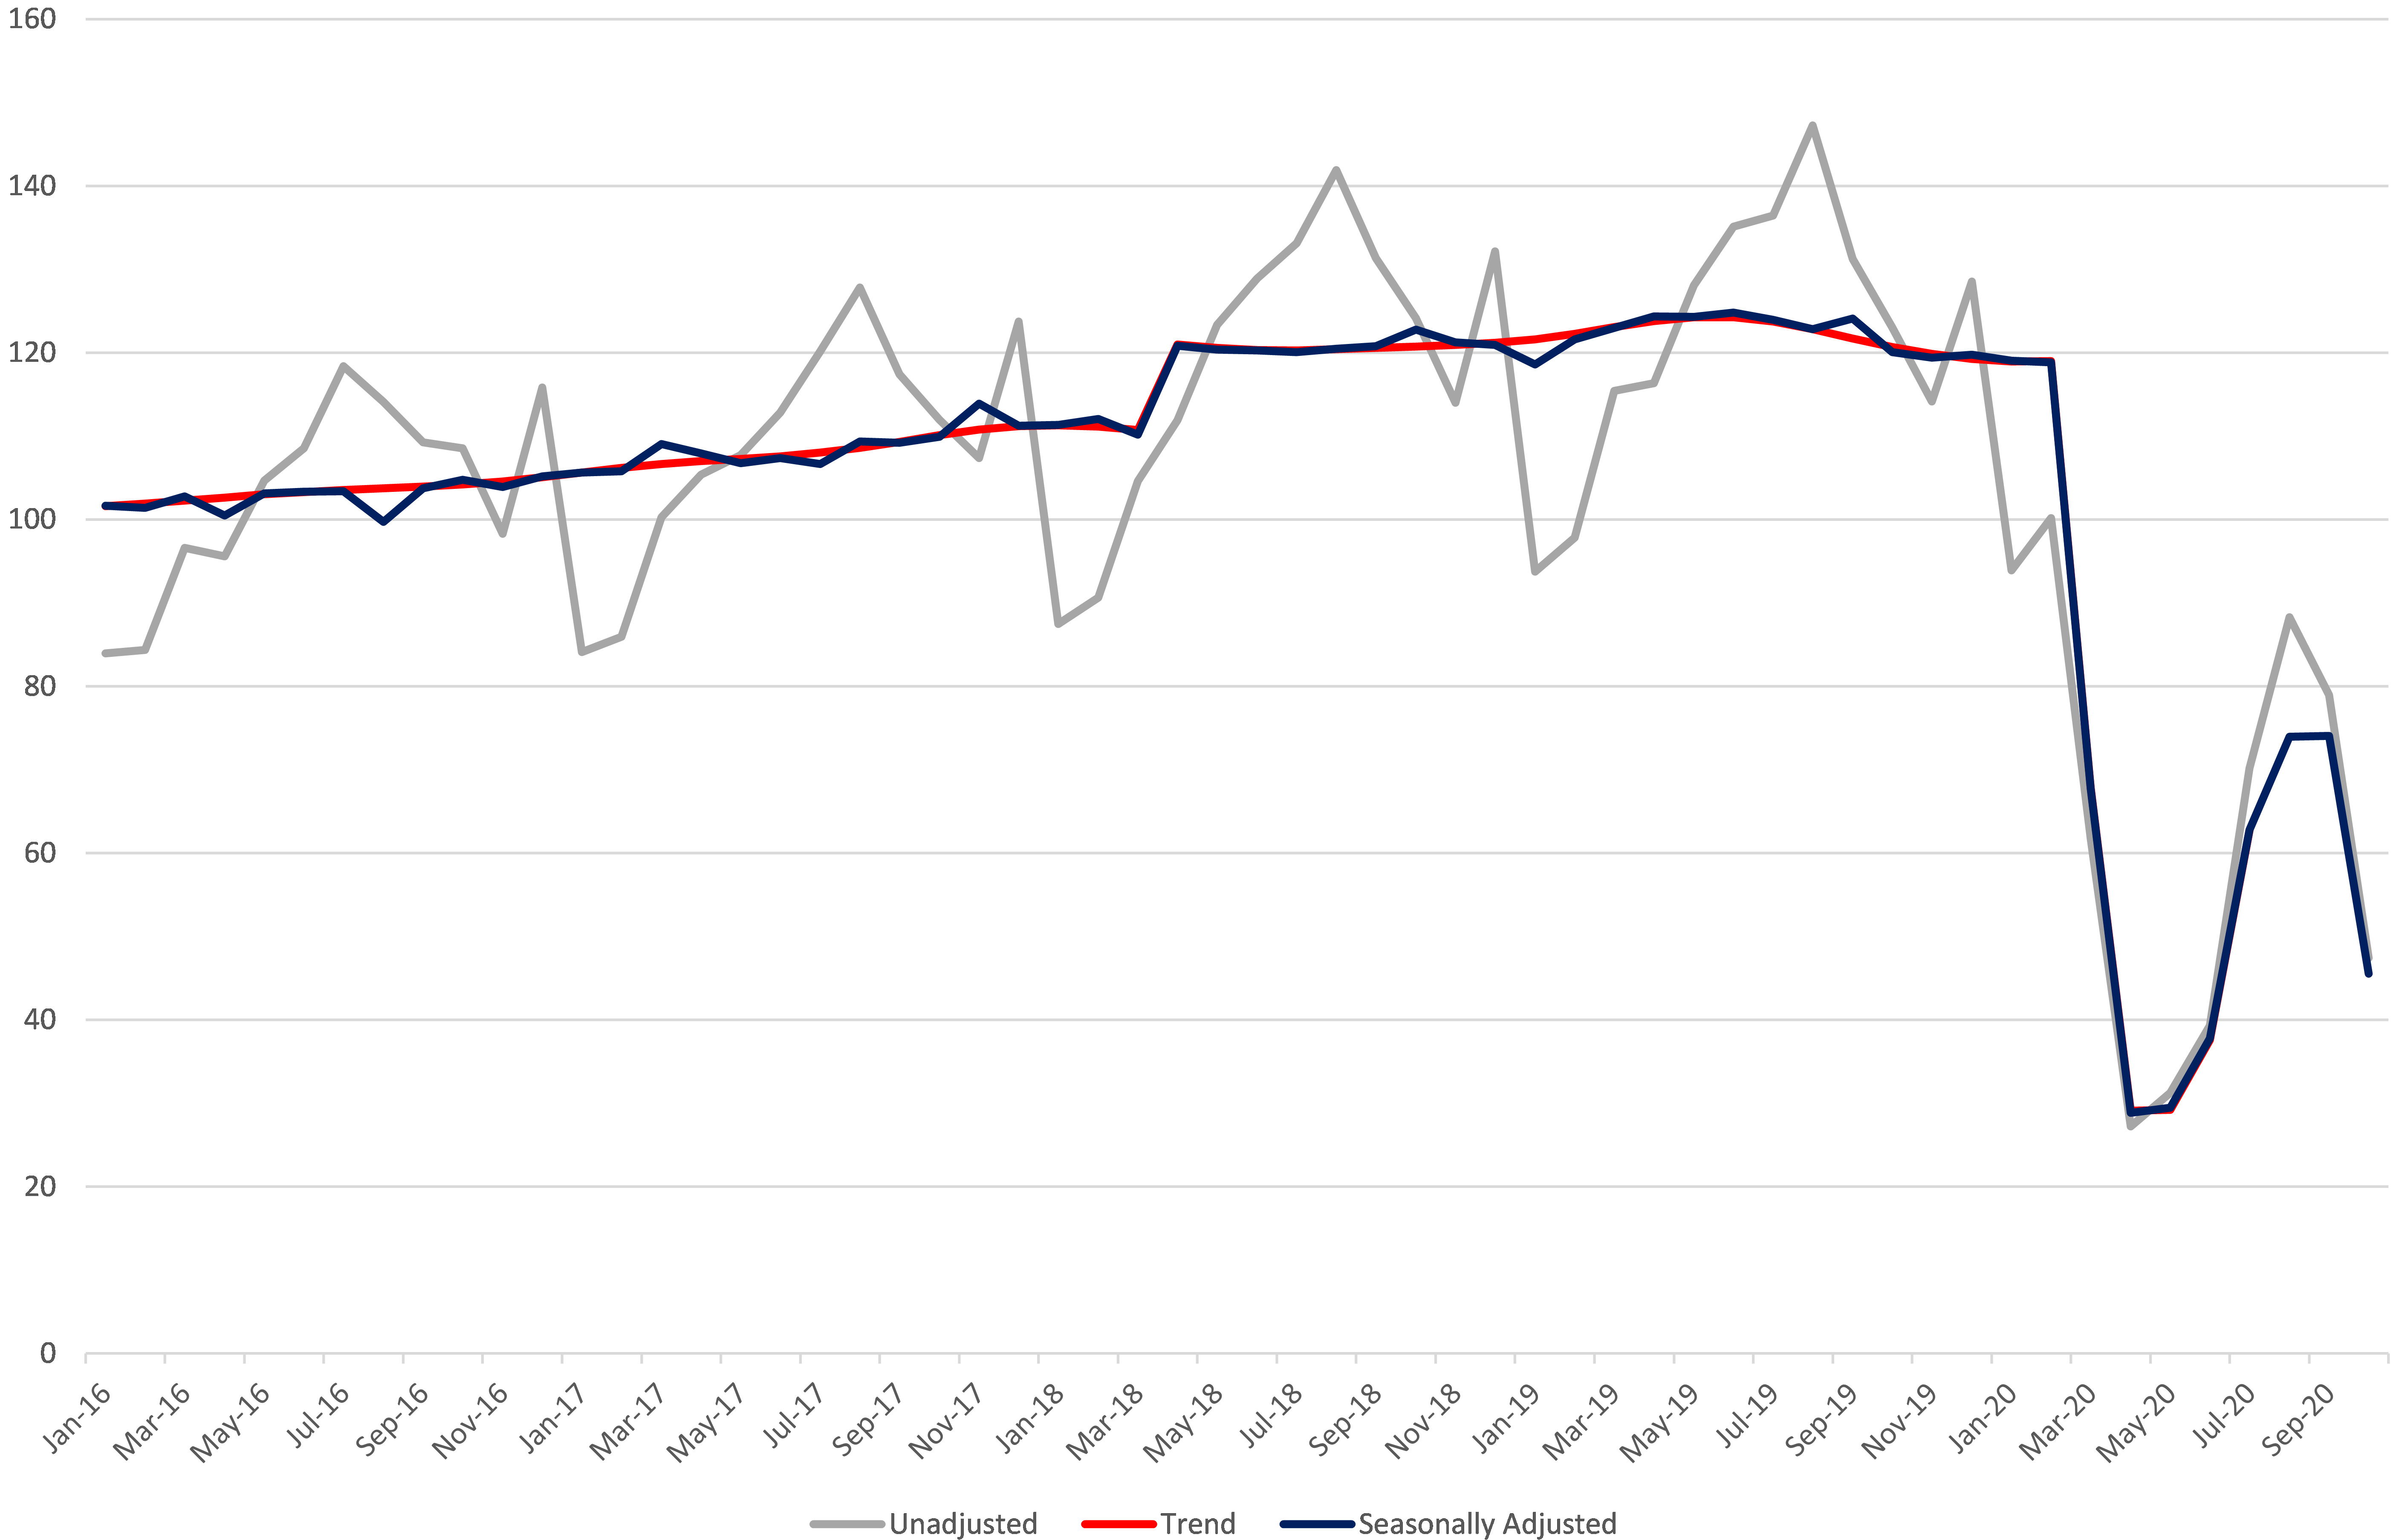
Figure 3.
Retail Trade, CSO.
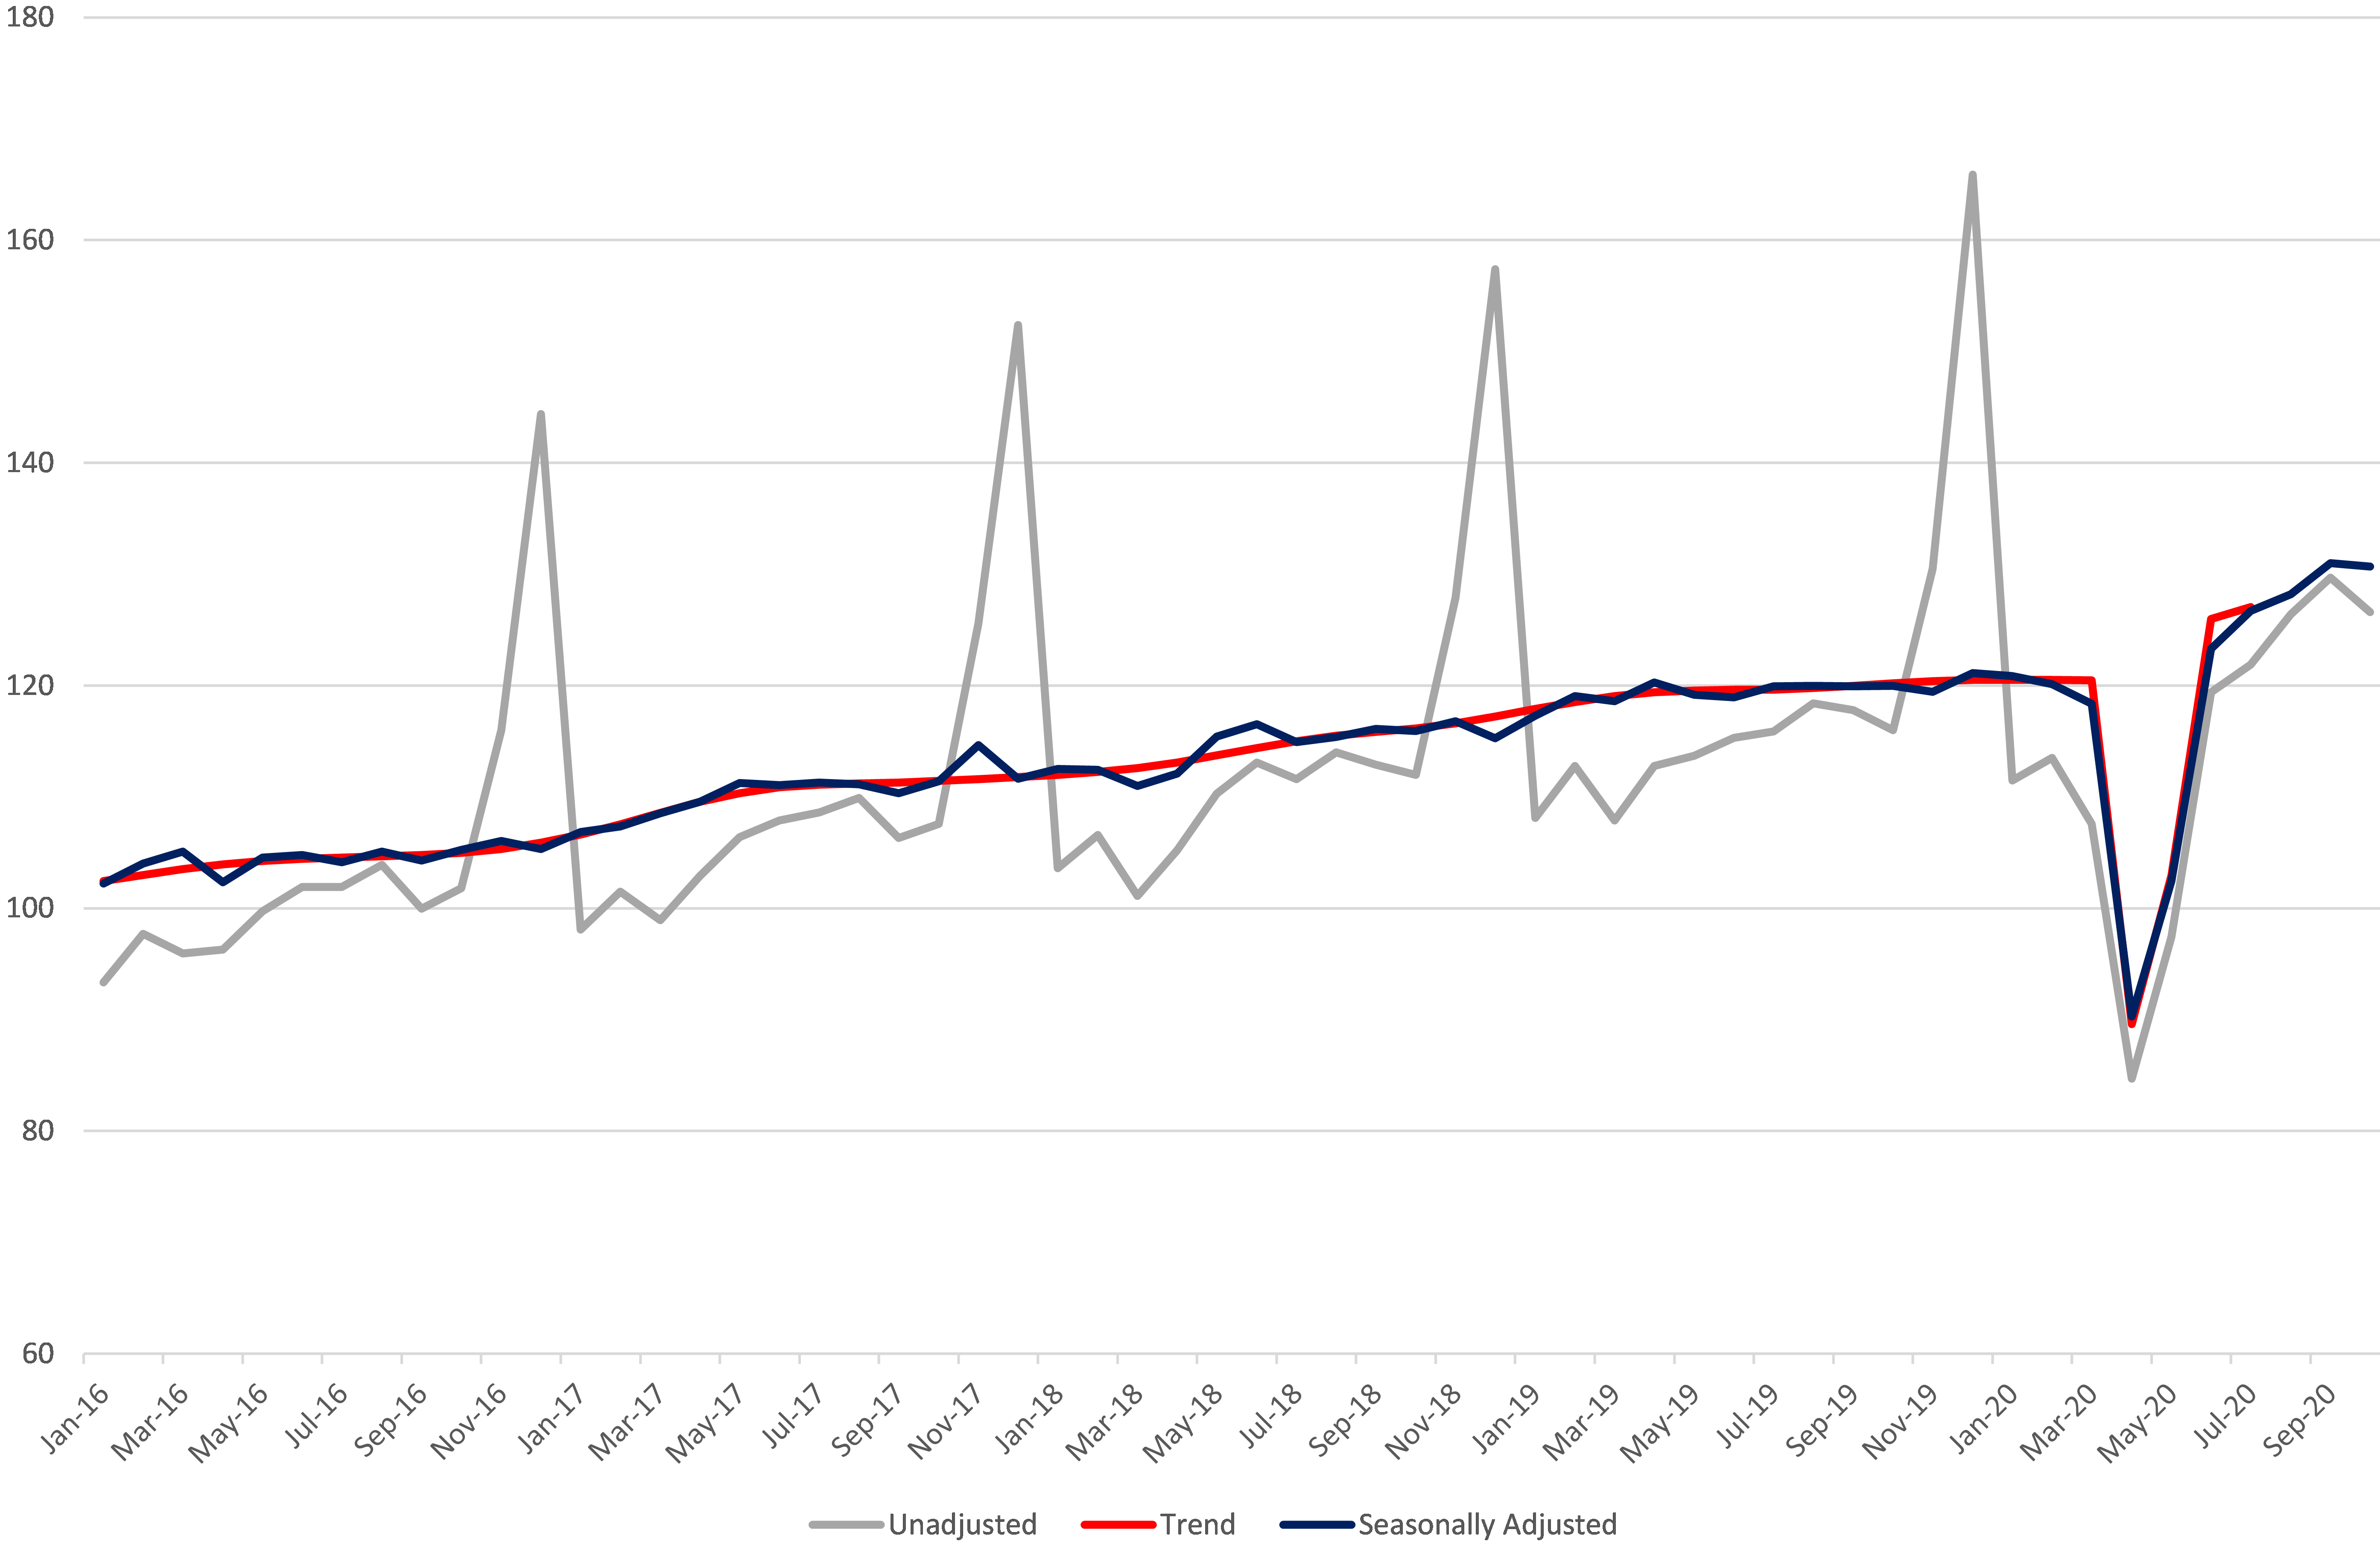
Figure 4.
Production in Building & Construction Index, CSO.
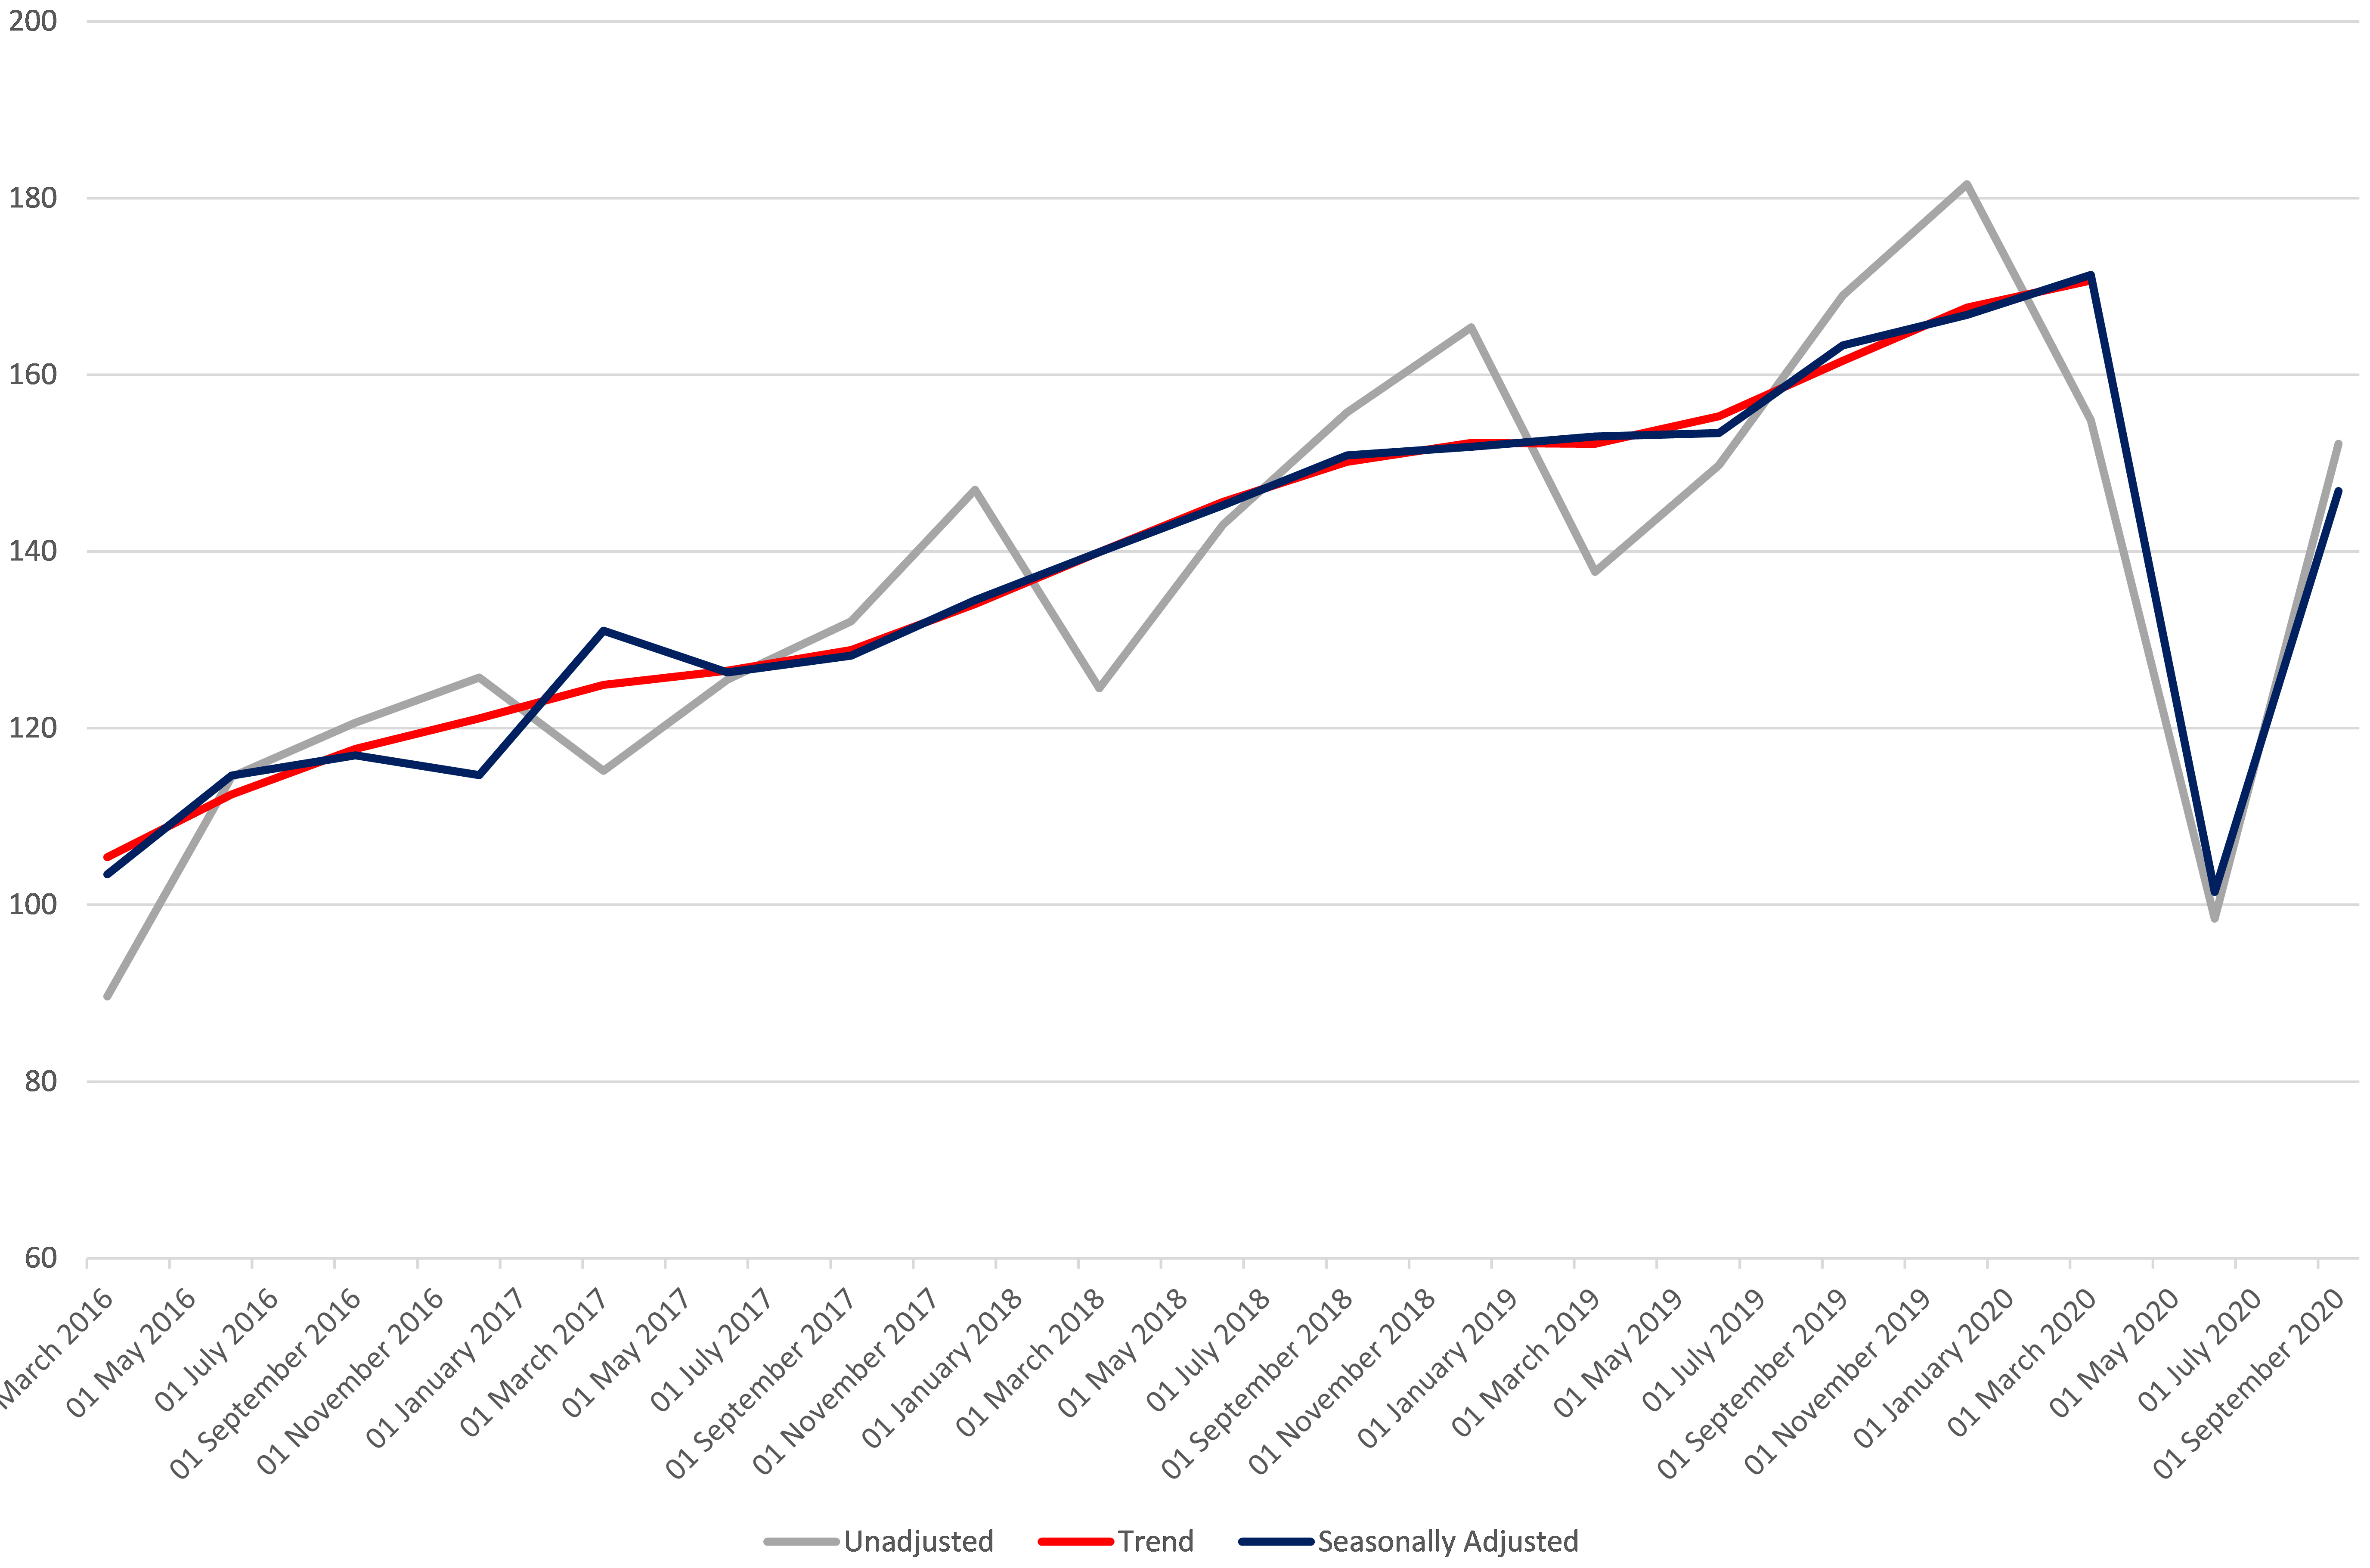
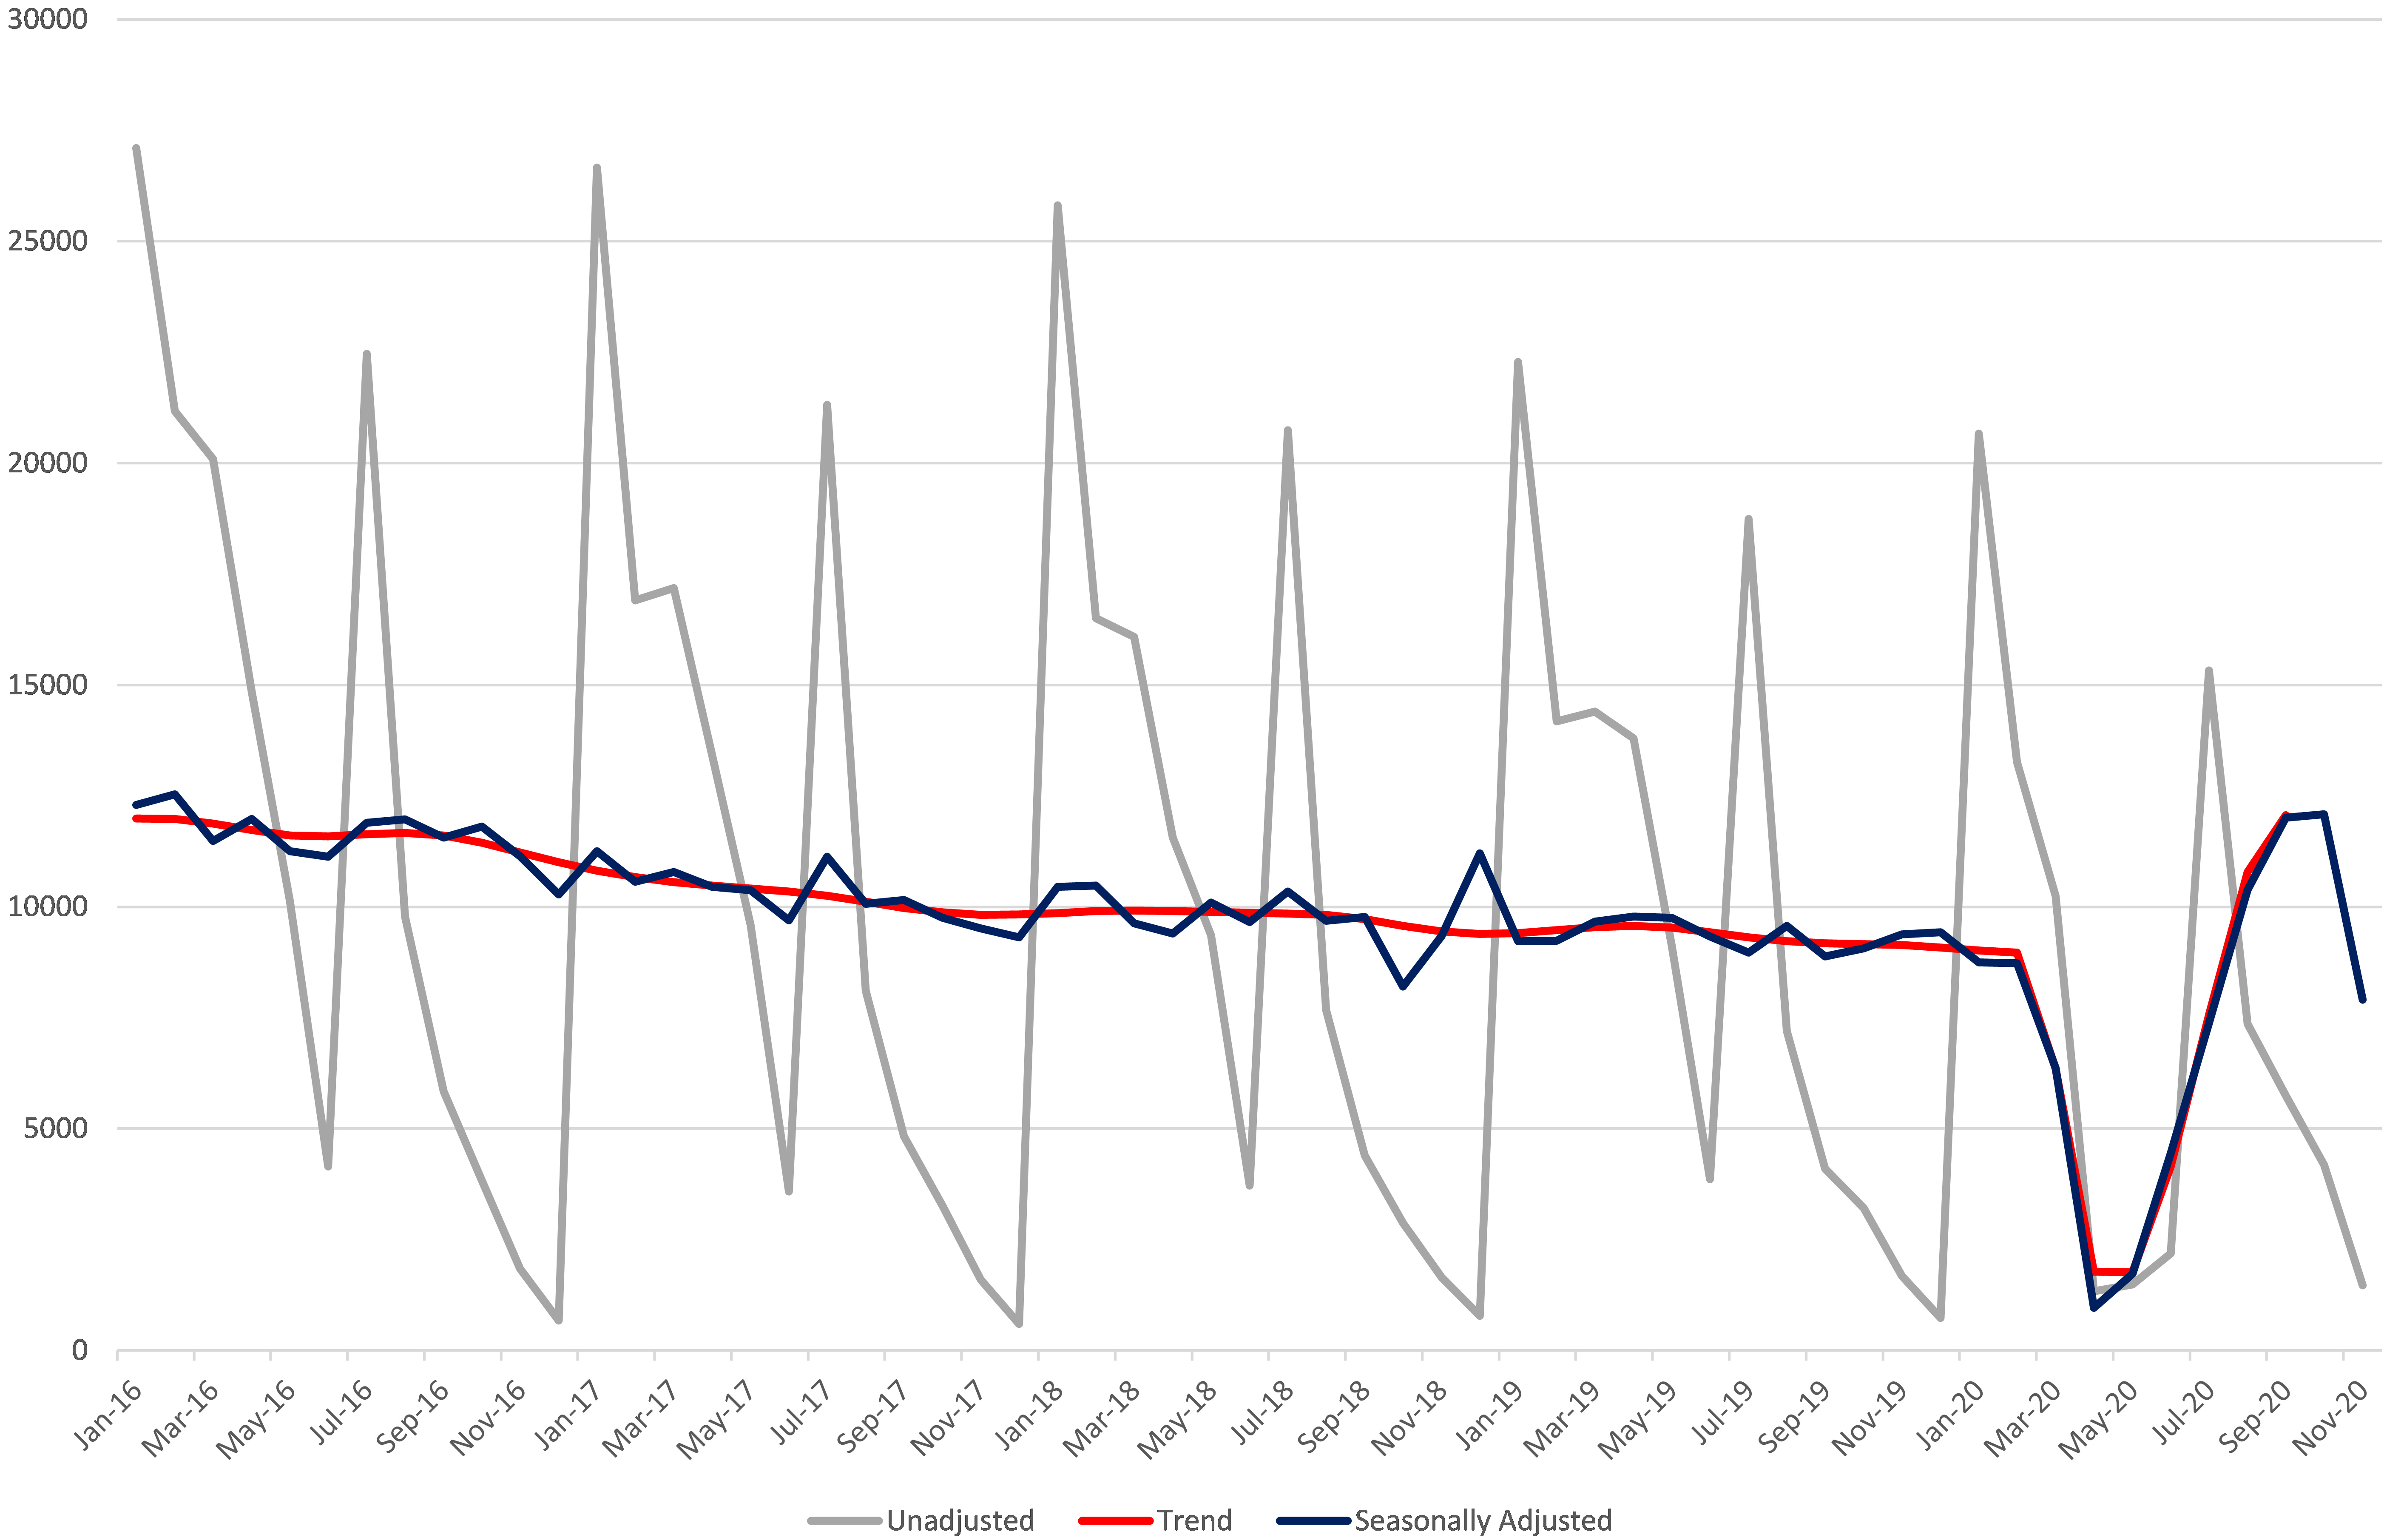
Figure 5.
Vehicles Licensed for the First Time: New Private Cars, CSO.
4.2The use of intervention models
Methodology have adopted a very pro-active approach to modelling the most important seasonal series. Using intervention models, the CSO followed closely the approach outlined by Lytras and Bell [10] who had retrospectively re-modelled the recession effects of the 2008–2009 financial crash on the seasonal adjustment of 23 US time series. They found that in all 23 cases, adding the intervention terms substantially improved model fit.
The first evidence of a clear COVID-19 impact on CSO official statistics occurs in March 2020. Therefore, when seasonally adjusting any time series that ended in March 2020 tests were conducted to see if the March 2020/Quarter 1 observation was statistically significant as an AO at the 5% level of significance. If it was found to be significant at this level and its inclusion made sense in terms of real-world COVID-19 effects the AO was added to the RegARIMA model. This process has been repeated for the endpoint of each series modelled throughout the pandemic.
A characteristic of the COVID-19 effects is that the movements and turning points for most series can be anticipated as they have been driven by either the imposition or relaxation of government-imposed lockdowns. Within the seasonal adjustment software endpoints must be modelled as AOs in the RegARIMA models. However, once new data becomes available AOs at the previous endpoint are retested and replaced by either a LS or a TC, if significant at the 5% level.
During the crisis we are finding that a LS outlier or more probably a sequence of LSs are capturing the COVID-19 impacts best in the Irish data. There have been some instances where we have used TCs in quarterly data. There has also been one instance where we have used a decreasing quadratic ramp.
4.3Four Irish time series seasonally adjusted during the COVID-19 crisis
Table 1 provides a summary of four seasonal adjustment models produced by the CSO during the crisis. For the sake of clarity, only the COVID-19 related intervention regression variables are displayed for each series. The estimated t-statistic for each intervention regression parameter is also provided. Remembering that a t-critical absolute value of approximately 2 is used as the threshold for the inclusion of any pre-determined outliers, it should be clear that the retention of these variables is adding value to the overall quality of the seasonal adjustment process. The series have been selected based on their ability to illustrate the use of the various outlier types and it is worth re-stating that within the CSO a sequence of LSs are more often applied to best capture the COVID-19 effects on our seasonal data.
Figures 2–5 shows the time series graphs of the unadjusted data, the seasonally adjusted data and the trend for each of the 4 series. The latest trend points have been suppressed as these are not normally published. Figure 2 is a monthly series that represents the hospitality industry, a sub-division of the services sector of the Irish economy. Hospitality has been one of the hardest hit sectors of the Irish economy during the crisis with strict lockdowns first imposed in mid-March 2020. The impact of these restrictions is captured by the inclusion of LSs in the series for March and April 2020. In March the impact was for two weeks and in April the impact was for the full month. In June the restrictions were eased somewhat, and this is evident within the series by the positive LS included in June. Restrictions were further eased in July and August and although the recovery continued activity in the series did not return to pre-COVID seasonally adjusted levels. Restrictions were re-imposed again on the sector in October 2020.
Figure 3 represents Irish retail trade. No significant COVID-19 impact is evident in the data in March 2020, however a large negative LS is evident in April. This is followed by two positive LSs in May and June. Since June retail trade has been consistently above the pre-COVID series level.
Including a TC outlier has been difficult to justify in most of our monthly series. This is primarily because the initial changes have not returned rapidly to the previous level. However, the case for the inclusion of TC outliers is more compelling when dealing with quarterly data as initial changes in the level experienced in Q2 2020 have been followed by partial rebounds in Q3 2020 for some series. It should be noted that due to the timing of restrictions in Ireland, COVID-19 effects are not evident in Q1 2020 data. Figure 4 shows official quarterly construction data for Ireland. After severe restrictions were introduced on construction in Q2 they were eased in Q3. The COVID-19 adjustment options for this series were to model the COVID-19 impact as either a TC for Q2 with no AO in Q3, or alternatively as a LS in Q2 and an AO in Q3. Based on auxiliary information, parsimony and judgement it was decided to model the effect as a TC. This decision will be reviewed when Q4 data becomes available.
In keeping with Lytras and Bell [10] it was decided to only test for ramps if we had a continuous sequence of LSs, moving in any one direction, lasting greater than 4 months. In keeping with the timing of our various lockdowns we have not experienced many such cases. Figure 5, however, represents a series where a sequence of positive LSs lasted for 5 months. The series “private new cars, licenced for the first time” is strongly correlated with new car sales. The series was severely negatively impacted by COVID-19 in March and April as evidenced by the negative LSs in March and April. However, on a seasonally adjusted basis the series began to recover in May and this recovery continued until September. Initially this recovery was modelled as a sequence of LSs. It was then decided to attempt to model the recovery as a ramp but neither a RP nor a QI proved to be significant. However, modelling the recovery in the series with a QD, starting in May and going until September worked very successfully. As can be seen from Table 1 the QD is highly significant.
The fit of the model containing the QD, in terms of the AICC statistic, was slightly improved from the model that included the sequence of LSs. The final model also displayed significant improvements in the seasonal adjustment diagnostics indicating an improvement in the quality of the seasonal adjustment. This is the first time that quadratic ramps have been used in published CSO seasonal adjustment data.
4.4Communication uncertainty with users
Guided by the principle of transparency the CSO has attached information notes with the publication of infra-annual statistics affected by COVID-19. The information notes, generally, highlights the difficulty of producing timely, reliable and robust statistics in these challenging times, and they outline how the CSO has addressed these issues. This approach hopefully builds trust in the official statistics produced by the CSO.
The CSO also make the point of addressing the challenges of seasonally adjusting data during the crisis. The users are advised that there may be additional revisions to seasonally adjusted data as new data becomes available and as models are improved. A good example of such a COVID-19 information note was issued by the Retail Sales division as part of their July 2020 release [12].
5.Summary
COVID-19 effects present challenges that cannot be ignored in the production of high-quality seasonal adjustment. Furthermore, in this time of crisis it is of critical importance that reliable and robust seasonally adjusted data are available to our users in real-time. It is also important that large-scale future revisions to the seasonally adjusted data coinciding with the span of the crisis, are to be avoided. Fortunately, the international seasonal adjustment community have provided statisticians with the methods, the guidance and the software tools to deal effectively with the challenges posed by COVID-19 in seasonally adjusting infra-annual time series data.
In Ireland the CSO has responded with flexibility and agility to centralise the seasonal adjustment processes of all important infra-annual series with a small group of experts within their Methodology Division for the duration of the crisis. Methodology have used intervention models to minimise the potential negative impact of COVID-19 effects on the quality of the seasonal adjustment. This approach has been adopted since the beginning of the crisis, to minimise future revisions and to provide real-time insights on the unfolding crisis.
Generally, within the intervention models AOs are only to be found at the endpoints of our series, while a sequence of LSs are the most likely solution to modelling the changes in the level of the series. TCs are usually hard to justify in modelling the COVID-19 effects on monthly series but they have been applied to some quarterly series. Quadratic ramps have also been utilised to improve some models.
The COVID-19 impact on the economy is on-going and will continue to provide challenges in the seasonal adjustment of official statistics. The upcoming annual model reviews, as required by the partial concurrent seasonal approach adopted by the CSO, may prove to be particularly difficult and time-consuming. The CSO will continue to review the intervention effects modelled to ensure their appropriateness. The current approach will also be reviewed as new data becomes available and as new guidelines and advice is issued from the international seasonal adjustment community.
The CSO’s approach has been successful in capturing the important turning points of the COVID-19 crisis. In term of seasonal adjustment, the CSO has put users’ needs for high quality infra-annual statistics at the forefront of our efforts. With this approach seasonal adjustment has not become the story but hopefully part of the solution in providing real-time trustworthy statistics during this crisis.
Acknowledgments
The author would like to thank my colleagues within the Methodology Division; Paul M Crowley, Fiona O’Callaghan and Tim Linehan, for their suggestions and useful comments. In the challenging year of 2020, it is worth acknowledging the considerable efforts of data providers and the staff within the various CSO Divisions that have made high quality unadjusted infra-annual official statistics available in a timely manner.
References
[1] | Eurostat. ESS Guidelines on Seasonal Adjustment; (2015) . Available from http://ec.europa.eu/eurostat/web/products-manuals-and-guidelines/-/KS-GQ-15-001. |
[2] | Mazzi GL, Ladiray D, Rieser DA, eds. Handbook on Seasonal Adjustment. Eurostat; (2018) . Available from http://ec.europa.eu/eurostat/web/products-manuals-and-guidelines/-/KS-GQ-18-001. |
[3] | JDemetra+ version 2.2.2 January 2019; Available from https://github.com/jdemetra. |
[4] | Linehan T, Foley P. CSO Seasonal Adjustment Policy. Central Statistics Office, Ireland; (2019) . Available from www.cso.ie. |
[5] | Time Series Research Staff, Center for Statistical Research and Methodology. X-13ARIMA Reference Manual, Version 1.1., U.S. Census Bureau, Washington, DC; (2020) . Available from www.census.gov/srd/www/x13as/. |
[6] | Ladiray D, Quenneville B. Seasonal Adjustment with the X-11 Method. New York; (2001) . Lecture Notes in Statistics – Vol. 158, Springer. |
[7] | Dagum EB, Mazzi GL. Time Series Components. In Mazzi GL, Ladiray D, Rieser DA, eds. Handbook on Seasonal Adjustment. Eurostat; (2018) . Ch 3. |
[8] | Mehrhoff J. Outlier Detection and Correction. In Mazzi GL, Ladiray D, Rieser DA, eds. Handbook on Seasonal Adjustment. Eurostat; (2018) . Ch 7. |
[9] | Box GEP, Tiao GC. Intervention analysis with applications to economic and environmental problems. Journal of the American Statistical Association. (1975) ; 70: , 70–79. |
[10] | Lytras D, Bell WR. Modeling Recession Effects and the Consequences on Seasonal Adjustment. In JSM Proceedings, Business and Economics Statistics Section. Alexandria, VA: American Statistical Association. (2013) . |
[11] | Eurostat. Methodological Note: Guidance on treatment of COVID-19-crisis effects on data; March (2020) . Available from https://ec.europa.eu/eurostat/cros/system/files/treatment_of_covid19_in_seasonal_adjustment_methodological_note.pdf. |
[12] | Central Statistics Office, Ireland. Information note on the implications of COVID-19 on the Retail Sales Index July 2020. Available from https://www.cso.ie/en/releasesandpublications/in/rsi/informationnoteonimplicationsofcovid-19ontheretailsalesindexjuly2020/. |


