
Innovations from Iran: Resolving quality issues in the integration of administrative and big data in official statistics
Abstract
In a modernized statistical production process, non-traditional data sources such as ‘big’ data are increasingly being considered either as the main or as a supplementary source for official statistics. Their use however has brought new sorts of challenges: messy datasets, duplicate entries, missing information and misspellings to name a few. In many cases, there is also no unique identifier which can be used to unambiguously identify a record for the purpose of data integration. These challenges can be compounded by a non-English based alphabet like the Persian/Farsi alphabet used in Iran. In this paper, two innovative methods have been elaborated to address such data challenges. More specifically, the application of probabilistic record linkage using an ACSII coding system is an innovative way to deal with both data challenges and lack of unique identifier simultaneously. Moreover, text mining is an innovative way to address categorization and grouping systems that are not suitable for statistical purposes. Both innovative approaches can improve the accuracy and coherency of datasets and for data integration result in higher quality datasets. Results of research undertaken by the authors show the innovations lead to more effective data integration and improve the quality of the resulting official statistics. The innovations have wide applicability especially in non-English alphabet countries.
1.Introduction
The United Nations (UN) Fundamental Principles of Official Statistics empower all countries to draw on all types of data sources for statistical purposes. Principle five calls on statistical agencies to choose the data source with regard to quality, timeliness, costs and burden on respondents [1]. In Iran, over sixty statistical collections are conducted each year with approximately 90% or 55 sourced from statistical surveys and the remaining 10% or six from administrative registers. Increasingly, however, the use and availability of administrative registers and other types of ‘big’ data calls on the need to rethink this balance. Also, the demand for more diversified, sophisticated and rapid statistical services calls for leveraging emerging sources of “big’ data’ such as those relating to remote sensing imagery, transactional and social media data and mobile device data [28]. Rapid changes to digital platforms and ICT-enabled devices, however, blurs the boundaries between administrative, survey and ‘big’ data and the quality of the data and related official statistics has become a prominent area of concern if these data sources are going to be used.
Quality is the hallmark of a National Statistical Office (NSOs). Official statistics must first and foremost be accurate and reliable if they are to be trusted. Quality is often controlled by National Statistical Offices (NSOs) by collecting the required data through statistical surveys where accuracy can be controlled, statistical definitions can be used, and editing and other quality assurance processes managed by the NSO. However, such undertakings are costly, not always timely, and place a burden on respondents. In Iran, for example, the Household Expenditure and Cost Survey is conducted quarterly and reaches a sample of only around 18,000 or close to 0.07% of all households in Iran. Trade-offs are frequently made including collecting less detail than is ideally required for the calculation of price statistics.
The Statistical Centre of Iran (SCI) is increasingly making use of administrative data sources and would like to use ‘big’ data sources where appropriate. These data sources, however, introduce new challenges particularly when the data is collected for an administrative or other purpose, not a statistical purpose. This may lead to coding schemes which do not meet the statistical standards needed for official statistics, or data entry errors, such as due to administrative staff attention to administrative processes rather than data quality processes. These errors can be compounded when there are multiple characters in a native language, such as Farsi, with the same meaning.
This paper is structured as follows. Section 2 gives an introduction of the Iran statistical system and the role of price statistics and household expenditure and cost statistics. Section three introduces the two innovations explored in Iran for addressing inconsistencies in administrative and ‘big’ data sources and the needs of official statistics, before outlining the research projects in more detail in sections four and five respectively. The final section concludes the paper, describes some of the next steps for adopting the innovative approaches in Iran and provides some thoughts for the global statistical community.
2.Iran’s statistical system
In July 1965, the Statistical Centre of Iran (SCI) was established by the Law approved by the National Consultative Assembly and assigned to collect data through the implementation of sample surveys and censuses. All government agencies were duty-bound to provide the SCI with its required statistics and data. After approving the Law, the first national population and housing census was implemented in 1966 and in the same year, the first national statistical yearbook was released.
For the first time, the SCI implemented the annual census of large scale establishments (10 and more workers) in 1972 and a second Census of Formal Mines of the country was implemented in collaboration with the SCI and the Ministry of Industries and Mines in 1974.
The compilation of the first input-output table of the SCI and the third input-output table of Iran for 1973 was set into the working plan of the SCI. In 1979, in addition to the implementation of previous annual routine surveys, collection of registered data on building permits issued by municipalities were taken into accounts by the SCI. Since then, the mentioned data have been collected and released annually.
In the 1980s, production of the service statistics was put at the center of SCI considerations including but not limited to retail and wholesale surveys. In 1985 and 1986, the SCI took the survey of mines covered by the public sector and since 1988, the survey of national mines has been taken annually. Moreover, the SCI implemented several large-scale surveys such as compilation of input-output tables for 1986, the first National Census of Nomads, the first National Census of Agriculture, and the first National Population and Housing Census after the Islamic Revolution in 1979 (Fourth National Population and Housing Census in Iran) in the 1980s.
In the 1990s, a new approach was adopted with the aim to organize statistical registers based on the organization of functional-information systems as well as a new round of compiling national and regional accounts according to the latest revision of the national accounts system recommended by the UN.11 A study and review on environment statistics was taken into account and at the end of this decade, certain environmental data on large-scale manufacturing establishments were collected and disseminated.
In the 2000s, many activities were carried out in the SCI. They include compilation of the fourth input-output tables for 2001, implementation of National Establishment Census in 2002 in which more than 2,800,000 establishments in the country were identified, producing statistics on other services sector owing to the entrance of new IT technology into the country; carrying out Survey of the Establishments Providing Cell Phone and Internet Service and Survey of the Internet Users, and Survey of Employment and Unemployment in every quarter since 2001. Moreover, in this decade, the calculation of price index of producers was taken into account by the SCI.
2.1Price statistics system
Price statistics are considered a core part of a NSOs statistical programme. Price statistics must be accurate and reliable to ensure the trust of governments and the public in important decisions affecting us all, including wage increases, interest rates and mortgage interest. Price indices are considered one of the oldest indices for monitoring economic changes and fluctuations.
Normally, there are four main price indices in economics literature: Consumer Price Index (CPI), Producer Price Index (PPI), Export Price Index (XPI) and Import Price Index (MPI). In a price statistics system, XPI and MPI are used to different purposes. [29]. XPI depicts the price trend of exported merchandise outside countries borders while MPI focuses on the price trend for imported merchandise in a specific period. Together, XPI and MPI play an important role in foreign trade analysis, the expenditure side of the National Account, trade outputs and National Gross Expenditure. Precise calculations play a pivotal role in efficient decision-making and therefore quality of the contributing datasets is essential.
2.2Quality
The decision to use a particular data source in statistical production should be based strictly on user and business needs, and with consideration of the sustainability of that data (particularly with administrative and ‘big’ data) and the prospective benefits to users of the statistics produced using the data, as stipulated in UN Fundamental Principle five, and often given effect through data quality frameworks [2, 3, 4, 5, 26]. Iran’s NSO, the SCI, is no exception.
Iran’s NSO has developed a customized quality framework based on UN National Quality Assurance Frameworks (NQAF) Manual for Official Statistics [3] and the European Statistics Code of Practice [4]. The UN NQAF Manual for Official Statistics provides guidance for developing and implementing a NQAF and aims to address quality assurance in different circumstances and situations, thereby supporting countries in safeguarding the role of official statistics as a trusted source of information in a changing environment [3]. The European Statistics Code of Practice aims to ensure that statistics produced within the European Statistical System (ESS) are relevant, timely and accurate, and that they comply with the principles of professional independence, impartiality and objectivity [4].
Quality of administrative records has been reviewed and practiced by many NSOs and they tried to extend criteria and measures to administrative records, including the Netherlands, New Zealand, Austria, Denmark and Italy [6, 7, 8, 9, 10, 11]
Table 1
Iran’s statistical quality assurance framework
| Sector | Criteria |
|---|---|
| Management of Statistical system | Coordination with data suppliers Communication with statistical users Statistical Standards |
| Organizational environment | Professionally independence Data gathering laws Transparency and Impartiality Confidentiality Quality commitments Well data sources |
| Statistical processes | Quality of statistical methodology Efficient costs Effective surveys’ implementations Response burden management |
| Quality of Statistical products | Relatively Accuracy and reliability Timeliness and updated Accessibility and clarity Comparability and coherency |
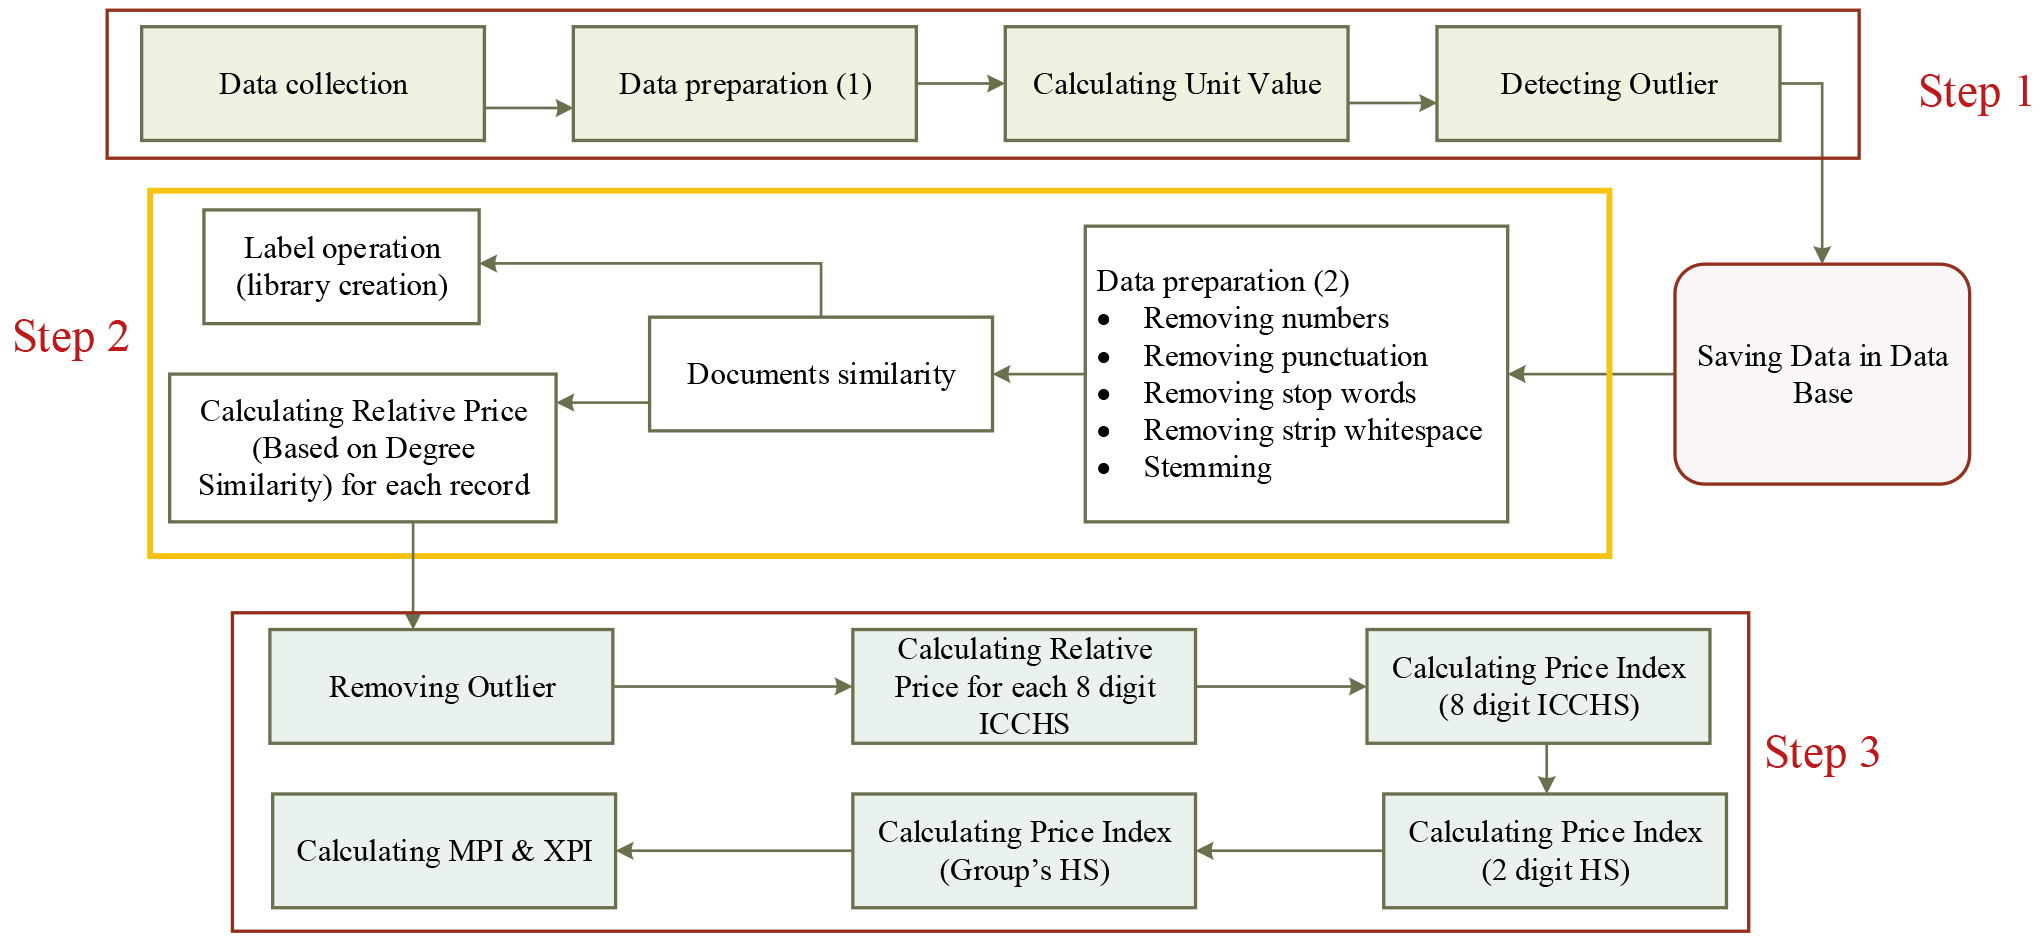
Fig. 1.
Research focus and approaches towards improving the quality of data sources.
Iran’s NQAF assesses four main sectors and 18 criteria as shown in Table 1. The criteria address aspects of a modern statistical system including coordination, communication, independence, confidentiality, and laws. Management of the statistical system, organizational environment, statistical processes and quality of statistical products are the four sectors [13].
Furthermore, Iran’s SCI has also established and documented a National Statistics Quality mark for all members of Iran’s National Statistical System which produce and disseminate Iran’s official statistics. This mark is accompanied by related instructions, and Iran’s SCI has been working on the quality assessment of administrative data for producing the official statistics based on them with close support of the UN Population Fund (UNFPA).
Together, Iran’s NQAF and National Statistics Quality mark demonstrate the importance placed on quality by the SCI. Different dimensions are taken into account and can be used to focus improvement strategies. This paper focusses on two specific areas for improvement for the quality of statistical products – accuracy and reliability, and comparability and coherence. Two of the five criteria in Iran’s NQAF.
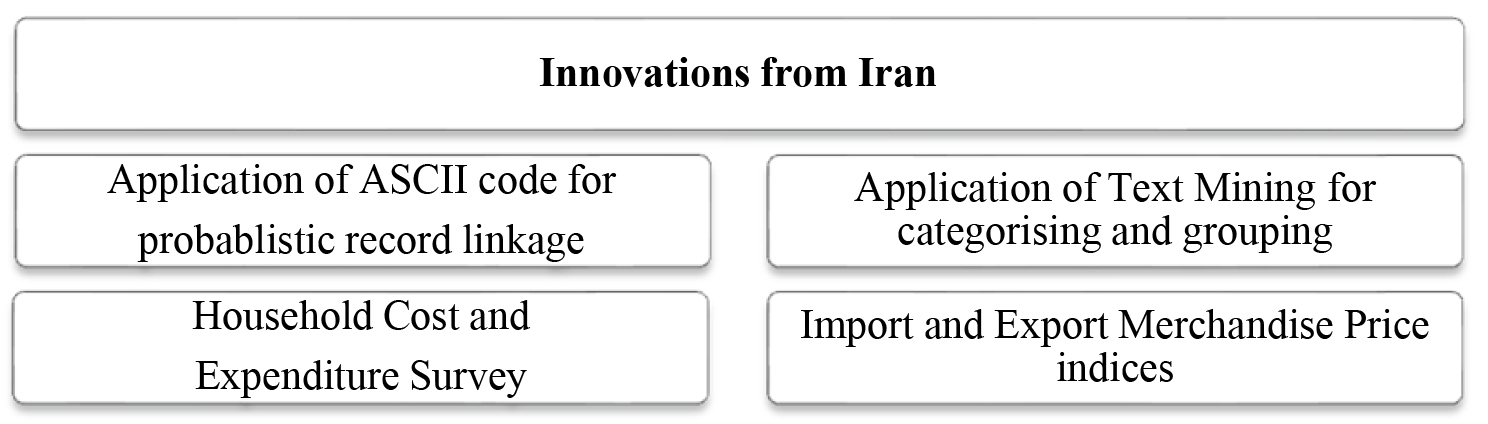
3.Innovations from Iran
As mentioned earlier, the SCI has in recent years been increasingly considering the use of administrative and ‘big’ data in the production of official statistics. Its first step is to explore the use of the alternative data sources and assess the quality of resulting official statistics. In this paper, the findings of two research projects are presented, exploring the use of administrative data and the innovations which were needed to address the challenges presented by the new data sources. The two examples come from Iran’s Household Cost and Expenditure Survey and Export and Import Price Indices and are summarized in Fig. 1.
Table 2
Differences arising from use of non-English alphabetic characters
| Type of difference | Example in Farsi |
|---|---|
| Text with same alphabet but different characters | “کرمی”, “کرمي”or “کرمئ” |
| Text with similarity but incorrect writing | “Ú©” with “Ú¯” or “س” with “Ø´” |
| Text with more than one syllable missing some part | “Ù…Øمدی پناه” with “Ù…Øمدی” |
| Combination of above and more than one variable | “کرمی راد” with “کرمي” |
| Additional characters were written | Ù Ù Ù‹ ÙŽ Ù Ø© – Û€ |
| Same person registered both in Farsi and English in different registers | “سعید” and “Saeed” they should change to the same ASCII code |
3.1Research focus
3.1.1Household Cost and Expenditure Survey
The Iranian Household Cost and Expenditure Survey has a long history in Iran. This survey has been conducted in rural areas from 1963 and in urban areas since 196822 making the SCI responsible for conducting the survey for more than 57 years. The survey is conducted quarterly, based on rotational sampling for both urban and rural households, with the latest non-response rates in urban and rural areas being 4.96% and 1.89% respectively and not willing-to-respond 3.39% in urban and 0.8% in rural. The survey aims to provide high quality estimations of both average costs and expenditure for urban and rural households in different geographical regions. The survey is used to assess consumption trends for products and services, interactions between social and economic attributes of households, income distribution and the effect of economic policies on social welfare, investigations on households under the poverty line and the role of households in regional and national accounts. These reports play a pivotal role in social and economic national plans and development policy making in Iran. In 2019, 19,898 households in urban areas and 18,430 households in rural areas were surveyed, resulting in 234 statistical tables in 2 series for urban and rural classifications, and 512 more detailed tables for 31 provinces in Iran.
Due to confidentiality issues and to lessen the impact sensitive questions may have on non-response, respondents are not asked to supply their national unique identification number in the Iranian Household Cost and Expenditure Survey, a practice also followed in other countries. This has an impact on the use of the data set such as for data integration.
Households are selected based on a rotational sampling model aimed at creating 75 percent overlap between subsequent surveys and datasets are then integrated over time to boost the quality of the resulting official statistics. Due to the lack of a unique identification number, research into efficient data integration approaches was needed.
The first research project used ASCII coding with probabilistic data integration33 to overcome challenges with Iran’s non-English alphabet and the lack of a unique identification number for data integration. This is discussed in Section 4.
3.1.2Export and Import Price Indices
Iran’s Export Price Index (XPI) and Import Price Index (MPI) have been produced by the SCI since 2001. The two indices are calculated and disseminated based on international recommendations by application of a value unit index method using a classification known as the Harmonized Commodity Description and Coding System (HS) [25]. In this classification, the hierarchy code is given based on ingredients, level of dispensation, application and economic activity type which include 21 main classes, 98 sub-classes, 1241 title and 5113 subtitles respectively [25]. From 2001 to 2011, the indices were calculated based on survey data but due to technological advances in the Customs organizations and boosted IT infrastructures, from 2011 the indices became register-based statistics based on custom’s data.
However, the custom’s data includes descriptions of the import and exports which whilst based on the HS, are not directly comparable to a unique HS 4- or 6- digit code and can change over time. Compiling accurate and reliable, as well as comparable and coherent price indices, is therefore a challenge. Research was needed into categorizing the description of merchandises as recorded in the Custom organizations registers into internationally classified groups to extract high quality statistical indices.
The second research project applied text mining to overcome these coding challenges in the register-based administrative data for the Import and Export Merchandise Indices and is discussed in Section 5.
4.Innovation 1: Using machine coding algorithms
There are different types of inconsistencies in data in different datasets. For example, there is difficulty comparing quasi-identifying information such as name, date-of-birth, and other information from a single record against a large stack of paper records. To facilitate the matching, someone might transfer the quasi-identifying information from a set of records to a large typed list on paper and then, much more rapidly, go through the large list. Locating matching pairs increases in difficulty because individual records might have typographical error (‘Jones’ versus ‘Janes’, ‘March 17, 1922’ versus ‘March 27, 1922’) because handwriting was difficult to read. Additional errors might occur during transcription to the typewritten list [32].
Howard Newcombe, a geneticist, introduced the idea of odds ratios into a formal mathematics of record linkage. The idea was that less frequent names such as ‘Zbigniew’ and ‘Zabrinsky’ (in English speaking countries) had more distinguishing power than more common names such as ‘John’ and ‘Smith’. Among a pair of records that were truly matches, it was more typical to agree on several quasi identifying fields such as first name, day-of-birth, month-of-birth, and year-of-birth than among a pair of records that had randomly been brought together from two files [32].
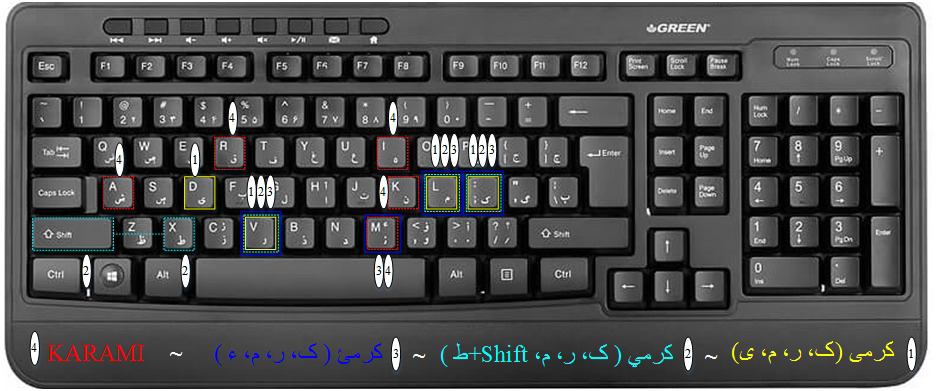
There is another major problem in non-English countries with local alphabets when most computer keyboards are produced based on the English alphabet. In many non-English languages, there are also some alphabetic characters that are the same in meaning but different in writing. In Iran with the Persian/Farsi language, there are some notable characters that have the same meaning but are written in different ways. For example, the characters of “ÛŒ”, “ÙŠ”, “ئ” all are different but for the same alphabet character. When combined, issues are compounded. For example, the surname of “کرمی”, that is very frequent for Iranian people, can also be written as “کرمی‘’, “کرمي” or “کرمئ”.
These differences can lead to inconsistency between different data sets for the same records and is exacerbated by the frequency of these alphabetic characters or their combinations. Variables with more than one syllable like names, surnames, father name, address etc. and their combinations in texts exacerbate these challenges (Table 2). These variations in text format variables can cause inaccurate data integration results and low quality official statistics.
To address these issues and other issues which arise from messy datasets such as the existence of additional characters (e.g. @), the SCI undertook research into approaches which could be adopted to overcome differences between the writing and meaning of certain alphabetic characters in text variables.
Fig. 2.
Farsi keyboard.
4.1Change alphabetic characters to ASCII code
Any text-based data is stored by a computer in the form of bits (a series of 1 s and 0 s) following a specified coding scheme. The character encoding scheme tells the user’s machine which character represents which set of bytes.
There are different types of character encoding schemes. The American Standard Code for Information Interchange or ASCII may be considered the most widespread. It has definitions for 128 characters which are represented by 7 bits and was originally developed from telegraphic codes. At one time ASCII was used on the World Wide Web as the most commonly used character encoding scheme.
Character encoding schemes work by converting text into a number. For example, in ASCII “A” is converted to 065 and “a” is converted to 097. The computer stores 065 and 097, not “A” or “a”.
Specifying the character encoding scheme is very important as without it, a machine could interpret given bytes as a different character than intended. For example: 0
Some other character encoding schemes are as follows.
i. Unicode Transformation Format 32-bit or UTF-32 is a coding scheme utilizing 4 bytes to represent a character. It is a fixed length scheme, that is, each character is always represented by 4 bytes. It was used to represent all of Unicode’s 1, 112, 064 code points. Due to the large space requirements of this scheme, it was made obsolete by later developed more efficient schemes.
ii. Unicode Transformation Format 16-bit or UTF-32 is a coding scheme utilizing either 2 or 4 bytes to represent a character. It can represent all of Unicode’s 1, 112, 064 code points.
iii. Unicode Transformation Format 8-bit or UTF-8 is a coding scheme which requires each character to be represented by at least 1 byte. It is a variable length encoding, with either 1, 2, 3 or 4 bytes used to represent a character. In order to indicate that two (or more) consecutive bytes are the part of same character, or represent two different characters, the first few bits of each byte are used as indicators. Introduced in 1993, UTF-8 is a super-set of ASCII as the first 128 characters are the same as ASCII. Thus, UTF-8 is reverse compatible with ASCII.
iv. Indian Script Code for Information Interchange or ISCII is a coding scheme which can accommodate the characters used by various Indian scripts. It is an 8-bit scheme. The first 128 characters are the same as ASCII and only the next 128-bit space is used to represent ISCII specific characters.
The English keyboard is the usual default for most text. However, in Iran and many other countries, different keyboards exist. A ‘Farsi’ keyboard is given in Fig. 2.
In Farsi, some characters have the same meaning for example, the characters of “ÛŒ’, “ÙŠ”, “ئ”, all have 3 different keys on the keyboard but the same meaning in the Farsi. So if “ÛŒ”, “ÙŠ” or “ئ” is entered into a machine using a Farsi keyboard, it could be entered as either an English character “d” or “m” or “Z”. In other words, if this Farsi keyboard was used, text such as a person’s name or surname would appear with the English alphabet letters “d” or “m” or “Z”.
Table 3
SQL Server function for changing characters (Farsi or English) into ASCII codes
| Create FUNCTION [dbo].[NameToString](@i NVARCHAR(50)); |
| RETURNS VARCHAR(max) BEGIN DECLARE @L int; set @L |
Fig. 3.
ASCII keyboard.
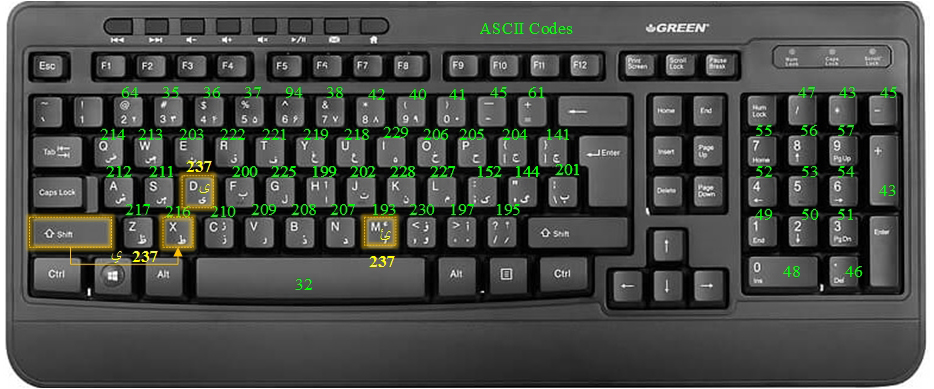
However, corrections for local language conventions can be applied during the coding process using rules. Using our previous example, “ÛŒ’, “ئ” and “ÙŠ” can all be converted to the ASCII code “237” though they have different keys on the keyboard as all three, “ÛŒ”, “ئ” and “ÙŠ”, are closest in meaning to the English letter “d”. In English, “d” is also converted to ASCII code “237”. Thus it would not matter if “ÛŒ’, “ÙŠ” or “ئ” are used in a name or a surname, they would all be converted to “237”. As a result, changing text variables to ASCII code can also simultaneously correct language conventions such as different characters meaning the same thing. The right task here is to apply ”ÛŒ” in all three items because it is more common which is equal to “d” key in English keyboard. So, it was allocated to replace ASCII code 237 to all three items.
The conversion of both Farsi and English keyboards into ASCII codes is quite straightforward. In our research, SQL was used to change each key on the keyboard into an ASCII code. The SQL server function was used and the code is given in Table 3.
Table 4 provides some examples of text strings, in this case names, into ASCII codes. These names have different names that include some characters like “ÛŒ”, “ÙŠ” or “ئ” and they have been converted and corrected to the ASCII code number.
Table 4
Different text conversion to ASCII code
| Persian name | ASCII code | ASCII code (corrected) |
|---|---|---|
| کرمئ | 152209227237 | 152209227237 |
| کرمئ | 152209227209 | 152209227237 |
| کرمئ | 152209227198 | 152209227237 |
Table 5
The data integration process
| Step | Action | Description |
|---|---|---|
| Standardization | Harmonize the File formats | |
| Harmonize Data and Variable format | ||
| Control Variable definitions and their attributes | ||
| Consider the related Para Data | These actions are necessary tasks before making linkages to remove many inconsistencies | |
| Purification and data cleaning | Ensure that no strange value/character is on dataset | |
| Remove additional characters (e.g. @) | This step removes all additional characters with functions | |
| Record linkage | Converting text/numeric variables to ASCII codes | |
| Design the linkage algorithms | ||
| Make a linkage with/without primary key | Obtaining results and final controls to assure the quality of linkage is suitable |
Fig. 4.
Deterministic and probabilistic record linkage and innovative approach.
With the increasing use and availability of routinely collected ‘big’ data, it is becoming more useful to undertake research that involves linking data from multiple sources [14]. Linking data from multiple sources or data integration provides the potential to produce more timely, more disaggregated statistics at higher frequencies than traditional approaches alone [15, 16, 17, 5].
Computational methods for data integration can be divided into two classes: deterministic and probabilistic. Deterministic methods determine whether two records agree on all of a specified set of unique, non-overlapping identifiers. The identifiers are usually numeric but could also be mixed numeric and character. This is clearly very quick. It can be a single-step procedure or can proceed through sequential steps, beginning with stringent matching criteria and progressively relaxing them until an exact match is found.
Probabilistic methods relax the requirement of an exact match and instead calculate a dissimilarity measure for each field in the pair of records being compared. The choice of dissimilarity measure will depend on the context (e.g. approximate string matches for some text fields, matches that allow different date formats and matches that allow the given name and surname to occur in the reverse order). The field dissimilarity measures are then combined (e.g. added or used to maximize the likelihood of a match, given a probability model) to yield an overall dissimilarity measure for the record pair. In the simplest approaches, these dissimilarity measures can then be compared with a threshold to yield a match–non-match classification [31]. Probabilistic record linkage can also be done by calculation of a likelihood rate when no unique identifier is available. There are salient examples of what steps should be done in this process [30].
There is a considerable number of studies into linkage methods across many topics. Some of these topics include the application of record linkage in matching lists of businesses and directions for research into improving linkage methods [18]. For categorical data, these are distance-based and probabilistic-based record linkage [19]. Enhancements to record linkage methodologies to deal with character strings that do not agree character-by-character between matching variables associated with pairs of records have also been studied and a new assignment algorithm for forcing 1-1 matching put forward [20]. Assessing the quality of linkage algorithms and maximizing the value of their linked record using robust record linkage methods [14] is another area of relevant study.
Table 6
Different Steps for linkage with innovative approach
| Step 1: Preparation before linkage includes standardization and purifications (remove extra characters) Step 2: Convert alphabetic characters into ASCII codes for 12 linkage variables: (Variables: Name, Family Name, Province, City, Birth Certificate, Number, Birthday, Age, Gender, Marital status, Contact number, Postal code, Father Name) Step 3: For each cell of ASCII code in dataset 1, make a fuzzy lookup search on corresponding column in dataset 2 and find 5 top similarities (there similarity threshold can be determined of 90% similarity) with Fuzzy Lookup function in SQL Step 4: Sort the similarities from biggest to smallest Step 5: Create the probability vector for each records with the maximum similarities for each record Step 6: compare the number of similarities with probability equal to 1 in the vector with threshold number (here the threshold was considered 7) Step 7: if the number of similarities in vector greater than threshold 7 then the recorded were totally match Step 8: In the new merged dataset put the variable with maximum length either from dataset 1 or dataset 2 Step 9: if the number of similarities less than threshold 7, then write both records in new merged dataset as separate records. |
Fig. 5.
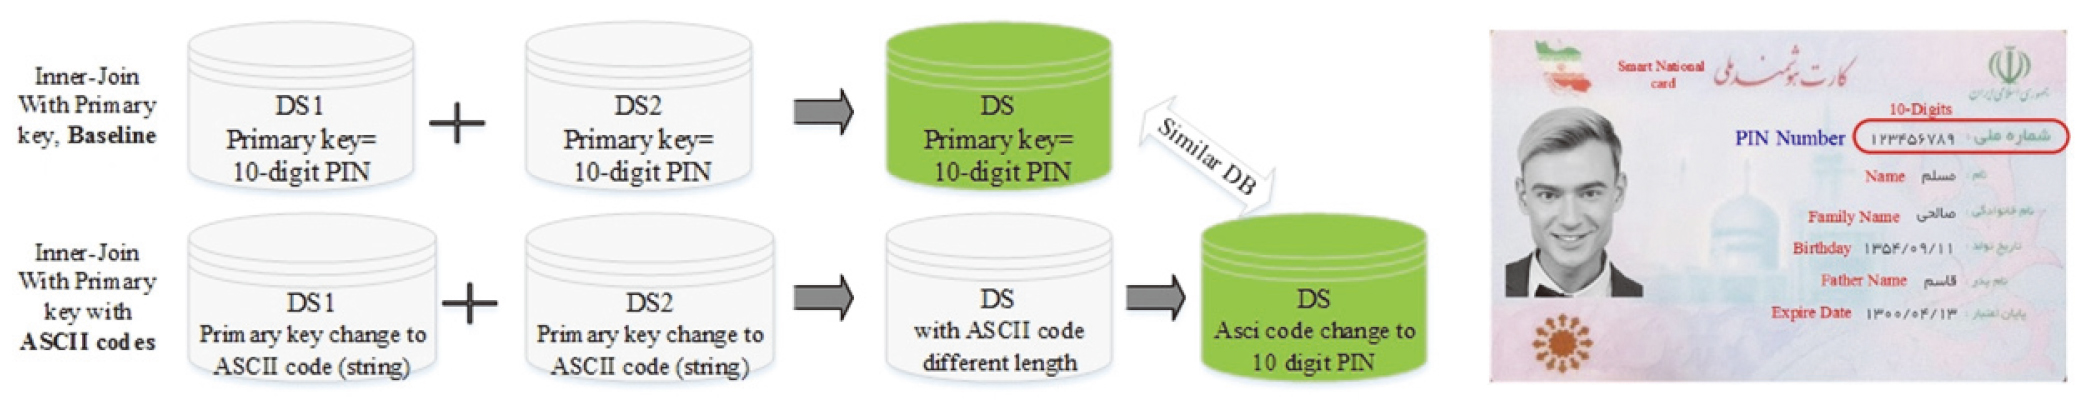
Deterministic linkage between two datasets in a situation where a PIN is available.
4.2Use case: data integration
The data integration process involves three main steps: standardization, purification and data cleaning, and record linkage (Table 5). Various actions are undertaken within each step to address inconsistencies, remove additional characters and produce a quality output. Changing characters to ASCII codes including for correction of local language nuances, the innovation presented in this paper, is shown here in the record linkage step.
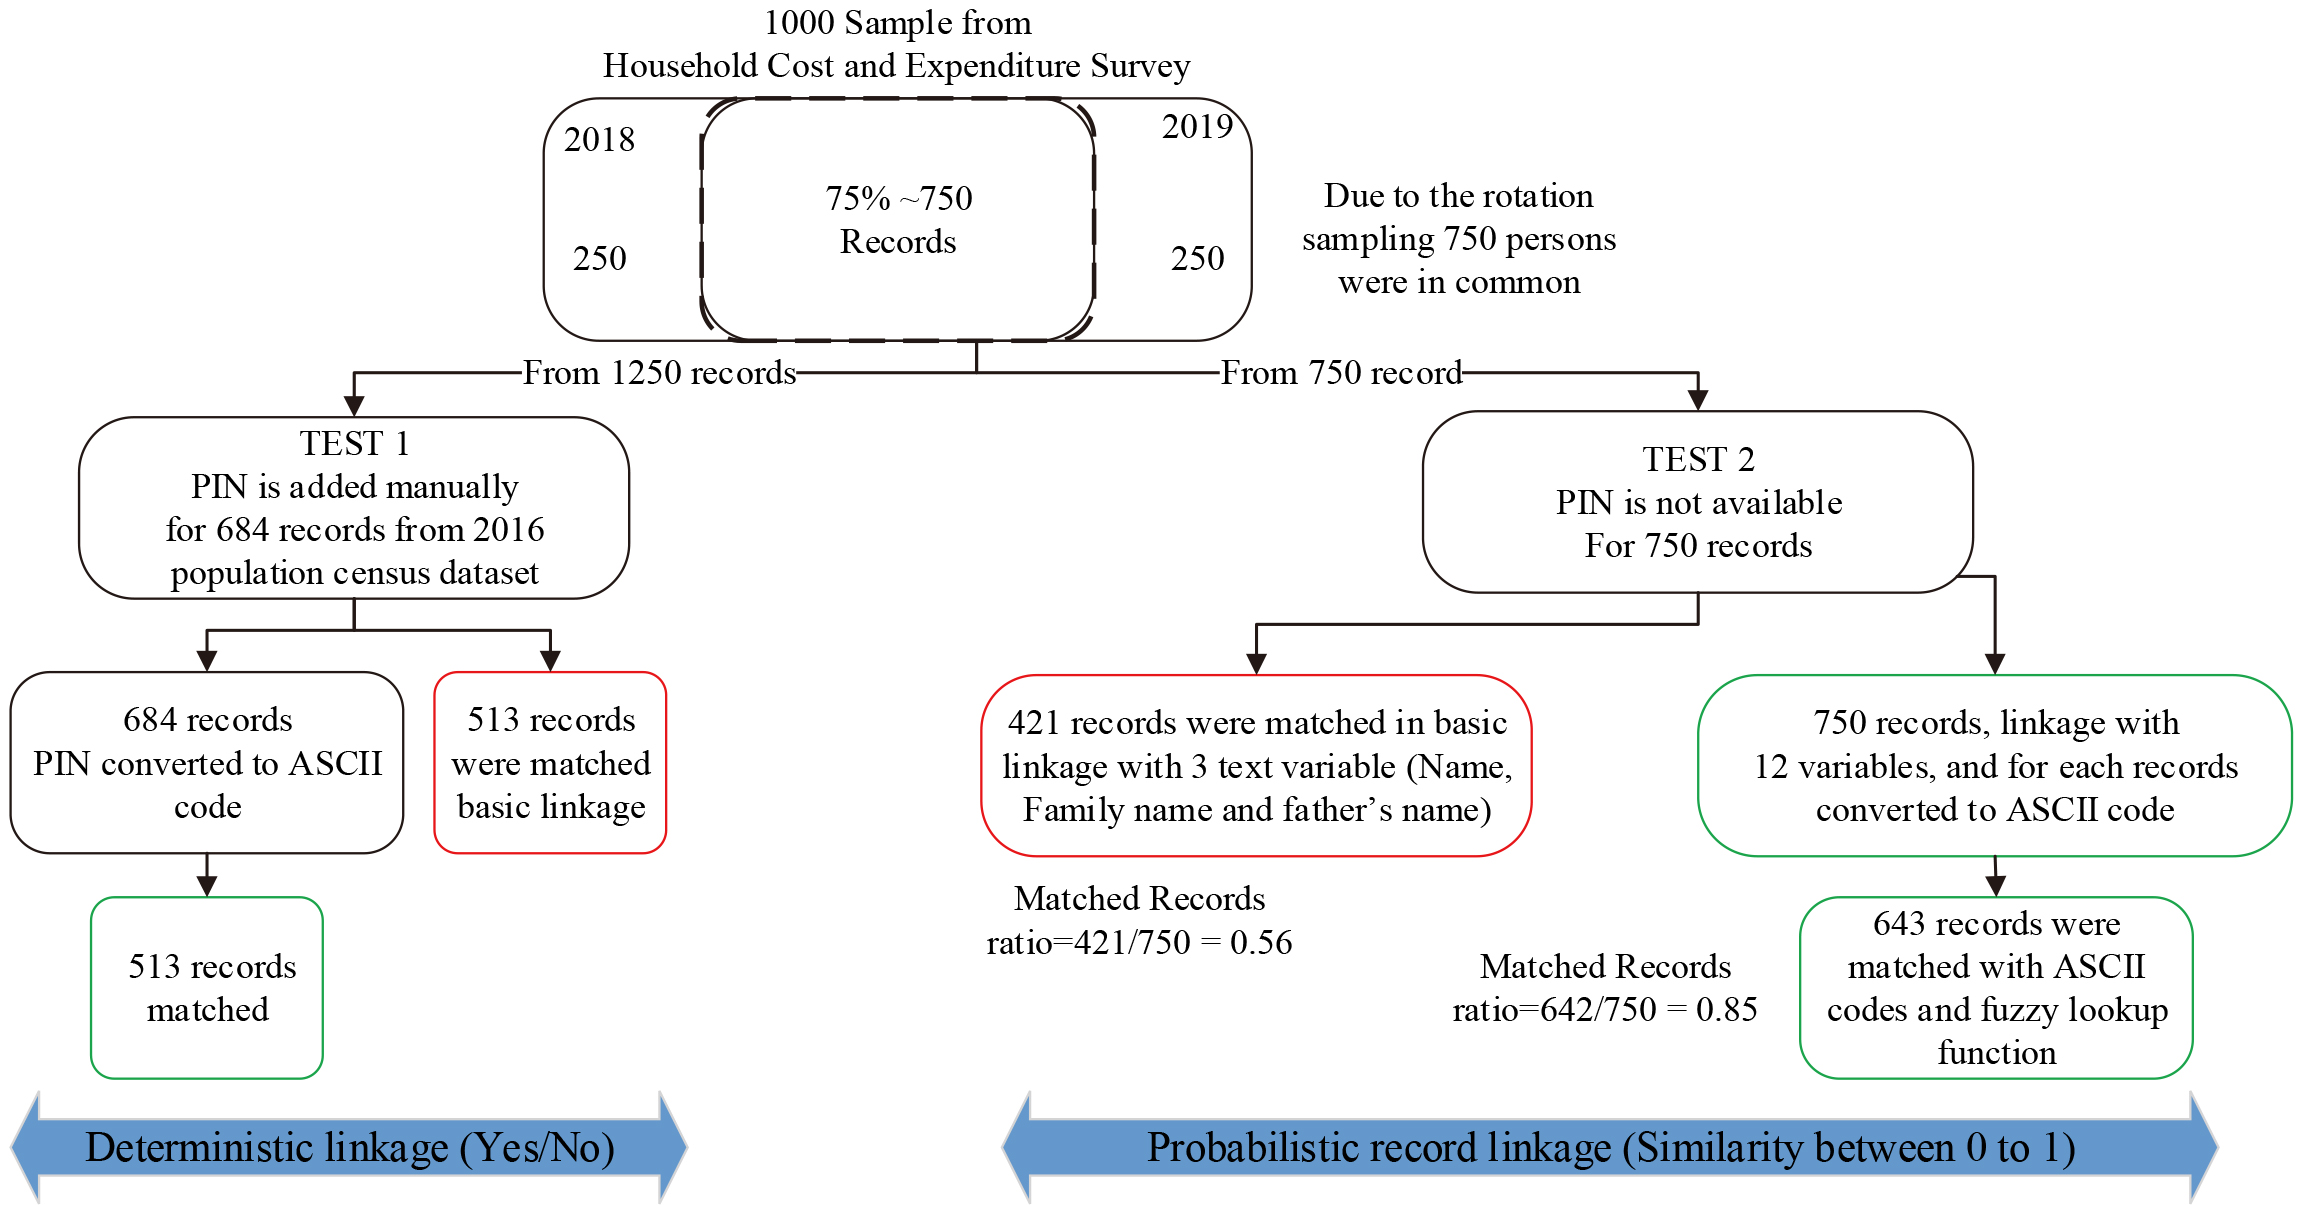
In this research, 1000 individual records from the Iran Household Expenditure and Costs Survey were chosen to test the effectiveness of converting text variables, both character and numeric, into ASCII codes for the purpose of data integration. Data from two different years (2018 and 2019) were chosen and two different methods of data integration were tested: integration with (deterministic) and without (probabilistic) linkage keys.
4.2.1Unique numeric linkage key is available
The Household Expenditure and Costs survey dataset does not include a 10-digit unique number for each resident of Iran, known in Iran as a Personal Identification Number or PIN. For the purposes of this research, PIN numbers were manually added from the 2016 Population and Housing Census dataset.
In order to test the efficiency of the proposed approach, two tests were done (Fig. 4). The first test used deterministic record linkage using the PIN and the second test using probabilistic record linkage based on a selection of text variables.
Fig. 6.
Final results of research into ASCII-coding.
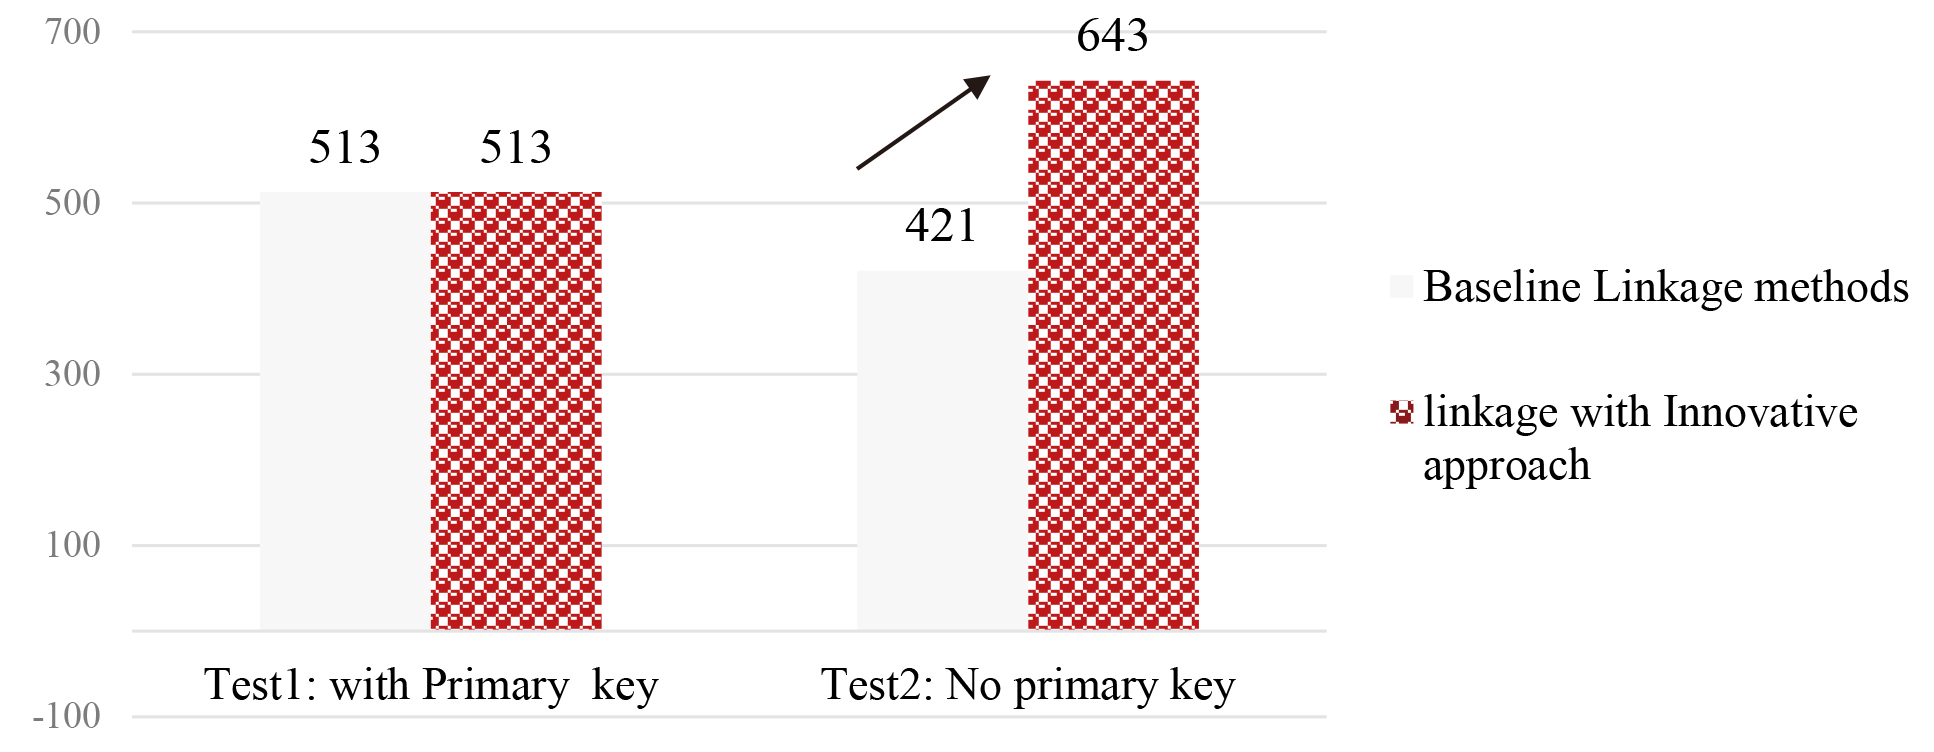
A sample of 1000 records were selected from the 2019 and 2018 surveys, of which 75% or 750 records were similar persons. In the left side of Fig. 4, for the 12500 available persons, 684 records were searched manually in the 2016 population census data to retrieve their PIN number and add this to the record. It was expected that from this 684, 75% would be available in the two datasets. After deterministic linkage with and without ASCII coding, both reached 513 common records. The main difference between the methods was the reference variable for linkage. It means that, there is no difference when either the reference linkage number was the PIN number or a converted PIN to ASCII number (see Fig. 4).
In the right hand side of the Fig. 4, the probabilistic record linkage was undertaken based on text variables like name, surname etc. In the first attempt, probabilistic linkage using three text variables of name, surname and father’s name of each person were used. In the second attempt, 12 text variables were selected and converted and corrected simultaneously to ASCII numbers. The steps undertaken are detailed in Table 6.
In record linkage it is important to consider the order of two datasets in linkage process. The first dataset will be the master to which the additional data join from the second dataset. So, the statistician and expert should give sufficient attention for the order of datasets, as this ordering can result in different output data sets while in probabilistic record linkage and the proposed process for 12 variable removed this challenge (see Table 6, step 2).
4.2.2Unique numeric linkage keys are not available
In many situations, there are no numeric or unique primary or secondary keys available in datasets because of a number of reasons including privacy and confidentiality. In Iran for example, although all residents receive a PIN at birth, there is no unique Business Identification Number (BIN) for enterprises, the Postal 10-digit code has low coverage for many areas and the Location Identification Number (LIN) is not available in many administrative or surveys data sets. In these cases, other variables must be used for linkage between different data sets. These variables frequently are Name, Family name, Address, Age, Gender, Father’s Name, Educational level, Occupation type etc. and the availability of these variables can vary from one dataset to another. In this situation the quality of linkage varies and it is highly related to the linkage method.
Table 7
HS-2-Digit Codes for different sectors
| HS code | Group’s name | HS code | Group’s name |
|---|---|---|---|
| 01–05 | Animal and Animal Products | 50–63 | Textiles |
| 06–15 | Vegetable Products | 64–67 | Footwear/Headgear |
| 16–24 | Foodstuffs | 68–71 | Stone/Glass |
| 25–27 | Mineral Products | 72–83 | Metals |
| 28–38 | Chemicals and Allied Industries | 84–85 | Machinery/Electrical |
| 39–40 | Plastics/Rubbers | 86–89 | Transportation |
| 41–43 | Raw Hides, Skins, Leather, and Furs | 90–97 | Miscellaneous |
| 44–49 | Wood & Wood Products |
Table 8
Sub categories for specific ICCHS code 02041000
| ICCHS code | Descriptions |
|---|---|
| 02041000 | The carcass and lamb are left according to the value statement |
| 02041000 | The carcass of the remaining meat according to the declaration of value |
| 02041000 | The carcass of fresh mutton remains according to the value statement |
| 02041000 | Hot mutton according to the value statement |
| 02041000 | The remaining carcass of the sheep according to the declaration of value |
4.3Discussion
Our research studied the conversion of alphabetic characters into ASCII codes to overcome challenges presented by the Farsi/Persian alphabet including different characters being used interchangeably for the same English character. The research looked at two data integration cases – with and without a unique numeric linkage key. Converting the text variables to ASCII code in combination with probabilistic record linkage can be suggested as an effective way of data integration for those who are engaging with non-English languages in datasets.
5.Innovation 2: Using text mining to address coding challenges in administrative datasets
There are many errors that occur during the classification and use of administrative sources. These include the lack of metadata about the administrative datasets contents to assess its suitability for statistical purposes, the lack of location information suitable for use of the administrative source as a sampling frame, the lack of agreement on the concepts between the administrative data source and the official statistics they are to be used for, the reference times for the administrative data source and official statistics, coverage, duplicate and misclassified entries, accuracy of data entry processes and stability over time [4].
As mentioned earlier, the Harmonized Commodity Description and Coding System (HS) is an international nomenclature for the classification of products in official price statistics. It allows participating countries to classify traded merchandise on a common basis for customs purposes. Introduced in 1988, it has been adopted by most of the countries worldwide and undergone several changes or revisions which came into force in 1996, 2002, 2007, 2012 and 2017 [27].
At the international level, the Harmonized System (HS) classifies merchandise trades into a six-digit code system. It comprises approximately 5,300 article/product descriptions that appear as headings and subheadings, arranged in 99 chapters, grouped in 21 sections. The six digits can be broken down into three parts. The first two digits (HS-2) identify the chapter the merchandise are classified in, e.g. 09
All countries classify products in the same way up to the HS-6-digits level.
Data for the calculation of Iran’s Import and Export Price Indices is sourced from Iran Customs organization. The Iran Customs dataset comprises a series of information based on the HS that is called an attribute set. This attribute set includes but is not limited to tariff code, value in US dollar and Iran’s currency (Rial), weight, country of origin, transportation type, data of arrival and average of exchange rate.
In fact, there is a big challenge because Iran Customs attribute set has been group-classified and this is in contrast with the definitions needed for official price index calculation. Iran Custom’s Customized Harmonized Commodity Description and Coding System or ICCHS produces an eight-digit code based on groups. For example, ICCHS 71110000 (Base metals, silver or gold, clad with platinum, not further worked than semi- manufacture) includes gold and silver with all side products. The problem arises when there is a heterogeneity of products and/or of quality in this group of products.
if the price index displays a growth compared to the earlier period it is not exactly possible to conclude what resulted to this increase, gold or silver? It is also possible that one of them increased while the other decreased. As a result, the price indices will have errors and biases. Additionally, in times when there are repetitive changes in merchandise’ prices due to economic sanctions, international and national political changes etc., data points may be wrongly determined as outliers and omitted from the calculation of price indices thus causing over/under estimation.
Of relevance to our research, Iran’s customs register information has a description of the goods which include the specifications and attributes of the imported or exported goods. For example, in the Table 8, ICCHS code 02041000 has been described. In order to calculate accurate price indices based on the ICCHS 8-digit codes, comparative prices should be calculated and it would be necessary that each 8-digit code should have identical attributes between two different periods. However, taking register data as a data source, there are some remarkable challenges of different type of goods as well as redundant characters resulting to low efficient linkage. So, if the linkage is applied based only on the ICCHS 8-digit, the calculated indices will be misleading and biased.
Table 9
The text mining process
| Step | Action | Description |
|---|---|---|
| Pre-processing | Removing numbers Removing punctuation Removing stop words Removing strip whitespace Steaming | Remove these characters (punctuation, numbers, stop words and whitespaces) @, “ “, !,%,(), … |
| Text mining | determine Jaccard similarity and Cosine similarity | Information retrieval, text classification, document clustering, topic detection, topic tracking, questions generation, question answering, essay scoring, short answer scoring, machine translation, text summarization |
| Analysis | Ensure that no strange value/ character is on dataset | |
| Match the new texts with proper code Library making | Assign a label to each ICCHS code based on the keyboard’s description and the number of repetition in the database. These labels however can be a 4-digit number which can be attached to previous 8-digit ICCHS codes. Categorizing after the matching the proper codes |
Fig. 7.
Text mining process.
Furthermore, Iran’s Customs dataset is a large dataset. More than 400,000 records are received on a daily basis. This makes it impossible to eye-control and review the data for inconsistencies between the Customs attribute set descriptions between one period and another. A systematic mechanism is needed.
In this paper we research text mining for solving these two problems: classifications systems which do not align with official statistics needs and large data sets which require systematic processes.
5.1Text mining
Text mining is the process of seeking or extracting useful information from textual data. It is an exciting research area as it tries to discover knowledge from unstructured texts. It is also known as Text Data Mining (TDM) and Knowledge Discovery in Textual databases (KDT). KDT plays an increasingly significant role in emerging applications, such as Text Understanding [22].
The text mining process is similar to data mining except that data mining tools are designed to handle structured data whereas text mining can handle also unstructured or semi-structured data sets such as emails, HTML files and full text documents etc. [21]. It is a new area of computer science research that tries to solve the issues that occur in the area of data mining, machine learning, information extraction, natural language processing, information retrieval, knowledge management and classification.
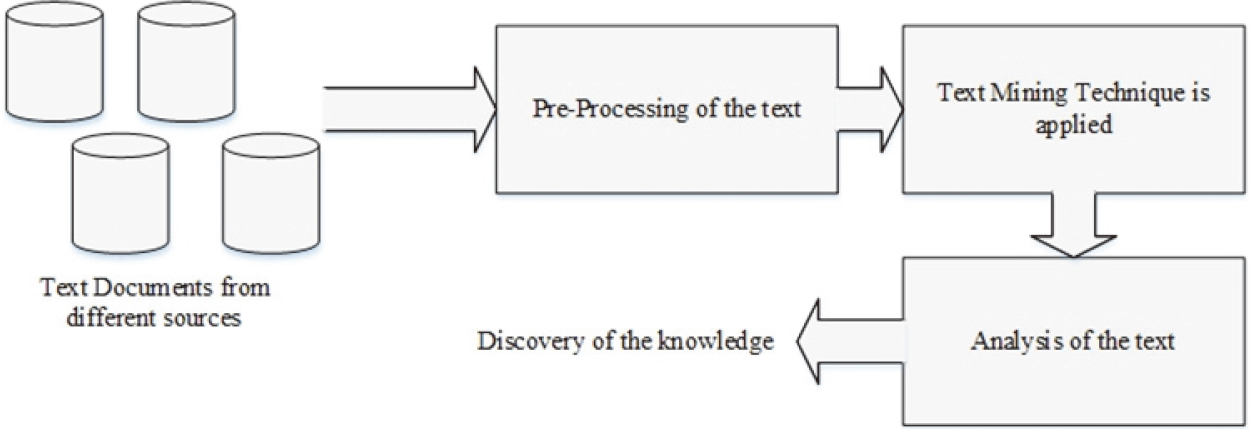
Figure 7 gives an overview of text mining process [22]. There are three main steps: pre-processing, application of text mining techniques; and analysis to discover knowledge.
Fig. 8.
Linkage process with text mining in price indices.
5.2Use case: Relative price indices
In order to calculate price indices, relative prices should be calculated. For these price indices to be calculated based on the Customs dataset, it is necessary that each merchandise’s attribute set be identical between two different periods. However, the Iran Customs dataset presents some remarkable challenges including different types of merchandise attributes between two different periods, the grouping of merchandise attributes across ICCHS codes, as well as redundant characters resulting in low quality linkage between the two different periods.
In order to implement the text mining process, various actions are undertaken within each step to pre-process the dataset for text mining and analyze the results of the mining (Table 9).
5.2.1Step 1: Pre-processing
Commonly each Custom’s attribute set’s description contains a series of characters including but not limited to numbers, symbols, low importance signs and redundant spaces. Thus, in order to prepare high quality analysis on these descriptions, it is necessary to remove these characters (punctuation, numbers, stop words and whitespaces). The last but not least step is ‘stemming’66 that is done in different ways that are demanding and interested reader can find details in many sources. Stemming77 is one of the prominent steps in text mining techniques [22].
5.2.2Step 2: Text mining
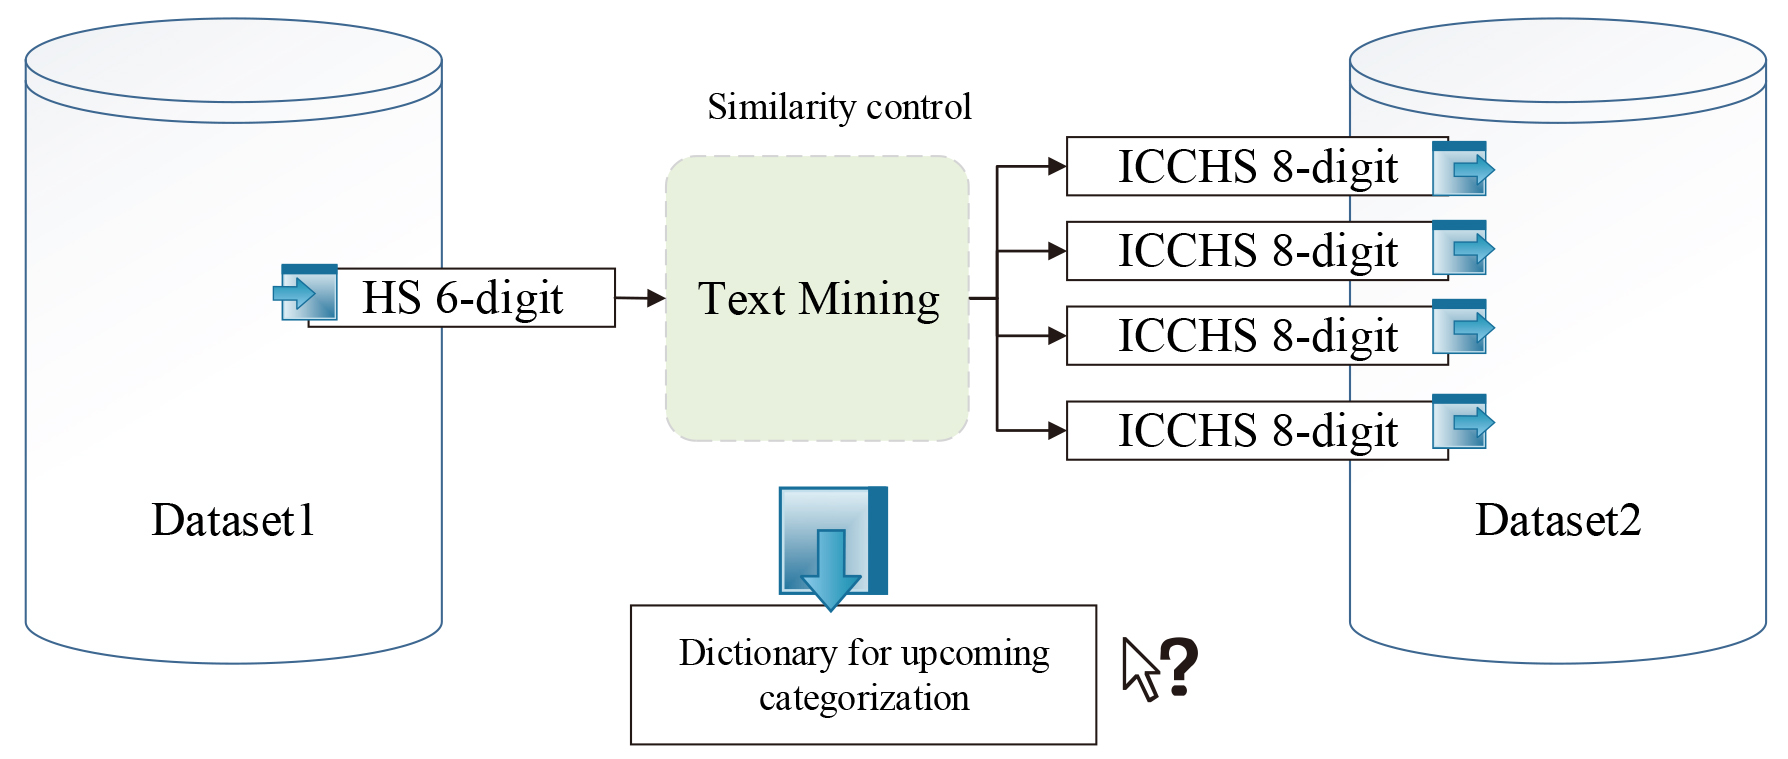
Similarity between merchandise’ attribute sets for the current and last month is necessary for the calculation of accurate relative price values. More specifically, each merchandise’s description of its 8-digit ICCHS code in data set (1), current month, should be linked with similar description in dataset (2), last month (Fig. 6).
Table 10
Sub categories for specific ICCHS code
| ICCHS code | Descriptions | Identify code |
|---|---|---|
| 02041000 | Carcass lamb left accord value statement | 0111 |
| 02041000 | Carcass remain meat accord declaration value | 0112 |
| 02041000 | Carcass fresh mutton remain accord value statement | 0113 |
| 02041000 | Hot mutton accord value statement | 0114 |
| 02041000 | Remain carcass sheep accord declaration value | 0115 |
Fig. 9.
Different steps of text mining method.
Text similarity measures play an increasingly important role in text related research and applications in tasks such as information retrieval, text classification, document clustering, topic detection, topic tracking, questions generation, question answering, essay scoring, short answer scoring, machine translation, text summarization and others. Finding similarity between words is a fundamental part of text mining and is then a primary stage for signalling sentence, paragraph and document similarities. Words can be similar in two ways lexically and semantically.
Many methods have been introduced for similarity findings in two different texts. One of the famous methods is the metric distance that exists between two texts. The Jaccard similarity and Cosine similarity methods to find similarities between two texts are used in the R programme [23]. It is important to note, however, that this is not a proper distance metric in a mathematical sense as it does not have the triangle inequality property and it violates the coincidence axiom [24].
The Jaccard similarity is a simple but intuitive measure of similarity between two sets.
For documents (e.g. the Customs attribute set) it was measured as proportion of number of common words to number of unique words in both documents. This formula can also be applied to numeric ICCHS codes [23].
Cosine similarity [24] is classical approach from computational linguistics that measures similarity based on the content overlap between documents (each text file it can be). In this case documents as bag-of-words will be presented, so each document will be a sparse vector and define measure of overlap as angle between vectors:
By cosine distance/dissimilarity as a technique for finding similarities in text mining is defined as:
The relative price criteria will be the similarity degree with at least a certain similarity threshold. In the other words, the same product in different months is identified by measuring the similarity between attribute sets. SCI’s experience was to apply a 50% similarity
Using the Jaccard and Cosine similarity methods, both methods had similar results. In this study, the Jaccard methods has been applied.
In order to create a dictionary of frequent attributes, a 4-digit number was added to ICCHS code. In Table 10, the results of this conversion of ICCHS 8-digit to 12-digit code is presented. This dictionary will be advantageous for further text mining applications and similarity identifications.
5.2.3Step 3: Analysis of the text
Following the similarity determination, a label was given to each merchandise’s ICCHS code based on the key words mentioned in description and the number of repetitions in the database. These labels however can be a 4-digit number which can be attached to previous 8-digit ICCHs codes. The new codes had 12-digits that would be more beneficial for next linkage. The new 12 digit codes were combined from 4-digits and ICCHS 8 digit-code.
5.3Results
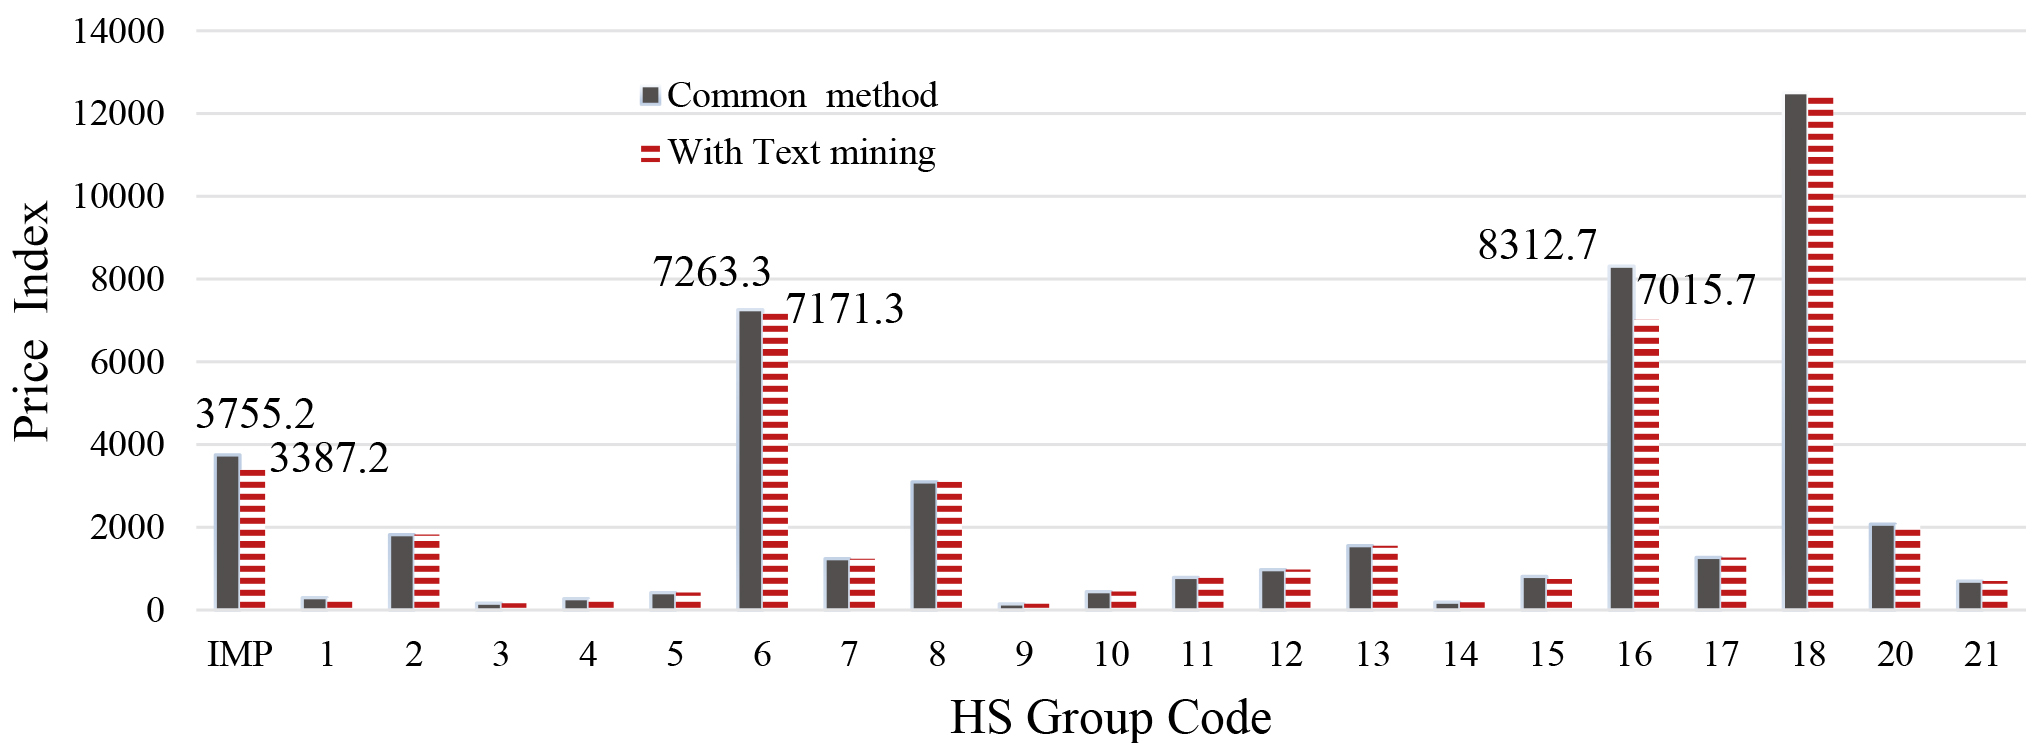
Using the Value Unit Index methods to calculate relative prices, which is the ratio of the value of a unit in the considered period relative to the reference period, inflation prices were calculated using the Customs data comparing the value of units linked between period 1 and the reference period, with and without text mining.
Text mining has the impact of systematically lowering the inflation rate across all 21 HS 2-digit groups (Figs 10 and 11). This is because the text mining introduces uncertainty into the match which has the effect of smoothing out the price relativities so that a smaller average results. In case of text mining application, the outcomes were remarkably close to what we had predicted. The inflation reached was more consistent with inflation trends of both PPI and CPI.
Fig. 10.
Inflation rate for imported merchandise in Quarter 3 2o19 in Iran.
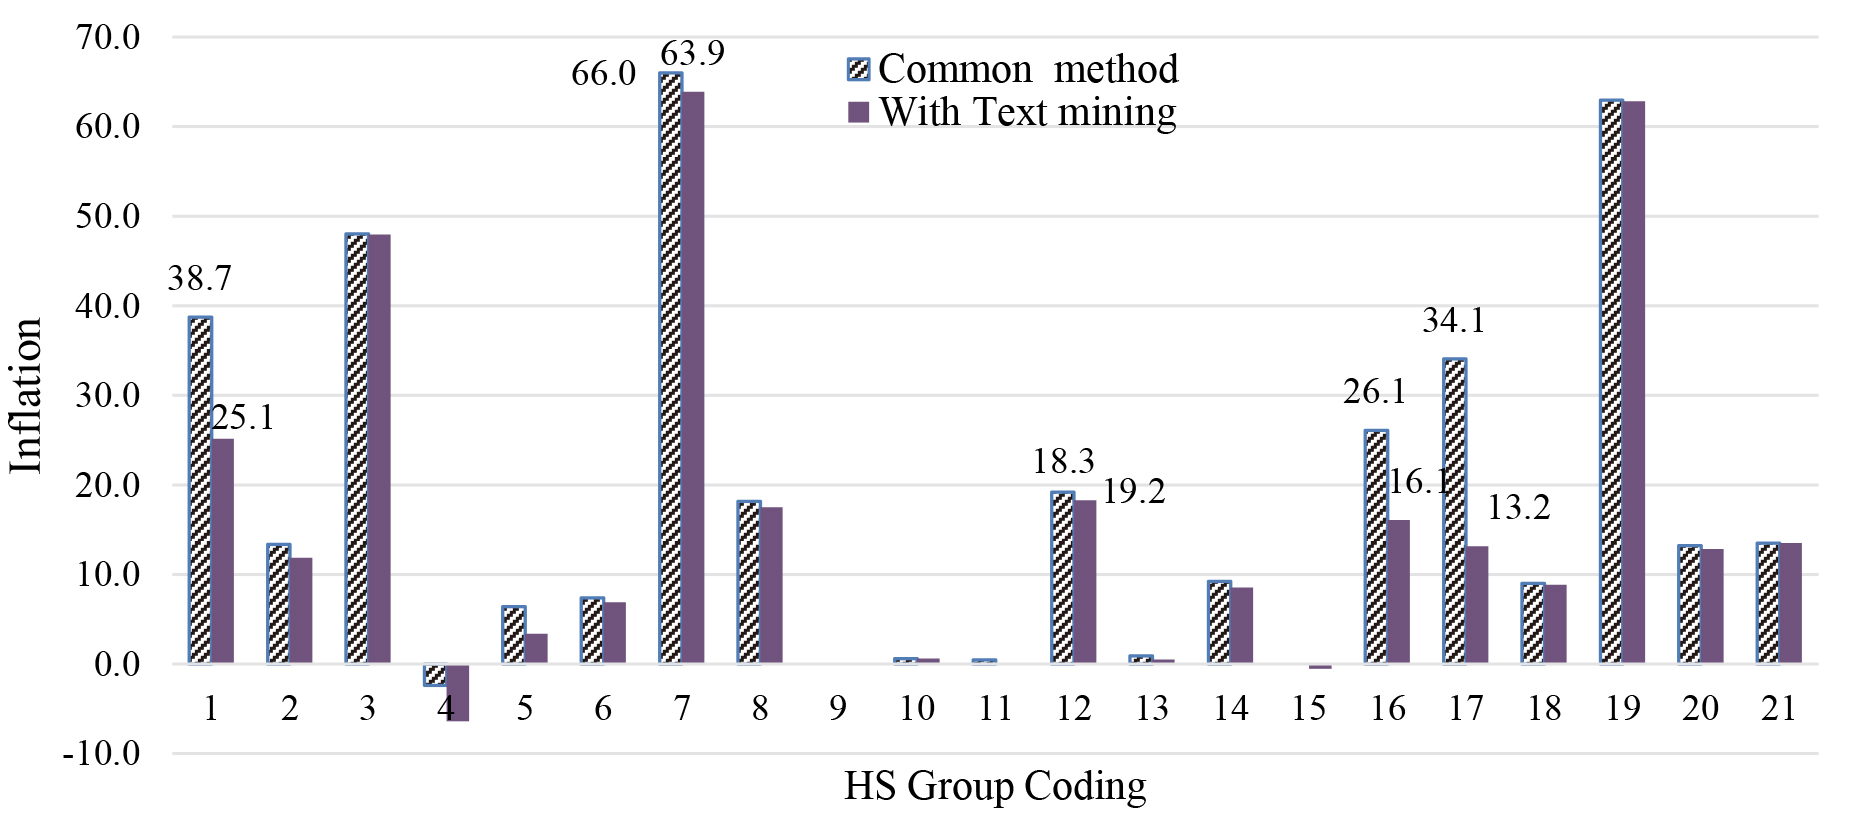
Fig. 11.
Price Index for imported merchandise in Quarter 3 2019 in Iran.
5.4Discussion
Our research studied the use of text mining to overcome challenges presented by the use of Iran’s Custom organization’s dataset for the calculation of Import and Export Merchandise Price indexes. The research compared the calculation of a relative price index when unit values were compared across time periods based on a ICCHS-code assigned to the merchandise by the Customs, and when unit values were compared across time periods based on a label assigned to the merchandise’ description as the result of text mining similarity methods.
The results show that the use of text mining results in lower Import and Export Merchandise Price Index values which are more precise in real practice.
6.Discussion and recommendations
Increasingly making use of administrative and other secondary data sources for the production of statistics, it is necessary to apply new approaches to ensure their quality and usability for official statistics. There are a wide range of issues associated with these sources and using them in data integration and for price indexes is difficult. More specifically, the reliance on text for data integration purposes and classification systems developed for administrative purposes are common problems statisticians will face when using these sources.
Innovative approaches can be used. In this paper, two innovations were discussed. The first innovation replaced text variables with ASCII codes to address language traditions where many characters are used interchangeably. The results show improved linkage rates. This approach has wide applicability in other situations where alphabetic traditions may impede the quality of record linkage based on text variables. This method can be applied by statisticians and data scientists in other non-English countries and situations.
The second innovation used text mining techniques to enhancing the administrative classifications used in the Customs dataset for the purpose of compiling internationally comparable price indexes. The results showed lower prices. This approach has wide applicability when administrative datasets with classification systems optimized for administrative, not statistical purposes, are used. This approach can be extended to all price indices like the Consumer Price Index (CPI) to also improve the quality of inflation rate. In Iran, the two innovations are still in their research phase.88
Notes
1 In the 1990’s, the SNA version adopted by the SCI was 1968.
2 See SCI official website: www.sci.org.ir.
3 In the Statistical programming or software like R, SAS and Excel, Fuzzy function/Tab is available for this purpose.
4 Extended Binary Coded Decimal Interchange Code is an eight-bit character encoding used mainly on IBM mainframe and IBM midrange computer operating systems.
6 There is package for Stemming function in R programming (Package tm, function stem-document).
7 In linguistic morphology and information retrieval, stemming is the process of reducing inflected (or sometimes derived) words to their word stem, base or root form generally a written word form. The stem need not be identical to the morphological root of the word; it is usually sufficient that related words map to the same stem, even if this stem is not in itself a valid root. Many search engines treat words with the same stem as synonyms as a kind of query expansion, a process called conflation. A computer program or subroutine that stems word may be called a stemming program, stemming algorithm, or stemmer.
8 Programming scripts are available and interested readers can contact the authors at the emails given to get access to the scripts.
Acknowledgments
The paper was prepared under the kind mentorship of Gemma Van Halderen, the Director of UNESCAP Statistics Division.
References
[1] | United Nations ((2014) ), Resolution adopted by the General Assembly on 29 January 2014, Fundamental Principles of Official Statistics, A/RES/68/261. Available at https://unstats.un.org/unsd/dnss/gp/FP-New-E.pdf. Last viewed 25 September 2020. |
[2] | Brackstone G. Managing data quality in a statistical agency. Surv Methodol. (1999) ; 25: : 139-149. |
[3] | United Nations ((2019) ), National Quality Assurance Frameworks Manual for Official Statistics. Available at https://unstats.un.org/unsd/methodology/dataquality/references/1902216-UNNQAFManual-WEB.pdf. Last viewed September 2020. |
[4] | European Union ((2018) ), European Statistics Code of Practice. Available at https://ec.europa.eu/eurostat/documents/4031688/8971242/KS-02-18-142-EN-N.pdf/e7f85f07-91db-4312-8118-f729c75878c7. Last viewed 25 September 2020. |
[5] | Australian Bureau of Statistics. ABS Data Integration. Available at: https://www.abs.gov.au/websitedbs/D3310114.nsf/home/Statistical%2BData%2BIntegration. Accessed September 2020. |
[6] | Boeschoten L, Oberski D, de Waal T. Estimating Classification Error under Edit Restrictions in Combined Survey-Register Data, Statistics Netherlands, CBS |
[7] | New Zealand Statistics ((2016) )Guide to reporting on administrative data quality, ISBN 978-0-908350-29-2 |
[8] | Berka C, Humer S, Lenk M, Moser M, Rechta H, Schwerer E. A Quality Framework for Statistics based on Administrative Data Sources using the Example of the Austrian Census 2011, Austrian Journal of Statistics. (2010) ; 39: (4): 299-308. |
[9] | Reinert R. Evaluating the Quality of Administrative Data as Input for Official Statistics, Denmark statistics, European Conference on Quality in Official Statistics (Q2016), (2016) . |
[10] | Brancato G, Boggia A, Barbalace F, Cerroni F, Cozzi S, Di Bella G, Di Zio M, Filipponi D, Luzi O, Righi P, Scanu M. Guidelines for the quality of statistical processes that use administrative data, Version 1.1, Italy statistics office, (2016) . |
[11] | Cerroni F, Di Bella G, Galiè L. Evaluating administrative data quality as input of the statistical production process, Italy statistics office, N. 1-2/2014, (2014) , pp. 117-146. |
[12] | UK Office for National Statistics ((2013) ). Guidelines for Measuring Statistical Output Quality, Version 4.1, the Information Policy Team, The National Archives, Kew, London TW9 4DU. |
[13] | Statistical Center of Iran, National Statistics Quality Framework, Survey assessment and statistics standard office, (2016) . |
[14] | Sayers A, Ben-Shlomo Y, Blom A, Steele F. Probabilistic record linkage. International Journal of Epidemiology. (2016) ; 954-964, doi: 10.1093/ije/dyv322. |
[15] | United Nations Economic Commission for Europe ((2017) ), A Guide to Data Integration for Official Statistics, High Level Group for the Modernization of Official Statistics Data Integration Project, Version 1.0. |
[16] | Eurostat. Insights on Data Integration Methods. Available at https://unstats.un.org/unsd/EconStatKB/KnowledgebaseArticle10242.aspx. Last viewed 25 September 2020, (2008) . |
[17] | Eurostat ((2008) ). Quality assessment of administrative data for statistical purposes. Doc. Eurostat/A4/Quality/03/item6. Available at https://unstats.un.org/unsd/EconStatKB/KnowledgebaseArticle10264.aspx. Last viewed 25 September 2020. |
[18] | Winkler WE. Overview of Record Linkage and Current Research Directions, Statistical Research Division U.S. Census Bureau, Washington, DC 20233. Research Report Series, (2006) . |
[19] | Domingo-Ferrer J, Torra V. Distance-based and probabilistic record linkage for re-identification of records with categorical variables, supported by the European Commission under project IST-2000-25069 “CASC”, (2004) . |
[20] | Winkler WE. “Advanced Methods for Record Linkage”, All content following this page was uploaded by William E. Winkler on 01 April (2015) . |
[21] | Gupta V, Lehal G. A Survey of Text Mining Techniques and Applications. Journal of Emerging Technologies in Web Intelligence. (2009) ; 1: (1). |
[22] | Vijayarani S. Preprocessing Techniques for Text Mining – An Overview. International Journal of Computer Science & Communication Networks. (2013) ; 5: (1): 7-16. |
[23] | Niwattanakul S. Using of Jaccard Coefficient for Keywords Similarity, Proceedings of the International Multi Conference of Engineers and Computer Scientists 2013 Vol I, IMECS, March 13–15, (2013) , Hong Kong. |
[24] | Gunawan D. The Implementation of Cosine Similarity to Calculate Text Relevance between Two Documents. Journal of Physics Conference Series. (2018) ; 978: (1): 012120. |
[25] | World Bank ((2009) ), Export and Import Price Index Manual”, Theory and Practice, ISBN 978-1-58906-780-6. |
[26] | Dass P, Ossen S, Vis-Visschers R, Arends-Tóth J. Checklist for the quality evaluation of administrative data sources, ISSN: 1572-0314, (2009) . |
[27] | United Nations, Harmonized Commodity Description and Coding Systems. Available at https://unstats.un.org/unsd/tradekb/Knowledgebase/50018/Harmonized-Commodity-Description-and-Coding-Systems-HS#:∼:text=The%20Harmonized%20System%20is%20an,a%20six%2Ddigit%20code%20system. Last viewed September (2020) . |
[28] | UN Global Working Group Bureau, ((2019) )Big Data for Official Statistics report, Statistical Commission Fiftieth session, Economic and Social Council |
[29] | Collins D. Report on the price statistics mission, IMF statistics department, review, (2013) . |
[30] | Wallgren A, Wallgren B. Register-based Statistics – Administrative Data for Statistical Purposes. John Wiley & Sons Ltd, Chichester, England, (2014) . |
[31] | Hand DJ. Statistical challenges of administrative and transaction data (with discussion). Journal of the Royal Statistical Society, Series A. (2018) ; 181: : 555-605. |
[32] | Christen P. Data matching: concepts and techniques for record linkage, entity resolution, and duplicate detection. Springer, (2012) . |


