The nutritious price index and food security of urban and rural households in Iran
Abstract
High food inflation rate in Iran in recent years places many low-income households at risk of malnutrition. Since food security and nutrition are essential dimensions of the Sustainable Development Goals (SDGs), this paper aims to create a reliable measure of food security in Iran among different income decile groups and urban and rural areas. The paper also attempts for the first time, to extract health-related indicators from the consumer price index (CPI) and the Household Income and Expenditure (HIES) surveys historically conducted by the Statistical Center of Iran (SCI). This study reaggregates CPI price data to calculate the nutritious food price index (NPI) for urban and rural households in Iran. Moreover, the “Cost of a Recommended Diet (CoRD)” method is used to measure the trends and spatial variations in the costs of nutrition. The paper presents the results of using the CoRD method for regional levels and decile income groups. Results show that the cost of a healthy diet increased in recent years. Likewise, the healthy food price index is higher than the overall food price index. Finally, the results indicate that the NPIs in urban areas are higher than in rural areas.
1.Introduction
Access to nutritious food depends on household income [1]. The health of individuals in society is important for the development of a country. Numerous studies have shown that the cost of nutritious foods (such as fruits, vegetables, and meat) is generally higher than the cost of less nutritious foods (such as oil and sugar) [3]. Cost barriers prevents low-income households from accessing nutritious foods, which can lead to malnutrition. It was noted that nutritious food also spoils easily and therefore, more difficult to transport than less nutritious foods, further increase sharply prices. According to the Food and Agriculture Organization (FAO) report in 2019, 4.9% of Iran’s population is malnourished, 6.8% of the children (under 5 years age) consume stunted growth, 25.5% of adults (18 years and older) are obese and the prevalence of anemia-among women aged 15 to 49 is over 30% [7].
A review of nutritional status in Iranian populations in 2013 suggests there has been an increase in education to teach Iranians about healthy diets [5]. However, cost remains a barrier in households accessing nutritious food. To assess the status of household consumption baskets, it is necessary to measure the cost of a desirable daily food basket recommended by nutritionists for a person’s health. The production of both spatial and temporal insights into the affordability of nutritious food in Iran will better enable policy makers to address the issue of access to healthy food.
2.Sources and method
In order to investigate nutritional status in Iran, two approaches are taken. The cost of the recommended diet (CoRD) method is applied to food price data for urban and regional areas additionally, a Nutrition Price Index (NPI) is calculated in order to examine the price change for the minimum recommended nutritious diet. This index reflects changes in food prices based on their nutritional value.
Table 1
Desirable food basket for Iranian society (individual daily consumption/gram)
| Items | 2–3 years | 4–5 years | 6–11 years | 12–17 years | 18–29 years | 30–60 years | 61 years and older | Average | |||||||
|---|---|---|---|---|---|---|---|---|---|---|---|---|---|---|---|
| M | F | M | F | M | F | M | F | M | F | M | F | M | F | ||
| Rice | 30 | 30 | 40 | 30 | 80 | 70 | 100 | 60 | 120 | 75 | 120 | 75 | 80 | 75 | 70.36 |
| Bread | 50 | 50 | 60 | 60 | 110 | 110 | 350 | 270 | 340 | 240 | 340 | 210 | 220 | 150 | 182.86 |
| Noodle | 30 | 30 | 30 | 20 | 30 | 20 | 30 | 20 | 50 | 30 | 50 | 20 | 20 | 20 | 28.57 |
| Meat | 20 | 20 | 20 | 20 | 40 | 50 | 45 | 50 | 38 | 40 | 35 | 50 | 35 | 30 | 35.21 |
| Chicken | 10 | 10 | 30 | 30 | 40 | 50 | 70 | 64 | 64 | 70 | 64 | 70 | 64 | 65 | 50.07 |
| Dairy | 300 | 300 | 300 | 300 | 400 | 400 | 450 | 500 | 350 | 400 | 350 | 500 | 400 | 500 | 389.29 |
| Eggs | 30 | 30 | 35 | 30 | 35 | 40 | 50 | 35 | 35 | 35 | 35 | 35 | 35 | 35 | 35.36 |
| Oil | 20 | 20 | 25 | 30 | 35 | 30 | 45 | 35 | 45 | 25 | 40 | 25 | 49 | 20 | 31.71 |
| Fruits | 150 | 150 | 200 | 200 | 200 | 200 | 350 | 280 | 320 | 280 | 280 | 280 | 280 | 280 | 246.43 |
| Vegetables | 150 | 150 | 150 | 150 | 250 | 250 | 400 | 400 | 300 | 400 | 330 | 300 | 300 | 300 | 273.57 |
| Potatoes | 30 | 30 | 40 | 40 | 70 | 70 | 100 | 70 | 90 | 50 | 90 | 40 | 50 | 60 | 59.29 |
| Grain | 10 | 10 | 10 | 10 | 20 | 20 | 26 | 20 | 20 | 30 | 20 | 20 | 20 | 20 | 18.29 |
| Sugar | 20 | 20 | 35 | 30 | 30 | 25 | 40 | 30 | 50 | 30 | 40 | 30 | 30 | 20 | 30.71 |
2.1Data sources
Cost of the “desirable food basket” has been published according to the consumption patterns of Iranian households and per capita consumption, which is based on information obtained from the study of food consumption patterns and the balance sheet of the Office of Community Nutrition Improvement of the Ministry of Health of Iran. (Desirable food basket for Iranian society, 2013). The basket is designed to provide at least 100 percent of the household’s energy needs and at least 80 percent of the five key nutrients (protein, iron, calcium, vitamin A and riboflavin) [5]. In this study, the average of recommended amounts of daily consumption of each food item for all age and sex groups have been used (Table 1).
The average annual food price data were obtained at the national and provincial levels from the CPI of the SCI. Additionally, results of the household income and expenditure survey of the SCI are used to provide a point of reference against the costs of nutritious foods.
To produce aggregate measures of price change, we need to combine the expenditure patterns with estimates of price change for nutritious goods.
2.2The cost of recommended diet (CoRD)
The CoRD calculation method allows estimation of the extent to which Iranian households have access to desirable nutrition to be assessed. To calculate the CoRD, the recommended amounts of food items were used (Table 1). The unit of measurement for some items in the consumer price index survey may vary at different times, so first, the unit of measurement for each item is converted to 1000 grams to ensure the pricing basis is held constant. For example, in the case of “bread”, in some years the price of one loaf of bread is measured, while in some others the price of 1000 grams has been taken. In this case, using the information published by the official institutions about the weight of bread, the price of one loaf of bread has been converted to a price per 1000 grams average unit value.
As the goal of this method is to calculate the minimum cost required to achieve the recommended diet, from each group of the CPI, the two items that have the lowest cost are selected. Finally, the required costs of the recommended amount of each food item for both males and females of all age groups are calculated. By summing up the cost of items in the desirable food basket, the minimum amount needed to achieve proper nutrition is calculated. To produce a single measure, a simple arithmetic mean is calculated from the minimum required cost for males and females across age groups.
The CoRDs were calculated for two years, 2008 and 2018, in both urban and rural areas. This information was the basis for comparing food security across time and space (between regions).
Table 2
CPI weight in urban and rural areas versus NuVal weight
| Group items | Urban | Rural | NuVal |
|---|---|---|---|
| Food and non-alcoholic beverages | 100.00 | 100.00 | 100.00 |
| Bread and cereals | 23.63 | 26.92 | 8.26 |
| Meat and other parts of slaughtered animals’ preparations | 21.93 | 20.33 | 2.13 |
| Fish and other seafood | 3.00 | 2.17 | 7.03 |
| Milk, other dairy products and eggs | 10.69 | 8.42 | 11.05 |
| Oils and fats | 4.54 | 5.23 | 0.13 |
| Fruits and nuts | 13.10 | 10.38 | 40.42 |
| Vegetables | 10.66 | 12.22 | 27.59 |
| Sugar, confectionery and desserts | 5.13 | 5.70 | 0.40 |
| Other food products | 3.51 | 3.87 | 1.66 |
| Non – Alcoholic Beverages | 3.80 | 4.75 | 1.34 |
2.3The nutrition price index (NPI)
Calculating NPI is quite similar to that used for the CPI. However, instead of using expenditure coefficients, a weight reflecting the nutritional value of each item is used instead. Therefore, to calculate NPI, the indices for food and beverage groups (4-digit COICOP classification) are reaggregated according to the nutritional weighting schedule. In other words, the NPI does not reflect the level of food prices, but rather reflects the level of food prices in terms of nutritional value. As Iran does not have an official guide to food items scored by nutritional value, the NuVal (Nutritional Scoring System), which previously ranked food items in the United States based on nutritional value is used to calculate weights for the NPI [9]. This index ranks the nutritional value of items from 1 to 100. In the case of items that are in CPI basket of Iranian households but do not have a NuVal score, the score of similar items was used as an alternative.
In the first step, using NuVal coefficients, the weight of each item within each class is adjusted in the CPI survey, and is then aggregated for classes of food. Finally, by aggregating these groups using nutritional weights, NPI is calculated. Table 2 indicates the expenditure food weights that are used in the urban and rural CPI and NPI nutritional scores weights. The first and second columns show the urban and rural food groups weights, corresponding CPI, which are officially published by SCI. This weights are derived from the HIES. The third column includes the NuVAL that are calculated using the aggregation of the nutritional scores of food items in each CPI food group. As expected, the weight of healthier food groups such as fruits and vegetables in the food basket of urban and rural households in Iran is less than the weights that calculated based on the nutritional score value of these groups. Comparison of NuVal weights and CPI weights for the urban and rural areas are shown in Table 2.
Figure 1.
Percent of households with food cost falling below CoRD in urban area.
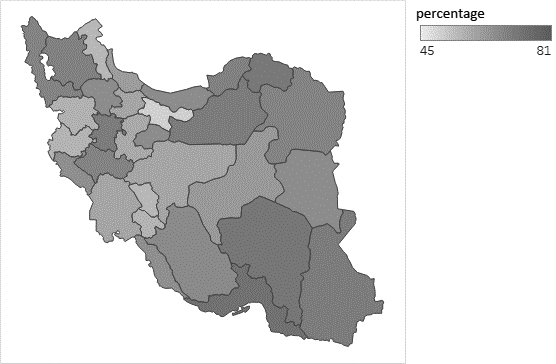
Figure 2.
Percent of households with food cost falling below CoRD in rural area.
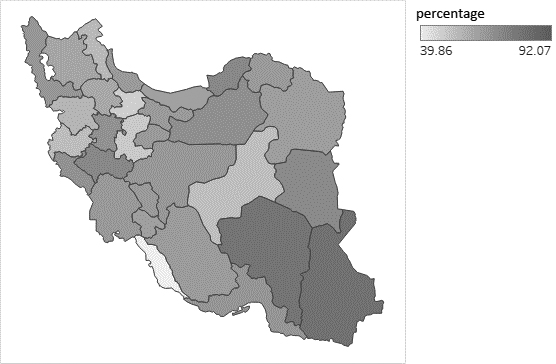
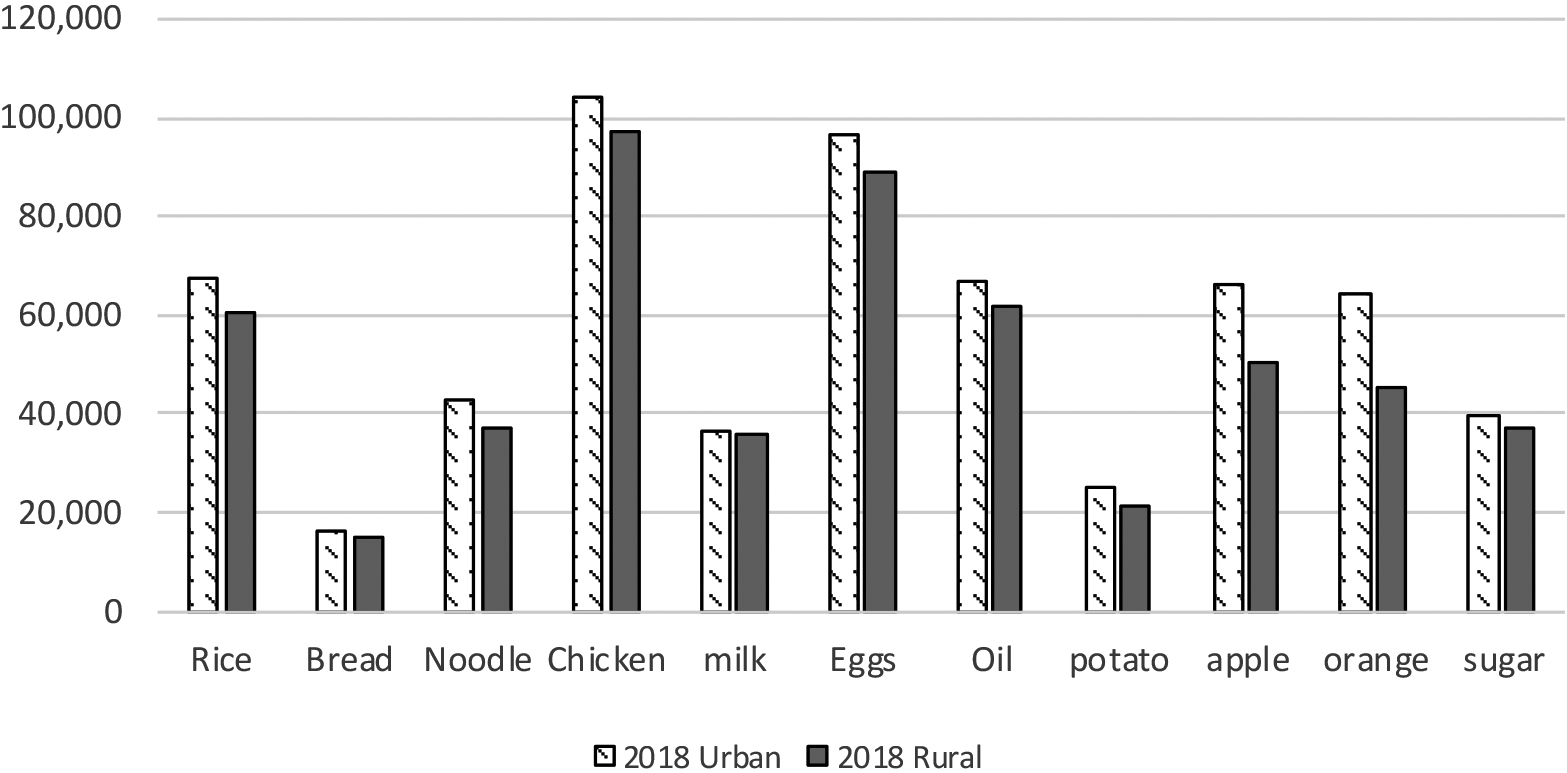
Figure 3.
Average price of selected nutrition food items in urban and rural area, 2018 (1000 gram/IRR).
3.Result
3.1CoRD across provinces of Iran
The CoRD for a typical 4-person family in Iran in 2018 is 54 percent of the official daily minimum wage of 505,626 IRR for urban households and 48% of the 505,626 IRR minimum daily wage for rural households. As the CoRD estimates the cost of a desirable nutritious diet, it is expected to be an expensive basket for Iranian household, and the results align with these expectations. According to HIES, most Iranian households spend less than CoRD on food and beverages. This can be due to low income or a preference for less nutritious food. Comparing the results of the CoRD and HIES in Iran’s provinces indicate that in 2018, 52 to 80 percent of households consume unhealthy diets. The province of Tehran has the best situation with 52 percent of households spending less than CoRD on food and beverages, while the province of Hormozgan has the worst situation with 80 percent of household spending less than CoRD. Additionally, the results for the rural area show that at least 40% of households in the province of Alborz and up to 92% of households in the provinces of Sistan and Baluchistan consume unhealthy diets. A comparison of these results with 2008 show that over ten years, households that fall below CoRD rose in 26 of 30 provinces in the country.
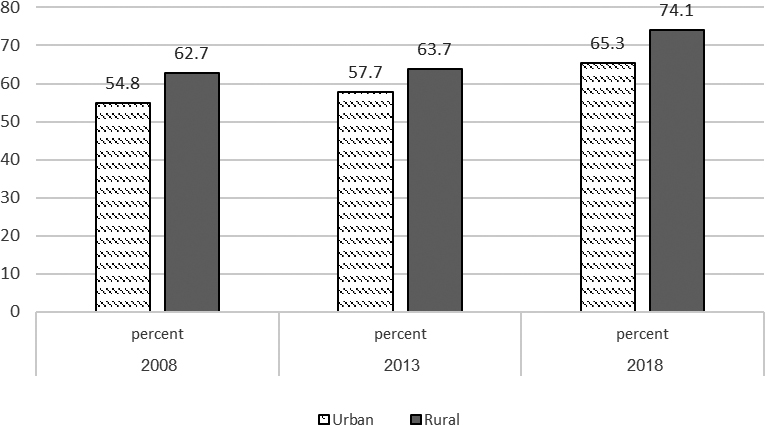
Figure 4.
Percent of household with food cost falling below CoRD in rural and urban area.
3.2The urban and rural CoRDs
To calculate the CoRD for both groups of urban and rural households, the same nutritious diet has been used. Because the CPI survey in Iran is implemented separately in urban and rural areas and separate food price data are available for each of these areas. Figure 3 shows the prices of selected nutritious food items in urban and rural areas in 2018. Clearly, the prices of food items, especially fruits and meat products, were higher in urban areas than in rural. However, Fig. 4 shows that the percentage of households that spend less than CoRD was higher in rural areas than in urban, and this gap increased in recent years. We argue that because fresh food prices are determined by the local market, they are cheaper in rural areas. However, the low-level income in rural areas has led to a higher percentage of households suffering from malnutrition than urban areas.
3.3CoRD and the income decile groups
An examination of food cost among urban income deciles show that from 25 percent of households in the tenth income decile to 93 percent in the first income decile spend less than CoRD on food and beverages. In rural areas, 34 percent of households in the tenth income decile to 94 percent of households in the first income decile spend less than CoRD. Figure 6 shows that the in the first and second income deciles, the percentage of households that spend less than CoRD decreased in 2013 compared to 2008. The reason for this could be the implementation of a targeted subsidy policy at that time [8]. We find the same result for rural income deciles in 2013.
Figure 5.
Percent of household with food cost falling below CoRD in rural and urban income deciles – 2018.
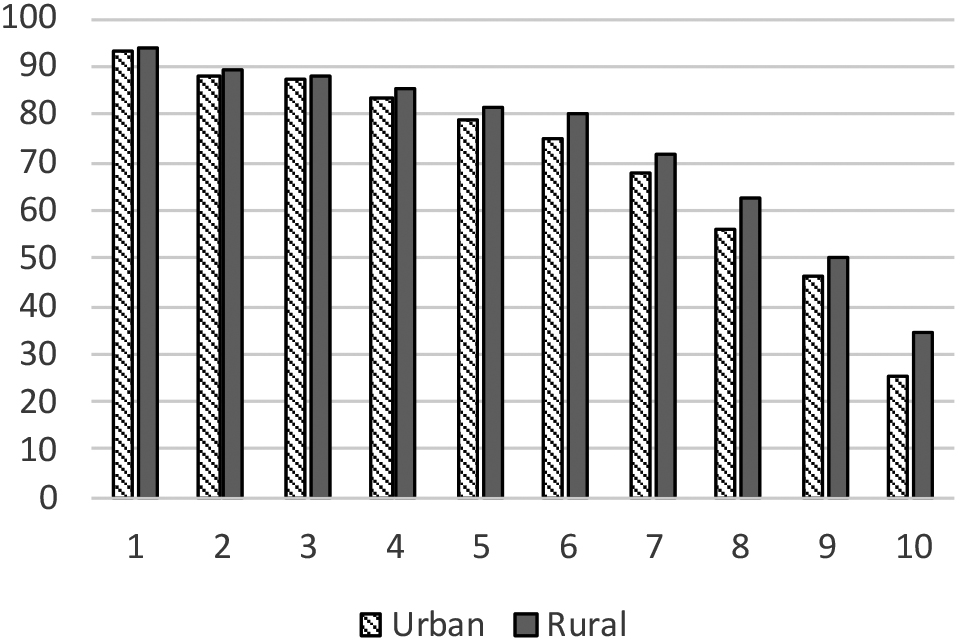
Figure 6.
Percent of household with food cost falling below CoRD in urban income decile.
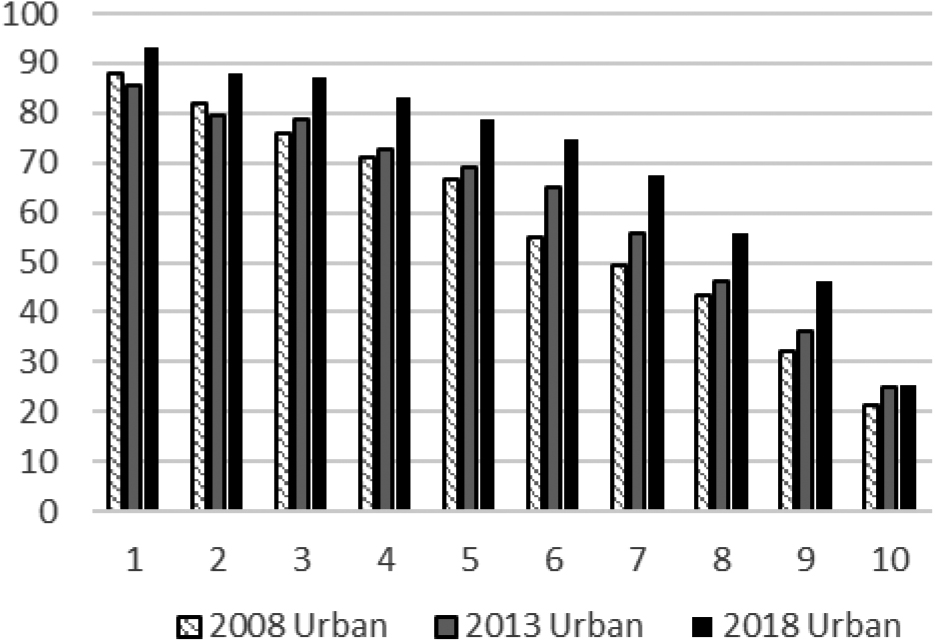
Figure 7.
NPI versus food and beverage CPI inflation – rural area.
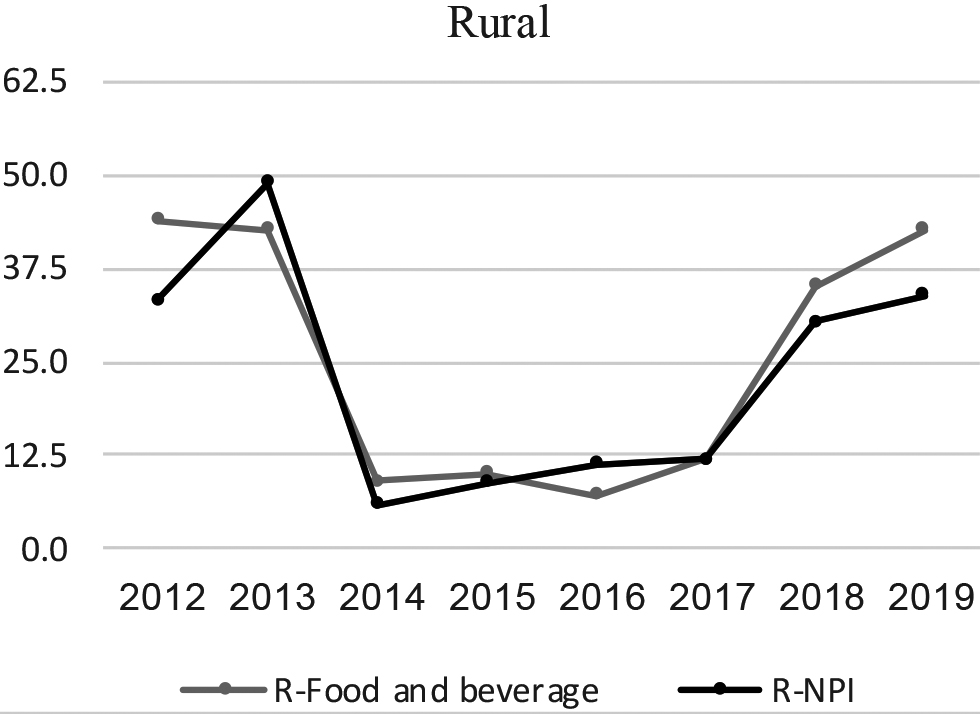
Figure 8.
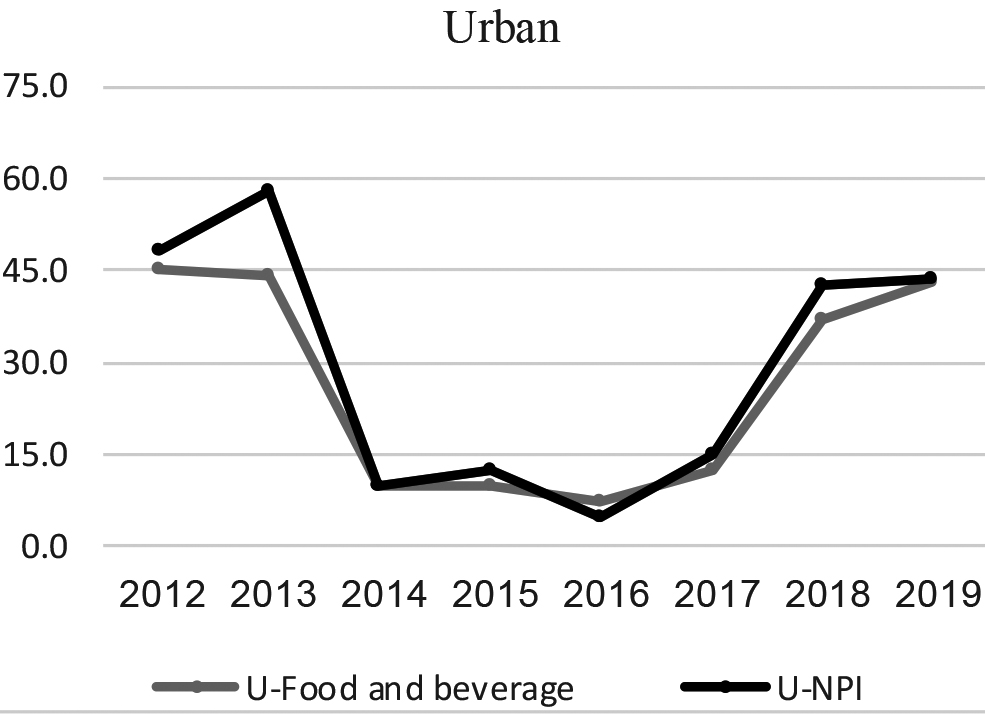
NPI versus food and beverage CPI inflation – urban area.
3.4Increasing NPI in recent years
To understand how the cost of nutritious food changed over time, the NPIs were calculated for nine years from 2011 to 2019. Figures 7 and 8 show the annual changes in the NPIs between 2012 and 2019. Results show that in most years NPI inflation rates have been higher than that of food inflation. In 2019, NPI inflation rate was 0.8 percentage points higher than the CPI inflation rate for food and beverage group. However, the trend was the opposite for rural households where in most years NPI inflation rate has been lower than the inflation rates for the CPI food and beverages group. In 2019, the NPI inflation rate was 8.8 percentage points lower than the inflation rate for food and beverage group of the regular CPI. These results align with those obtained using the CoRD method, with nutrition costs in rural areas less than those in urban areas.
4.Conclusion
In this paper, indicators beyond the CPI were used to examine the food basket consumed by households, specifically the CoRD and NPI. Comparing the CoRD and realized household expenditure (HIES) show that it is difficult for households to access a healthy food basket, and this is more severe in rural areas. Findings show that the percentage of households whose food costs are below the CoRD is rising over time, and an increasing percentage of households in the lower-income deciles are under the CoRD. The worsening nature of this matter indicates a serious threat to the food security of Iranian households. The results of this study can be used to inform policymakers in this field of the extent and severity of the issue. Controlling the prices that supply the CoRD basket and subsidizing deprived areas and deciles are some of the things that policymakers may consider to improve the situation. Since the results of the CPI and the cost of HIES are published regularly for provinces and different income deciles, policymakers can easily track health-related indicators on an ongoing basis.
In the end, it is necessary to remember that enabling the people to access adequate nutrition is a precondition for socio-economic development, while ignoring this issue will take the society away from the development goals.
Acknowledgments
I would like to express my very great appreciation to Ms. Eileen Capilit, Mr. Pieter Everaers, Ms. Catherine Smyth and Mr. Leigh Merrington for their valuable and constructive suggestions during the planning and development of this paper.
References
[1] | Abdi F, Atarodi Z, Mirmiran P, Esteki T. ((2016) ). A Review of Nutritional Status in Iranian Population, Focus on Sciences. 2. |
[2] | Darmon N, Drewnowski A. ((2015) ). Contribution of food prices and diet cost to socioeconomic disparities in diet quality and health: a systematic review and analysis. 73. |
[3] | Dizon F, Herforth FM. ((2018) ). The Cost of Nutritious Food in South Asia. Policy Research Working Paper. 8557. |
[4] | Huppe AG, Shaw S, Dion J, Voora V. ((2013) ). Food Price Inflation and Food Security: A Morocco case study, The International Institute for Sustainable Development. |
[5] | Salehi F, Abdollahi Z, Abdollahi M. ((2013) ). Desirable food basket for the Iranian society. Ministry of Health and Medical Education. |
[6] | Temple NJ, Steyn NP, Villiers A. ((2011) ). Price and availability of healthy food: A study in rural South Africa, Applied nutritional investigation. |
[7] | Food and Agriculture Organization of the United Nations. ((2019) ). The state of food security and nutrition in the world. |
[8] | Regarding the operation of the Law on Targeted Subsidies. ((2016) ). Islamic Parliament Research Center of The Islamic Republic Of IRAN. Report of Budget and Accounting Commission. |
[9] | David LK, Valentine YN, Lauren QR, Arthur R, Keith TA. ((2010) ). Performance characteristics of NuVal and the Overall Nutritional Quality Index (ONQI). |
[10] | FAO. ((2014) ). Refinements to the FAO Methodology for estimating the Prevalence of Undernourishment Indicator. Rome: Food and Agriculture Organization of the United Nations. 1–35. |


