
Nation’s waste on the scale: The first Bhutan waste inventory report
Abstract
Knowing the quantity and the composition of waste is essential to designing and delivering sound waste management policies and waste management systems. Bhutan’s 12th Five-Year Development Plan emphasizes effective waste management as one of its key performance indicators and globally, the 2030 Agenda for Sustainable Development emphasizes the importance of waste in two of its seventeen Sustainable Development Goals. In 2019, the Bhutan National Statistics Bureau undertook its first ever survey of solid waste management. The survey covered waste generating sectors including households, commercial units, institutes, health centers, industries, Government offices and vegetable markets. Results show Bhutan generated more than 170 metric tons of waste daily – equivalent to 170,000 kilograms of sugar. More than 50 percent of solid wastes came from households, almost 50 percent was food waste, and around 50 percent was potentially recyclable. The survey posed many challenges for Bhutan, a land-locked least developed country in the Eastern Himalayas in South Asia, yet provided the opportunity to strengthen stakeholder engagement in the Bhutan National Statistical System and delivered statistics which meet a practical use for Bhutan and its people.
1.Introduction
Bhutan is a land-locked least developed country situated in the East Himalayas in South Asia. With a population of nearly 800,000 people and a Gross National Income per capita of $3,102, it is due to graduate to a developing country status in 2023 [13].
Like most developing countries, there has been rapid population growth and urbanization in Bhutan and this is leading to an increasing volume of waste generated. Increasing volumes pose challenges in providing adequate and efficient waste management services to the country. Moreover, Article 5 of the Constitution of the Kingdom of Bhutan provides constitutional right to every Bhutanese to be a trustee of the Kingdom’s natural resources and environment for the benefit of the present and future generations, and makes it a fundamental duty of every citizen to protect the natural environment, conserve the rich biodiversity and prevent all forms of ecological degradation including noise, visual and physical pollution through the adoption and support of environment-friendly practices and policies [2]. Bhutan’s 12th Five-Year Development Plan 2019–2023 also emphasizes effective waste management, including as a key performance indicator as measured by the absolute amount of solid waste (in tons) recycled [3].
The Royal Government of Bhutan has implemented some policies directed at waste management. For example, waste management over 2020 has received increased impetus with the observation of ‘Zero Waste Hour’ on the second day of every month. The aim of the Zero Waste Hour is to inculcate a behavioral change towards proper waste management and to practice sustainable consumption lifestyles for a safe, healthy and clean environment [14].
The 2030 Agenda for Sustainable Development [4] adopted by United Nation Member States in 2016 gives utmost importance to the environmental dimensions of sustainable development, with waste recognized as important to two of the 17 globally agreed Sustainable Development Goals. Goal 11 to make cities and human settlements inclusive, safe, resilient and sustainable and Goal 12 to ensure sustainable consumption and production patterns. Target 11.6 is to reduce, by 2030, the adverse per capita environmental impact of cities, including by paying special attention to air quality and municipal and other waste management. Target 12.3 is to halve, by 2030, the per capita global food waste at the retail and consumer levels and reduce food losses along production and supply chains, including post-harvest losses. And Target 12.4 is achieve, by 2030, environmentally sound management of chemicals and all wastes throughout their life cycle in accordance with agreed international frameworks, and significantly reduce their release to air, water and soil in order to minimize their adverse impacts on human health and the environment are concrete evidences for the need of more and more waste related statistics.
To deliver official statistics which meet the test of practical utility for Bhutan’s 12
Therefore, it has become imperative to have quality waste related statistics in Bhutan not only to serve as baseline data for Bhutan’s response to the 2030 Agenda and its Sustainable Development Goals, but more importantly for the development of sound waste management policies and plans and to study, at later stage, greenhouse gas emissions from such waste.
This paper presents the approaches, experiences and major milestones achieved in implementing the first waste account inventory survey in Bhutan. After a short introduction to the National Statistics Bureau of Bhutan (Section 2), section three will expand on methodologies adopted to better measure solid waste before presenting the situation in Bhutan in terms of its solid wastes in section four. The paper concludes with challenges and recommendations.
2.Bhutan’s National Statistics Bureau
Bhutan’s National Statistics Bureau (NSB) came into being in 2003 when the governance structure of its predecessor, the Central Statistical Organization, underwent major changes and was granted autonomy. However, the Bureau’s history can be traced back to 1971 when a statistical cell was established within the Ministry of Development to support formulation of policies and plans before being expanded and upgraded as the Central Statistical Organization in 1979 under the Planning Commission [15].
The NSB operates under an Executive Order issued in 2006. The executive order designates NSB as the central authority for the collection, compilation and release of any official data and its custodian thereof. NSB was designated, in 2017, as the parent agency for all the statistical officers posted in agencies/Ministries and districts (Dzongkhags).
NSB provides key statistics on economics, environmental, population and social statistics. It also works to promote greater use of statistical information, contributing to informed decision making by the government agencies, businesses, households and individuals, while protecting the confidentiality of the sensitive information collected from respondents. NSB plays an important role in relation to statistical activities both at the national and international level, as provider of data and related service.
In responding to this growing demand for quality statistics, NSB is making every effort to strengthen the institutions and mechanisms to collect, compile and disseminate statistics through improved governance, innovations and technology. Since the ultimate purpose of data is to enable us to assess the past, understand the present as well as anticipate and prepare for the future, it is NSB’s expectation that data it provides will inform public policy, promote accountability and good governance while facilitating the implementation of development interventions across Bhutan.
3.Measuring solid waste in Bhutan
According to the United Nations Framework for the Development of Environment Statistics, waste is defined as discarded material for which the owner or user has no further use and is generated by human activities in the course of production and consumption processes [17]. To reduce the amount of waste generated and increase the share of waste that is recycled and reused as material or energy source are central to sustainable consumption and production and natural resource management. Waste is usually collected at the place of generation and transported to treatment facilities (for recycling and reuse or to reduce its amount or hazardousness before final disposal) and to disposal facilities (for final disposal) [17].
Policymakers, particularly local governments, require statistics on waste in order to assess how its generation changes over time. This in turn assists in planning for present and future waste management in terms of transportation and facilities required. Statistics on waste are also needed to develop strategies to encourage waste reduction, reuse and recycling [17].
Various methodological guidance materials exist for the compilation of waste statistics including the European Waste Framework Directive [18], Eurostat Manual on Waste Statistics [19] and the United Nations System of Environmental-Economic Accounts (SEEA) Central Framework [20].
The SEEA Central Framework is an international statistical standard for measuring the environment and its relationship with the economy. The Central Framework covers measurement in three main areas:
1. Environmental flows. The flows of natural inputs, products and residuals between the environment and the economy, and within the economy, both in physical and monetary terms.
2. Stocks of environmental assets. The stocks of individual assets, such as water or energy assets, and how they change over an accounting period due to economic activity and natural processes, both in physical and monetary terms.
3. Economic activity related to the environment. Monetary flows associated with economic activities related to the environment, including spending on environmental protection and resource management, and the production of ‘environmental goods and services’.
Waste Accounts are known as a physical flow account and encompass, in the case of waste, the flow of solid waste materials between the environment and the economy, and within the economy.
Solid waste accounts are useful in organizing information on the generation of solid waste and the management of flows of solid waste to recycling facilities, to controlled landfills or directly to the environment. Measures of the amount of waste in aggregate or of quantities of specific waste materials may be important indicators of environmental pressure [21]. Solid waste accounts support analysis of who or which sectors are generating waste, for which types of solid wastes, and what economic activity is generated by wastes.
In 2019, with the support of stakeholders and development partners, NSB commissioned Bhutan’s first ever waste inventory survey to support the compilation of a waste (physical flow) account and, as a next, a possible waste (emissions) account.
Unlike other surveys conducted in Bhutan (Bhutan Living Standard Survey, Labour Force Survey), the survey covered waste generating sectors including households, commercial units, institutes, health centers, industries, Government offices and vegetable markets. The survey also followed a two-stage procedure. In the first stage, the sample units were administered survey questionnaires and in the second stage, waste from the same sample units were collected by enumerators for weight measurement and a waste composition study.
3.1Survey preparation and field enumeration
Preparation of the waste inventory survey entailed questionnaire design, stakeholder consultation, development of data capture tools, and selection and training of field enumerators.
3.1.1Questionnaire design
To prepare the draft questionnaire, several questions from other countries that conducted similar surveys were thoroughly reviewed as there were no national experiences in Bhutan to draw on. Different versions of the questionnaire were drafted based on recommendations and feedback from the stakeholder consultations. In the end, six different questionnaires were developed for different sectors since their waste management methods differed.
A pilot survey was conducted to check consistencies and the flow of the questionnaires before conducting training for field enumerators and supervisors.
3.1.2Selection and training of field enumerators
Following the finalization of the six questionnaires, field manuals were developed to guide the field enumerators and supervisors during enumeration. These manuals also provided the basis for enumerator and supervisor training prior to enumeration.
3.1.3Stakeholder consultation
Being the first ever nationwide survey on waste conducted by the NSB, several rounds of workshops were conducted at various stages of the survey preparatory phase. The survey questionnaires and methodologies were discussed with relevant stakeholders at different levels.
3.1.4Data capture and analysis
For the questionnaires, Survey Solution was used to create the interface for data capture. Survey Solution is a computer-assisted personal interviewing technology developed by and made available, for free, by the World Bank [16].
For the quantification of waste, quantity data were recorded in MS Excel by the field enumerators after collecting and measuring the waste from different each of the different sectors. The waste quantity data recorded in MS Excel format was later entered in CSPro software, a data processing software package developed by the U.S. Census Bureau and ICF International, and then exported to STATA for analysis.
3.1.5Field enumeration
On successful completion of the preparatory works of the survey, the field enumeration was conducted in November and December 2019.
3.2Sampling design
3.2.1Households
A stratified three-stage sampling design was adopted to collect information on households’ waste generation. A total of seven districts, two each from eastern and central regions and three from western region were selected applying Probability Proportional to Size with Replacement (PPSWR) sampling with number of households as the size variable. This sampling method was adopted to include the bigger districts with more households. PPSWR was also adopted to select Enumeration Area (EA) and Chiwog (village) in the selected districts and then households are selected applying Circular Systematic Sampling (CSS). This sampling technique is easy to execute and understand for enumerators and all enumerators were trained how to select the sampling units from selected primary sampling units using the same technique.
3.2.2Non-household sectors
The quota sampling technique, which is a non-probabilistic version of stratified sampling, was adopted to select sampling units for commercial establishment units, industries, medical facilities, schools, colleges and training institutes.
3.3Sampling weights determination
For households, the selection probabilities of districts, EAs and Chiwogs and households were used to determine the sampling weights.
For other sampling units, the units sampled in the seven selected districts were assumed to represent the whole population. For example, there were 319 primary schools in the country and we sampled 22. So, the sampling weight is calculated by dividing the total primary schools by the total number of sampled primary schools (319/22
In order to get representative sample of the schools, first schools were stratified by different level of school (higher grade 11–12, middle grade 9–10, lower grade 7–8 and primary grade 1–6). In second stage, the schools were stratified into boarding and non-boarding where a boarding school is a school with hostel facilities and non-boarding are schools without hostel facilities.
In order to get representative sample of health centers, health centers were first categorized based on the level such as referral hospitals, district hospitals and basic health units. This categorization is also based on the number of beds and facilities. Also for health centers, only information for general wastes were collected while information for medical wastes were obtained from administrative records.
3.4Two-stage approach for waste inventory survey
In 2010, the United Nations Economic and Social Commission for Asia and the Pacific, in conjunction with Waste Concern, released guidelines on how to assess municipal solid waste and solid waste management conditions. The guidelines are based on experience undertaking and facilitating assessments in a range of towns and cities across Asia-Pacific and support policy makers, practitioners and communities to better analyze and understand their local conditions [5]. The Bhutan NSB used the Guidelines to collect and measure solid wastes from the sampling units and study the waste composition by different waste contributing sectors. The procedure for collection of data was as follows:
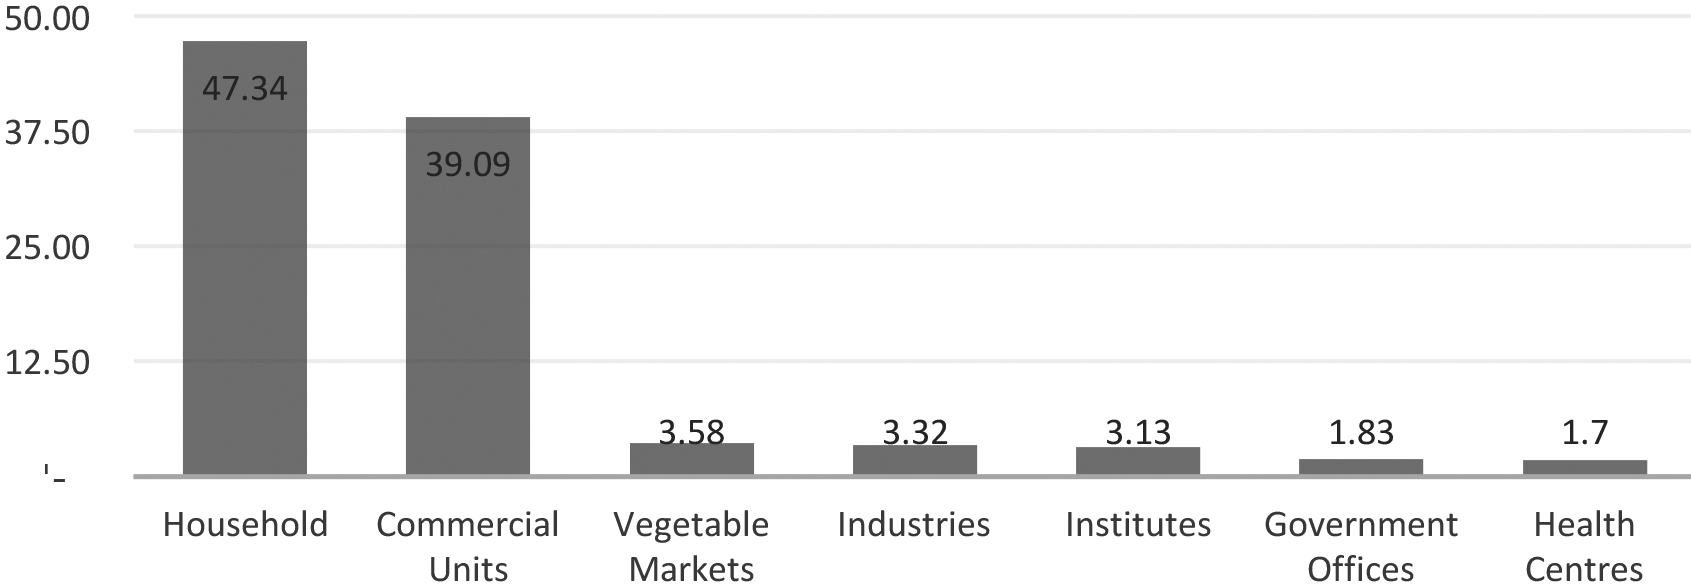
Figure 1.
Proportion of wastes from different sectors in percent, Bhutan 2019.
• The selected sampling units (Households, Commercial units, Institutes, Health centers, Industries and Private waste companies) were first administered the questionnaires by the enumerators.
• Subsequently, the units were provided with plastic bags to store the waste generated. Households were asked to store daily waste generated for a period of one week (seven days) while establishments/units were asked to store two days’ waste (as they generate a substantial amount of waste). Collection days were agreed with respondents and their waste was collected based on the agreed schedule.
• This was followed by sorting and weighing the waste by its different composition, and recording the weight in the data sheets developed for waste quantification.
• The survey enumeration was conducted for 36 days by 40 enumerators and 10 supervisors.
• After the data collection was completed, the consolidated dataset underwent a thorough checking exercise to identify missing values, errors and inconsistencies and responses that did not meet established criteria for plausibility.
• Data checking and editing was conducted from December 2019 to January 2020. In many cases, issues were followed up through telephone calls with the respondents to resolve the problems.
4.Results and findings
In 2019, total solid waste generated in Bhutan was a little over 170 thousand kilograms per day, or the equivalent of 170,000 one-kilogram bags of sugar. Per capita, this is approximately 0.2 kilograms per person, per day.
More than 85 percent of solid wastes come from the household and commercial sectors, whereas health centres generate the least solid waste (Fig. 1).
Figure 2.
Waste composition in percent, Bhutan 2019.
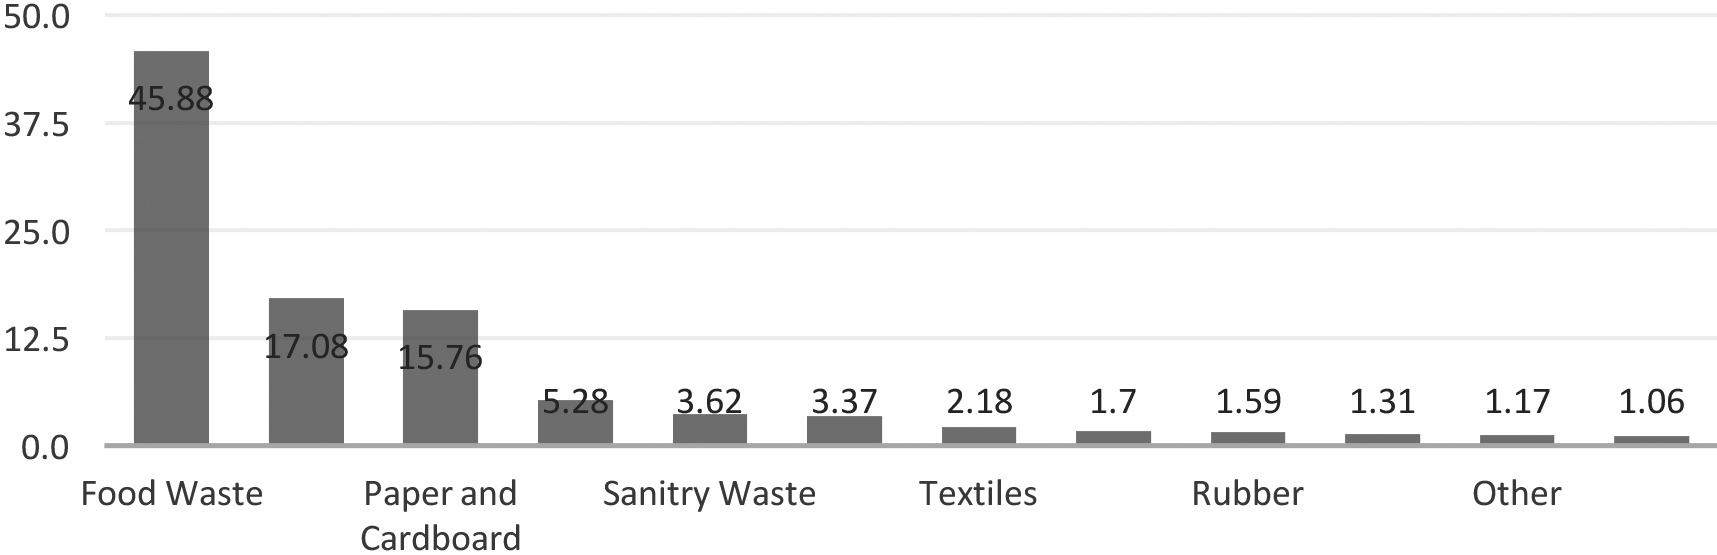
Figure 2 illustrates the composition of solid waste from various sources, in percent. Of the total waste generated, approximately 50 percent comprises food wastes generated from kitchens such as vegetables, fruits, food remains, etc.. Plastics (soft plastics, pet bottles & HDPE) comes in second with 17 percent followed by paper and cardboard (15%).
These findings indicate the potential, in Bhutan, for composting, recycling and reuse. In the recent years, with support from Non-Governmental Organizations, composting is picking up in Bhutan and given approximately 50 percent of solid wastes in 2019 were food wastes, investment in waste composition projects could be one possible response based on these findings. In terms of recycling and reuse, despite the potential, waste recycling is at an infant stage in Bhutan and is mainly operated by the informal sector or formally registered small scale scrap dealers. With few registered scrap dealers and recycling companies, recycling efforts and revenue from recycling often go unrecorded and unnoticed leading to data shortages on waste recycling.
Other findings from the 2019 survey results reveal the following.
4.1Households
Households generated more than 80,000 kilograms of solid waste every day. On average, each household generated around 0.5 kilograms of solid waste in a day. The waste generated by urban households (0.7 kg per day per household) was almost double the amount of waste generated by rural households (0.4 kg per day per household).
As shown in Fig. 3, in the urban households, food waste constituted almost 60 percent of the total waste while in the rural households, the proportion of food waste was comparably lower at 40 percent. This is mainly because the food wastes in rural part of Bhutan is either served to domestic animals or are dumped in kitchen gardens directly. In both urban and rural households, plastics, and paper and cardboard come next after food wastes.
Figure 3.
Composition of household’s waste in Bhutan in percent, 2019.
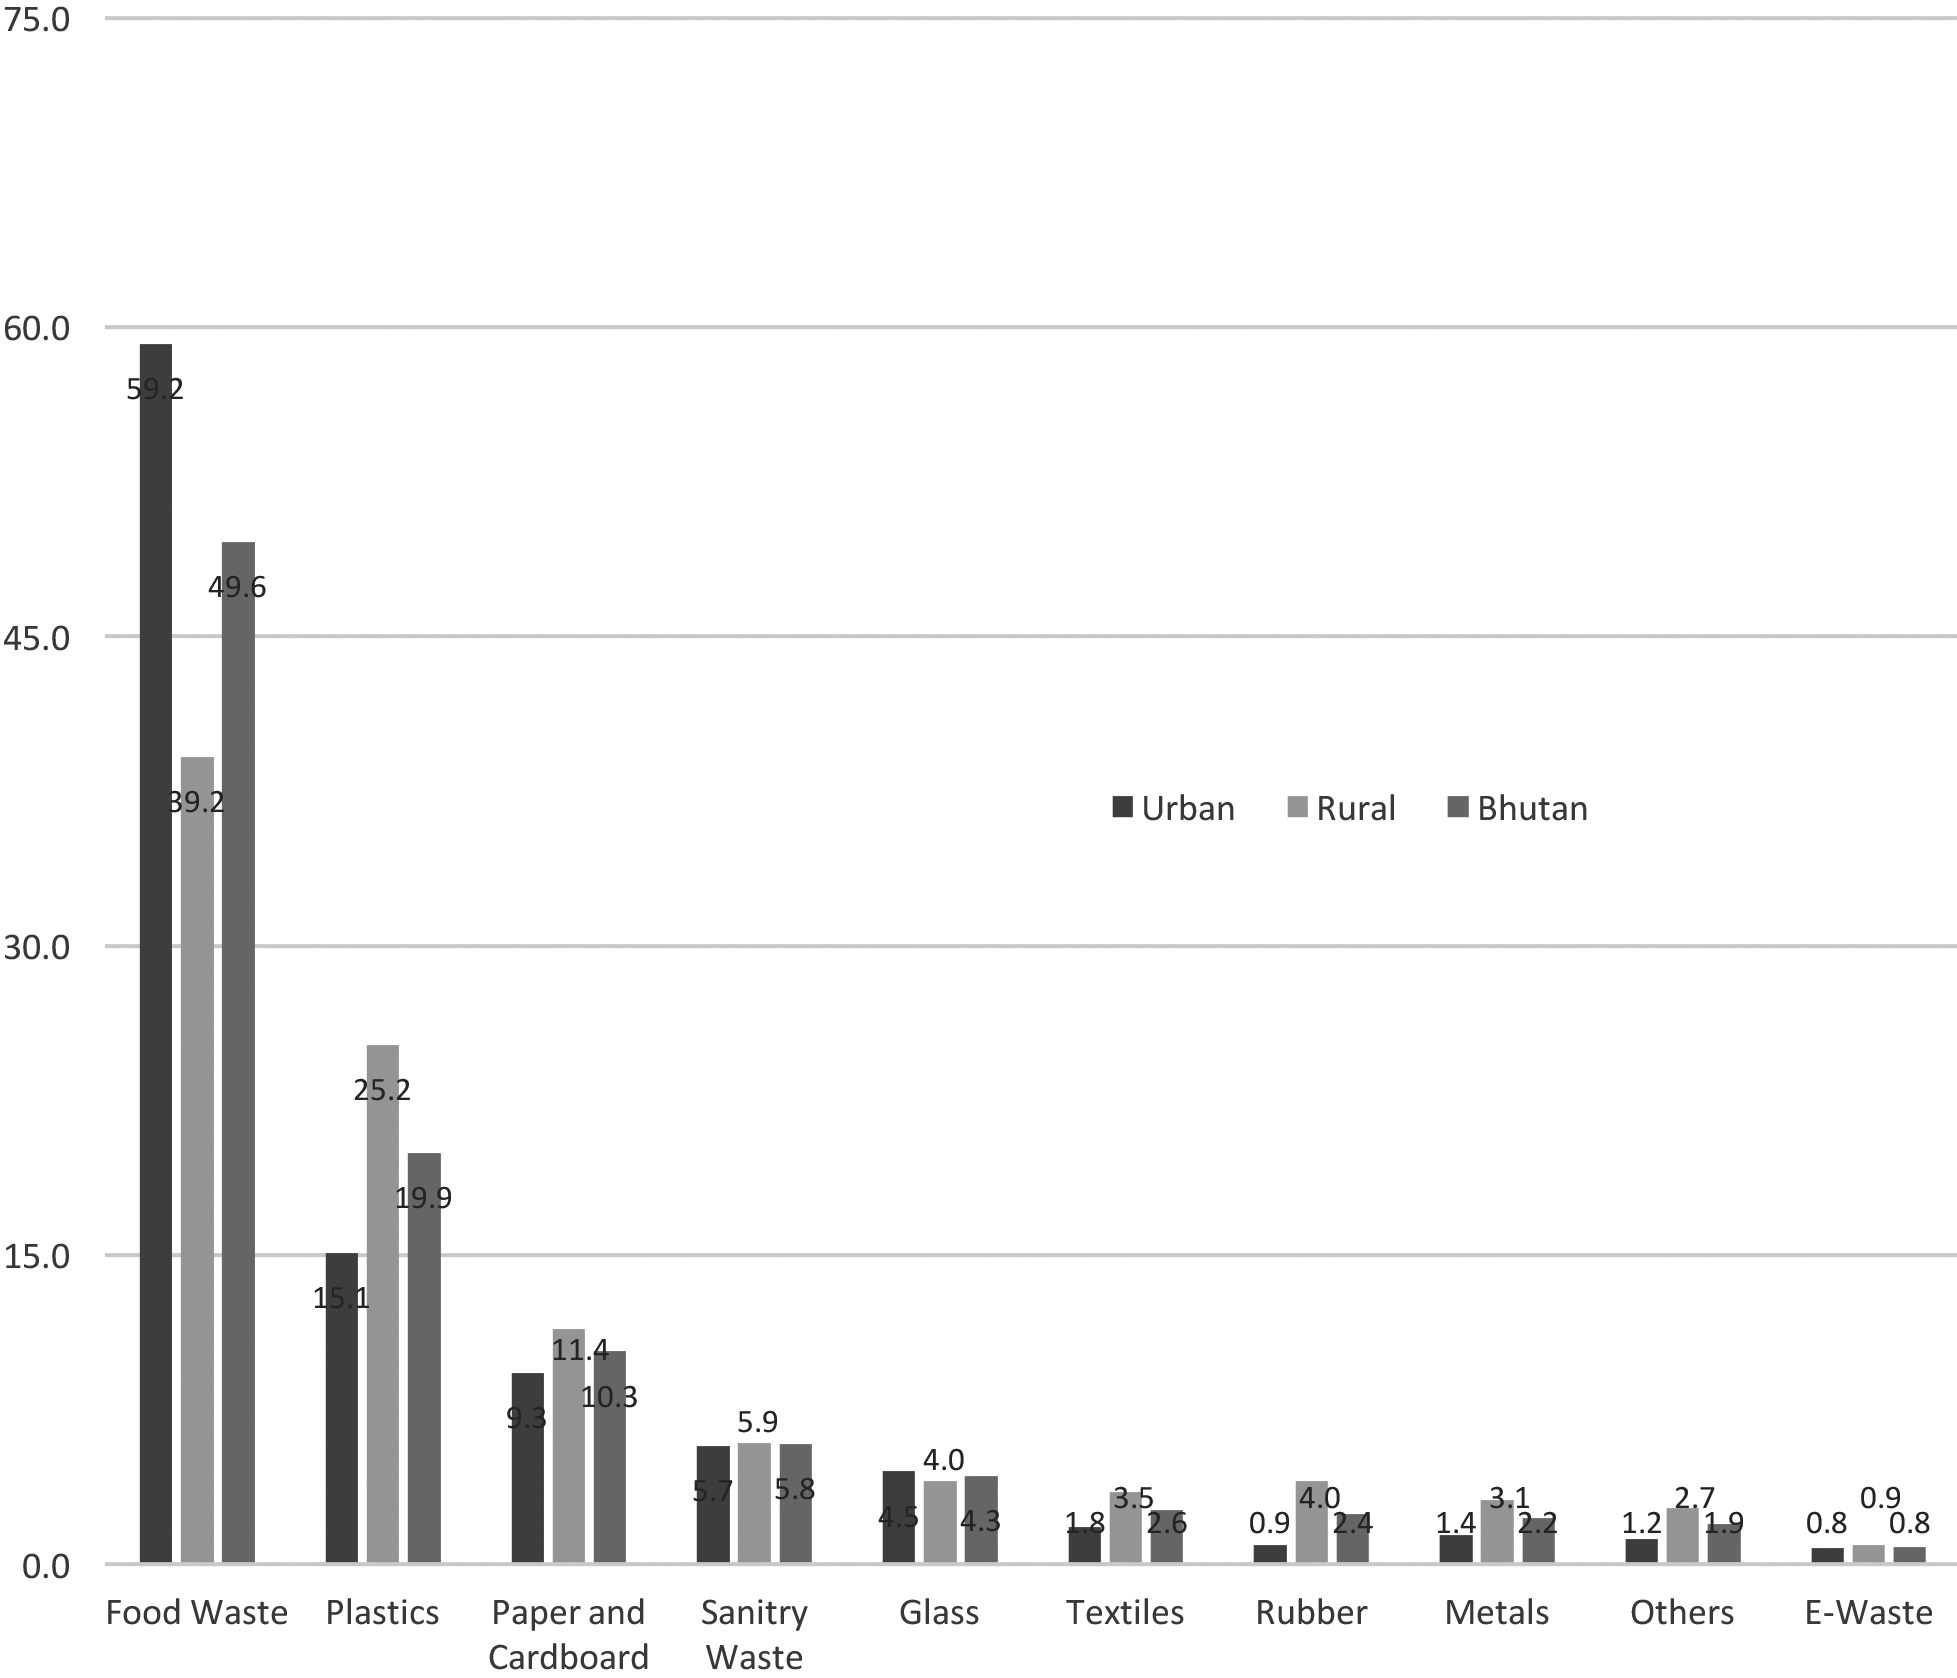
Table 1
Households’ waste disposal practices in Bhutan in percent, 2019
| Waste disposal method | Urban | Rural | Bhutan |
|---|---|---|---|
| Use collection service | 80.6 | 12.4 | 42.4 |
| Throw in pit | 13.2 | 62.6 | 40.9 |
| Open burning | 9.8 | 54.6 | 34.9 |
| Drop-off center | 9.6 | 13.3 | 11.7 |
| Sale to scrap dealers | 4.5 | 6.8 | 5.8 |
| Compost | 3.1 | 5.5 | 4.5 |
| Open space | 2.0 | 2.0 | 2.0 |
| Others | 0.3 | 0.7 | 0.5 |
Figure 4.
Proportion of households with access to waste collection service in Bhutan in percent, 2019.
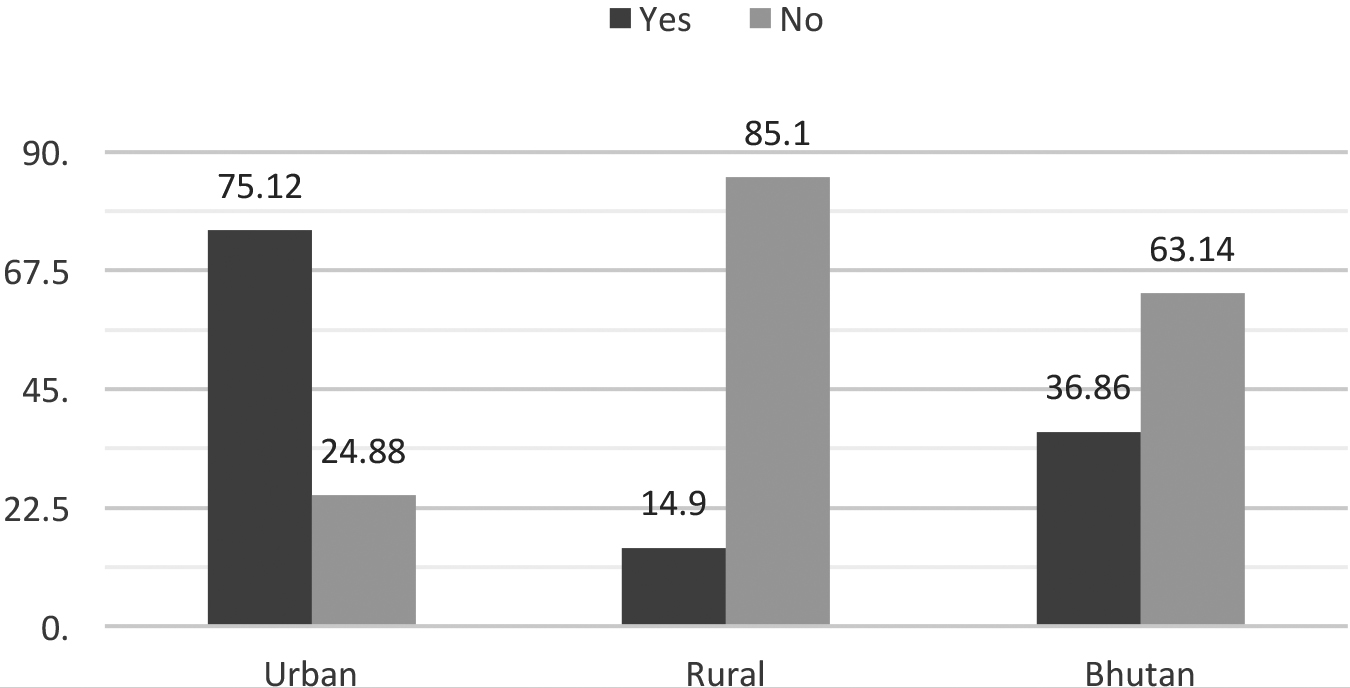
Figure 5.
Composition of commercial unit’s waste in Bhutan in percent, 2019.
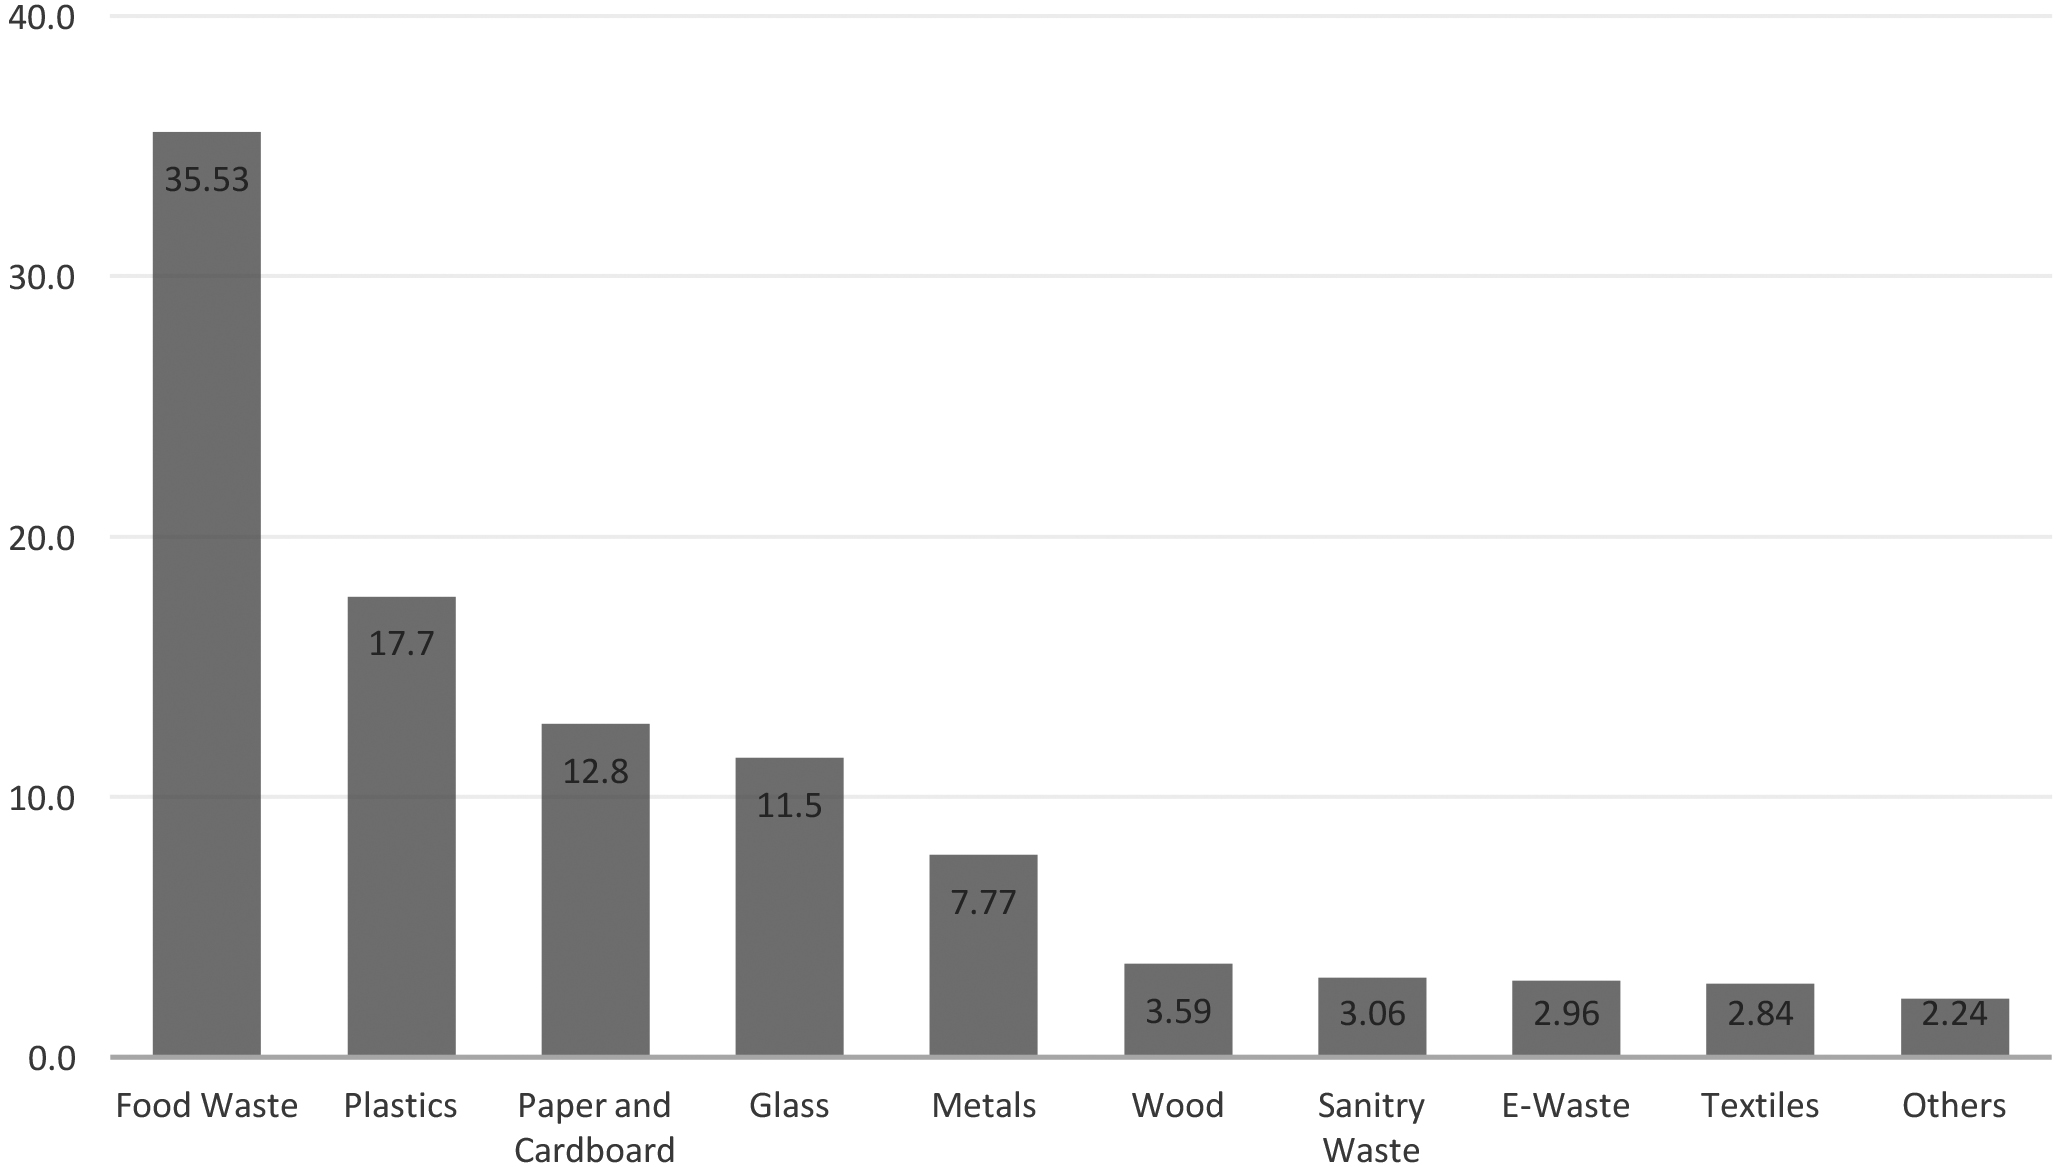
Figure 6.
Proportion of commercial units with knowledge of 3Rs of waste management in percent, 2019.
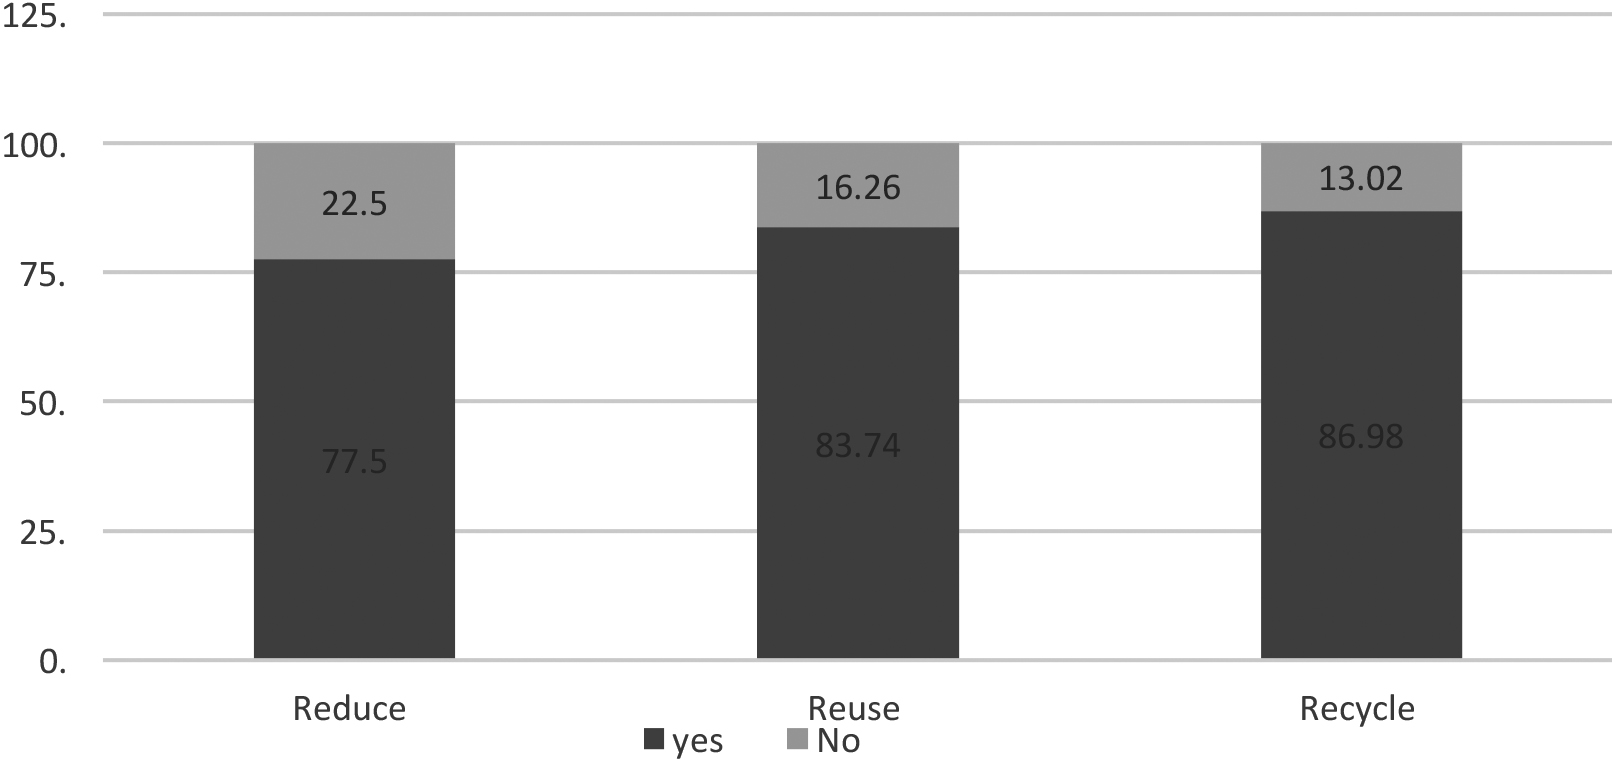
Figure 7.
Proportion of commercial units practicing 3Rs of waste management in Bhutan in percent, 2019.
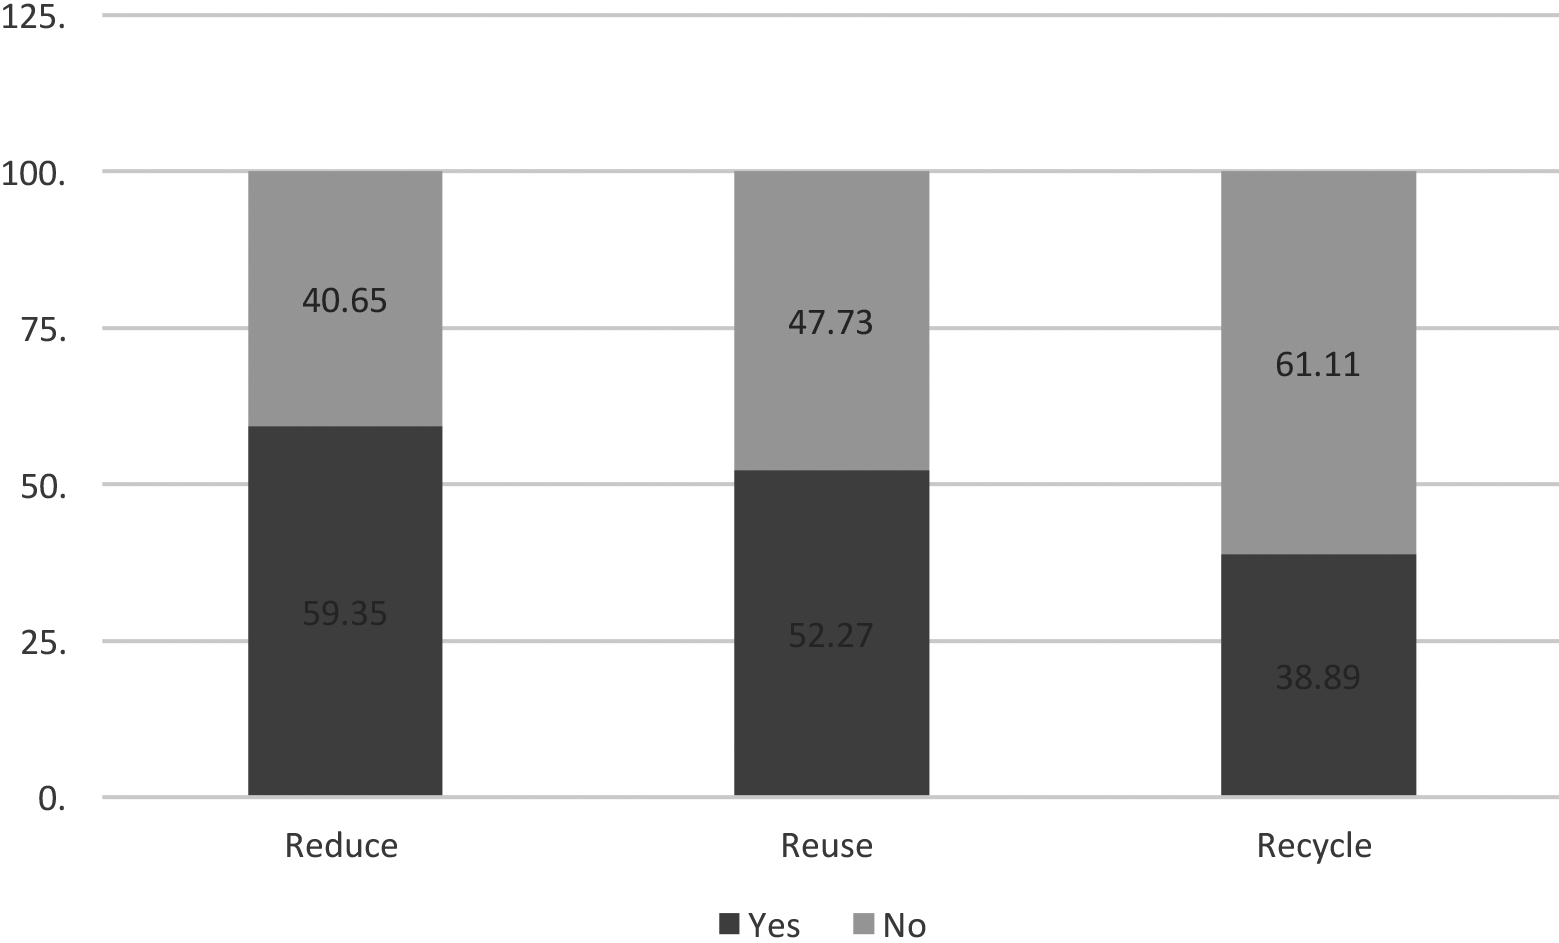
Table 1 presents the waste disposal practices of households. More than 60 percent of all households in Bhutan had access to waste collection services. However, at more than 75 percent, urban households had significantly higher access to collection service than that of the rural households at 15% (Fig. 4). Rural households usually dump their waste in the pit near their compound or resort to open burning due to lack of waste collection facilities.
4.2Commercial units
Commercial units include all retail and wholesale shops, hotels, restaurants and bars, hardware and electronic shops, repairing services, and small-scale manufacturing units.
On average, each commercial unit generates a little more than five kilograms of waste in a day. Total wastes generated by the commercial units in a day in 2019 was estimated at 67,000 kilograms. More than one-third (35%) of the total waste generated by commercial units constituted food wastes followed by plastic waste (18%) and paper and cardboards (13%) as illustrated in Fig. 5.
Higher food wastes from commercial units is not surprising given most units in Bhutan are hotels and restaurants. Meanwhile, as shown in Fig. 6, more than 75 percent of commercial units reported knowledge on 3Rs (reduce, reuse and recycle) of waste management while only around 50 percent reported practicing the 3Rs (Fig. 7). Commercial units also reported their willingness to pay a monthly fee of about Ngultrum 230 or about US$3 for waste collection service. Currently, most small-scale commercial units in Bhutan do not have to pay for waste collection services.
4.3Industries
The survey collected general solid waste generated from industries excluding toxic and hazardous wastes.
Industries generated nearly 6 thousand kilograms of solid waste daily or an average of a little over 16 kilograms of waste, per industry, per day. Around 40 percent of the industry waste comprised of paper related products and cardboards, followed by food waste (23%) and plastics (14%). Industries also generated rubbers, glass, metals, woods and other wastes.
Some of the issues faced by industries included lack of waste storage facility, absence of proper disposal sites and limited collection services. The majority of industries reported they were aware of relevant sections in environmental acts and regulations.
4.4Institutes
Institutes include schools, colleges, training centers and government offices.
In total, institutes generate around 8,500 kilograms of waste a day. Food waste constituted nearly 40 percent of the total, paper and cardboards 25 percent and plastics a little over 20 percent. Other wastes were textiles, metals, sanitary waste, glass and others.
Some of the waste management issues faced by institutes in their institutional areas included littering, not having enough garbage disposal area and limited municipal waste collection services.
4.5Health centers
Health centers in Bhutan collectively generated around 2 thousand kilograms of wastes per day. One-third of the total wastes generated from health centers were food waste, followed by plastics (27%), paper and cardboards (25%) while textiles, sanitary, glass, rubber and other wastes had less than five percent shares each. Some of the methods used by health centers to dispose of their waste were open burning, dumping in pits and using collection services.
4.6Vegetable markets
The total waste generated by vegetable market vendors in Bhutan was estimated to be over 6 thousand kilograms per day. Of total waste generation, more than 70 percent were food wastes followed by paper and cardboards (13%) and plastics (7%). Vegetable vendors also generate a small proportion of sanitary, textiles and other wastes. Vegetable markets in most Bhutan districts are operated only on weekends.
4.7Private waste companies
The total amount of waste collected by private waste companies in a week was estimated to be almost 450 metric tons of which 28 percent were wet waste while 31 percent and 40 percent were recyclable waste and non-recyclable waste, respectively. Lack of support from the government, shortage of labour owing to dignity of labour, lack of funds and awareness on waste management were some of the issues faced by the private waste management companies.
4.8Challenges, limitations and recommendations
Unlike other socio-economic surveys where only a single sample unit (e.g. households, individuals or businesses) are sampled, the Bhutan waste inventory survey was cross-sectoral. This was the most challenging component of this study as it required tremendous planning, different questionnaires, different sampling designs, and different data approaches (for health centres, both survey and administrative data was used). This was particularly challenging for a small national statistical office such as NSB.
It was also challenging to get a sampling frame for each of the sectors. The survey used various sampling frames such as the Bhutan Population and Housing Census [7] for households, Economic Census [8] for economic sectors and different administrative records for other sectors including health centres, institutions and schools.
Since this survey was the first of its kind in Bhutan, there was no previous experience with survey preparations or to compare the results of the study.
Experts from municipal offices and Bhutan National Environment Commission trained the field enumerators to segregate wastes into different compositions and record its measurement in the forms provided. As such, it was felt that involvement of all relevant stakeholders was crucial to complete the survey successfully. The survey was a good exercise for stakeholder engagement across Bhutan’s national statistical system and developed skills and capabilities beyond NSB.
Two main limitations of the survey were institute estimates and exclusion of some non-domestic wastes. For institute estimates, the survey duration coincided with the end of school academic year and hence some schools, although open, had no students as vacation had already started. This resulted in slight downward bias in the quantity of waste collected from those schools.
The survey did not estimate and analyze non-domestic waste that were seen or dumped in open areas, riverbanks, roads/drains as it was not planned given its extensive area and limited resources and time. This survey report also did not make any adjustment for seasonal variation of waste generation.
Conducting the survey with different times for each sector would have solved many issues as better planning could have taken place and appropriate seasons chosen for data collection to avoid seasonal biases.
The NSB is now planning the compilation of a physical Waste (physical flow) Account based on the results of the survey. It is hoped a Bhutan Waste Account can be used by policy makers to focus on more stringent implementation of existing waste management policies and regulations to improve Bhutan’s waste management as its population rapidly expands and urbanization takes place. Most importantly, awareness of waste management programs such as waste segregation, reduction, reuse, recycling and composting are critical for Bhutan and its people to properly care for the environment as outlined in our Constitution.
Knowledge of the various waste streams from the Waste Account can also be used for monitoring emissions in a country, where emissions are defined as substances that are released by sectors, including establishments and households, into the air, water or soil as a result of production, consumption and accumulation processes [21]. For example, the release into the air, water or soil of emissions from solid waste residuals. A preliminary Bhutan Waste (Physical Flow) Account is our first step after which the NSB may consider a Waste (emissions) Accounts.
Acknowledgments
I would like to express my sincere appreciation to National Statistics Bureau and National Environment Commission Secretariat for successfully conducting first nationwide Waste Inventory Survey and allowing me to use the data for further studies. I am grateful to Gemma Van Halderen, Director, Statistics Division, UNESCAP, Eileen P. Capilit, Statistician (Consultant), UNESCAP and my mentor Mr. Teerapong Praphotjanaporn, Advisor, Global Ocean Accounts Partnership for your tremendous support and guidance. I also would like like to extend my deepest gratitude to reviewers of SJIAOS for reviewing my paper and accepting to publish in your esteemed Journal.
References
[1] | Phuntsho S., Ugyen M.T., Dulal I., and Yangden D. ((2008) ). Studying municipal solid waste generation in the urban areas of Bhutan. Thimphu. Bhutan. MoWHS. |
[2] | Royal Government of Bhutan ((2008) ). Constitution of the Kingdom of Bhutan. Accessed at https://www.nationalcouncil.bt/assets/uploads/docs/acts/2017/Constitution_of_Bhutan_2008.pdf on 28 October 2020. |
[3] | Royal Government of Bhutan Gross National Happiness Commission ((2019) ). Twelfth Five Year Plan 2018–2023. Vol. 1-main document. Accessed at https://www.gnhc.gov.bt/en/wp-content/uploads/2019/05/TWELVE-FIVE-YEAR-WEB-VERSION.pdf on 28 |
[4] | United Nations ((2015) ). Transforming the World: the 2030 Agenda for Sustainable Development. Accessed at https://sustainabledevelopment.un.org/post2015/transformingourworld/ on 28 |
[5] | United Nations Economic and Social Commission for Asia and the Pacific ((2010) ). Guidelines for Solid Waste Management Assessment (Baseline Survey) in Secondary Cities and Small Towns in Asia and the Pacific. |
[6] | Government of Nepal Ministry of Federal Affairs and General Administration ((2018) ). Baseline Assessment – Integrated Waste Management in Nepal. |
[7] | Royal Government of Bhutan National Statistics Bureau ((2017) ). Population and Housing Census of Bhutan. Accessed at http://www.nsb.gov.bt/publication/files/PHCB2017_national.pdf on 28 |
[8] | Royal Government of Bhutan National Statistics Bureau ((2019) ). Economic Census of Bhutan 2018–19 (www.nsb.gov.bt/publication/files/pub5dx9853mi.pdf). |
[9] | Chimmi D. ((2018) ). Waste Inventory and Baseline Study for developing National and City Level Waste Management Strategies and Action Plans. |
[10] | Royal Government of Bhutan ((2018) ). Royal Civil Service Commission, Civil Service Statistics Accessed at https://www.rcsc.gov.bt/en/civil-service-statistics. |
[11] | Lucas C. ((2020) ). Towards distributional national and environmental accounts. Statistical Journal of the IAOS 36: , 597–605. |
[12] | Lovia N. ((2006) ). Waste management survey report and waste management manual for Barakau Village, Central Province, Papua New Guinea. |
[13] | United Nations Department of Economic and Social Affairs. Bhutan Country Profile. Accessed at https://www.un.org/development/desa/dpad/least-developed-country-category-bhutan.html on 28 October 2020. |
[14] | United Nations Bhutan ((2019) ). Zero Waste Hour. Accessed at https://www.unct.org.bt/zero-waste-hour/ on 28 |
[15] | Royal Government of Bhutan. National Statistics Bureau. Accessed at http://www.nsb.gov.bt/main/pageContent.php?id=1 on 28 |
[16] | World Bank. Survey Solutions. Accessed at https://mysurvey.solutions/ on 28 |
[17] | United Nations Statistical Commission ((2013) ). Framework for the Development of Environment Statistics. Accessed at https://unstats.un.org/unsd/envstats/fdes.cshtml on 28 |
[18] | European Commission ((2008) ). Waste Framework Directive. Directive 2008/98/EC. Accessed at https://ec.europa.eu/environment/waste/framework/ on 28th October 2020. |
[19] | Eurostat ((2011) ). Manual on Waste Statistics: A Handbook for data collection on waste generation and treatment. ISSN: 1977-0375. |
[20] | United Nations Statistical Commission ((2013) ). System of Environmental Economic Accounts Central Framework. ISSN. |
[21] | United Nation Statistics Division ((2012) ), SEEA central framework. Accessed at https://unstats.un.org/unsd/statcom/43rd-session/documents/SEEA-Central-Framework-Ch3-E.pdf. |


