Abstract
Infectious diseases can inflict immense losses and suffering on the human population. As at 23rd of June, 2020 COVID-19 pandemic has caused 20,919 cases, 25 deaths and 7,109 had recovered in Nigeria. Nigeria Centre for Disease Control (NCDC) is tracing COVID 19 carriers for designing effective control measures and to prevent the spread. Authors have modeled COVID-19 cases, but there is a dearth of information on estimating the total number of hidden COVID-19 carriers in the population. Adaptive cluster sample was used for exploring populations of hidden COVID-19 carriers. The data on daily cases of COVID-19 were extracted from NCDC website. Nigeria population was partitioned into 37 regions (states and FCT). We considered a model based approached in Bayesian framework to make inference about the number of COVID-19 carriers in Nigeria. The fitted model showed that all COVID-19 carriers will only be captured at once if contact tracing is combined with methodology designed in this work.
1.Introduction
The Coronavirus Disease 2019 (COVID-19) is an emerging respiratory infectious disease caused by SARS-CoV-2 (also known as 2019-nCoV), which first occurred in early December 2019 in Wuhan, China. According to the [1], COVID-19 situation report of 23rd June 2020, there were 9,228,526 confirmed cases and 425,123 deaths in 216 countries, areas or territories. The pandemic is accelerating in Africa, it took 98 days to reach 100,000 cases and only 18 days to move to 200,000 cases. Ten out of 54 countries in Africa are currently driving the rise in numbers, accounting for nearly 80% of all the cases. More than 70% of the deaths are taking place in only five countries: Algeria, Egypt, Nigeria, South Africa and Sudan. World Health Organisation (WHO) and other partners have supported governments with scaling up health workforce and laboratory capacities and to set up points-of-entry screening at airports and border crossings. These public health and social measures have been effective in slowing the spread of COVID-19 in Africa. The first COVID-19 confirmed case in Nigeria was reported on 27th February 2020, when an Italian citizen in Lagos tested positive for the virus [2]. The second case was recorded on the 9th March 2020 in Ewekoro, Ogun State, a Nigerian citizen who had contact with the Italian citizen was reported by [3]. Within the first month, the confirmed cases were around 70 but drastically increased to number almost 1,350 cases before the end of the second month and the discharged cases increased from 3 to about 250. In Figs 1–3 there was a sharp increase in the cases towards the end of April. As at 23rd, June 2020 [4] reported the number of cases is 20,919, 525 deaths and 7,109 had recovered.
Figure 1.
The total cases of COVID-19 in Nigeria. Source: Worldometer, Accessed: June 23, 2020.
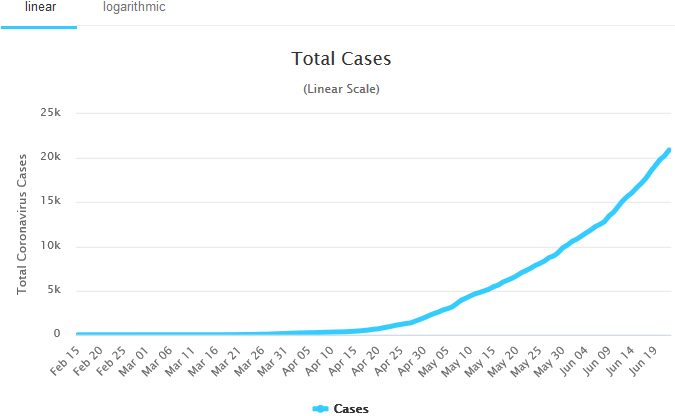
Figure 2.
The active cases in Nigeria. Source: Worldometer, Accessed: June 23, 2020.
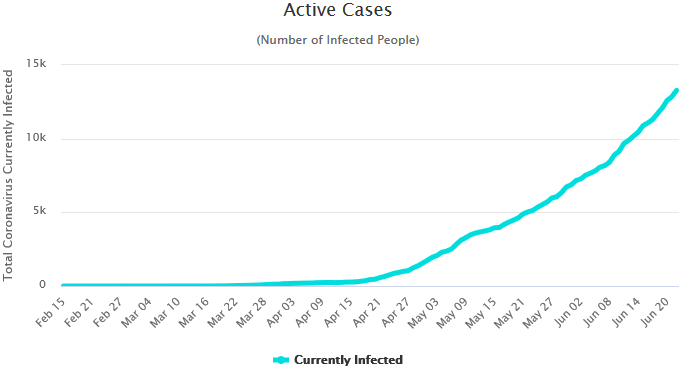
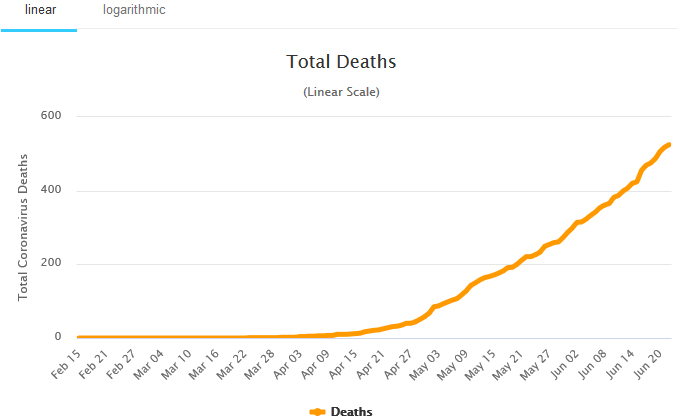
Figure 3.
Daily deaths in Nigeria. Source: Worldometer, Accessed: June 23, 2020.
Adaptive Cluster Sampling (ACS) is a sampling design that target hidden events that are spatially inconsistent, and can be used to collect valuable information with respect to temporal and spatial characteristics of individuals and areas [5] reviewed in [6].
Adaptive designs can offer significant ethical and cost advantages over standard fixed techniques. Naturally, adaptive sampling scheme maximizes survey effort where it is most valuable and minimizes survey effort elsewhere. It performs better for sparse and clustered populations than standard grid cell sampling methods.
Authors have modeled COVID-19 cases, but there is a dearth of information on estimating the total number of hidden COVID-19 carriers in Nigeria. Adaptive cluster sample was used for exploring populations of hidden COVID-19 carriers in Nigeria. The data on daily cases of COVID-19 were extracted from NCDC website. Nigeria population was partitioned into 37 regions (36 states and FCT). We considered a model based approach in Bayesian framework to estimate the number of COVID-19 carriers in Nigeria.
2.Methodology
Let Nigeria population (R), be defined to consist of 774 local government areas (LGA). Then, R={1,2,…,774}, such that all LGA are assigned to regions (36 states and the Federal Capital Territory (FCT)), Ci∈{1,2,…,37} based on the vector of parameters according to a multinomial distribution, γ¯={γ1,γ2,…,γ37} such that λk is the probability of a COVID-19 carrier being assigned to region k.
Considering that the COVID-19 carriers are sparse and clustered, let α controls the expected number of COVID-19 carriers in a region, β controls the conditional expected number of regions with COVID-19 carriers and λ be fixed arbitrarily, to be expected number of confirmed COVID-19 cases in each region.
Based on the above prior knowledge, we considered a Bayesian-based model, the prior distribution of α∼𝑏𝑒𝑡𝑎(aα,bα) and β∼𝑏𝑒𝑡𝑎(aβ,bβ), the prior distribution of λ is the product of two Gamma distributions. P(λ|θ) is equal to the density of Gamma (d,v) with θ=(d,v), v also follows Gamma (e,f) distribution as given by [7].
2.1Region inclusion probability
Suppose Nigeria population U with COVID-19 carriers is partitioned into regions (36 States and FCT), then N= 37 regions, in line with the methodology proposed by [5, 8, 9, 10, 6]. Assume each region can be assigned a value v= 1 or 0, if there is presence or absence of COVID-19 carriers upon being sampled. Also, the v= 1 regions are spatially clustered and v= 0 regions are left blank. Let yk denote the numbers of COVID-19 carriers associated with region uk.
Assume Ω⩽ 37 regions are selected from the 37 regions via a sampling design, and the presence/absence value v is recorded. Also (i) whenever v= 1 for a sampled region uk all neighboring regions will subsequently be added to the sample and (ii) no additional sample will occur in the neighbourhoods of v= 0 sampled units. Although a neighbourhood can be define in many ways, but neighbourhood of a region represent itself and its nearest neighbours to the left, right, top and down. This is an example of an Adaptive cluster sampling design in [5].
2.1.1Region inclusion probabilities based on an initial simple random sample
The network inclusion probabilities based on an initial simple random sample (SRS) will be as follows.
Let v(x) be define as
For a region of size t with x COVID-19 carriers and t-x non COVID-19 carriers, v(x) is the hypergeometric probability of not selecting any of the t units of the first type in a sample of size t. Therefore for region i of size mi the inclusion probability πi is
When including network i of size mi and network j of size mj the inclusion probability πij requires the use of the principle of inclusion/exclusion.
2.1.2A model for number of COVID-19 carriers in 36 states and FCT of Nigeria
We considered Nigeria population (R) which contains sparse and clustered population of N COVID-19 carriers. The population was divided into M= 37 (36 states and Federal Capital Territory (FCT)) regions. These regions were bounded and the boundaries were considered as grid cell (region). A region is nonempty if it contains at least one COVID-19 carrier and empty otherwise. Let X⩽M be the number of regions with COVID-19 carriers in R. Let P⩽X be the number of COVID-19 networks (collection of neighboring regions) in the Nigeria population R and Y=Y1,Y2,…,Yp denote the number of regions with COVID-19 carriers with each networks so that X=∑i=1PYi. As there are M-X regions without COVID-19 which are defined to be networks of regions without COVID-19 of size one, therefore, there are M-X+Pnetworks in R
The variables Y=Y1,Y2,…,Yp describe the number of regions in each COVID-19 carrier network. It is then convenient to extend the P-vector Y to the (M-X+P)- vector Z=(Y′,IM-X′)′ of dimension where IM-X′ is the vector of networks without COVID-19 carriers, with dimension M-X. by defining Zi=Yi for each network of regions with COVID-19 carriers and Zi= 1 for each network of regions without COVID-19 carriers. Note that Z and Y contain the same information about the networks. Let N1,N2,…,NM-X+P denote the number of COVID-19 carriers in each network. P are regions with COVID-19 carriers, so it convenient to write (N1,N2,…,NM-X+P)=(NT,0M-XT) where N is the number of Networks with COVID-19 carriers and 0M-X is the (M-X) vector of zeros (Network without COVID-19 carriers). Therefore, inference was made about N (the total number of COVID-19 carriers in R (Nigeria)).
Figure 4.
As June 22nd, 2020, P= 35 (states with COVID-19 carriers in Nigeria), and M-X= 1 (states without COVID-19 carriers in Nigeria; Cross River state). We constructed a model for the number of network in R by specifying the joint distribution of X, P, Y and N for the entire population and the sampling mechanism which leads to a particular sample s={i1,…,im} of m out of M-X+P networks. The sampling mechanism describes the selection of networks, so can only be defined conditionally on the network structure described by X, P and Y. Then, we specified the joint distribution of X, P, Y and N for R. We first model the structure of network with/without COVID-19 carriers (determined by X, P and Y) and then, conditionally on the network structure, model the number of COVID-19 carriers (N) networks of regions with COVID-19 carriers. The sums we need to evaluate to obtain the sample level likelihood are too complicated to be evaluated analytically. We have therefore chosen to use a Markov Chain Monte-Carlo (MCMC) approach to estimate the unknown parameters α, β and λ in the model and the unobserved quantities X1, P1, Y1 and N1. We used Bayesian to obtain a natural predictive distribution for predicting N, the natural predictor of N is given as
2.1.3Fitting model for COVID-19 Carriers in Nigeria
We have three unknown parameters α, β and λ which are apriori independent and their marginal distributions were denoted by π(α),π(β) and π(λ) respectively, the joint distribution of all the quantities [X,P,Y,N,λ,α,β] in the model (including the parameters) is
Table 1
Confirmed cases and estimates
| Day | Samples tested | Confirmed COVID-19 cases in nigeria | Estimated COVID-19 carriers from the model in nigeria | Samples to be tested | Remaining COVID-19 carriers |
|---|
| 4/1/2020 | | 35 | 53 | 3200 | 18 |
|---|
| 4/15/2020 | | 34 | 52 | 7200 | 18 |
|---|
| 5/1/2020 | 829 | 238 | 289 | 6400 | 51 |
|---|
| 5/15/2020 | 1240 | 288 | 328 | 7200 | 40 |
|---|
| 6/1/2020 | 2003 | 416 | 451 | 7200 | 35 |
|---|
| 6/15/2020 | 2079 | 573 | 632 | 7200 | 59 |
|---|
| 6/18/2020 | 2542 | 745 | 781 | 7200 | 36 |
|---|
Gibbs sampler was used to fit the joint distributions with the following steps;
i. State initial values for the unsampled components X1, P1 and Y1
ii. Generate α from the conditional distribution [α|X,P,Y,N,λ,β]=[α|X]
iii. Generate β from the conditional distribution [β|X,P,Y,N,α,λ]=[β|X,P]
iv. Generate λ from the conditional distribution [λ|X,P,Y,N,α,β]=[λ|P,Y]
v. Generate (X1,P1,Y1,N1) from the conditional distribution [X1,P1,Y1,N1|X0,P0,Y0,N0,α,λ]
vi. Iterate from ii.
2.1.4Software implementation
The R package was used to fit the models and Winbugs by [11] software was also used to implement the MCMC algorithm.
2.1.5MCMC diagnostics
The main goal of MCMC is to gather a representation of the true but incalculable posterior distribution. The diagnostics give confidence that samples are converging to a reasonable representation of the targeted posterior. In this study, Trace plot, correlogram, Geweke, Gelman-Rubin and Raftery-Lewis were used for the diagnostics check.
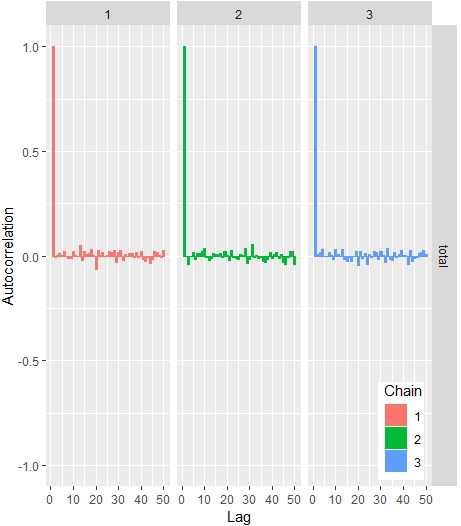
2.1.6Autocorrelation plot
This is useful to check to get how correlated the proposed parameters are through the iterations, there is need to plot the autocorrelation of the chains. It will give the sense of the efficiency of the MCMC algorithm.
2.1.7Effective sample size
The effective sample size in this context is defined as the appropriate number of people to be tested for COVID-19 that could give actual estimate of total number of COVID-19 carriers in Nigeria. The effective sample size, n𝑒𝑓𝑓 follows directly from correlogram as
where ρk is the autocorrelation at lag k.
Figure 5.
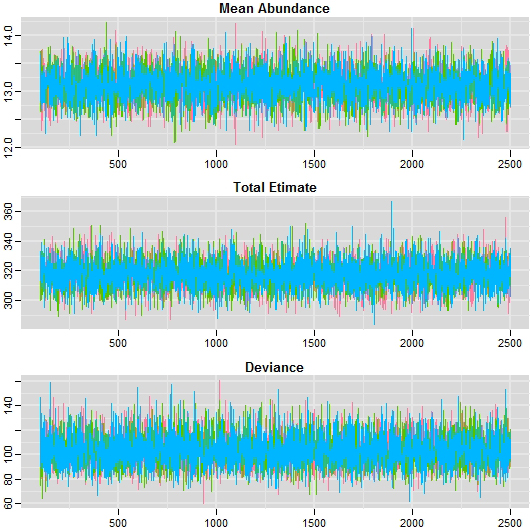
Figure 6.
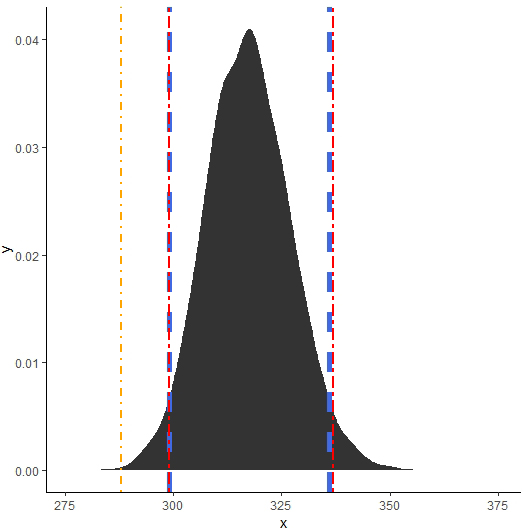
MCMC kernel density estimate plot.
3.Results and discussion
The fitted model showed that the sample were converged to reasonable representation of the target posterior (Fig. 6). From diagnostics check, the trace plots showed that the chains were mixed extremely fast and concentrated around the mode of the posterior distribution and also stationary as shown Figs 5 and 6. Plotting the Autocorrelogram in Fig. 4, the three chains autocorrelation is quite similar at each lag.
Table 1 shows the number of tested individual for COVID-19, the confirmed COVID-19 cases, estimated total of hidden COVID-19 carriers in Nigeria, the appropriate number of individual to be tested in Nigeria such that all carriers would be in the selected samples and the remaining number of unidentified COVID-19 carriers in Nigeria for days 1st May 2020, 15th May 2020, 1st June 2020, 15th June 2020 and18th June 2020. It was observed that for all the considered days confirmed cases were lesser than the estimated total COVID-19 carriers in the population. This implies that the contact tracing approach used by the NCDC may not be sufficient to identify all COVID-19 carriers in the population at once. The contact tracing approach needs to be combined with appropriate sampling techniques for Nigeria government to be able to reduce the spread of COVID-19. In May 1st 2020, NCDC confirmed 238 while 289 COVID-19 carriers were estimated with 51 cases still remaining in the population unidentified thereby continuing the spread of the virus. For 15th May, 2020 confirmed COVID-19 carriers were 288 while 328 COVID-19 carriers were estimated with 40 cases still remaining in the population unidentified. For 1st June, 2020 confirmed COVID-19 carriers were 416 while 451 COVID-19 carriers were estimated with 35 cases still remaining in the population. For 15th June, 2020 confirmed COVID-19 carriers were 573 while 632 COVID-19 carriers were estimated with 59 cases still remaining in the population. For 18th June, 2020 confirmed COVID-19 carriers were 745 while 781 COVID-19 carriers were estimated with 36 cases still remaining in the population (Table 1). All unidentified carriers for each of the days were responsible for further spreading of the virus.
The relevance of the estimation is to guide statisticians to know the estimated number of COVID-19 carriers within a population together with appropriate sample to be selected strategically and adaptively such that all carriers would be captured. Adaptive Cluster Design is a specialized sampling procedure for identifying hidden events such as COVID-19 carriers in a population. The proposed approach and contact tracing can work concretely by involving Statisticians in the contact tracing team. Statisticians will use their professional skills to handle all challenges of not at home, hard to reach, non- response due to sensitive issues, hard core, lack of knowledge of the estimated number of COVID-19 carriers and lack of appropriate knowledge and strategy by medical personnel for identify Covid-19 carriers during contact tracing.
4.Conclusion
We have developed a model for estimating total numbers of COVID-19 carriers in Nigeria. The fitted model shows that all COVID-19 carriers will only be captured at once if contact tracing is combined with methodology designed in this work. The existing contact tracing team lacks involvement of Statisticians. This work recommends involvement of Statisticians in contact tracing team so as to handle all challenges of not at home, hard to reach, non- response due to sensitive issues, hard core, lack of knowledge of the estimated number of COVID-19 carriers and lack of appropriate knowledge and strategy by medical personnel for identify Covid-19 carriers during contact tracing.
Acknowledgments
We thank the National Center for Disease Control in Nigeria for making number cases of COVID-19 patients available online. We also acknowledge the reviewers for their constructive corrections.
References
[1] | World Health Organization. Novel coronavirus (2019-nCoV) situation report-41. https://wwwwhoint/docs/default-source/coronaviruse/situation-reports/20200301-sitrep-41-covid-19pdf?sfvrsn=6768306d_2 2020. Accessed on June 23, 2020 2, (2020) . |
[2] | MacLean OA, Orton R, Singer JB, Robertson DL Response to “On the origin and continuing evolution of SARS-CoV-2”. http://virological.org/t/response-to-on-the-origin–and-continuing-evolution-of-sars-cov-2020. 2/418. |
[3] | Wiki. http://en.wikipedia.org/wiki/2020 coronavirus pandemics in Nigeria. Accessed June 23, (2020) . |
[4] | NCDC. https://covid19.ncdc.gov.ng. Accessed June 18th, 2020. |
[5] | Thompson, S. Adaptive cluster sampling. Journal of the American Statistical Association; (1990) . 85: : 1050-1059. |
[6] | Borkowski J. Network inclusion probabilities and Horvitz-Thompson estimation for adaptive simple Latin square sampling. Environmental and Ecological Statistics; 1999: . 6: : 291-311. |
[7] | Kelly Cristina MG Fernando ASM A mixture model for rare and clustered populations under adaptive cluster sampling. Bayesian Analysis; (2016) . 11: (2), 519-544. |
[8] | Thompson S. Adaptive cluster sampling: Designs with primary and secondary units. Biometrics; 1991: a. 47: : 1103-1115. |
[9] | Thompson S. Stratified adaptive cluster sampling. Biometrika; (1991) b, 78: : 389-397. |
[10] | Thompson S, Seber G. Adaptive Sampling. New York: John Wiley & Sons, (1996) . |
[11] | Lunn DJ, Thomas A, Best N, Spiegelhalter D. Winbugs-a bayesian modelling framework: concepts, structure, and extensibility. Statistics and Computing; (2000) : 10: (4): 325-337. |
[12] | Worldometer. https://www.worldometers.info/coronavirus/#countries. Accessed on June 23, 2020 2. |


