
Estimating current values of sustainable development goal indicators using an integrated assessment modeling platform: “Nowcasting” with International Futures
Abstract
Analysis of progress toward the Sustainable Development Goals (SDGs) requires clear understanding of current conditions of SDG target variables and indicators for countries around the world. There is no depository for country-specific, up-to-date information on the 169 targets and 230 indicators across the 17 goals. In fact, data are scattered across hundreds of sources and are very frequently incomplete and incompatible. The International Futures (IFs) forecasting system includes integrated models that span the issue areas covered by the SDGs to facilitate analysis of alternative scenarios through the 2030 goal horizon and beyond. To initialize variables the IFs project created an algorithmic toolkit called the “preprocessor” that draws upon extensive datasets from many statistical sources, filling holes (using estimated relationships) and reconciling inconsistent data (via methods including use of accounting systems within and across the issue areas). The IFs preprocessor “nowcasts” values for 186 countries across more than 100 SDG-related indicators for a user-specified base-year. This manuscript documents the methodology of that nowcasting and provides examples of recent and current-year estimated values for variables across the SDGs.
1.Introduction
The 17 Sustainable Development Goals (SDGs) with 169 targets and 230 indicators constitute a framework and guide for advancing human development and protecting environmental health. The ability to assess where we are on the path toward the SDGs helps reveal the most glaring global, regional, and national development deficiencies with implications for how policies should prioritize and allocate effort and resources. As countries strive to achieve the goals, it is critically important to understand our current situation. Although the United Nations Department of Economic and Social Affairs maintains a large database across SDGs that draws on many more specialized data sources, data are often spotty and out of date.
Yet, as emphasized also by van Soest et al. [1], most efforts to build a current-status foundation for analysis of potential progress have been limited to selected goals and indicators [2, 3, 4, 5, 6, 7, 8, 9, 10]. Comprehensive human, social, and biophysical development data are often not available and building series across countries, time, and issue areas is complicated by infrequent observations, inconsistency, and relative inattention to some countries. Many series are difficult or costly to obtain. However, such data are important for informing policy priorities and decision-making for development. Modeling tools, including integrated assessment models (IAMs) are increasingly used to forecast alternative scenarios of progress toward the SDGs, and the projects underlying them need to nowcast current data values as a foundation for doing so.
International Futures (IFs) is a long-term, multi-issue model system with variables that extend across the range of the SDGs. IFs models 186 countries annually through 2100 and forecasts more than 700 variables, including approximately 100 related to the SDG indicators across the 17 goals. Such a large and integrated model requires a data processing tool for hole-filling and reconciling of its initial conditions. In IFs, that data tool is called the “preprocessor”. Its function is preparing (nowcasting) the initial conditions for the suite of hard-linked models from data with significant inadequacies. A key value of the IFs preprocessor is its ability for near instantaneous change of the model base year. As new or updated data for any given model base year become available, the IFs model base year can be rebuilt to fill remaining data holes and enhance data consistency. Also, the preprocessor can prepare any historical model base year since 1960, facilitating comparison of historical model runs against subsequent data.
Although IFs is most commonly used as a long-term tool for scenario development and analysis, the preprocessor essentially acts as a distinct nowcasting component within the broader model. The IFs preprocessor provides a uniquely extensive and highly integrated approach to SDG-focused nowcasting. It supports understanding national, regional, and global development patterns.
We proceed by introducing the IFs system. We then elaborate three elements of preprocessor activity required to prepare a complete and internally consistent variable initialization for the integrated models of IFs: hole filling; ensuring consistency within issue areas including population, education, health, agriculture, energy, infrastructure, and governance; and providing coherence across such issue areas. We conclude by demonstrating the nowcasting capabilities of the International Futures system across various SDG target variables.
2.The International Futures model system: Context for the preprocessor
Development of International Futures (IFs) by Barry Hughes began in the late 1970s, when it was primarily an educational tool for helping think about longer-term global futures. Development has been continuous across the intervening period [11]. Early in this century the system began to move beyond academia and be used heavily by and in support of a variety of policy-oriented institutions: international organizations including the European Union [12, 13], the World Bank [14], the African Union [15], and the World Health Organization [16]; governments including the United States [17] and Peru [18, 19]; and nongovernmental organizations including the Institute of Peace [20] and the SENS Research Foundation [21]; as well as corporations and think tanks. While now available under General Public License, continued development is concentrated within a team at the Frederick S. Pardee Center for International Futures at the University of Denver’s Joseph Korbel School of International Studies.
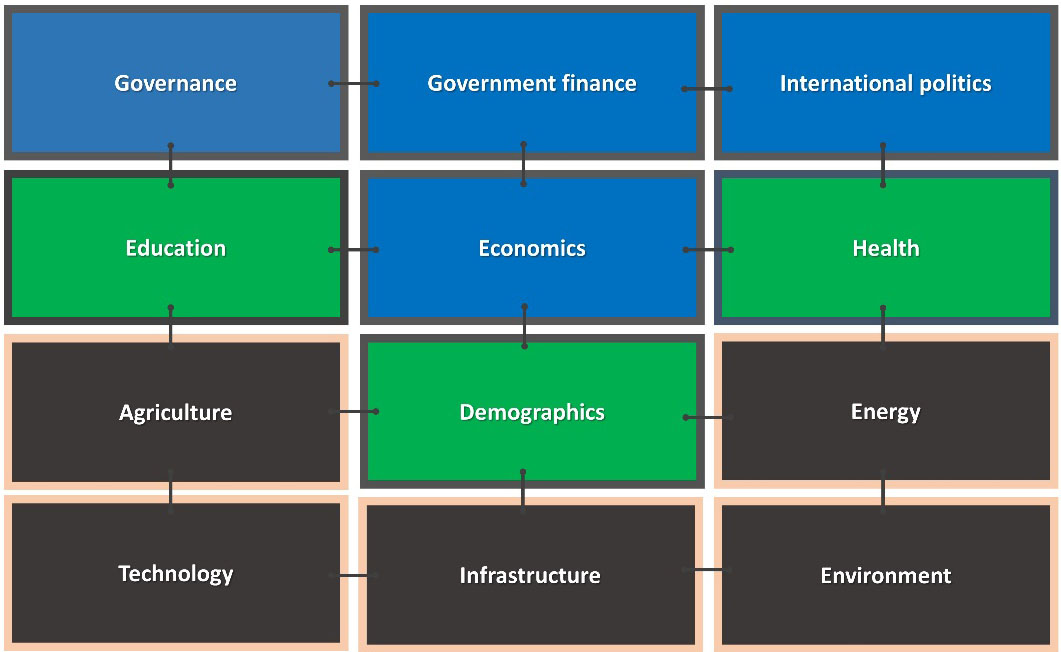
IFs integrates twelve modules within a system that broadly represents human, social, and biophysical development (see Fig. 1). These models include agriculture, demographics, economics, education, energy, environment, gender, governance, health, infrastructure, international politics, and technology. Technology and gender variables exist across these modules. This extensive and highly integrated issue coverage corresponds fairly closely to that of the Sustainable Development Goals, supporting increasingly extensive use in their analysis [6, 7, 10].
Figure 1.
The models of the International Futures (IFs) system. Note: Blue indicates models in IFs primarily focused on human development; green represents socioeconomic development; black shows models especially important to bio-physically sustainable development. Source: Authors.
Development of the preprocessor began near the turn of the century with impetus from heavy use of IFs, the need to update the base year of the system regularly, the need to continually add updates of data from a very large set of sources across the issue areas even for any given base year, and the nearly overwhelming burden of any attempt to create manual nowcasts of all of the model’s initial conditions for any identified base year. Work on the preprocessor began at about the same time as the development of a web-based version of IFs to complement that available for download use (both versions freely available at pardee.du.edu).
In that same period, the sophistication of the graphical user interface (GUI) of the IFs system that integrates access both to the preprocessor and to forecasting increased significantly. In work with IFs, forecasts are understood to be possible futures or scenarios, not predictions. Also understood is that the model proper computes those forecasts with fully integrated, dynamically recursive use of the component models, not through any form of univariate or small variable-set extrapolation.
The GUI provides users four major options and extensive sets of sub-options. Primarily used on the forecasting side, the first option is extensive graphical, tabular, and map-based display of all variables from the Base Case scenario and any other scenario run in the model with variables saved across countries and time. Displays can consist only of forecasts or can combine historical data series with forecasts to help the model user gauge reasonableness of future values. The second main menu option allows the user to create, save, run, and refine scenario interventions consisting of initial condition changes for variables (not often done because the preprocessor provides those), parameters (the primary element shaping scenarios), and selected functional forms (allowing the user some additional control over model structure).
The third major GUI option bridges data/preprocessor and model forecasting capabilities. It provides longitudinal, cross-sectional, and panel access to all data supporting IFs. Further it allows the saving of functions (with flexible functional forms and supporting estimation statistics) from bivariate and multivariate data analysis that can then be used in the preprocessor or the model. One significant advantage of saving multiple functions for the same dependent variable is facilitating analysis across those as the database and even appropriate functional form changes. The final GUI option is Extended Features and contains many data handling sub-options, including calling up the preprocessor to completely (re)compute (nowcast) initial model values for any selected base year.
3.The preprocessor and hole-filling for individual variables
Preprocessing – building the data load for the base year of the model in IFs – consists of multiple processes occurring interactively that this and the next two sections discuss sequentially: hole filling; addressing consistency within issue areas; ensuring consistency across the issue areas. A foundation for the first process of ensuring completeness of country coverage in the model’s base year involves data preparation.
3.1The data preparation foundation
Gathering and standardizing data series are foundational for preprocessing within the IFs modeling platform. Approximately 260 variables over its multiple issue areas initialize the model (which then calculates future values for more than 700 variables) and are the focus of IFs base year nowcasting. Approximately 4,800 total data series are collected for display and analysis purposes. Insofar as possible the database includes values from 1960 to the most recent year for the 186 countries of the IFs system; a data team constantly updates it. The interface of the IFs system contains as extended features a variety of data pulling and data preparation options. Those are used as possible with new data releases and extensions of the variable set for basic data cleaning and preparation.
Data series are pulled from various intergovernmental organizations and research centers, always with full attribution. Extended features in IFs facilitate processing data from the original sources into the standard format of the IFs database. Features include using a large concordance table to relate country names and codes across data sources. The output format uses rows for countries and columns for years with one data series per table, but the system automates pulling from various data formats used in the sources. Missing value codes are converted to nulls. Additionally, the raw data are frequently converted into standard units used by IFs (for instance, millions for population data, billions of constant dollars for economic data, and billions of barrels of oil equivalent for energy). The data foundation frequently draws in multiple data series for similar or identical variables into different tables that can then be compared and possibly used in support of increased comprehensiveness and accuracy. The extensive gathering and preparation of data is foundationally necessary to the comprehensive design of the preprocessor.
Use of the preprocessor requires data values for nowcasting of any identified year to be in the database for four “essential series” across all countries: population, GDP at market exchange rates, GDP per capita at purchasing power parity (used in many functions that help fill holes), and land area of countries (largely invariant across time). A discussion below will explain the importance of GDP per capita values. The need for at least an estimate of population is obvious, although extrapolation to the base year from earlier data years could be used if available. And we know of no way to nowcast land area of a country if it is missing from all years of the dataset. Given even only these essential series, values can be nowcast for all of the other roughly 700 initial condition (including SDG) variables; more data on other variables can obviously improve estimates.
3.2Data preprocessing to nowcast the model base year
The core of nowcasting with IFs is the determination in the preprocessor of initial conditions for all variables needed by the forecasting side of IFs for whatever year is specified as the base year (e.g. 2015 or 2020). Typically, the base year advances as data become reasonably complete, but the preprocessor can be set to a year with significantly incomplete data and theoretically, even to a future year.
The preprocessor determines initial conditions for roughly 260 variables of the model including large numbers of the SDG target indicators. Its use of the supporting database to nowcast values for those variables proceeds through three interacting stages: (1) fill country value holes by variable (discussed below); (2) reconcile data within issue areas as needed (in the next section); and (3) reconcile data across issue areas, with the social accounting matrix (SAM) structure being one key focus for that (covered in the subsequent section). Again, all three of these processes are part of the nowcasting system.
With respect to individual variables, empirical data for initializing the model’s forecasts are often deficient. The IFs preprocessor uses a variety of approaches to address data inadequacies, including:
• Filling of data holes for the identified base (nowcast) year with imputations calculated or estimated from other foundational data series. Sometimes the most recent data point can be assumed to be very close to the value that will ultimately be reported for the base year and we use that to fill the hole; more often univariate extrapolation is helpful. In other cases, historical data points are inadequate and a cross-sectional or longitudinal relationship is used, calling on one or more driving variables for which data are available.
• Filling of some data holes with very small non-zero values. These “seed” data capture the reality that most values are not absolutely zero; seeds allow the model’s dynamic forecasting to build on these values in either additive or multiplicative processes.
• Balancing global sums, for instance with variables such as global trade, foreign aid, migration, remittances, and other flows. Most often IFs averages the inflow and outflow sums and uses the average to normalize the contributions of each country to the resultant global sum. More generally, normalizations and adjustments are widely used in the preprocessor, for example in reconciling estimates of various specific energy production forms, land uses, crop types, or government expenditures with total specifications of the same variables, using algorithms that judgmentally specify prioritized data sources.
• Integration of historical flows to calculate an estimate of stock levels for initialization of forecasts. To clarify, the dynamic structure of the model proper frequently builds on both stock variables that carry over across time (such as capital, population, or government debt) and flow variables specific to a year (such as investment and depreciation, births and deaths, revenues and expenditures). Data on some such stocks, including production capital and foreign indebtedness, are frequently incomplete.
• Calculation of initial growth rates for variables from the growth patterns over a period prior to the initial forecast year. Because many growth rates vary considerably from year to year, using a period from 2–10 years for initialization is generally preferable to using a single year. Nowcast growth rates for such volatile series are generally calculated using compound annualized values over a past period, and they sometimes privilege more recent annual changes.
Processes to fill holes in initial conditions rely on estimated equations. The GUI contains many tools under the Data Analysis option that facilitate creation and enhancement of those over time. Sub-options allow manipulation and graphical/tabular display of all 4,700 plus data series in maps, longitudinal, cross-sectional, and panel analysis; additional options exist for analysis of bilateral data sets. The system accesses an imbedded statistical object for structuring and analysis of regression equations, facilitating immediate interactive and experimental selection of both IV sets and functional forms (including mixed functional treatment of IVs), assisted in cross-sectional and panel analysis both by scatterplots for easy visual evaluation and an extensive set of reported statistics.
When equations are built and accepted into the model they are placed into their own database for use within the preprocessor and model, marked by year of creation or data availability. Over time with ongoing growth and updating of the data series, the system saves multiple versions of estimation functions for the same DV, and the GUI allows graphical display and comparison of them and associated statistics. This helps a user see (1) if best functional forms have changed; (2) if explanatory power has changed; and (3) if the DV values have temporally “drifted” upward or downward even with the same IVs, functional form, and statistical fit. Such drift can suggest what we sometimes call “systemic shift,” implying that omitted variables such as technological advance or changing knowledge/culture/values/policy behavior not included in the DV set are at work. In some cases this has led in the model proper to our introducing a temporal shift term to forecasts, even if the specificity of driving elements is not fully understood.
More generally, estimated relationships raise issues concerning endogeneity. Those include reverse causality, simultaneity, selection bias, omitted variable bias, and functional form. The first two of those, reverse causality and simultaneity (or bi-directional causality) are more problematic in the forecasting formulations of the model itself than in the initial condition hole-filling by the nowcasting preprocessor. Documentation of the model proper [11] addresses them, and one important tool is clear distinction between stocks and flows and the use of lags in recursive equation systems. For instance, investment is a flow that directly but slowly augments capital stock, while capital generates economic production that supports additional investment. But in any given time-step, including the initial year values computed in the preprocessor, the determinants of investment flows lie much more strongly in savings availability and the supply-demand-inventory balances within economic sectors than in any direct endogenous relationship with capital stock. The IFs model is replete with such treatment of bi-directional causality mediated by stock-flow logic and lags.
Issues of reverse causality and simultaneity are significantly muted in hole-filling via the use of GDP per capita at purchasing power parity (PPP) as the primary and often sole independent variable in most of the formulations that address missing data values. The structural development literature has long recognized that most developmental variables advance in rough relationship with each other [22, 23, 24]. Understanding the strong multicollinearity and simultaneity among most potential IVs of interest (like educational attainment, life expectancy, good governance, and GDP per capita) in generating progress toward SDGs can actually be helpful in filling holes because GDP per capita at PPP routinely serves as a proxy or primary IV in studies of development processes and does in the IFs preprocessor.
Relying simply on linear relationships with GDP per capita would, of course, be very limited. Important issues are dangers around omitted variables, selection bias, and functional form [25] (Bun and Harrison, 2019). Beyond using extensive literature analysis within each issue area for insights from and past analysis by experts, several processes and supporting tools within the IFs system help address issues in relationship specification.
Table 1
Formulations for filling holes in variables computed in the preprocessor
| SDG goal and IFs target variable | Variables beyond GDP per capita at PPP (GDPPCP) | Equation | R-squared (variance explained) | Std error |
|---|---|---|---|---|
| Goal 1 Poverty: Raising all above $1.90 income/consumption power (INCOMELT190LN) | INCOMELT190LN | 62% | 14.35 | |
| Goal 2 Hunger: Eliminating child malnutrition (MALNCHP) | Calories per capita (CalPCap) | MALNCHP | 42% | 8.47 |
| Goal 2 Hunger: Eliminating adult malnutrition (MALNPOPP) | Calories per capita (CalPCap) | MALNPOPP | 63% | 7.85 |
| Goal 3 Health: Dramatically reducing maternal mortality (MATMORTRATIO) | Total fertility rate (TFR) | MATMORTRATIO | 66% | 136.18 |
| Goal 4 Education: Universal secondary education for males (EDSECUPPRGRATE, males) | EDSECUPPRGRATE, Male | 47% | 25.31 | |
| Goal 4 Education: Universal secondary education for males (EDSECUPPRGRATE, females) | EDSECUPPRGRATE, Female | 48% | 28.64 | |
| Goal 6 Water: Providing safe water to all (WATSAFE) | Education attainment (25 | WATSAFE, No Access | 85% | 6.00 |
| Goal 6 Sanitation: Providing safe sanitation to all (SANITATION) | Education attainment (25 | SANITATION, No Access | 87% | 10.00 |
| Goal 7 Energy: Connecting all in urban areas to electricity (INFRAELECACC (Urban)) | Poverty at $1.25 (INCOMELT125) and government effectiveness (GOVEFFECT) | INFRAELECACC, Urban | 68% | 15.80 |
| Goal 16 Peace, justice and accountability: Reduce government corruption (GOVCORRUPT) | GOVCORRUPT | 80% | 1.02 |
Source: Authors.
Using the database of more than 4,700 series and the statistical estimation system built into it, the IFs GUI facilitates interactive selection of independent variables and functional forms. Functional form is very important because linear relationships with GDP per capita would very often result in residuals being highly correlated with an IV, an important indicator of endogeneity issues. Hughes [26] elaborated the tendency for many potential developmental variables like those in the SDGs to saturate with continued advance of GDP per capita, providing basis for very often logging GDP per capita in the relationships or using a logistic form (sometimes polynomial forms). Again, the IFs GUI and large database facilitate interactive and experimental selection of both broader IV sets and functional forms via longitudinal, cross-sectional, and panel analysis, assisted both by scatterplots for visual evaluation and an extensive set of reported statistics. Table 1 shows formulations used within IFs for selected SDG target variables; the R-squared values help understand the power of the driver(s).
The attention to individual variables in the preprocessor proceeds across the models of IFs that create the breadth or scope of its nowcasting. Within each model a variety of issues require simultaneous attention to multiple variables, using approaches beyond those discussed above, which were focused on individual dependent variables; the next section provides some information on the processes. At the same time, attention is required across the issue areas of the model. In particular, the economic model and the social accounting matrix in which it is embedded are critical to the integration across models. Although not always easy to separate in practice, we look next at selected separate models and then shift focus to that integration across them – all parts of the nowcasting process.
4.Model-specific nowcasting in the IFs preprocessor
The procedures involved in further data processing for each model vary based on the data available for each variable and on our understandings of the accounting frameworks and causal dynamics within each area and across them. The set of 15 preprocessor modules corresponds closely but not completely to the models in IFs. The sequence of their processing owes much to the needs of some later preprocessing modules for the results of earlier ones. The list and dominant sequence are: population, agriculture, energy, education, infrastructure, government consumption, economy, water, sociopolitical, international conflict, state failure, values, health, environment, and technology. Sometimes, a module or a part of it is accessed more than once. The discussion here necessarily simplifies the scope of preprocessor attention to and across these areas before focusing in the next section on integration/reconciliation across them.
As a general rule, while individual variable nowcasting involves statistical estimation, processes across variables within an IFs model requires algorithmic specification. Many of the algorithms involve reconciling incompatible values within accounting systems. Many others reconcile physical and monetary values. Still others involve initializing multivariate indices.
4.1Population
The preprocessor first addresses population, largely because little is needed from other substantive areas and demographic values can then be passed to them. The routine (called DataPop) begins by reading and storing population and GDP for use later in the routine and throughout the base-rebuilding structure of the preprocessor.
The remainder of population data processing divides into two steps: processing the population cohort data and processing assorted population variables. Heavy reliance on the remarkably complete national population data provided by the United Nations Population Division (UNPD) at roughly two-year intervals makes initialization of age-sex specific values quite simple.
Assorted other series such as total fertility rate, contraception use, migrant population flows, and labor participation patterns come from variety of sources including the Institute for Health Metrics and Evaluation (IHME) and the World Bank. It is such secondary variables that most often require nowcast imputation for hole-filling using the methods outlined earlier and sometimes prioritizing sources of conceptually similar or identical series.
A major complexity with UNPD data is the conversion of 5-year age categories into 1-year categories, necessary because IFs is a dynamically recursive model that steps annually through time. That conversion uses a spline-fitting technique that is standard in demographics [27]. This element of preprocessing is undertaken in the first year of model run to make the values readily available in the forecasting system. The first year of model runs can logically be viewed as an extension of the preprocessor.
4.2Agriculture
The major tasks of the preprocessor in agriculture are to compute initial conditions for production, trade, and consumption in crops, meat, and fish and to compute initial conditions for the resource base for their production, especially land but also water and road infrastructure. Consumption of goods and services is often not available in databases and requires computation as apparent consumption, that is, as production plus imports minus exports. We follow that procedure in IFs. A major data source is the UN Food and Agriculture Organization (FAO) and the preprocessor aggregates an extensive array of food types into the crops, meat and fish categories, addressing issues concerning physical values (metric tonnage) and monetary values.
A small number of parameters are read on a global basis before beginning the processing of country-specific initial values. These include ocean fish catch, the annual slaughter rate of animals from livestock herds (ideally these should be related to the character of the livestock herd by country with higher rates for poultry than for beef), and the amount of land withdrawn from agricultural use with the growth of population (this should ideally also be a country-specific specification). Global and national values must be reconciled.
Although FAO data have fairly extensive geographical coverage, updated releases are sporadic and infrequent, requiring attention to extrapolation. With respect to nutrition variables, other sources including the World Bank can be useful.
4.3Energy
The major tasks of the preprocessor in energy are: to initialize production in multiple energy categories (oil, natural gas, coal, nuclear, hydroelectric, and other renewable) as well as to identify values for known reserves and ultimately recoverable resources in the same categories; to compute trade in energy; and to compute apparent consumption of energy as well as assuring that it is reasonable relative to the size the economy. The preprocessor puts all energy variables into a common unit of measurement, billions of barrels of oil equivalent. The model itself can flexibly convert the variables to other units.
The primary data source is the regular reporting of the International Energy Agency (IEA), which is given priority when other sources provide data values for the same variables. Secondary sources include the annual statistical review of BP plc (formerly British Petroleum), which sometimes provides information not available from the IEA, including that on energy reserves. Taken from contemporary information sources, the price of oil per barrel in the initial year of data is needed to compare/reconcile measurement of energy variables such as trade across physical and monetary units.
4.4Education
The IFs education model forecasts by sex student flows for each of the 186 model countries into and through four different levels of education: primary, lower secondary, upper secondary and tertiary. It also forecasts by age and sex the educational attainment of adults. Clearly, both student flows and adult attainment values need to be consistent with the age-sex population patterns determined earlier in the preprocessor.
The model needs information on primary enrollment rates (gross and net or of-age), survival of entrants to the final year, completion of primary, transition into lower secondary education with progression and ultimate graduation through it and similarly with upper secondary, plus enrollment and completion of tertiary education. A model extension is under development to use grade-by-grade enrollment data and forecast accordingly. The primary data source for those values is the UNESCO Institute for Statistics (UIS), but data series provided by countries to and through it are incomplete and sometimes incompatible. The preprocessor has extensive data imputation and reconciliation logics to complete the full data set [28, 29, 30]. Once again, initial imputations for countries with inadequate data often involve functions based on GDP per capita at PPP, as an indicator of the level of development of the country. Consistency checks can be as simple as capping a flow rate to its theoretical upper bound or the more complex ensuring that the flow rates are consistent to one another within and across levels.
With respect to adult attainment data, the primary source is the Barro-Lee Educational Attainment Dataset (see Barro and Lee [31] and the project’s website with periodic updates). That dataset by sex does not, however, provide the age-specificity of attainment needed to understand the future dynamics of country education attainment. The preprocessor spreads the aggregate values across ages, taking care to anchor young adult values to UIS data concerning recent student flow and education completion patterns. Enhanced data from the Wittgenstein Centre will soon obviate that step.
The preprocessor also prepares data on educational quality for the education model. Although drawing on primary data from various examination systems such as PIRLS (Progress in International Reading Literacy Study) and TIMSS (Trends in International Mathematics and Science Study) and aggregated/processed quality data from the World Banks EDSTATS project, the OECD, and the work of Nadir Altinok [32, 33], educational quality data are very sparse across countries. The preprocessor imputes values to fill holes left by multiple sources and prepares an index of quality across all countries.
Forecasting student flow patterns through educational levels also requires attention to funding availability and its relationship to per student expenditure. A separate routine in the preprocessor (DataGovCon) draws heavily on IMF Government Finance Statistics data for basic information on education (and health) spending by central and total government, reconciling those expenditures with all other and total government expenditures.
4.5Health
Although called later in the preprocessor’s structure so that some needed economic data are available, the SDG set clusters health close to education and we discuss it here.
The principal data source for mortality data is the Global Burden of Disease (GBD) project based at the IHME. The project provides mortality data by age and sex for 195 countries and 359 diseases and injury mortality causes. It also provides data on morbidity/disability associated with the causes and years of living with disability. IFs forecasts 15 aggregate causes of mortality across communicable, injury and accident, and noncommunicable groupings. Foundational data work outside of the preprocessor aggregates data from the most recent GBD release into the 15 mortality categories of IFs.
The preprocessor does a great deal of work with these data. For instance, it augments mortality data for selected causes, notably malaria and HIV/AIDS with incidence and prevalence data, also often from the IHME.
Forecasting of mortality and morbidity, however, requires a variety of drivers, both deep or distal (like education and GDP per capita) and near or proximate (such as undernutrition, obesity, smoking, indoor and outdoor air pollution, condom use, and diabetes prevalence). The preprocessor reads and cleans data from many sources for those proximate drivers, important health variables in themselves. It also prepares several more specialized health indicators including maternal mortality and severe acute malnutrition.
4.6Infrastructure
Unlike most issue areas/models within IFs, there is no primary data source for infrastructure because there are various international organizations focused on specific types. From a wide variety of sources come data for access to water and sanitation, connection to and generation of electricity, availability of roads, and adoption of information and communications technology. Often data on infrastructure are limited and imputation is common. The preprocessor further reads many global parameters concerning variables such as cost of building and maintaining infrastructure.
4.7Two categories of additional modules for rebuilding the model base year
There are many other modules in the base-rebuilding process. They fall generally into two categories. The first consists of four modules supporting initialization of socio-political systems. One named DataSocioPol initializes many variables related to the character and quality of governance, including indices of democratization, corruption levels, government effectiveness, economic freedom, business regulation, general regulatory quality, gender empowerment and gender inequality. We have also added societal violence, including that directed at children and women, as well as variables related to societal levels of drug use.
A second module on state failure primarily contains four indices from a project once called the State Failure Task Force but renamed as the Political Instability Task Force (PITF). All PITF data cover most countries and many years. The third module processes data from the World Values Survey that provide considerable insight on cultural value systems. While those data cover most countries with large population and/or economies, imputation is needed to fill many country holes. The final module in this category is international conflict. Data for it come primarily from the Militarized International Disputes project (MIDs) and focus on the threat of conflict within pairings (dyads) of countries.
The second category of additional modules contains three that mostly complement the treatment in the agriculture and energy modules of biophysical systems and their relationship to human development and to environmental sustainability. A heavy focus of the environment module is on data series relating to emissions of carbon from fossil fuel and land use, the accumulation of atmospheric carbon, and global temperature change. The widespread contemporary attention to these variables means that little processing of existing data is needed, although attention to and conversion of units is required (e.g., carbon versus carbon dioxide weights). The water module extends the environment module by turning to data on water demand and withdrawal (for agriculture, industry, and cities) and water supply (from renewable ground water, renewable surface water, nonrenewable or fossil groundwater, and treated wastewater). It draws on many sources and requires also attention to reconciling aggregate national values for total demand and supply with composite sources of them. Technological change is actually scattered across many of the other modules and the technology module itself focuses only on indices representing the advance of artificial intelligence.
5.Integration and consistency: The social accounting matrix
The preceding section did not discuss two modules in the preprocessor’s initialization of data: economics and government consumption (which we conceptualize as a component of a broader governance module). These systems require bringing together and working across most of the other modules discussed above. For instance, spending on education, health, and infrastructure are part of total government consumption and therefore of government finance more generally. Production, consumption, and trade of energy and agricultural production are important parts of the larger economies, especially in the lower-income countries of most interest with respect to the human and social development variables within the SDGs. In general, analyses of synergies and trade-offs across pursuit of SDGs is rooted in accounting system relationships as well as in understanding causal dynamics (like the importance that access to safe sanitation has for avoiding diarrhea among children and thereby limiting undernutrition). The IFs forecasting system uses both the accounting and causal elements. The preprocessor needs to provide initial conditions for both, and to assure that accounting systems are balanced in the base year.
Table 2
Extended input-output model, hypothetical example
| Intersectoral flows | Final demand | |||||||
|---|---|---|---|---|---|---|---|---|
| Primary | Industrial | Services | Household consumption | Government consumption | Capital formation | Exports | Total | |
| Primary | 30 | 130 | 10 | 12 | 50 | 32 | 100 | 364 |
| Industrial | 25 | 400 | 250 | 123 | 45 | 212 | 312 | 1,367 |
| Services | 40 | 647 | 770 | 345 | 215 | 67 | 189 | 2,274 |
| Imports | 57 | 89 | 129 | 275 | ||||
| Labor value added | 112 | 65 | 640 | 817 | ||||
| Capital value added | 100 | 36 | 475 | 611 | ||||
| Total | 364 | 1,367 | 2,274 | 480 | 311 | 311 | 601 | 5,708 |
Note: Columns are users of goods and services (providers of currency); rows are suppliers of goods and services. Primary includes agriculture and energy. Source: Authors.
Figure 2.
Flows represented in a social accounting matrix. Source: Authors.
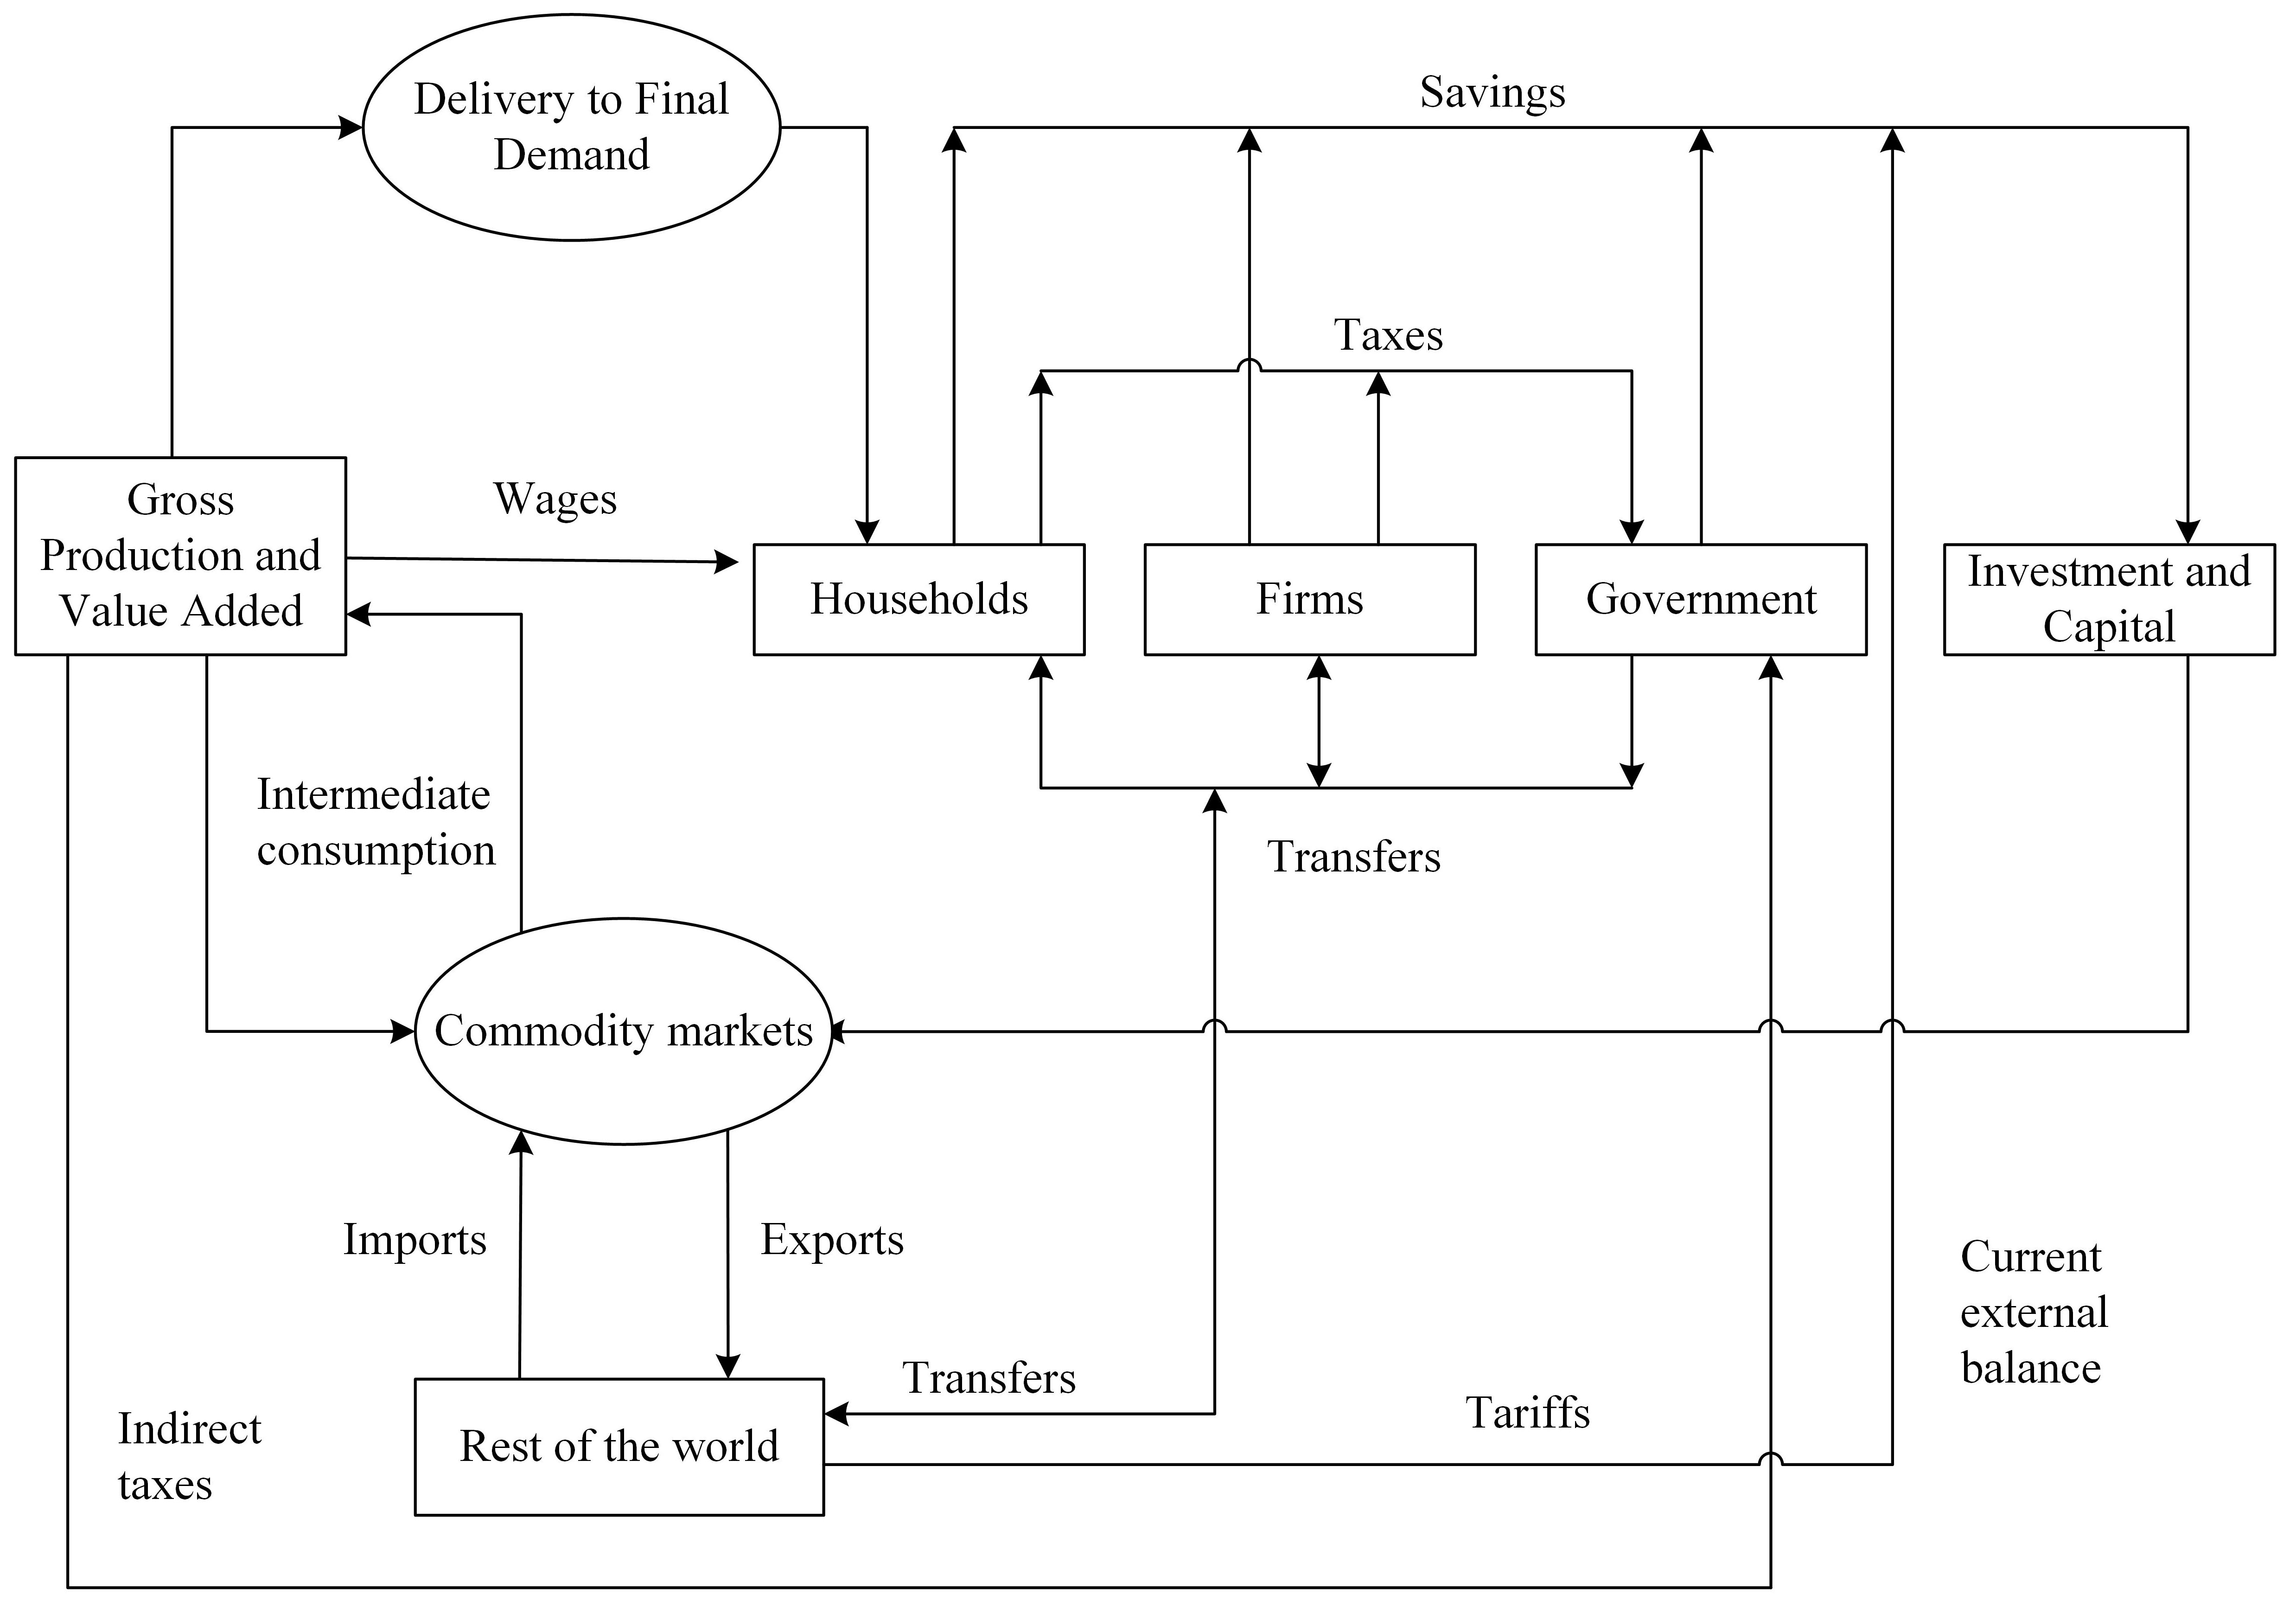
Balancing accounting system data values in a nowcast across these issue areas requires special attention to two accounting frameworks (elaborated in Hughes [11]). The first involves supply and demand of all goods and services in a general equilibrium framework. In monetary terms IFs represents supply, demand and trade in 6 sectors including food and energy, where values are taken primarily from the respective partial equilibrium models (and data modules) that produce physical values for conversion to monetary terms. In economic modeling this requires attention to accounting fidelity in an extended input-output model like the stylized representation of Table 2.
The second accounting framework encompasses the first and is the broader social accounting matrix (SAM). It represents the pattern of financial flows among households, firms, and government within and across countries, as represented stylistically (and therefore very incompletely) in Fig. 2 (see also Fig. 1 in Li [34]).
Although the values in these two accounting systems do not immediately relate to any of the SDGs, the values in any society directly affect ability to pursue them. Therefore, a full nowcasting foundation for analysis of SDG pursuit benefits from a full country-by-country specification of the extended input-output table in the context of the encompassing SAM. On a global basis such accounting information exists most fully within the database of the Global Trade Analysis Project (GTAP), which draws on a global network of researchers. Even that database has, however, significant limitations with respect to constituting a nowcasting foundation for analysis of SDG pursuit. In particular, it covers only 121 countries and omits many of the least developed countries where that pursuit is most challenging; contributions by researchers to the database are intermittent and sometimes only represent a single year that can be some considerable time back; and the dataset does not include many variables related to government and public finance that are related closely to SDG targets such as spending on education, health, and infrastructure.
To build the SAM the IFs economic preprocessor module thus draws very heavily on GTAP data, and augments it with that from the IMF, World Bank, OECD, and other sources. The preprocessor uses generic IO matrices at different levels of economic development, based on those from GTAP, to fill country data holes (they are also used in dynamic forecasting). The government consumption module reads existing data for spending on the military, education, health, infrastructure, and R&D, as well as data on social welfare and pension transfer payments, reconciling all of these to total government expenditure. The economic preprocessor module uses those values and data on government revenue sources including household, firm, and indirect taxes, along with data or estimates of household sectoral consumption, value added and trade by sector, and much more to create reconciled SAMs for each country.
Among the reconciliation processes in the economic preprocessor are some important internally to countries, including:
1. Reading IO data from GTAP, collapsing matrices to the sectors of IFs and creating a set of generic matrices related to development level for the process of filling country holes and preparing for structural change in forecasting.
2. Reading value added for the sectors of the economy where data are available in World Bank data and estimating values for sectors such as energy and materials where they are not.
3. Adjusting input-output, final demand, and value-added data for greater consistency internally and with physical values of energy production and apparent consumption. An iterative process is used for these adjustments, generally privileging the IO data (except relative to the physical energy data), and most often privileging the value-added data on manufactures and services relative to that on final demand allocations by sector.
4. Determining sectors of origin for household and government consumption and more generally fleshing out the final demand side of the economic system.
5. Adding more content to the broader social accounting matrix, beginning with government consumption, transfers, and revenues and proceeding to corporate and household flows.
Many other processes work across countries:
6. Reading and processing the agricultural and energy trade that the preprocessor routines for agriculture and trade have already handled and balanced at the physical level. Converting the physical values to monetary ones and making sure that total trade numbers are consistent with them (that is, that total trade is greater than the sum of that primary goods trade so that there is some “headroom” for other trade).
7. Taking monetary values for merchandise trade and service trade and reconciling them with primary and total country trade; also reading and checking arms trade, manufactures trade, and ICT trade to assure that they fit within merchandise and services trade and they, too, are complete (filled by functions as necessary) and globally balanced. Trade in all sectors of the model must be both reconciled with country totals and balanced at the global level.
8. Processing other current account flows including reading and globalizing worker remittance and foreign aid data.
9. Reading FDI and portfolio flow data and integrating over time to create stock values.
10. Investigating major discrepancies in current and capital account information.
11. Representing government and country-total liabilities and assets balanced globally (stocks as opposed to the flows discussed above).
Table 3
Nowcasts for SGD goal and target/variable from the IFs preprocessing system
| World bank country income categories | |||||
|---|---|---|---|---|---|
| Goal | Target and variable | Low | Lower- middle | Upper- middle | High |
| 1: End poverty in all its forms everywhere | 1.1 Eradicate extreme poverty for all people (target | 44.3 44.5 | 16.1 15.1 | 1.6 1.5 | 0.5 0.2 |
| 2: End hunger, achieve food security, improve nutrition and promote sustainable agriculture | 2.2 Provide for all food intake sufficient to meet dietary requirements (target | 28.9 27.4 | 14.0 12.4 | 7.3 5.9 | 2.8 2.7 |
| 2: End hunger, achieve food security, improve nutrition and promote sustainable agriculture | 2.2 Provide for all children food intake sufficient to meet dietary requirement (target | 19.7 19.8 | 26.1 24.5 | 3.2 3.1 | 2.7 2.7 |
| 3: Ensure health lives and promote well-being for all at all ages | 3.1 Reduce maternal mortality rate (target | 455.9 421.8 | 213.1 199.3 | 36.6 41.6 | 10.8 11.5 |
| 4: Ensure inclusive and equitable quality education and promote lifelong learning opportunities for all | 4.1 Ensure all children complete upper secondary education (target | 19.2 (16.6) 18.6 (16.23) | 40.1 (39.7) 41.4 (41.2) | 64.8 (68.1) 72.3 (76.0) | 87.7 (90.4) 87.6 (90.3) |
| 6: Ensure availability and sustainable management of water and sanitation for all | 6.1 Achieve universal access to safe drinking water (target | 70.6 70.6 | 89.8 90.0 | 97.0 97.2 | 99.5 99.5 |
| 6: Ensure availability and sustainable management of water and sanitation for all | 6.2 Achieve universal access to adequate sanitation (target | 29.0 28.9 | 52.9 53.7 | 80.9 81.4 | 99.1 99.0 |
| 7: Ensure access to affordable, reliable, and sustainable energy for all | 7.1 Ensure universal access to affordable, reliable, and modern energy services (target | 34.7 44.1 | 81.3 89.8 | 99.3 99.6 | 99.8 99.9 |
| 16. Promote peaceful and inclusive societies for sustainable development, provide access to justice for all and build effective, accountable and inclusive institutions at all levels | 16.5 Substantially reduce corruption and bribery in all their forms (target for transparency | 2.48 2.48 | 2.88 2.86 | 3.41 3.32 | 6.54 6.27 |
Note: The first line of numerical values in each cell are produced by the preprocessor for 2015; the second is for 2020 using 2019 base-year rebuild and run of model to 2020 with IMF COVID-year economic growth estimates. Source: Authors.
6.Illustrative results: Nowcast values for SDG target variables
The Sustainable Development Goals cover a broad range of human development and environmental variables. In fact, at least one target variable is available within IFs for each of the 17 goals. The IFs preprocessor and broader model system are especially useful in assessing SDG progress with respect to goals related to human and social system development. That is in part because the quantitative targets for those goals are better defined. The higher-numbered goals include several that have no associated quantification. An example is Goal 12 to “Ensure sustainable consumption and production patterns.” Or quantification is more easily possible, but like Goal 14 to “Conserve and sustainably use the oceans, seas, and marine resources for sustainable development,” the focus in on global public goods and target values for specific countries often do not exist.
Table 3 identifies selected goals and targets for which there are clear numerical target values [35] in general use that can be evaluated at the country level, even when quantification may not have been specified in the original goal/target/indicator statements by the United Nations [36]. It has become very common, for example, to use the World Bank’s [37] quantification of ending or eradicating extreme poverty to mean reducing those suffering from it to fewer than 3% of the population. The IFs project and Table 3 uses that same target level for other goals that specify ending conditions such as hunger and uses the same logic of reaching 97% for goals related to universality such as with secondary education (electricity arbitrarily at 95% because of off-grid preference by some). Table 3 shows values for the same variables (providing associated variable names in IFs) that were included in formulation specifications of Table 2. Table 3 simplifies the official target descriptions. It shows values for the four World Bank country income groupings. To see values for each country, access IFs at pardee.du.edu.
The first line of numerical values in each cell was produced by use of the preprocessor to build values for initializing IFs in 2015, the current base year of the model. Extending the approach to nowcasting of the current year, the second lines show year 2020 values that a base rebuild for 2019 combined with a model run through 2020 produces. The reasons that the year 2020 values do not come directly from the preprocessor but instead from the combined 2019 rebuild and 2-year model run are that (1) very few SDG indicator variable estimates for the year 2020 are yet available in the foundational dataset (in fact, many values for 2019 are obviously nowcast from relatively sparse data) and (2) the year 2020 is especially challenging for nowcasting given the unknown but certainly broad impacts of COVID-19.
Given nowcast values from the preprocessor for the base year, the model can run forward in time fully endogenously. It is also possible, however, to exogenously override selected variables in IFs during the model run. Those include two that discussion of the preprocessor described as “essential series” in the database, namely population and GDP, but also include other important driver variables such as educational attainment of adults and income distribution. For the analysis of COVID impacts in 2020 and subsequent years, it was important to provide exogenous estimates of GDP impact in at least 2020 and 2021. The IFs project has taken evolving IMF [38, 39] estimates from its World Economic Outlook and added them to the extensive IFs database. When the preprocessor and model recognize them to be there beyond the base year, they override otherwise endogenous model calculations. The IFs project presumption is that specialized expertise like that of the IMF should provide sounder values for such variables in the face of systemic shocks than the IFs system would without explicit representation of dynamics generating the growth disruption. The selective turning on of exogenous overrides also facilitates use of the model for a variety of scenario analyses. For instance, the sets of projections of GDP, population, and education for the five Shared Socioeconomic Pathways project [40] are in the IFs data file structure and can be swapped in to override model computations as desired.
Table 3 provides some insights into changes that are occurring with respect to important SDG indicator variables and simultaneously demonstrates the value of the nowcasting. For instance, it shows that, in general, progress with respect to poverty in low-income countries has been less in very recent years than it has been in lower-middle and upper-middle income countries. Internal project analysis (not shown in Table 3) also suggests that even though the GDP growth damage of COVID in low-income countries between 2019 and 2020 may not be greater than that for middle-income countries, their setbacks in progress against poverty will be greater. In contrast, it is the lower-middle-income countries that have suffered most since 2015 with respect to air quality.
Another insight from Table 3 is that low-income country progress on health variables such as maternal mortality has been substantial even over a period of only five years and in the face of economic growth downturns in 2020. Little is more important to societies than health and advances in technology and medical care systems are significant.
The differential progress indicated with respect to key elements of infrastructure, notably the rapid improvements in electricity access on one side, and the slow improvement in access to safe water and sanitation on the other, raises a flag with respect to the formulations within the IFs preprocessor and/or the underlying databases. Extensive nowcasting for very recent and even current years remains a work in progress.
7.Discussion and conclusion
Most integrated assessment models such as IFs have maintained base years much earlier than the current year. One cost of that is producing projected values in early years that can be obviously incorrect. Developments in the IFs preprocessor across the last decade have been making that lag increasingly unnecessary. In fact, as indicated above, given that GDP at MER or GDP per capita at PPP estimates are routinely being made by sources such as the IMF for the current and near future years, it is possible to use the preprocessor even in advance of current year-end.
Such nowcasting is not only important for modeling and forecasting, it is important for understanding the recent rates of progress toward the Sustainable Development Goals, the objectives that have come to dominate national, regional, and global policy pushes toward sustainable development. Further, there can be little doubt that before or soon after the 2030 horizon for the SDGs is reached, successor sets that grow integrally from the current set will continue framing those efforts.
The preprocessor has been a work in progress within the IFs project for two decades. It grew out of the recognition that far too many person-years were being invested in the rebasing of large-scale global models when it was possible to code the algorithms that scientists and their students were using and re-using manually. Automating the tedious process can also reduce errors.
The effort is not complete. Many data series from many sources beyond the “essential series” are desired to feed the preprocessor. Although many semi-automated procedures for pulling those into a common database have been created within IFs, it requires subject knowledge and careful attention to avoid egregious problems that can arise within the original source or data processing (not least issues such as changes in units reported, country names, and even conceptualization and original source data generation processes).
As we have made clear, use of the system for even current year rebasing is now possible, if not always completely satisfactory. The preprocessor will benefit from three efforts going forward: (1) more attention to careful extrapolation across the complete and wide range of data series accessed; (2) automation of the updating via re-estimation of the cross-sectional functions used to fill holes (including addressing how more automatic processes could deal with the sticky issue of best analytical forms of those functions changing across time); and (3) constant attention to improving all algorithms that fill holes, reconcile conflicts, and assure intra-data system accounting consistency. The importance of SDGs nowcasting and forecast-based analysis will drive the effort forward.
Acknowledgments
Work on IFs goes back several decades and that on its preprocessor now stretches across two of those. Many more modelers and graduate assistants deserve acknowledgement than is possible here. In particular, Dr. Stuart Bremer, colleague and friend of this report’s lead author, helped conceptualize work on the preprocessor. We miss him.
References
[1] | van Soest HL, van Vuuren DP, Hilaire J, Minx JC, Harmsen MJHM, Krey V, et al. Analysing interactions among sustainable development goals with integrated assessment models. Global Transitions. (2019) Jan 1; 1: : 210–25. |
[2] | Sachs J, Schmidt-Traub G, Kroll C, Lafortune G, Fuller G. SDG Index and Dashboards 2018 [Internet]. New York: Bertelsmann Stiftung and Sustainable Development Solutions Network (SDSN); Available from: https://www.sustainabledevelopment.report. |
[3] | Cuaresma JC, Fengler W, Kharas H, Bekhtiar K, Brottrager M, Hofer M. Will the sustainable development goals be fulfilled? Assessing present and future global poverty. Palgrave Communications. (2018) ; 4: (1): 1–8. |
[4] | Lucas PL, Hilderink HBM, Janssen PHM, Kc S, van Vuuren DP, Niessen L. Future impacts of environmental factors on achieving the SDG target on child mortality – a synergistic assessment. Global Environmental Change. (2019) Jul 1; 57: : 101925. |
[5] | Laborde Debucquet D, Bizikova L, Lallemant T, Smaller C. Ending hunger: What would it cost? [Internet]. Washington DC: International Food Policy Research Institute; (2016) Oct. Available from: https://www.ifpri.org/publication/ending-hunger-what-would-it-cost. |
[6] | Moyer JD, Bohl DK. Alternative pathways to human development: assessing trade-offs and synergies in achieving the sustainable development goals. Futures. (2019) Jan 1; 105: : 199–210. |
[7] | Moyer JD, Hedden S. Are we on the right path to achieve the sustainable development goals? World Development. (2020) Mar 1; 127: : 104749. |
[8] | Weitz N, Nilsson M, Davis M. A nexus approach to the post-2015 agenda: formulating integrated water, energy, and food SDGs. SAIS Review of International Affairs. (2014) Dec 1; 34: (2): 37–50. |
[9] | Obersteiner M, Walsh B, Frank S, Havlík P, Cantele M, Liu J, et al. Assessing the land resource – food price nexus of the sustainable development goals. Science Advances. (2016) Sep 1; 2: (9): e1501499. |
[10] | Sellers S, Ebi KL. Climate change and health under the shared socioeconomic pathway framework. International Journal of Environmental Research and Public Health. (2017) Dec 1; 15: (1): 3. |
[11] | Hughes B. International Futures: Building and Using Global Models [Internet]. 1st ed. London: Elsevier Academic Press; (2019) . Available from: https://pardee.du.edu/international-futures-building-and-using-global-models. |
[12] | Hughes BB, Johnston PD. Sustainable futures: policies for global development. Futures. (2005) Oct 1; 37: (8): 813–31. |
[13] | Moyer JD, Hughes BB. ICTs: do they contribute to increased carbon emissions? Technological Forecasting and Social Change. (2012) Jun 1; 79: (5): 919–31. |
[14] | Milante G, Hughes B, Burt A. Poverty eradication in fragile places: prospects for harvesting the highest hanging fruit by 2030. Stability: International Journal of Security and Development. (2016) Jul 25; 5: (1): 7. |
[15] | Cilliers J. Africa First: Igniting a Growth Revolution. Jeppestown, South Africa: Jonathan Ball Publishers; (2020) . |
[16] | Hughes B, Kuhn R, Peterson C, Rothman D, Solórzano J, Mathers C, et al. Projections of global health outcomes from 2005 to 2060 using the International Futures integrated forecasting model. Bulletin of the World Health Organization. (2011) Jul 1; 89: : 478–86. |
[17] | Hughes BB, Bohl D, Irfan M, Margolese-Malin E, Solórzano JR. ICT/cyber benefits and costs: reconciling competing perspectives on the current and future balance. Technological Forecasting and Social Change. (2017) Feb 1; 115: : 117–30. |
[18] | Centro Nacional de Planeamiento Estratégico (CEPLAN). Pronósticos y escenarios: Educación en el Perú al 2030. La aplicación del modelo International Futures [Internet]. San Isidro, Lima, Perú: Centro Nacional de Planeamiento Estratégico; (2015) . (Avance de Investigación). Report No.: 7. Available from: http://www.ceplan.gob.pe/documentos_/pronosticos-y-escenarios-educacion-en-el-peru-al-2030-la-aplicacion-del-modelo-international-futures/. |
[19] | Centro Nacional de Planeamiento Estratégico (CEPLAN). Economía Informal en Perú: Situación Actual y Perspectivas [Internet]. San Isidro, Lima, Perú: Centro Nacional de Planeamiento Estratégico; (2016) . (Avance de Investigación). Report No.: 8. Available from: https://www.ceplan.gob.pe/documentos_/economia-informal-en-peru/. |
[20] | Hughes BB, Moyer JD, Sisk TD. Vulnerability to Intrastate Conflict: Evaluating Quantitative Measures [Internet]. Washington, DC: United States Institute of Peace; (2011) . (Peaceworks Report). Report No.: 72. Available from: http://www.usip.org/sites/default/files/Vulnerability_to_Intrastate_Conflict.pdf. |
[21] | Hughes BB, Kuhn R, Margolese-Malin ES, Rothman DS, Solórano JR. Opportunities and challenges of a world with negligible senescence. Technological Forecasting and Social Change. (2015) Oct 1; 99: : 77–91. |
[22] | Chenery HB. Structural Change and Development Policy. Baltimore, MD: Johns Hopkins University Press; (1979) . |
[23] | Syrquin M, Chenery H. Three decades of industrialization. World Bank Economic Review – WORLD BANK ECON REV. (1989) May 1; 3: : 145–81. |
[24] | Sachs JD. The End of Poverty: Economic Possibilities for Our Time. New York, NY: Penguin Press; (2005) . |
[25] | Bun MJG, Harrison TD. OLS and IV estimation of regression models including endogenous interaction terms. Econometric Reviews. (2019) Aug 9; 38: (7): 814–27. |
[26] | Hughes B. Global social transformation: the sweet spot, the steady slog, and the systemic shift. Economic Development and Cultural Change. (2001) Feb 1; 49: : 423–58. |
[27] | Sprague TB. Explanation of a new formula for interpolation. Journal of the Institute of Actuaries and Assurance Magazine. (1880) ; 22: (4): 270–85. |
[28] | Hughes BB, Irfan M. The Data Pre-Processor of International Futures (IFs) Working Paper. (2013) . |
[29] | Irfan MT. A Global Education Transition: Computer Simulation of Alternative Paths to Universal Basic Education [Internet]. [Denver, CO]: University of Denver; (2008) . Available from: http://www.pardee.du.edu/sites/default/files/Irfan_2008_Global_Education_Transition.pdf. |
[30] | Dickson JR, Hughes BB, Irfan MT. Advancing global education: patterns of potential human progress, vol. 2. Population and Development Review. (2011) ; 37: (2): 403–4. |
[31] | Barro RJ, Lee JW. A new data set of educational attainment in the world, 1950–2010. Journal of Development Economics. (2013) Sep 1; 104: : 184–98. |
[32] | Altinok N, Angrist N, Patrinos HA. Global data set on education quality (1965–2015) [Internet]. World Bank Group; (2018) . Report No.: WPS 8314. Available from: https://documents.worldbank.org/en/publication/documents-reports/documentdetail. |
[33] | Altinok N, Diebolt C, Demeulemeester J-L. A new international database on education quality: 1965–2010. Applied Economics. (2014) Apr 13; 46: (11): 1212–47. |
[34] | Chung I, Li J. A 1998 Social Accounting Matrix for Thailand [Internet]. Washington DC: International Food Policy Research Institute; (2002) . Report No.: 95. Available from: https://ebrary.ifpri.org/digital/collection/p15738coll2/id/63061. |
[35] | United Nations. The Sustainable Development Goals Report 2020 [Internet]. New York, NY: United Nations; (2020) . Available from: https://unstats.un.org/sdgs/report/2020/. |
[36] | United Nations. Transforming our World: The 2030 Agenda for Sustainable Development. Sustainable Development Knowledge Platform [Internet]. New York: United Nations; (2015) . Available from: https://sustainabledevelopment.un.org/post2015/transformingourworld/publication. |
[37] | Ravallion M. How long will it take to lift one billion people out of poverty? World Bank Res Obs. (2013) Aug 1; 28: (2): 139–58. |
[38] | IMF. World Economic Outlook, April 2020: The Great Lockdown [Internet]. Washington DC: International Monetary Fund; (2020) Apr. Available from: https://www.imf.org/en/Publications/WEO/Issues/2020/04/14/weo-april-2020. |
[39] | IMF. World Economic Outlook Update, June 2020: A Crisis Like No Other, An Uncertain Recovery [Internet]. Washington DC: International Monetary Fund; (2020) Jun. Available from: https://www.imf.org/en/Publications/WEO/Issues/2020/06/24/WEOUpdateJune2020. |
[40] | O’Neill BC, Kriegler E, Ebi KL, Kemp-Benedict E, Riahi K, Rothman DS, et al. The roads ahead: narratives for shared socioeconomic pathways describing world futures in the 21st century. Global Environmental Change. (2017) Jan 1; 42: : 169–80. |


