
Advancing environmental-economic accounting in the context of the system of economic statistics
Abstract
Natural capital and its increasing scarcity have been at the heart of concerns over sustainability for many decades. This paper highlights the significant advances in accounting for the stocks and flows of natural capital that have taken place in the statistical community through the ongoing development and implementation of the System of Environmental-Economic Accounting (SEEA). Through description of the history and key components of the SEEA and through presentation of various examples of accounting from around the world, this paper demonstrates not only the theoretical advances but also the feasibility and relevance of SEEA based accounts to policy making. The increasing recognition of the threats of climate change and the importance of halting biodiversity loss and maintaining healthy ecosystems which provide essential contributions to people, make the implementation of the SEEA extremely timely and relevant in supporting policies that take into account the environment. There is now clear support from the official statistics community and a clear role for national statistical offices in using the SEEA to go “beyond GDP”. We can no longer afford to ignore our dependence on the environment, our natural capital. Accounting for it is part of the pathway forward.
1.Introduction
Natural capital and its increasing scarcity have been at the heart of concerns over sustainability for nearly 50 years [1, 2, 3]. Since the key drivers of natural capital’s scarcity are economic growth and the related increasing consumption of growing populations, there has long been discussion that the measure of economic growth, gross domestic product (GDP), has inappropriately become the most widely adopted measure of progress [4, 5, 6].
The limitations of GDP with respect to the environment emerge from its focus on economic activity and associated capital. The framework underpinning GDP, the System of National Accounts (SNA) [7], describes a comprehensive and internally consistent accounting for all market-related flows of income. This focus does include some environmental connections – mainly in terms of flows of natural resources as inputs to primary production and expenditures on environmental protection. However, it does not support a broader assessment of the sustainable use of resources, the impacts of economic production and consumption on the environment, or recognition of other benefits that contribute to individual and societal well-being.
In this context, alternative measures of progress that incorporate a range of non-economic factors, including natural capital, have been developed for many years. High profile examples include the Human Development Index [8] and the Genuine Progress Indicator [9]. Many build from the pioneering work of Nordhaus and Tobin in the early 1970s [10]. Nonetheless, however widely publicized or recognized, these alternative measures have not displaced GDP as the focal indicator for economic and development policy and have not driven substantive improvements in environmental outcomes.
One reason for this lies in the role of accounting principles in providing GDP and related aggregates with a remarkably robust measurement framework [11]. The internal coherence of stock and flow measures within well-defined production and asset boundaries is central to the longevity of GDP. The recognition of the potential of accounting to support understanding of sustainability has been long recognized. Of particular note is work on wealth accounting which establishes the connection between overall well-being and multiple forms of capital – including natural, produced, social and human capital (see for example [12, 13, 14, 15]). The theoretical developments in this space have been applied in a range of contexts most notably in the development of measures of genuine savings and national wealth by the World Bank [16] and in the development of the Inclusive Wealth Index [17].
Within the statistical community, the potential of accounting-based approaches to go beyond GDP has also been a long-standing ambition reflected in the development of the System of Environmental-Economic Accounting (SEEA). A key motivation for developing the accounting extensions of the SEEA is that by extending and adapting the standard economic accounting framework, it will facilitate mainstreaming environmental information within regular discussions on economic and development policy. Thus, rather than setting up alternative and competing measures, the intent is to apply the existing SNA accounting principles to enable a broader story to be conveyed in which environmental factors are integrated with economic data.
The purpose of this paper is to describe the considerable advances in the development, implementation and application of the SEEA over the past 10 years building on the founding work from the 1980s onwards. In Section 2 the development of the SEEA is framed in terms of its extension of accounting principles. Section 3 describes the key components of the SEEA system of accounts and the related outputs. Section 4 provides an overview of implementation and application of the SEEA highlighting examples of its use at country level and in relation to various sustainability related international conventions, such as the sustainable development goals (SDGs). Section 5 concludes.
2.Framing the development of the seea
The potential and need to better integrate measures relating to natural capital within the national accounts framework emerged through the 1970s and 80s (see [18, 19]). Consistent with a request from the first United Nations Conference on Environment and Development held in Rio de Janeiro in 1992 [20], the United Nations Statistics Division led the drafting of the first international document on environmental-economic accounting [21] This document, Integrated Environmental and Economic Accounting, became known as the System of Environmental-Economic Accounting or SEEA. It was an interim document prepared by the world’s official statistics community in collaboration with the environmental economics community to propose ways in which the SNA might be extended to better take natural capital into consideration.
Since that initial work in 1993, work on environmen-tal-economic accounting (now commonly referred to as “natural capital accounting”) using the SEEA, continued steadily within the auspices of the official statistics community. This work resulted in the publication of the SEEA 2003 by the United Nations, the European Commission, the Organisation for Economic Cooperation and Development (OECD), the International Monetary Fund and the World Bank [22] and culminated with the significant milestone of the adoption by the United Nations Statistical Commission in March 2012 of the SEEA 2012 Central Framework [23] as the first international statistical standard for environmental economic accounting. This adoption, combined with the release in March 2013 of the SEEA 2012 Experimental Ecosystem Accounting [24], has seen a remarkable increase in awareness and uptake of the SEEA around the world. The nature and extent of the increase is described in Section 4.
Development of the SEEA since 1993 has seen an important broadening of focus in SEEA related work. In the 1980s and early 1990s, the primary focus of the SEEA was on extensions and adjustments to GDP, for example measures of depletion and degradation adjusted GDP, and recording environmental expenditures. This focus responded directly to concerns about the limitations of GDP. Discussion thus commonly focused on the range of ways in which depletion and degradation might be estimated, valued and subsequently incorporated within the structure of the standard national accounts and its various measures of production, income, saving and wealth.
Through the 1990s this specific focus started to broaden to consider ways in which accounting principles and approaches, such as supply and use tables, may be useful in the organization of physical data on environmental stocks and flows such as water, energy, emissions and solid waste. This extension of accounting principles built on work to model the economy in physical terms (see for example [1]) and reflected a recognition that accounting principles could be applied without reference to monetary units.
This broader application of accounting has been expanded further in recent years through the development of ecosystem accounting which incorporates accounting in physical terms for ecosystem extent and condition and flows of ecosystem services. The extension to physical accounting confronts the common conception that adoption of accounting approaches necessarily relies on the valuation of nature in monetary terms. At the same time, the SEEA retains an inherent accounting desire for integration thus ensuring (i) that physical measurements are aligned with measurement in monetary terms and (ii) that environmental data can be meaningfully integrated with standard economic and financial data to support economic decision making.
Figure 1.
a: The Economy – Environment connection in the SNA. b: The Economy – Environment connection in the SEEA Central Framework. c: The Economy – Environment connection in ecosystem accounting. Source: Adapted from [24] Figure 2.1.
![a: The Economy – Environment connection in the SNA. b: The Economy – Environment connection in the SEEA Central Framework. c: The Economy – Environment connection in ecosystem accounting. Source: Adapted from [24] Figure 2.1.](https://content.iospress.com:443/media/sji/2020/36-3/sji-36-3-sji200707/sji-36-sji200707-g001.jpg)
The progression just described is shown in the following series of figures. Figure 1a is a representation of the focus of measurement in the SNA with respect to the environment where definition of the economy and production is central. Figure 1b, from the SEEA Central Framework, is the core SEEA perspective in which the economy is seen as nested within the environment. A key focus of accounting is thus on the flows into the economy (natural inputs); the use of those in the economy and the flows from the economy to the environment that result from economic production and consumption (residuals). The SEEA Central Framework retains the same production boundary as the SNA but recognizes a broader set of environmental assets including all land and water resources, i.e. beyond natural resources that contribute to GDP.
Figure 1c, provides an ecosystem accounting view in which a further broadening of measurement occurs. Here, environmental assets are considered from the perspective of ecosystems represented by spatial areas (e.g. forests, wetlands, agricultural areas). This additional richness in describing environmental assets supports a better understanding of changes in environmental quality (e.g. degradation). Broadening also occurs in recognizing a broad suite of ecosystem services supplied by ecosystems thus extending the production boundary of the SNA. Some of these ecosystem services contribute to current SNA production but others, such as air filtration and carbon sequestration allow for the accounts to support discussion of a wider conception of well-being.
While going beyond the SNA, the SEEA has deliberately applied its accounting principles. Using an accounting approach based on extensions and adaptations of the SNA allows:
• The coherent use of accounting identities and principles across environmental and economic data, such as those concerning supply and use, delineating units and territories and monetary valuation
• The coherent use of classifications, such as those concerning industries and institutional sectors, to integrate environmental and economic data.
• Promoting standard national accounting practices of integrating and comparing alternative data sources to ensure data coherence and analyse data gaps.
• Linking environmental data to existing economic modelling and analysis tools such as input-output and CGE models.
• Establishing a clear and accepted measurement baseline that reflects a view of the environment and the economy as nested rather than competing systems.
The use of common accounting principles also permits developments in the measurement of environmental stocks and flows to be readily considered in improving the measurement of relevant components of the SNA, for example in the measurement of flows concerning natural resources including energy and water.
3.Overview of SEEA’s components
3.1Introduction
The SEEA 2012 comprises two key volumes the SEEA 2012 Central Framework [23] and the SEEA 2012 Experimental Ecosystem Accounting [24]. This section describes the key components included in these volumes structured in terms of accounting for environmental assets, accounting for physical flows and accounting for environmental transactions.
Other SEEA publications have also been developed or are developing. SEEA Water [25] and SEEA Energy [26] provide specific accounting descriptions in these two areas with direct links to associated international recommendations for water and energy statistics. The SEEA Agriculture, Forestry and Fisheries (SEEA AFF) [27] applies the accounting structures and principles of the SEEA Central Framework to a sub-set of the economy, and a similar approach has been developed in the context of tourism activity [28]. Further, to respond to current areas of high policy interest, work has commenced on applying SEEA’s principles and structures to support discussion of oceans and biodiversity in particular aiming to highlight the connections between the environment and the economy in these contexts.
3.2Accounting for environmental assets
Accounting for environmental assets is at the heart of the SEEA. From a measurement perspective however, environmental assets can prove difficult to define and, commonly, varying terms and definitions are used without a clear understanding of the links to standard measures of economic assets as defined in the SNA. Double counting or measurement gaps are therefore real risks. The SEEA Central Framework brings increased clarity to this area of accounting.
Environmental assets are defined broadly to encompass the whole of the biophysical environment. Thus “environmental assets are the naturally occurring living and non-living components of the Earth, together constituting the biophysical environment, which may provide benefits to humanity” [23].
For measurement purposes this definition is considered from two different but complementary perspectives. In the first perspective various components of the biophysical environment are measured as individual environmental assets. These components include mineral and energy resources, soil resources, timber resources, fish and aquatic resources, other biological resources and water resources. Asset accounts that record the opening and closing stocks of these resources and the additions and reductions in stock are described in the SEEA Central Framework. The measurement scope of individual environmental assets is not limited to purely natural resources and hence includes, for example, timber resources in plantation forests. Coverage of both natural and cultivated environmental assets ensures that changes in the composition of environmental assets can be recorded.
The second perspective on the measurement of environmental assets is to consider how the environment functions as a system by separating the environment into various ecosystem assets including forests, wetlands and agricultural areas. Thus, in ecosystem accounting, for example, rather than focus only on the timber resources of a forest, also considered is the functioning of the forest reflecting the interactions among the trees, the soil, the water resources and the other characteristics (e.g. biodiversity) and processes and the suite of services beyond timber including air filtration, carbon sequestration and recreational opportunities.
To give effect to this wider, systems view in accounting terms requires a series of accounts to be developed. Thus, ecosystem accounting comprises:
• Ecosystem extent accounts which record the total area of each ecosystem type within an ecosystem accounting area and, over time, record compositional changes within an ecosystem accounting area.
• Ecosystem condition accounts which record the condition of ecosystem assets in terms of selected characteristics at specific points in time and, over time, records the changes in condition.
• Ecosystem services supply and use account in physical terms records the supply of ecosystem services by ecosystem assets and the use of those services by economic units, including households.
Table 1
Basic form of a physical supply and use table
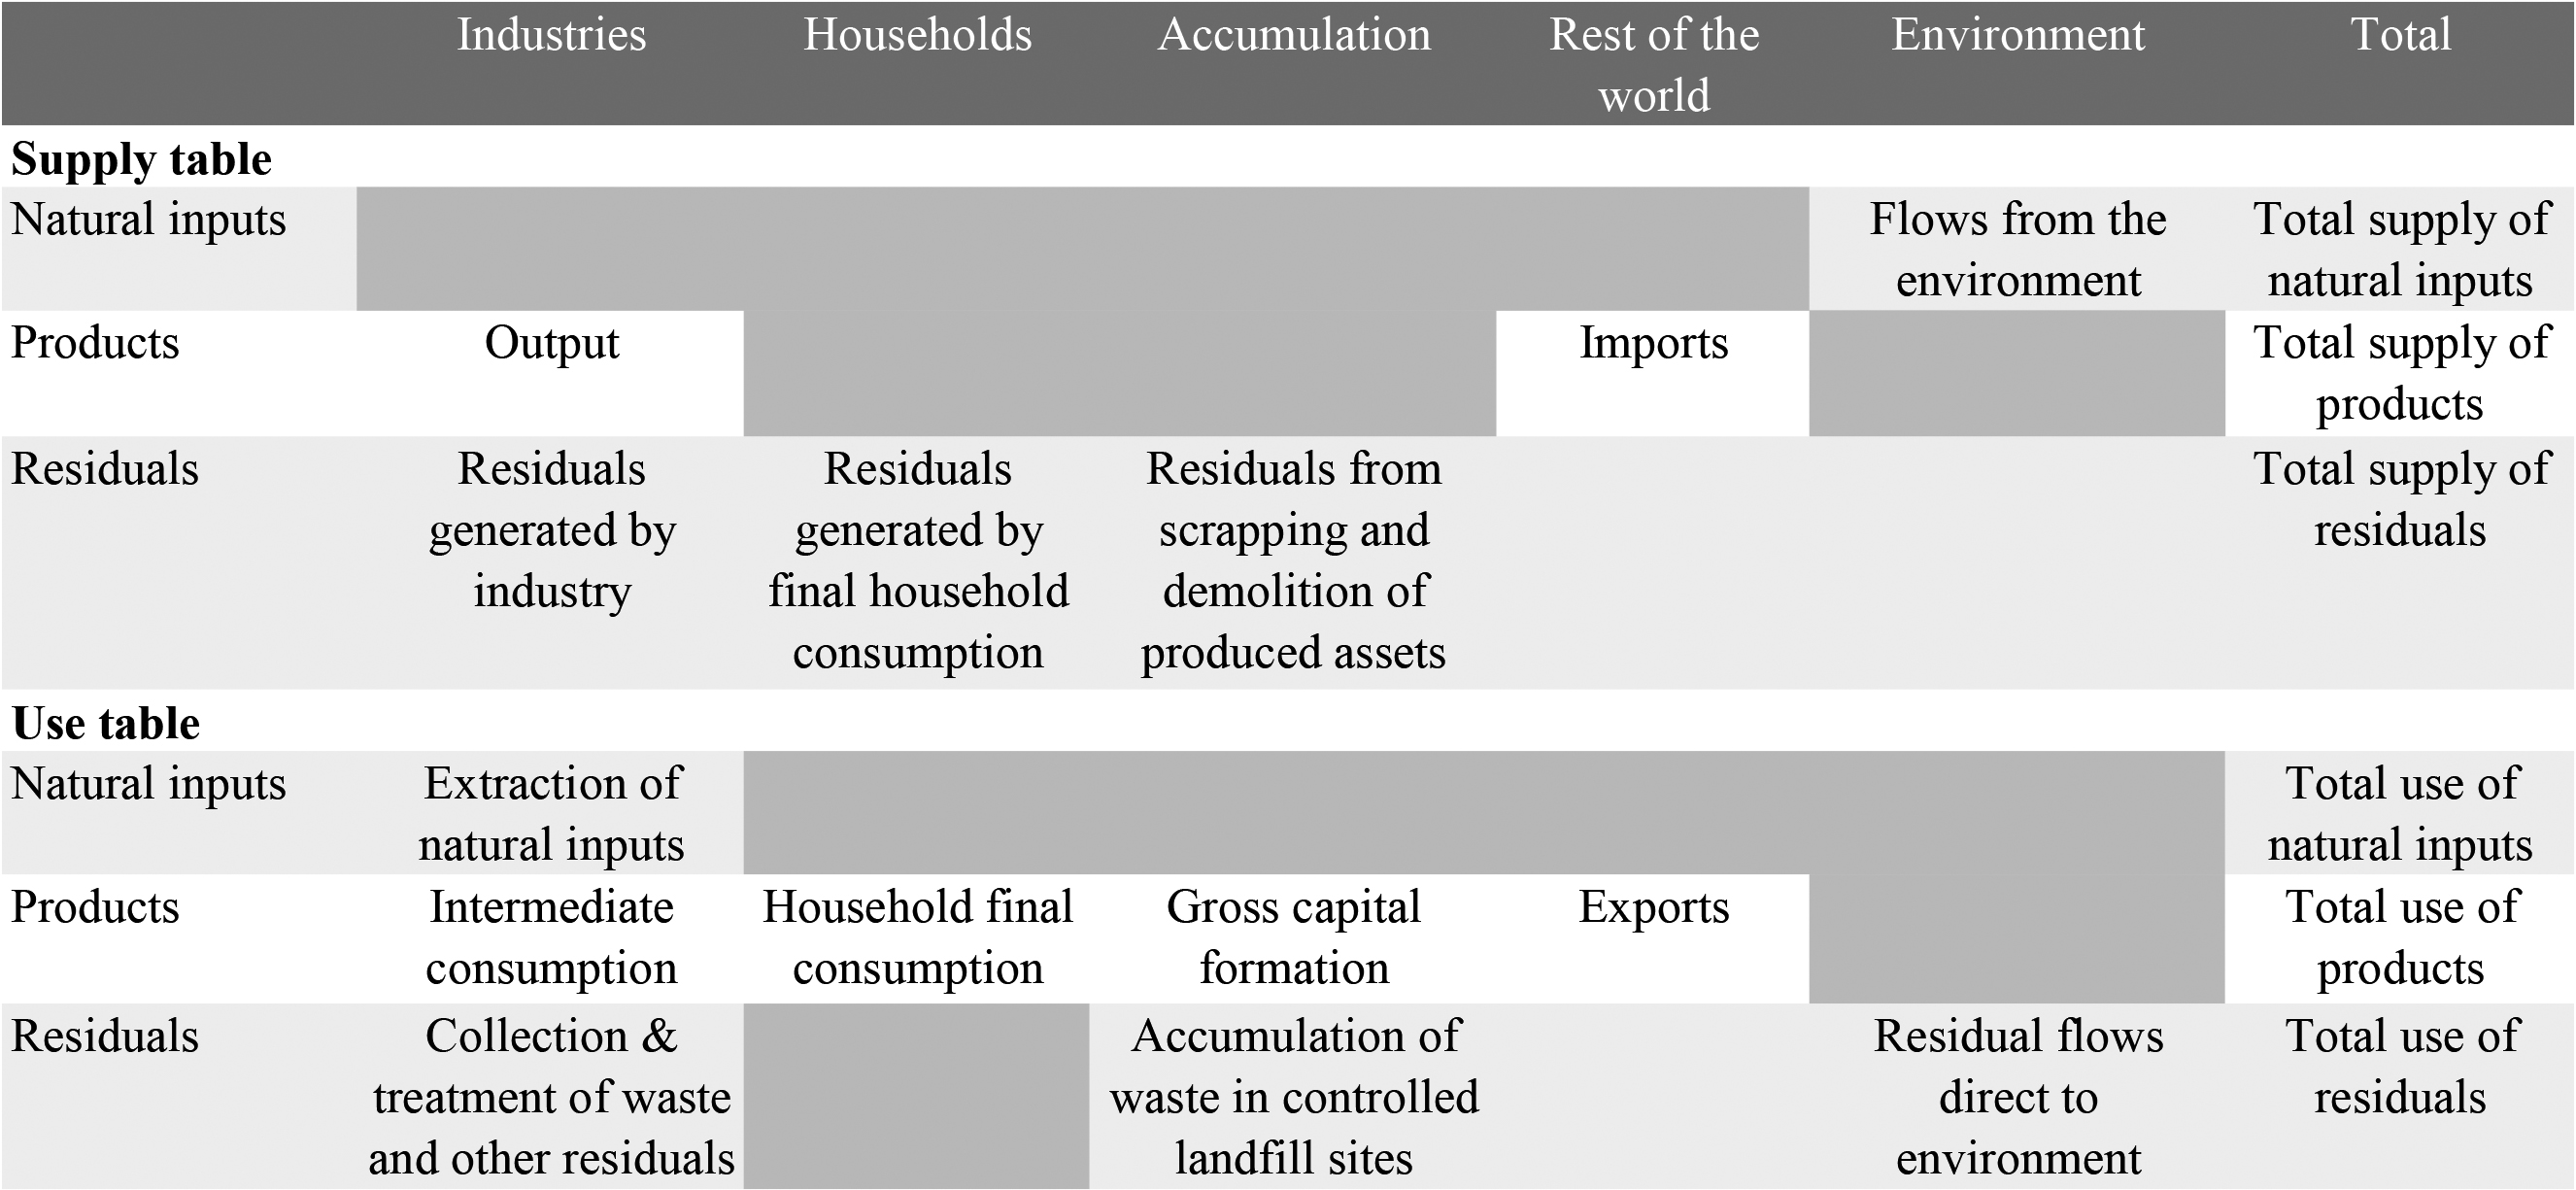
Note: Dark grey cells are null by definition. Source: [23] Table 2.2.
• Ecosystem services supply and use account in monetary terms records flows of ecosystem services based on estimating prices for individual ecosystem services and multiplying through by the physical quantities.
• Ecosystem monetary asset accounts record information on the monetary value of stocks and changes in stocks (additions and reductions) of ecosystem assets. This includes accounting for ecosystem degradation and enhancement.
![The ecosystem accounting framework. Source: Adapted from [24] Figure 2.2.](https://content.iospress.com:443/media/sji/2020/36-3/sji-36-3-sji200707/sji-36-sji200707-g002.jpg)
Figure 2 shows how the concepts of ecosystem assets and ecosystem services are related in the ecosystem accounting framework.
Beyond the measurement of the physical stocks and flows of environmental assets, the SEEA provides guidance on their valuation. To support comparison and integration with standard economic and financial data, the valuation principles used in the SEEA are aligned with the exchange value concept applied in the SNA.
3.3Accounting for physical flows
Physical flow accounts are the most well-developed of the SEEA accounts and have been implemented in many countries. For example, at least 42 countries have implemented water accounts [29]. Physical flow accounts are also common for flows of water, greenhouse gas emissions and solid waste. Each physical flow account is balanced by virtue of using a single measurement unit (e.g. tonnes, cubic metres, joules) and by ensuring that all flows between the economy and the environment, and within the economy, are constrained to satisfy the supply-use and input-output identities.
The core logic of physical flow accounts was presented above in Fig. 1b. Each physical flow account considers, as appropriate, the flows of the relevant substance from the environment to the economy (natural inputs), within the economy (flows of products) and from the economy to the environment (residuals). Accounts for water and energy track all of these types of flows. Accounts for greenhouse gas emissions focus only on residual flows.
A unique aspect of the SEEA is its definition of the boundary of the economy. It is defined in such a way that the physical flows can be directly related to the monetary flows that are recorded in the measurement of GDP. GDP is defined by a production boundary, that is, the set of goods and services that results from production by economic units. The SEEA defines this production boundary in physical terms. The outcome is that direct relationships can be made between standard economic accounting measures such as output and value added, and physical measures such as water and energy use, and greenhouse gas (GHG) emissions.
This unique aspect may be particularly important where the physical data sets (e.g. GHG emission inventories) are commonly collected without consideration of the precise measurement scope of the economy.
Importantly, the physical flow accounts of the SEEA apply standard product, industry and institutional sector classifications such that economic data and environmental information can be readily compared. This allows straightforward and correct definition of productivity and intensity indicators where physical flows are compared to economic variables such as value added and output. Further, with physical data structure and scoped following the SEEA extensions to input-output tables are more straightforward thus supporting the derivation of footprint and similar calculations. The generic structure of SEEA physical flow accounts is shown in Table 1.
The application of supply and use recording principles for environmental flows supports a wide range of applications including linking to standard input-output tables to model the environmental effects of different economic activities and policy choices. Information from physical flow accounts also support a coherent recording of environmental pressures both in terms of pressures from resources use (e.g. water and energy) and in terms of the release of residuals such as GHG emissions, solid waste and wastewater. When combined with information on the changing condition of ecosystems, as described in an ecosystem condition, it is clear that accounting can provide the basis for an informed discussion about the links between economic activity and the environment.
3.4Accounting for environmental transactions
The predominant focus in natural capital accounting is on integrating environmental information into standard economic accounts. However, also of interest is the potential to glean information from standard economic accounts about activities undertaken by economic units that may be considered “environmental”.
To this end, the SEEA Central Framework defines the environmental activities of environmental protection and resource management as constituting a scope that can be used to classify various standard economic flows such as output, value added, investment and employment. The SEEA Central Framework defines environmental protection expenditure accounts to record expenditures by governments, households and businesses that have the purpose of maintaining or improving the environment. The SEEA Central Framework also defines the Environmental Goods and Services Sector (EGSS) and an associated set of indicators that may be used to provide ongoing estimates of output and employment in environmental activities as a share of overall economic activity.
This area of the SEEA also provides definitions for environmental taxes and environmental subsidies and similar transfers. Particularly at an international level, consistent definition of these types of variables permits an assessment of alternative policy responses.
Collectively, data on environmental transactions records society’s economic response to environmental issues and thus completes a picture on the links between the environment and the economy.
3.5Key outputs and applications
SEEA’s accounting data can be presented in a variety of ways. Most commonly, as for the national accounts, data are presented in the form of tables and aggregate indicators. Increasingly, especially for ecosystem accounting purposes, data are being compiled using earth observations and hence outputs in the form of maps are common. These outputs are of particular relevance in environmental assessments since commonly it is the location of the connection between economic activity and the environment which needs to be understood to allow for appropriate policy responses. Working from national averages may give some broad indications of the nature of changes but these may hide considerable variation that needs to be accommodated.
Data from SEEA accounts can support policy and decision making in a range of ways. These include:
• Identifying the environmental assets and flows of particular concern to policymakers
• Monitoring the status (extent and condition) of environmental assets
• Detailing the quantity, value and location (where possible) of various environmental flows including natural inputs, residuals and ecosystem services
• Monitoring the effectiveness of various policies
• Supporting the use of environmental data in standard economic and financial decision-making.
It is likely that the greatest benefit from the development of SEEA accounts will emerge when a reasonable time series of information is developed that shows patterns of change over time. This is not currently the case for most accounts in most countries. Nonetheless, structural information at a given point in time about the links between the environment and the economy remains important information to support discussion of both economic and environmental policy.
4.Progress and applications
4.1Introduction
The breadth of the SEEA set of accounts highlights the breadth of the connection between the environment and the economy and the reality that the economy is nested in the environment. Although the implementation of SEEA accounts does not have the breadth of coverage of countries and years as the SNA, there have been rapid advances in the course of the past decade and many examples of connections to policy and monitoring. This section highlights just some of these advances.
4.2Summary of SEEA uptake
With the adoption of the 2030 Agenda for Sustainable Development [30], countries increasingly recognize that economic growth is not enough to ensure well-being for their citizens. The Sustainable Development Goals clearly recognize the crucial importance of interconnectedness and integrated nature of the goals in ensuring that the purpose of the new Agenda is realized. This requires integrated policies that need to be supported by integrated information system. In this context, given the integrated nature of the approach has been increasingly recognized as an important framework to support the SDG.
Increasingly the SEEA EEA is being recognized as an important framework to measure biodiversity and its relationship with the economy. Regular communication is under way between the statistical community and the Intergovernmental Platform on Biodiversity and Ecosystem Services (IPBES) to ensure that the IPBES Value Assessment report currently under preparation and the SEEA EEA come out with consistent recommendations to countries.
More recently, the current discussions leading to the development of the Post 2020 Biodiversity Framework and the associated monitoring framework, have identified the SEEA as an important contribution of the statistical community to the derivation of indicators supporting biodiversity policies. A process is now under way, led by the Secretariat of the Convention on Biological Diversity, which requests that national statistical offices (i) contribute to the development of the monitoring framework, in light of the development of the SEEA EEA, and (ii) actively engage in the implementation of the framework. This is a great opportunity for the statistical community to be able to contribute to the development of such a framework from the start of the process.
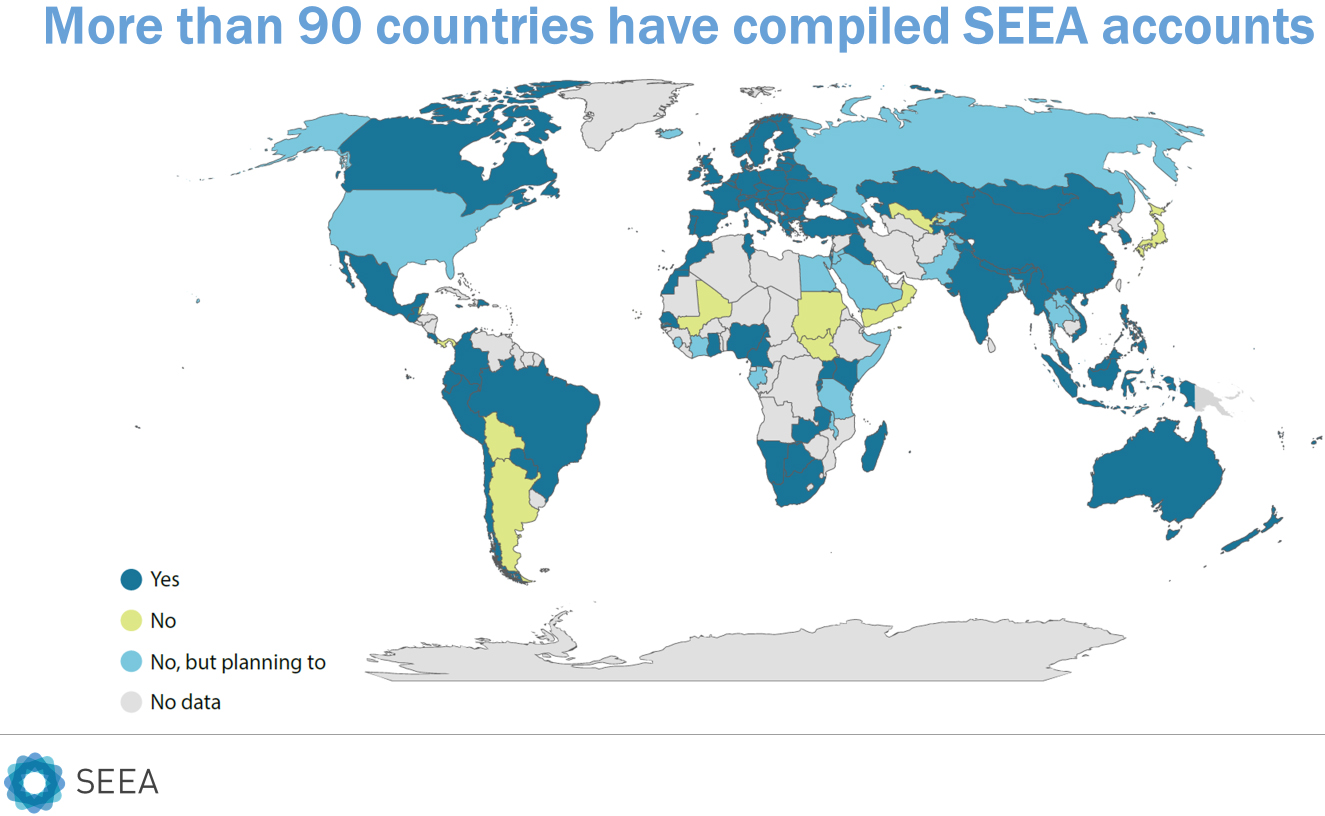
Upon the adoption of the SEEA Central Framework and the release of the SEEA EEA in 2013, an ambitious implementation strategy was adopted by the Statistical Commission. The strategy included two implementation targets: 100 countries implementing the SEEA Central Framework and 50 countries implementing the SEEA EEA. At that time, those targets seemed difficult to reach, however seven years later we are very close to reaching the targets. The uptake of the SEEA in countries has been phenomenal. According to the 2017 Assessment [29], sent to all National Statistical Offices, 69 countries had programmes on environmental-economic accounting. This corresponds to a 28 per cent increase in the number of countries with a programme on environmental accounting compared to the 2014 Global Assessment [31]. The percentage increase in the number of developing countries implementing the SEEA was even higher, with almost a 39 per cent increase between the 2014 and 2017 Assessments. In addition to the 69 countries with programmes, 22 countries indicated they were currently planning a programme on environmental-economic accounting. Almost all countries are planning to begin their programme and start compilation before 2020.
![Progress in SEEA implementation. Source: Based on data from [29, 31].](https://content.iospress.com:443/media/sji/2020/36-3/sji-36-3-sji200707/sji-36-sji200707-g003.jpg)
According to our estimation, currently about 92 countries are implementing the SEEA Central Framework. We obtained this figure through informal consultation with the United Nations Regional Commissions, international agencies, donor agencies, and SEEA experts.
Figure 4.
Current assessment of SEEA implementation. Source: Based on authors’ research.
The global assessment has been administered every 3 years and has served as a tool to monitor the progress of implementation of the SEEA. With the adoption of SDG indicator 15.9.1 (Number of countries implementing the SEEA), the Committee of Experts on Environmental Economic Accounting (UNCEEA) decided to run a detailed global assessment every three years providing a broad range of information on implementation, including its funding, stakeholder involvement, type of accounts compiled and periodicity, etc. and have a reduced format global assessment for the intervening years to support reporting on the SDG indicator.
The uptake of the SEEA EEA has been even more remarkable: from a zero base in 2013, by 2019 there were over 40 examples of ecosystem accounting programs with applications in, and participation from, all sectors – public, private, academia and civil society [32].
The United Kingdom and the Netherlands have published the most comprehensive ecosystem accounts to date. Both countries’ accounts include detailed maps and physical and monetary accounting tables showing a consistent application of concepts and methods. In other countries, progress is being made towards comprehensive SEEA EEA accounts. For instance, in South Africa national ecosystem accounts have been developed for the extent and condition of rivers [33]. Australia has published two national and several sub-national accounts. Other countries with published accounts include Canada, China, Costa Rica, Colombia, Indonesia, Italy, Japan, Norway, Mexico, the Philippines, Rwanda, Spain and the United States; and supranational accounts have been developed for the European Union.
As part of the EU funded project Natural Capital Accounting and Valuation of Ecosystem Services (NCAVES) project, Brazil, China, India, Mexico and South Africa are compiling ecosystem extent accounts, ecosystem condition accounts and selected ecosystem services in physical and monetary terms at the national as well as subnational level. The NCAVES project has been instrumental in establishing a programme on ecosystem accounts in these countries and in building capacity towards a long-term regular development of ecosystem accounts.
4.3Country examples
4.3.1Energy accounts in Costa Rica
The energy intensity of economic activities can be estimated by calculating the ratio between final energy use and value added.11 This indicates how many units of energy (joules) are required to generate a million units of output (in Costa Rican colones) and is therefore a measure of the energy efficiency of economic activities. Figure 5 shows, the energy intensity of the Costa Rican economy has decreased since 2011, though 2016 saw a slight increase of 0.5 per cent over the previous year [34]. Since 2013, the electricity and water supply sectors have become more efficient in their energy use, but agriculture has trended in the opposite direction. Because of the consistency between the environmental accounts and the national accounts, such trends can be further analysed by, for instance, undertaking a structural decomposition analysis to assess the drivers of change.
![Energy intensity of value added in Costa Rica. Source: [34].](https://content.iospress.com:443/media/sji/2020/36-3/sji-36-3-sji200707/sji-36-sji200707-g005.jpg)
4.3.2SEEA EEA in China
In China, the increasing recognition of the importance of maintaining ecosystems so as they can continue to provide ecosystem services has led to an ongoing effort to develop a monitoring framework to measure sustainability. Gross Ecosystem Product (GEP) is a methodological framework developed by the Chinese scientists [35] that aims to measure natural capital and the ecological contributions to the economy in monetary teams, with an objective to evaluate the effectiveness and progress of conservation effects and policy. GEP is being considered as a complement to GDP, providing a summary information on the performance on the environment. GEP is increasingly being accepted as a measure to evaluate the performance of government at the provincial level with respect to the environment. The work to date provides an illustration of the calculation of GEP in Qinghai Province, China, to show that the approach is feasible both across China and globally. The plan is to develop methodological guidelines for the compilation of GEP to be applied throughout China.
In parallel, as part of the NCAVES project, the National Bureau of Statistics (NBS) will develop guidelines on the implementation of the SEEA EEA in China based on the experience of Guangxi and Guizhou. Efforts are under way to align the two frameworks to support the implementation of the SEEA EEA throughout China and the derivation of GEP as an aggregate measure.
4.3.3Mexican extent accounts
The extent account, such as the one for Mexico shown in Fig. 6, describes the various types of ecosystems that are distinguished within an area and how they change over time. Countries have used different approaches to compiling ecosystem extent accounts taking data availability and policy demands into account, for example, using vegetation maps as the basis for the extent account; combining land cover maps with data on habitats/vegetation; and taking the types of land uses and ecosystem services supplied into consideration.
![Mexican Ecosystem extent accounts. Source: [36].](https://content.iospress.com:443/media/sji/2020/36-3/sji-36-3-sji200707/sji-36-sji200707-g006.jpg)
The example from Mexico [36] also shows a map (Fig. 7) of the distribution of various types of ecosystems. The table describes changes in the extent of ecosystems between 2002 and 2015. The potential for mapping data is a key feature of all ecosystem accounts.
![Mexico map of ecosystem extent. Source: [36].](https://content.iospress.com:443/media/sji/2020/36-3/sji-36-3-sji200707/sji-36-sji200707-g007.jpg)
4.3.4Managing peatlands in the Netherlands
Consisting of plant remains (about 10 per cent by weight of peat) and water (90 per cent), peatlands are considered to be one of the most challenging ecosystems on the planet to manage. Not only do their swampy conditions make access difficult, but their high water table prevents the cultivation of most crops. This means that drainage is essential in order to use them for agriculture or other extractive purposes. However, while drainage allows for agricultural activities on peatlands, it also exposes the organic matter in the soil to oxygen in the atmosphere. The oxidation of organic matter leads to CO
In the Netherlands [37], peatlands cover around 8 per cent of the land area and are mainly used for dairy farming. Among farmers, there is a tendency to prefer lower water tables which allows easier access to the meadows and favours the growth of grass. The resulting national CO
Unfortunately, there is no technical solution to the problem that allows farmers to drain the peatlands without producing significant externalities. Therefore, trade-offs in landscape management are unavoidable. Government intervention can reduce the externalities placed upon society, but at the expense of farmers’ income. Thus, decision making on the use of natural resources usually involves balancing diverging interests and considering social, environmental and economic dimensions of different options.
At the time the SEEA EEA accounts were published, a broad stakeholder engagement process had been started by the Netherlands government to discuss climate change targets and measures to be taken to reach these sectors. Peat management featured prominently in the discussion on how the agricultural sector could reduce GHG emissions. The Netherlands carbon account was published just prior to the start of these negotiations. The account showed clearly the contribution of peatlands to national CO
Figure 8.
Carbon account map for the Netherlands, showing carbon emissions from peatland drainage. Source: [37].
![Carbon account map for the Netherlands, showing carbon emissions from peatland drainage. Source: [37].](https://content.iospress.com:443/media/sji/2020/36-3/sji-36-3-sji200707/sji-36-sji200707-g008.jpg)
![Monetary Supply table of six ecosystem services for the EU territory. Source: [38].](https://content.iospress.com:443/media/sji/2020/36-3/sji-36-3-sji200707/sji-36-sji200707-g009.jpg)
4.3.5European Union ecosystem services accounts
Ecosystem service supply and use accounts record the supply of ecosystem services as well as their corresponding use and beneficiaries, classified by economic sectors used in the national accounts. Ecosystem services are defined in SEEA EEA as the contribution to benefits, rather than as the benefits themselves, in order to avoid double counting. For example, an agricultural crop such as corn or maize is already recorded in the national accounts. Moreover, corn is the product of combining human capital (in the form of labor), produced capital (machinery) and natural capital (the cropland). The objective of the services accounts is to isolate the contributions of nature to the production of the crop visible. In addition, by expanding the SNA production boundary, the accounts also recognize a range of ecosystem services that lead to benefits that are not currently recognized in the SNA such as global climate regulation and air filtration.
Work on measuring ecosystem services for the European Union (EU) [38] followed three main steps:
• First, a range of ecosystem services is spatially modelled resulting in maps showing where they are supplied
• Second, each individual service is valued (e.g. by multiplying the physical unit with a relevant unit price say as stumpage value for timber provisioning, social cost of carbon for carbon sequestration, or avoided damage costs for flood protection).
• Third, the maps of the individual modelled services (in physical and monetary terms) are overlayed (i.e. crossed) on the ecosystem extent map. The results are aggregated, showing in the form of a supply and use table which ecosystems provides what services, and how benefits from them.
The data in Fig. 9 shows, for example, that woodland and forests provide five of the six services that were modelled, while urban ecosystems provide three services. The figure also shows that woodland and forests provide the largest value on a per km
These data can also be shown in the form of maps as in Fig. 10.
Figure 10.
Examples of modelled ecosystem services for the EU (crops; timber; carbon sequestration). Source: [38].
![Examples of modelled ecosystem services for the EU (crops; timber; carbon sequestration). Source: [38].](https://content.iospress.com:443/media/sji/2020/36-3/sji-36-3-sji200707/sji-36-sji200707-g010.jpg)
Figure 11.
Estimation of the value of UK natural capital in 2007, 2011 and 2015 (£ billion, 2015 prices). Source: [39].
![Estimation of the value of UK natural capital in 2007, 2011 and 2015 (£ billion, 2015 prices). Source: [39].](https://content.iospress.com:443/media/sji/2020/36-3/sji-36-3-sji200707/sji-36-sji200707-g011.jpg)
Ecosystem service supply and use accounts are used for informing a range of policies. The accounts can be used for land use planning purposes as they allow assessment of trade-offs under alternative scenarios. These accounts have also been used to inform policy instruments such as eco-compensation standards, or Payment for Ecosystem Services schemes.
4.3.6UK Monetary asset account
The monetary asset account records the monetary value of opening and closing stocks of all ecosystem assets within an ecosystem accounting area and additions and reduction to those stocks. The ecosystem services supply accounts provide an estimate of the total annual flow that is generated during a specific year. The value of the ecosystem assets can be estimated by capitalizing these annual flows of services over the projected period, i.e. the expected lifetime of the ecosystem, using a net present value method. In order to estimate these project service flows, it is important to take into account the capacity of the ecosystems to sustain these service flows which will depend on their condition and the extent to which these ecosystems are sustainably managed, and if not, make corrections to future service flows.
Figure 11 presents partial UK natural capital asset value estimates for 2007, 2011 and 2015 by ecosystem service [39]. Although the asset valuation for oil and gas fell by almost a quarter between 2011 and 2015, this was offset by increases in other services particularly renewable energy and agricultural biomass. This is a partial value of the assets as many ecosystem services provided by environmental assets in the UK are not yet estimated and there will be some aspects of the value of natural capital than cannot be reflected in monetary terms.
The valuation of natural capital is important as it allows estimation of the degradation cost of natural capital due to human activity. The valuation of natural capital also allows more comprehensive assessments of the wealth of a country (i.e. in addition to produced, human and social capital). Indicators such as wealth per capita, and how this is changing over time provide an indication of whether economic activities are sustainable over time. Development and publication of wealth based approaches have been led by the World Bank and UN Environment [16, 17].
4.4Connections to international policy and reporting
The SEEA EEA describes a relatively comprehensive set of data, with its broad coverage of organizing information on ecosystems of all types considering changes in extent and condition, on flows of ecosystem services in physical and monetary terms, and on the value of ecosystem assets and their degradation. Given its intention to support comparable measurement in these areas over time and across countries, the SEEA can provide a robust framework to support a range of global environmental and sustainability initiatives. Examples include:
• Monitoring of the Sustainable Development Goals, in particular progress towards Goals 6, 11, 12, 13, 14 and 15. The United Nations Commission of Experts on Environmental-Economic Accounting (UNCEEA) has spent considerable effort to align the SEEA framework with the SDGs and currently 40 indicators for nine Sustainable Development Goals can be evaluated using SEEA data. Indicator 15.9.1 and indicator 12.b.1 are directly linked to the SEEA as the first represents number of countries implementing the SEEA and the second is number of selected accounting tables compiled by countries
• The post 2020 Biodiversity Agenda of the Convention on Biological Diversity [40]. The monitoring framework associated with the agenda is currently being developed and both the SEEA Central Framework and SEEA EEA will inform a number of indicators. The statistical community has formally been asked by the Convention on Biodiversity to contribute to the process of developing such a framework and subsequent implementation.
• The development of wealth accounting encompassing measures of the value of natural capital (Changes in Wealth of Nations of World Bank, Inclusive Wealth Index of UNEP) [16, 17].
• Supporting the Land Degradation Neutrality policy under the UN Convention to Combat Desertification (UNCCD) and in particular the SDG indicator 15.3.1 on proportion of land that is degraded over total land area
• The regional and global assessments of the Intergovernmental Science-Policy Platform on Biodiversity and Ecosystem Services (IPBES) and in particular the value assessment report that is currently being developed with IPBES in parallel with the revision of the SEEA EEA
• Supporting the measurement of biodiversity and ecosystem services for The Economics of Ecosystems and Biodiversity (TEEB) [41]. In particular, the physical and monetary accounts being developed by the SEEA serve as useful input in the estimation of the values for ecosystems and biodiversity which are the focus of TEEB.
• SEEA accounts can be used to inform a wide range of climate change related policy questions related to climate mitigation and adaptation strategies. In particular the air emission accounts provide information on the emissions by economic activities. The carbon accounts provide information of the carbon stored and sequestered by ecosystem types. The monetary accounts provide useful information on expenditures that can be related to climate change as well as environmental taxes and subsidies.
![Indonesian GDP growth trajectories for various scenarios (per cent). Source: [45].](https://content.iospress.com:443/media/sji/2020/36-3/sji-36-3-sji200707/sji-36-sji200707-g012.jpg)
Of particular note, is that the SEEA is well-positioned to support the post-2020 biodiversity framework emerging from the 2020 Convention of Biological Diversity Conference of Parties meeting. The information generated by the SEEA can be used to develop indicators for monitoring progress toward the pact’s goals. An assessment report from the UN Environment World Conservation Monitoring Centre and United Nations Statistics Division shows that 61 of the current Aichi Target indicators are fully or partially aligned with the SEEA [42] and the UNCEEA has identified at least seven targets that currently lack indicators for which the SEEA could provide needed information.
The SEEA can provide valuable information for countries, helping to both prioritize conservation efforts and assess implementation at the national level. Its integrated systems approach can clarify the major drivers of biodiversity loss and ecosystem changes, identify key trade-offs, and support the development of “win-win” conservation approaches. Ecosystem accounts used in combination with information on expenditures also can provide decision-makers with a clear picture of the return-on-investment from biodiversity protection. The SEEA also can be used to measure level of effort through tracking expenditures on conservation efforts in both the public and private sectors.
4.5Connections to corporate developments
Work on the development of the SEEA has been largely driven from the perspective of national governments and providing official statistics on the nature of the aggregate level linkages between the economy and the environment. However, as the spatial approach to measurement becomes more the reality and considering location becomes common practice, it is clear that sub-national and community level considerations need to be encompassed. Through ecosystem accounting, work on the SEEA has been connected to work at the corporate level concerning business dependencies and impacts on the environment.
Of particular note are links that have been made between the SEEA and the Natural Capital Protocol and to various natural capital accounting approaches that have developed in the corporate sector, including environmental profit and loss approaches and the corporate natural capital accounting approach. Further, there are now examples of the application of the SEEA at corporate level that provide a basis for further discussion (see, for example [43]).
Recent engagement with the business community around the SEEA,22 has shown the potential for the business community to work with the official statistics community to enrich the information set and hence underpin the joint management of the environment as a shared resource.
4.6Analytical possibilities and other extensions
Over the past decade the interest in integrating environmental factors into economic models has grown. It is increasingly recognised that SEEA accounts can provide the robust and authoritative framing for environmental data for integration into standard economic models. For example, building on long established techniques of environmental-economic modelling (for a summary of work in this area see SEEA Applications and Extensions), the Inter-American Development Bank has been developing an Integrated Environmental-Economic Model (IEEM) to support project assessment in Latin America and the Caribbean [44].
Further, the potential of the SEEA to support analysis has been demonstrated in Indonesia in the development of scenario analysis. The Ministry of National Development Planning in Indonesia, in collaboration with the World Bank and other development partners, recently introduced the Low Carbon Development Initiative into the country’s National Medium-Term Development Plan 2020–2025 [45]. To facilitate a better understanding of the feasibility of low-carbon growth, scenario modelling was conducted using environmental accounting approaches based on the SEEA. This included the use of land cover accounts, land extent accounts and peat accounts developed at the national and provincial levels. These accounts, coupled with the incorporation of an energy and water balance in the model, allowed for the estimation of the impact of natural resource availability and ecosystem service provisioning on economic productivity – and hence on forecasts for GDP growth and other macroeconomic performance indicators. Figure 12 illustrates that GDP growth increases with the extent of ambition of policy measures introduced in support of low-carbon development.
Finally, in the context of the SDGs there is renewed interest in multiple capital based approaches to considering development and hence the field of wealth accounting is gaining higher profile. The SEEA is seen as the statistical standard that can support measurement of the natural capital component within wealth accounts and hence support analysis of changes in wealth and links to development outcomes. In a multiple capital context, SEEA is also being used to support the TEEB Agriculture and Food evaluation framework [46] and the UN World Tourism Organization project on measuring the sustainability of tourism [28].
5.Conclusion
5.1Challenges and opportunities for NSOs
Through the developments in the SEEA over the past decade a clear role for official statistics has emerged in support of improved discussion of the links between the environment and the economy, and of sustainability more widely. In most countries SEEA accounts cannot be compiled solely by the National Statistical Office (NSO) since often environmental data are collated in other agencies. Nonetheless, it should be recognised that:
• As organizations that work with various large data sets, NSOs are well placed to contribute their expertise to the collection and organization of data from a range of different sources.
• As a core function of NSOs is to establish and maintain consistent definitions, concepts and classifications, the involvement of NSOs in this area of work would be beneficial.
• NSOs have the capability to integrate data from various sources so as to construct coherent illustrations of relevant issues and themes. Most commonly, NSOs focus on constructing coherent pictures based on socioeconomic information but this can be extended to encompass environmental information.
• NSOs work within broad national and international frameworks of data quality that enable a consistent and complete assessment and accreditation of various information sources and the associated methodologies.
• With their national coverage, NSOs play a relatively unique role in creating a picture of socioeconomic conditions at national level. SEEA implementation will benefit substantially from consideration of how standard statistical techniques for scaling information to national level may be applied to environmental data, particularly with respect to geospatial statistics.
• The voice of NSOs can be an authoritative one by virtue of their application of standard measurement approaches and data quality frameworks and their unique role within government.
Notwithstanding the potential for NSOs to contribute to the discussion of sustainability through the SEEA, there remain a range of challenges in compiling these accounts. Some of these challenges concern the availability and coherence of environmental data which, as noted, will commonly be held in multiple agencies using a range of classifications and definitions. The related and potentially larger challenge is working across multiple agencies and securing appropriate arrangements for the exchange and publication of data. While these are undoubtedly large challenges, they are ones that NSO have commonly confronted in the development of economic and social statistics. What is therefore required then is establishing a clear demand for SEEA accounts that in turn can secure the appropriate level of resourcing to maintain and build an ongoing program of work. By way of example, establishing a clear demand for accounts would help to support the development of a national spatial data infrastructure wherein the wide variety of spatial data can be appropriate referenced and stored.
5.2Motivating the way forward
The 51st session of the United Nations Statistical Commission (UNSC) in March 2020 gave the United Nations Committee of Experts on Environmental-Economic Accounting (UNCEEA) an opportunity to present the progress made over the past year. The UNSC recognised the importance of the SEEA in supplying a common measurement framework for the post-2020 global biodiversity framework and the work done on mainstreaming the SEEA as the statistical framework to support various initiatives, including the use of SEEA for country-level reporting on the SDGs.
UNSC also recognised the significance of the revision of the manual on ecosystem accounting that is due to be completed in March 2021. It “emphasized the urgency of providing a standardized methodology for ecosystem accounting that reflects the revision and reinforces the role of national statistical offices as data stewards; and supported the aspiration to elevate the revised SEEA Experimental Ecosystem Accounting to SEEA Ecosystem Accounting”.33 The endorsement for the developments in the SEEA was also evident in the UNCEEA’s High Level Panel held in parallel with the UNSC meeting.
Advances in the SEEA have also highlighted the relevance of improvements in accounting for natural capital in advancing economic statistics. One of the key areas for consideration in the revision of the SNA2008 that has just commenced is the measurement of sustainability and well-being. The developments in the SEEA, especially concerning ecosystem assets and their associated benefit streams, will be of direct relevance in this process.
While there are some excellent advances to be recognized, it is also clear that the biodiverse, healthy ecosystems which provide essential contributions to people remain under significant pressure. And it remains the case that the contributions provided by our natural capital are usually taken for granted when making important economic decisions. Tragically, it is often the poorest and most vulnerable populations that are most directly dependent on the benefits of biodiversity and healthy ecosystems for their daily needs. We can no longer afford to ignore our dependence on the environment, our natural capital. Accounting for it is part of the pathway forward.
Notes
1 The value added series used corresponds to the volume at prices of the previous year chained, year of reference 2012.
Acknowledgments
We would like to thank the editorial team of this special issue of the IAOS Journal. We also acknowledge the valuable contributions provided, directly or indirectly, by colleagues from the expanding SEEA community around the world.
References
[1] | Meadows DH, Meadows DL, Randers J, Behrens WW, III, ((1972) ) The Limits to Growth, New York, Universe Books. |
[2] | MA ((2005) )Millennium Ecosystem Assessment, Ecosystems and human well-being: A framework for assessment Summary, Island Press, Washington DC |
[3] | Rockström J, Steffen W, Noone K, Persson A, Chapin FS, Lambin EF et al. A safe operating space for humanity. Nature. (2009) ; 461: (7263): 472-475. |
[4] | Kennedy RF. Remarks at the University of Kansas, 18 March (1968) . |
[5] | Costanza R, Hart M, Posner S, Talberth J. Beyond GDP: The need for new measures of progress, (2009) . |
[6] | Stiglitz J, Sen A, Fitoussi JP. Measuring our lives: Why GDP doesn’t add up, The New Press, New York, (2010) . |
[7] | European Commission, International Monetary Fund, Organisation for Economic Co-operation and Development, United Nations and World Bank (2009), System of National Accounts 2008, United Nations, New York. |
[8] | United Nations Development Program ((2014) )Human Development Report 2014, UNDP, New York |
[9] | Cobb C, Halstead T, Rowe J. If the GDP is up, why is America down? The Atlantic Monthly. (1995) ; 276: : 59-78. |
[10] | Nordhaus WD, Tobin J. Is Growth Obsolete? Studies in Income and Wealth. (1973) ; 38: : 509-564. |
[11] | Obst C. Reflections on natural capital accounting at the national level: Advances in the System of Environmental-Economic Accounting. Sustainability Accounting, Management and Policy Journal. (2015) ; 6: (3): 315-339. |
[12] | Pearce D, Atkinson G. Capital theory and the measurement of sustainable development: An indicator of weak sustainability. Ecological Economics. (1993) ; 8: (2): 103-108. |
[13] | Asheim GB, Weitzman ML. Does NNP growth indicate welfare improvement. Economic Letters. (2001) ; 73: (2): 233-239. |
[14] | Dasgupta P. The welfare economic theory of green national accounts. Environmental and Resource Economics. (2009) ; 42: (1): 3-38. |
[15] | Fenichel E, Abbot J. Natural Capital: From Metaphor to Measurement. Journal of the Association of Environmental and Resource Economists. (2014) ; 1, Number 1/2. |
[16] | World Bank (2018), The Changing Wealth of Nations 2018: Building a Sustainable Future, The World Bank, Washington DC. |
[17] | Managi S, Kumar P. eds, Inclusive Wealth Report 2018: Measuring Progress Towards Sustainability, Taylor and Francis, UN Environment, Urban Institute, (2018) . doi: 10.4324/9781351002080. |
[18] | Bartelmus P. Beyond GDP – New approaches to applied statistics. Review of Income and Wealth. (1987) ; 33: (4): 347-358. |
[19] | Ahmad Y, El Serafy S, Lutz E eds, Environmental Accounting for Sustainable Development, The World Bank, Washington DC, (1989) . |
[20] | United Nations (1993), Report of the United Nations Conference on Environment and Development, Rio de Janeiro, 3–14 June 1992, vol. I, Resolutions Adopted by the Conference, Sales No. E.93.I.8 and corrigendum. Resolution I, annex II (Agenda 21), United Nations, New York. |
[21] | United Nations (1993), Handbook of National Accounting: Integrated Environmental and Economic Accounting, Interim version, Studies in Methods, Series F. No. 61, Sales No. E.93.XVII.12, United Nations, New York. |
[22] | European Commission, International Monetary Fund, Organisation for Economic Co-operation and Development, United Nations and World Bank (2003), Handbook of National Accounting: : Integrated Environmental and Economic Accounting 2003, Studies in Methods, Series F, No 61 Rev 1, white cover edition. |
[23] | United Nations, European Union, Food and Agriculture Organization of the United Nations, International Monetary Fund, Organisation for Economic Co-operation and Development and The World Bank (2014), System of Environmental-Economic Accounting 2012 – Central Framework, United Nations, New York. |
[24] | United Nations, European Commission, Food and Agriculture Organization of the United Nations, Organisation of Economic Co-operation and Development and World Bank (2014), System of Environmental-Economic Accounting 2012 – Experimental Ecosystem Accounting, United Nations, New York. |
[25] | United Nations (2012), System of Environmental-Economic Accounting for Water: SEEA-Water Statistical Papers, Series F, No. 100, Sales No. E11.XVII.12, United Nations, New York. |
[26] | United Nations (2019), System of Environmental-Economic Accounting for Energy: SEEA- Energy, Statistical Papers, Series F, No. 116, Sales No. E17.XVII.12, United Nations, New York. |
[27] | Food and Agriculture Organization of the United Nations and United Nations (2020), System of Environmental-Economic Accounting for Agriculture, Forestry and Fisheries: SEEA-AFF, Rome. doi: 10.4060/ca7735en. |
[28] | United Nations World Tourism Organization (2018), Linking the TSA and the SEEA: A Technical Note. Document submitted to the 13 |
[29] | UN Committee of Experts on Environmental-Economic Accounting ((2018) )Global Assessment of Environmental-Economic Accounting and Supporting Statistics 2017, Document submitted to the 49 th session of the UN Statistical Commission, New York, March 2018 https//seea.un.org/sites/seea. un.org/files/2017_global_assessment_of_environmental-economic_accounting_v6_0.pdf |
[30] | United Nations ((2015) )Transforming Our World: The 2030 Agenda for Sustainable Development, United Nations, New York http//wedocs.unep.org/bitstream/handle/20.500.11822/ 11125/unep_swio_sm1_inf7_sdg.pdf?sequence=1 |
[31] | UN Committee of Experts on Environmental-Economic Accounting ((2015) )Global Assessment of Environmental-Economic Accounting and Supporting Statistics 2014, Document submitted to the 10 th UNCEEA meeting, New York, 2015 https//seea.un.org/sites/seea.un.org/files/global_ assessment_of_environmental-economic_accounting.pdf |
[32] | Hein L. et al, Progress in natural capital accounting for ecosystems. Science. 31 January (2020) ; 367: (6477): 514-515. |
[33] | Nel JL, Driver A. National River Ecosystem Accounts for South Africa, Discussion document for advancing SEEA Experimental Ecosystem Accounting Project, October 2015, South African National Biodiversity Institute, Pretoria http://wwwstatssa.gov.za/wp-content/uploads/2016/08/National-River-Ecosystem-Accounts-Discussion-Document-FINAL.pdf. (2015) . |
[34] | Banco Central de Costa Rica(2019), Energy accounts 2011–2016, https//activos.bccr.fi.cr/sitios/bccr/cuentasambientales/DocCuentaEnergia/Cuenta-energia-emisiones-2011-2016.pdf. |
[35] | Ouyang Z, Song C, Zheng H, Polasky S, Xiao Y, Bateman IJ, Liu J, Ruckelshaus M, Shi F, Xiao Y, Xu W, Zou Z, Daily GC. Using gross ecosystem product (GEP) to value nature in decision making, PNAS, 23 June 2020; 117: (25): 14593-14601, doi: 10.1073/pnas1911439117. |
[36] | INEGI ((2019) )NCAVES in Mexico: Technical Report on Ecosystem Accounting https//seea, un.org/sites/seea.un.org/ files/documents/Forum_2018/s13_mexico.pdf |
[37] | Statistics Netherlands and Wageningen University and Research ((2017) )The SEEA EEA carbon account for the Netherlands, The Hague. https//www.cbs.nl/en-gb/background/2017/ 45/the-seea-eea-carbon-account-for-the-netherlands |
[38] | Vallecillo S, La Notte A, Kakoulaki G, Roberts N, Kamberaj J, Dottori F, Feyen L, Rega C, Maes J. Ecosystem services accounting. Part II-Pilot accounts for crop and timber provision, global climate regulation and flood control, EUR 29731 EN, Publications Office of the European Union, Luxembourg, ISBN 978-92-76-02905-2 (online), doi: 10.2760/631588. (online), JRC116334, 2019. |
[39] | UK Office for National Statistics ((2018) )UK natural capital: Ecosystem service accounts, 1997 to 2015, Statistical Bulletin, UK. https//www.ons.gov.uk/economy/environmentalaccounts/ bulletins/uknaturalcapital/ecosystemserviceaccounts1997to 2015 |
[40] | Convention on Biological Diversity ((2020) )Zero Draft of the Post-2020 Global Biodiversity Framework, Note by the co-chairs to the Open-Ended working group on the Post-2020 Global Biodiversity Framework, Kunming, Feb 2020. https//www.cbd.int/doc/c/efb0/1f84/a892b98d2982a82 9962b6371/wg2020-02-03-en.pdf |
[41] | TEEB (2010), The Economics of Ecosystems and Biodiversity, Mainstreaming the economics of nature, A synthesis of the approach, conclusions and recommendations of TEEB. Retrieved from wwwteeb.org. |
[42] | UNCEEA (2018), The Role of the System of Environmental-Economic Accounting as a Measurement Framework in Support of the post-2020 Agenda, Paper presented to the Expert meeting on SEEA indicators for the SDGs and Post-2020 Agenda, Cambridge, Feb 2019 https//seea.un.org/sites/seea.un.org/files/seea_as_a_measurement_framework_in_support_of_the_post-2020_agenda_1.pdf. |
[43] | Ogilvy S, Vail M. Standards-compliant accounting valuations of ecosystems, Sustainability Accounting, Management and Policy Journal. (2018) ; 9: (2): 98-117. |
[44] | Bannerjee O, Cicowiez M, Horridge M, Vargas R. Evaluating synergies and trade-offs in achieving the SDGs of zero hunger and clear water and sanitation: An application of the IEEM Platform to Guatemala. Ecological Economics. (2018) ; 161 July 2019, 280-291. |
[45] | Bappenas ((2019) )Low Carbon Development: A Paradigm Shift Towards a Green Economy in Indonesia, Jakarta. https//www. bappenas.go.id/id/berita-dan-siaran-pers/pembangunan-rendah-karbon-pergeseranparadigma-menuju-ekonomi-hijau-di-indonesia/ |
[46] | The Economics of Ecosystems and Biodiversity (TEEB) (2018). TEEB for Agriculture & Food: Scientific and Economic Foundations. Geneva: UN Environment. |


