
Towards distributional national and environmental accounts
Abstract
Inequality and environmental changes are among of the most pressing policy challenges of our century and yet national accounting still largely fails to adequately measure these issues. This paper presents current efforts to distribute National Income and National Wealth in a way that is fully consistent with the National Accounts framework. It also discusses options to extend distributional accounting to the domain of environmental accounts.
1.Introduction
There has been a recent surge in the interest for the distribution of income and wealth throughout the world, illustrated by the number of international organizations’ publications on inequality or the large debate around books on the topic [16, 21] (OECD, 2008). However, economic inequality statistics remain particularly scarce.
While Simon Kuznets, one of the inspirators of modern national accounts, is also known to have distributed income growth over relatively long time spans [18], the System of National Accounts (SNA) was historically built on aggregate concepts and has left distributional issues aside. More than seventy years after the Stone report (1947) which led to the creation of the UN SNA (1953) and despite several revisions of the SNA, distributional issues remain largely outside of the scope of international and national systems of economic accounting. National and international statistical organizations do produce inequality statistics, which have proven very useful for policy analysis and economic debates. However, these statistics suffer serious limitations, largely because they are not fully consistent with the national accounts framework.
Official inequality data published by statistical institutions essentially rely on household surveys, which provide a rich source of socioeconomic data on individuals’ standard of living, informing on the various faces of socioeconomic inequalities [3]. However, surveys have well-known limitations when it comes to measuring inequality, particularly at the top end of the distribution [5, 6]. Surveys tend to misreport income and wealth levels at the top of the distribution.11 In addition, income and wealth levels reported in household surveys generally do not add-up to National Account aggregates and to macroeconomic growth estimates. Changes in household survey concepts methodologies also make it particularly challenging to compare inequality levels across countries and over time, especially in the long run [27].22
In Europe, where high quality tax and national accounts data is available, Blanchet, Chancel and Gethin (2019) find that annual pretax incomes of the top 1% of Europeans recorded in household surveys are about €220 000, 60% below their value of €340 000 meaured using tax data and national accounts. Official survey data therefore tends to underestimate actual inequality levels and may fail to accurately inform on inequality trends. In the US, according to the Current Population Survey, the top 5% pretax income share rose by about a third between 1980 and 2014. Mobilizing tax data, national accounts and household surveys, Piketty, Saez and Zucman (2018) find that the top 5% income share rose by more than 50% over the period.33
Administrative tax data provides better estimates at the top of the distribution. The use of tax data to track income and wealth dynamics builds on the pioneering work of Kuznets [18] and Atkinson and Harrison [7], who mobilized tax tabulations to monitor income and wealth dynamics at the top of the distribution. The 2000s witnessed a renewed interest in this methodology, with historical series produced for several high-income countries, starting with the US and France [20, 22, 6]. Thanks to the contributions of dozens of researchers located all over the world and collaborating with the World Top Incomes Database, top income shares series were produced for 70 countries and contributed to the flourishing global debate on inequality trends.
However, top income shares based on fiscal data also has key limitations. First, comparability between time periods and countries may be an issue because of changes and differences in national tax legislations. The very definition of fiscal income often changes from one tax code to another and does not include all incomes reported in the national accounts. In the US for instance, about two thirds of capital incomes recorded in national income are currently absent excluded from the concept of fiscal income recorded by administrative tax data [23]. These missing income sources (which include imputed rents, undistributed profits and income paid to pensions and insurance) gained importance over the past two decades in the US and many rich countries and the question of their contribution to inequality cannot be overlooked. Second, tax data also has a relatively por coverage of income at the very bottom of the distribution. Third, tax data is known to suffer from evasion practices – at varying degree across nations depending on norms, political systems and tax policies. In Russia for instance, the top 0.01% wealth share recorded without tax evasion is 5%, but it turns out to be high than 12% when evaded offshore asserts are (at least partly) taken into account. In the UK, the figure rises from less than 3% to 4.5%, in France from 3.5% to 5.5% [2].
2.The distributional national accounts project
The DINA methodology [4], seeks to distribute the totality of national income and wealth in a coherent conceptual framework (ie. the national accounts) to address the limitations of existing inequality data sources. The production of DINA estimates is based on the systematic combination of tax, survey and national accounts – and to the extent possible of tax evasion data [31] in a transparent manner. Distributional estimates are produced for 127 generalized-percentiles (i.e. 99 percentiles and a top 1% itself decomposed into groups of 0.1%, the top 0.1% decomposed into fractiles of 0.01% up to the top 0.001%). This allows for anybody to reconstruct their preferred inequality statistics (whether quantile share ratios, Gini indexes, Atkinson indexes, etc.).
In terms of concepts of analysis, the DINA approaches places particular importance on the distribution of the totality of national income before taxes and after taxes in order to ensure full consistency in the analysis of tax and redistribution. This constraint means that components of national income such as undistributed profits (or the primary income of corporations), which are often not distributed to individuals or households in inequality analysis, must be allocated to individuals. Such imputations may be challenging but in the context of important (several percentage points of GDP) and often rising undistributed profits, not distributing them to individuals in itself implies certain heroic assumptions on how such income growth is spread over the population. Indeed, in situation of high or extreme distributional data opacity, several methodological and imputation choices must be made in order to do so [4, 8] (for a discussion on these matters). In the context of the DINA project, these are done in a fully transparent way as all the sets of codes, methodological notes, and assumptions are visible online at WID.world, allowing for any research or statistician willing to produce alternative distributional estimates, based on novel data releases for instance, to do so. While the production of aggregate statistics such as Gross Domestic Product or National Income also triggers controversies among experts, it is not always easy to find the necessary material to reproduce existing aggregate statistics in order to contribute to improve them.
Figure 1.
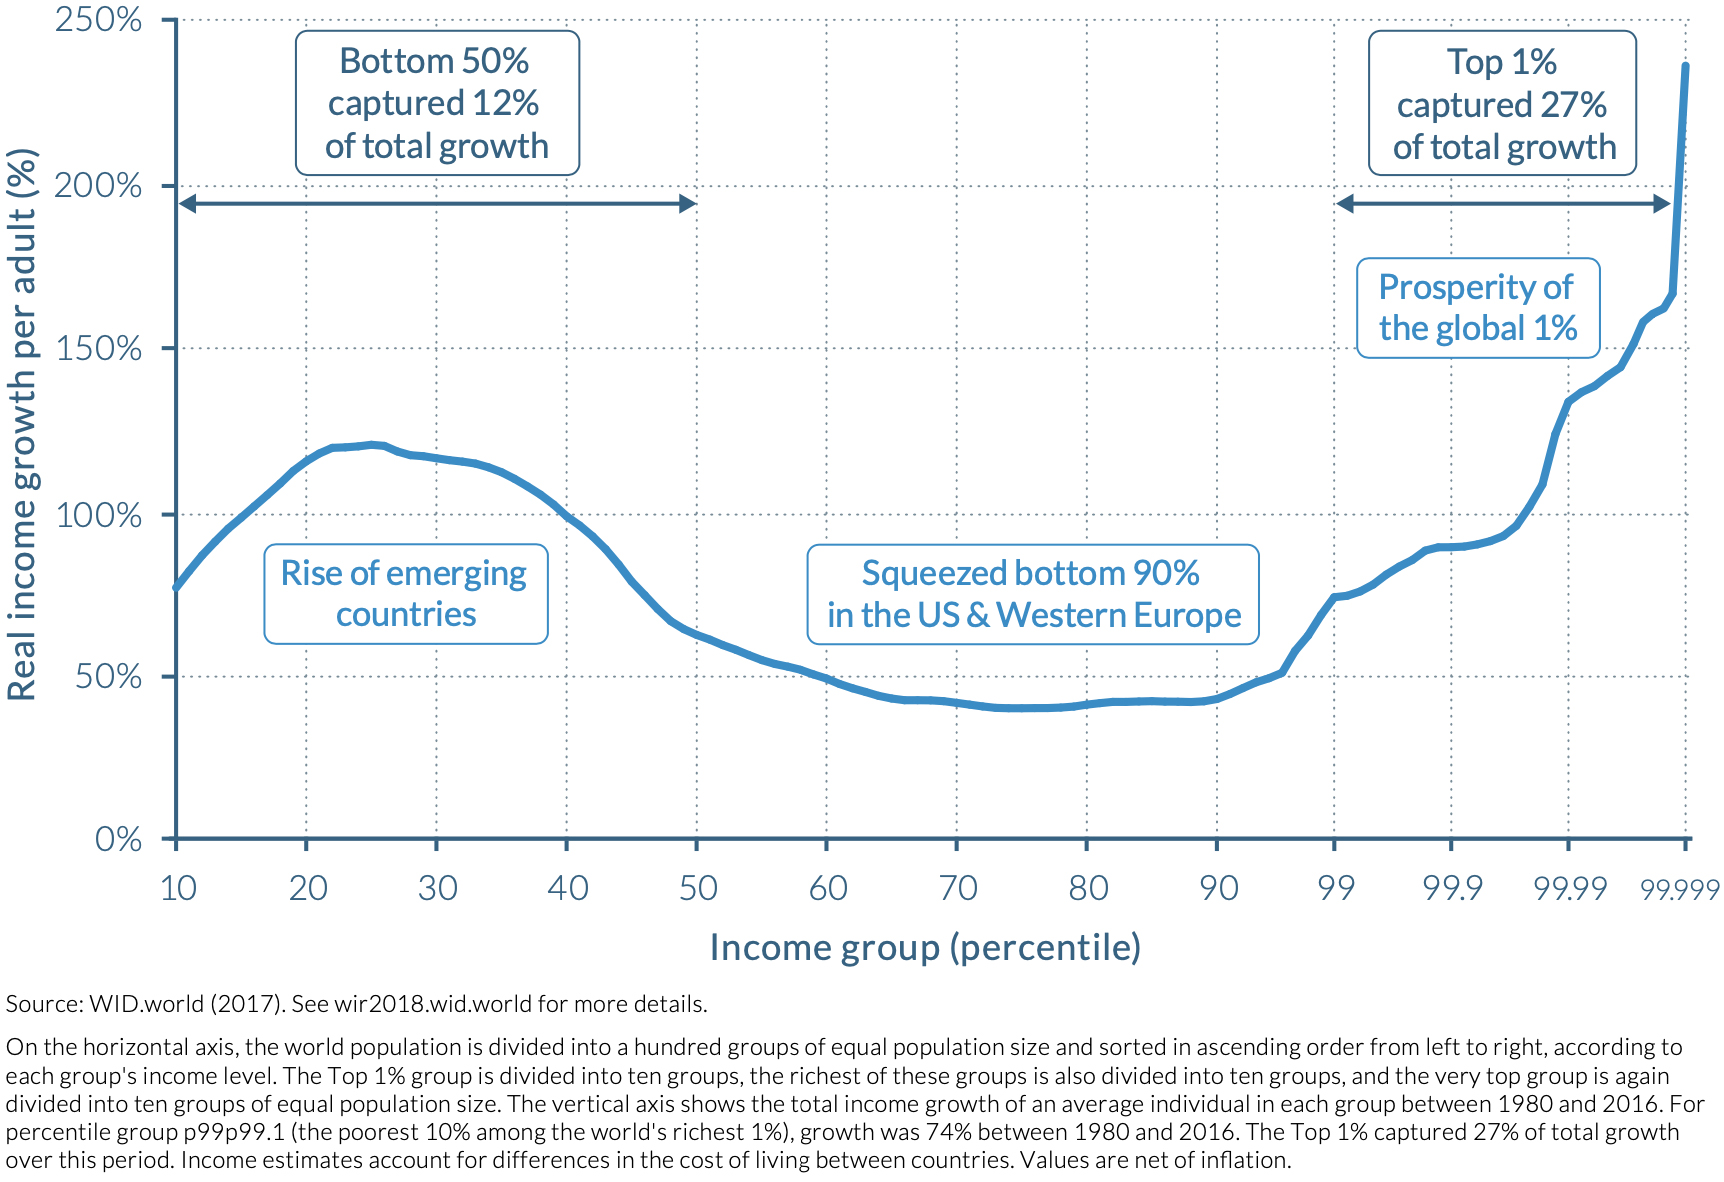
Total income growth by percentile, world, 1980–2016.
This DINA methodology has been applied to more than a hundred countries at this stage, whether high-income [23, 14, 8] (for high-income countries) or emerging countries [24, 3].44 This data is open-source on the World Inequality Database (wid.world). When available data allowed it, Distributional income and wealth aggregate were also produced for age or gender groups. Further work is being carried out to integrate other dimensions of inequality in the World Inequality Database, such as race, occupation, geographical location, or the environment (as we discuss below). The overarching objective of such endeavors is driven by the DINA project: publish micro statistics on inequality fully consistent with macroeconomic estimates.
The production of country-level income distributional estimates made it possible to release a first version of integrated aggregate and distributional global income statistics, consistent with the national accounts framework. The World Inequality Report 2018 was a first step in this direction [3]. Figure 1, using data produced in the context of the Report, shows pretax national income growth of each global percentile (with more granularity within the top 1%) at the global level, between 1980 and 2016. It builds on the work of Lakner and Milanovic [19], with two notable differences. The first is that the figures are consistent with national accounts estimates within each country – and at the world level. The second is the level of detail at the top of the distribution, which is possible thanks to the use of administrative tax data. While it may be argued that a focus on groups representing such a small share of the population (i.e. 0.1% or 0.01% population share) may not be a top priority for the development of public statistics, such granularity actually seems particularly important given the share of growth actually captured by these groups. Indeed, the global top 1% captured 27% of total growth over the 1980–2016 period, while the bottom 50% captured 12% of global growth. The distribution of growth is even more skewed in the context of wealth accounts. The top 20% wealth share in 2010–2018 varies between 70% (France), 87% (USA) and 99% (South Africa) for instance according to WID.world (2020). In such cases, standard approaches focusing on income and wealth quintiles is of limited use for distributional analysis and it is particularly important to develop granual approaches.
Despite recent progress in inequality measurement made by researchers contributing to the DINA project as well as among other groups (such as the Luxembourg Income Study, the Commitment for Equity Institute, the World Bank, OECD or among national statistical agencies), inequality data remains particularly scarce. In certain countries (such as in Sweden, for instance), household surveys are matched with administrative tax registers, making it possible to track inequality from the bottom to the top of the distribution with a relatively high level of precision. This situation however remains the exception rather than the norm in the world of official inequality statistics.55 The revision of the system of national accounts, expected in the years to come and currently being discussed under the auspices of the UN Statistical Commission and at the OECD, is expected to incorporate new guidelines to distribute income, consumption and savings, in line with the recommendations of the Stiglitz, Sen Fitoussi Commission (2009). This could accelerate the standardization of methods reconciling microeconomic and macroeconomic datasets.
3.The INSEE working group on Distributional Accounting
In to move forward towards the production of standardized distributional income and wealth estimates, the French National Institute of Statistics and Economic Studies (INSEE), organized, in partnership with the World Inequality Lab and other academic actors publishing inequality data in France, a working group on Distributional Accounting [15]. This group is particularly interesting as it is, to our knowledge, the first one seeking, at the national level and in a multi-stakeholder, to produce recommendations and guidelines for the production of distributional national accounts.
The group also sought to better understand potential conceptual and methodological differences underlying inequality statistics published in France by the academia and INSEE. This group was established as a useful complement to current initiatives carried out at the OECD (the Expert Group on Distributional National Accounts working group and the Inter Secretariat Working Group on National Accounts) and at Eurostat.
The working group, led by Jean-Marc Germain (from INSEE), with a steering committee also composed of Mathias André (INSEE), Thomas Blanchet (World Inequality Lab, Paris School of Economics) and Lucas Chancel (World Inequality Lab, Paris School of Economics), produced a report laying out recommendations for the production of distributional national accounts.66 It proceeded in several steps which we briefly sketch out below.
First, the working group reviewed existing inequality publications and databases for France (including analyses produced by INSEE, others by the World Inequality Lab or the Institute for Public Policies as well as other research groups, which participated in the collaborative process) and identified potential discrepancies between these databases. Among the reasons explaining apparent discrepancies, the group identified the use of different income concepts in different studies, sometimes blurring comparisons (e.g. pretax income vs. factor income vs. disposable income etc.), different units of analysis (household, per capita, equal split) or differences in housing units (inclusion or not of students living in collective residences for eg.), different geographical scopes (Metropolitan France vs. France) and finally different methods to impute income, taxes and transfers to individuals in context where micro datasets are missing, or only inform on certain sources of income.
Based on this preliminary work, the group proceeded to discuss the various methodological issues associated to the distribution of the totality of national income before and after taxes to individuals and households, each field expert presenting on these issues (among them: the distribution of production taxes, educational and health transfers, or collective consumption expenditures, or methods to combine administrative tax data with household surveys). The objective of the group, rather than making all actors agree on a single way to analyze inequality and redistribution, was to develop a common framework and design a common language to be used all these actors. This was achieved via the construction of a distributional accounts table which we now describe.
Table 1
Distributional accounts, France (% national income)
| All | D1 | D2 | D3 | D4 | D5 | D6 | D7 | D8 | D9 | D10 | P100 | M1000 | |
|---|---|---|---|---|---|---|---|---|---|---|---|---|---|
| 1. BTI: Before Transfer Income | 100.0 | 2.1 | 3.7 | 4.9 | 6.0 | 7.4 | 8.6 | 10.0 | 11.9 | 14.7 | 30.1 | 10.6 | 3.2 |
| 2. BTI.deff: Before Transfer Income, | 100.0 | 2.5 | 4.0 | 5.2 | 6.3 | 7.4 | 8.5 | 9.7 | 11.4 | 14.4 | 30.0 | 10.1 | 3.1 |
| including deferred incomes | |||||||||||||
| 3. T3: Tax on Cons&Prod (TCP) | 0.8 | 0.2 | |||||||||||
| 4. T2: Tax on Inc. and Wealth (TIW) | |||||||||||||
| 5. T1: Social Contributions (TC) | |||||||||||||
| 6. B1: Social Benefits in Cash (BCA) | 25.9 | 1.4 | 2.0 | 2.1 | 2.4 | 2.4 | 2.5 | 2.7 | 2.9 | 3.3 | 4.2 | 0.5 | 0.1 |
| 7. DI: Disposable Income | 70.1 | 2.2 | 3.6 | 4.5 | 5.2 | 5.8 | 6.5 | 7.2 | 8.1 | 9.7 | 17.1 | 4.8 | 1.3 |
| 8. B2: Social Benefits in Kind (BKIN) | 21.0 | 2.9 | 2.9 | 2.4 | 2.2 | 2.0 | 1.9 | 1.7 | 1.7 | 1.7 | 1.6 | 0.2 | 0.0 |
| 9. B3: Collective consumption (BCOL) | 6.5 | 0.6 | 0.7 | 0.6 | 0.6 | 0.6 | 0.6 | 0.7 | 0.7 | 0.7 | 0.7 | 0.1 | 0.0 |
| 10. M: Balance of Transfers | 2.4 | 0.3 | 0.3 | 0.3 | 0.3 | 0.3 | 0.4 | 0.4 | 0.3 | 0.3 | |||
| 11. ATI: After Transfer Income | 100.0 | 6.0 | 7.3 | 7.7 | 8.2 | 8.6 | 9.3 | 9.8 | 10.8 | 12.3 | 19.6 | 5.0 | 1.3 |
| 12. NWE: Net wealth | 574.8 | 6.5 | 12.8 | 16.2 | 20.8 | 27.7 | 35.6 | 45.1 | 57.2 | 80.4 | 267.5 | 51.3 | 11.8 |
Source: Germain et al. [15]. The table shows the distribution of national income and its sub-component before and after transfers. A more detailed version is available in the report of the working group on distributional accounting.
Table 2
Redistribution accounts, France (% national income)
| D1 | D2 | D3 | D4 | D5 | D6 | D7 | D8 | D9 | D10 | ||
|---|---|---|---|---|---|---|---|---|---|---|---|
| 1. Tax (T1 | 55.5 | 1.4 | 2.1 | 2.7 | 3.3 | 4.1 | 4.8 | 5.6 | 6.7 | 8.4 | 16.4 |
| 2. Tax rate (% BTI) | 64.6 | 58.3 | 54.6 | 55.1 | 55.2 | 55.4 | 56.1 | 56.5 | 57.2 | 54.6 | |
| 3. Benefits (B1 | 53.2 | 4.9 | 5.5 | 5.1 | 5.2 | 5.0 | 5.1 | 5.0 | 5.3 | 5.6 | 6.5 |
| 4. R: Net Redistribution | 3.9 | 3.7 | 2.8 | 2.2 | 1.3 | 0.7 | |||||
| 5. R1: Social Insurance Redistribution | 0.8 | 1.1 | 1.1 | 1.0 | 0.8 | 0.4 | 0.1 | ||||
| 6. R2&3: Public Services Redistribution | 2.8 | 2.6 | 1.8 | 1.4 | 0.9 | 0.6 | 0.0 |
Source: Germain et al. [15].
A simplified version of the Distributional Accounts for France produced by the working group is presented in Tables 1 and 2. First, let us note that the Distributional Accounts table presents results for each decile of the population as well as for the top percentile and the top 0.1%, a level of granularity justified for the reasons briefly detailed in the previous section of this paper. The table also seeks to integrates income and wealth inequality analysis and to do so includes a line showing net wealth for each income fractile.
Before Transfer Income (line 1) is equal to national income (or gross domestic product minus fixed capital consumption plus net foreign income). In France, it is found that the first decile (D1) captures 2.1% of national income before transfers, whereas the top 1% (P100) captures 10.6%. The top 0.1% (M1000) captures 3.2% of national income before transfers. In order to net out the effect of pension systems when comparing inequality and redistribution levels across countries, it can be useful to focus on “Before Taxes and after deferred income” (i.e. pension and unemployment insurance transfers), as is done on line 2.
Lines 3 and 4 of Table 1 subtract consumption and production taxes and income and wealth taxes, respectively from national income. Line 5 substracts social contributions and line 6 adds social benefits in cash. Line 7 corresponds to disposable income. Its aggregate value is equal to 70.1% of French national income. The bottom 10% of the population captures 2.2% of total disposable income whereas the top 1% captures 4.8% of the total.
The next lines of Table 1 add in kind transfers and collective consumption to disposable income in order to generate “After transfer income” (or “posttax national income”). Social benefits in kind (line 8) are relatively progressive in France, with the bottom 10% receive 2.9% national income of these benefits vs. 1.6% for the top 10%. Collective consumption expenditure (line 9), is slightly regressive. Once all taxes and transfers are taken into account, it is found that the bottom 10% gets 6.0% of After transfer income (or posttax national income, line 10). The top 1% captures 5.1% of it.
Table 2 presents (here again in a reduxed form) Redistribution accounts for France. Line 1 sums all forms of taxes and social contributions (or “macroeconomic tax rate”, which represent 55% of national income overall) and line 2 expresses this tax rate as a share of before transfer income (i.e. line 1 of Table 1). As can be seen, the overall progressivity of the French tax system is not evident as per line 2, with the first decile subject to a macroeconomic tax rate of 64.6% whereas the top decile has a macroeconomic tax rate of 54.6%. Line 3 presents the distribution of benefits and line 4 is the net effect of taxes and benefits on each income group (broken down into social insurance redistribution and public services redistribution).
A more detailed version of these tables is presented and discussed in the report produced by the working group [15], which also details the assumptions made to distribute component of national income before and after taxes (in particular production taxes, social benefits in kind, collective consumption expenditures or the balance of transfers. The group also makes recommendations on raw data production processes in order to facilitate the production of distributional accounts in the years to come.
To our knowledge, this is the first exercise mobilizing national statisticians and inequality experts in a given country to produce Distributional Accounts that are completely coherent with the system of national accounts (i.e. incomes of all groups before transfer sum to the income of all groups after transfers, which are equal to national income). This work can be seen as a complement to the production of OECD DNA working groups. In particular, the INSEE-led working group managed to produce statistics allowing for the production of any kind of inequality measure (Atkinson indexes, Gini coefficients, top 0.1%, etc.).
The approach developed the context of the French inequality measurement community could indeed be reproduced in other countries in order to move forward towards the actual production of distributional accounts. The World Inequality Lab already engaged in discussions with a handful of countries willing to do so. European countries have also shown interest in such a process and could produce novel estimates in the context of a multi-stakeholder framework.
In Malaysia, on the basis of recent Distributional national accounts estimates produced by researchers collaborating with the World Inequality Lab (see Abdul Khalid and Yang, 2019), a collaboration is being developed in order to produce a set of recommendations for the national statistical office. In Argentina, the establishment of such a working group and the construction of such estimates received top-level support.77 More generally, in Latin America, the World Inequality Lab is working with CEPAL towards this objective. A similar research collaboration has been developed with the World Bank to produce Distributional National Accounts for Asian countries. In Africa, the multi-annual partnership between the United Nations Development Programme and the World Inequality Lab on the development of new inequality statistics is also going in this direction (see UNDP, 2019). UNDP’s support to the development of emerging countries’ statistical capacities can be particularly helpful in this regard.
4.What’s next? Towards distributional environmental accounting
Progress in the field of distributional accounting may pave the way for further evolutions of national accounts and in particular in the domain of environmental accounting. The environmental dimension of national accounts is relatively novel, but it is also one of its most important elements. In order to effectively monitor and address environmental degradations, robust, timely and internationally comparable environmental statistics are a prerequisite. We argue below that the future of environmental statistics should not only be about aggregates, but also incorporate a distributional dimension.
Following the release of the Brundtland Report in 1987 on sustainable development and the first assessment report of the Intergovernmental Panel on Climate Change report (IPCC) in 1990, the 1993 revision of the UN System of National Accounts was the first version of the SNA in which issues involved in incorporating environmental resources and services into national accounts were discussed. More precisely, it was accompanied by the release of the first Handbook of National Accounting: Integrated Environmental and Economic Accounting (SEEA 1993). The SEEA was later revised, in 2003 and in 2012 and was adopted by the UN Statistical Commission as the international standard for environmental accounting. This “Central Framework” was completed by an Experimental Ecosystem Accounting manual (EEA 2013) and an Application and Extensions manual in 2014.
Figure 2.
Global greenhouse gas emissions growth by global income percentile, 1980–2015. Source: Author based on EORA (2019), EDGAR (2019) and WID.world (2020). The graph shows per adult greenhouse gases emissions growth between 1980 and 2015, for each global income g-percentile. Carbon-income elasticity of 0.9 is assumed to infer the distribution of carbon emissions, investment related emissions are distributed as wealth ownership. See Chancel and Piketty [12] and Chancel [11] for more detail on the methodology.
![Global greenhouse gas emissions growth by global income percentile, 1980–2015. Source: Author based on EORA (2019), EDGAR (2019) and WID.world (2020). The graph shows per adult greenhouse gases emissions growth between 1980 and 2015, for each global income g-percentile. Carbon-income elasticity of 0.9 is assumed to infer the distribution of carbon emissions, investment related emissions are distributed as wealth ownership. See Chancel and Piketty [12] and Chancel [11] for more detail on the methodology.](https://content.iospress.com:443/media/sji/2020/36-3/sji-36-3-sji200689/sji-36-sji200689-g002.jpg)
Environmental estimates therefore entered the realm of national accounting and so in two ways: these can be measured in monetary terms or physical terms. Monetary accounts are limited to the universe of economic assets, i.e. environmental assets which must have defined ownership rights and be “capable of bringing economic benefits to their owners, given the technology, scientific knowledge, economic infrastructure, available resources and set of relative prices prevailing on the dates to which the balance sheet relates or expected to do in the near future” (SNA 2008). Physical accounts encompass a much broader scope of environmental services and resources (e.g. barren land, known mineral deposits without current economic value).
For obvious reasons of statistical capacities and (lack of) data availability, the SEEA was adopted with the aim of being implemented in a “flexible and modular approach” [30]. The downfall of this approach however meant that progress among countries have been slow, uneven or inexistent. According to the World Bank, only 16 countries compiled at least one type of natural capital stock regularly by 2011 – and even among these countries, data was often limited to subsoil assets, with only seven countries compiling accounts for timer and land for instance. Put differently, much efforts remain to be done in order to produce environmental monetary and physical aggregates.
In such a context, the regular production of aggregate GHG estimates may then look like an exception in the domain of environmental accounts: they have been released with a relatively good frequency – in part thanks to international political processes on climate change (i.e. International Conferences of Parties). Such accounts are essential to track progress in the fight against climate change. However, they have also shown their limitations: the design of effective climate policies requires not only aggregate measures but also more disaggregated statistics, including individual carbon emissions, broken down by socio-economic groups.
The recent failure of the French carbon tax and the yellow vests movements is a powerful illustration of the need for better individual carbon emissions accounting to better anticipate climate policies’ socio-economic impacts [10]. When such impacts are not anticipated, climate policies can be easily contested. Indeed, the tension between climate policies and the social dimension of sustainable development is not limited to high-income countries: many emerging nations, from Indonesia to Nigeria, faced social unrest after trying to introduce changes to their energy or carbon tax structure (Sterner et al., 2014).
As the statistical community starts to develop distributional income and wealth estimates, it may there seem urgent to initiate a process that would lead to the publication of consistent distributional environmental accounts, starting with distributional GHG emissions accounts, i.e. measures of carbon pollution by income, wealth or socio-economic percentiles.
The distribution of aggregate GHG emissions (or any type of natural resource or wealth) to individuals indeed raises important conceptual and methodological issues which need to be addressed in a standardized and transparent framework. How to define individual responsibility?88 Should one consider GHG gas emissions at point of use (when an individual drives his or her car for eg) or consider full consumption-based emissions (i.e. emissions embodied in services and goods purchased by an individual, possibly emitted at the other side of the globe)? How should government emissions associated to collective consumption expenditures be distributed to individuals? What about emissions related to investments? Interestingly enough, many of these issues can partly be addressed by the development of Distributional Income and Wealth Accounts discussed in the previous sections of this paper. Other issues specific to environmental accounting will need to be dealt with.
Very preliminary distributional carbon accounts have been produced, combining distributional national accounts, Input-Output databases (to incorporate consumption-based emissions) and environmental accounts. Figure 2 shows Green House Gas emissions growth, for each global income percentile, between 1990 and 2015, based on a combination of distributional national accounts data from the World Inequality Database GHG emissions data from Eurostat and Input Output datasets from EORA. Such results and methods are still preliminary, but provide an insight into a possible development for environmental accounting. They help reveal an important dimension of environmental degradations: as emissions growth are unevenly distributed, a large share of this growth can be traced down to relatively small groups of the population. Such statistics, both at the national and international level, will arguably become increasingly important for research, policymaking and public debates in the years to come.
5.Concluding remarks
In this paper, we have presented the Distributional National Accounts project and a recent initiative to produce Distributional National Accounts in France, in the context of multi-stakeholder working group involving national statisticians and academic researchers. These developments have shown that it is possible to distribute income and wealth to individuals in a framework that is consistent with national accounts aggregates. The method has already been applied to dozens of countries over the world. The paper also envisages the development of distributional environmental accounts, building on recent progress made on the distribution of more standard national accounts. The bottom line is that 21
Notes
1 Top income and wealth levels can are misreported because of sampling errors (the low sampling size of most surveys affects the variance of estimates, which means they can vary a lot around their actual value and can create large biases when measuring top-end inequality) as well as non-sampling errors (individuals refusing to answer surveys or misreporting their incomes). See Blanchet, Flores and Morgan (2019).
2 The quality of survey data tends to be even lower emerging countries. In India and China, for instance, top 1% income share in surveys is found to be at most half its true value [24, 13]. In Brazil, survey data shows a reduction of income inequality while tax data reveals it was stable overall (Appendix Fig. 2). Systematic comparison of inequality levels therefore requires using additional information.
3 See Piketty, Saez Zucman, 2018 and CPS 2018.
4 The WID.world database now regroups more than 100 researchers and is constantly updated thanks to new releases of income or wealth tax or survey data.
5 The recent suppression of the wealth tax in France led to the destruction of the administrative apparatus to track wealth dynamics at the top of the distribution. More precisely, the tax was replaced by a tax on real estate. At the top of the distribution, about 80–90% of net wealth takes the form of financial wealth, rather than real estate [14].
6 Mathias André and Thomas Blanchet served as co-rapporteurs of the group’s report.
7 During his visit at the Paris School of Economics, President Pinera agreed on the production of DINA estimates.
8 In the context of natural wealth, for e.g. forests, for which pioneering accounts exist in certain countries (such as Canada) allocating such wealth to individuals also raises important questions, which are similar to those posed by the allocation of collective consumption expenditures to individuals in the context of Distributional income accounts discussed in the previous section of this paper.
References
[1] | Alstadsæter, A., Johannesen, N., & Zucman, G. ((2019) ). Tax evasion and inequality. American Economic Review, 109: (6), 2073–2103. |
[2] | Alstadsæter, A., Johannesen, N., & Zucman, G. ((2018) ). Who owns the wealth in tax havens? Macro evidence and implications for global inequality. J. Public Econ, 162: , 89–100. |
[3] | Alvaredo, F., Atkinson, A.B., & Morelli, S. ((2018) ). Top wealth shares in the UK over more than a century. Journal of Public Economics, 162: , 26–47. |
[4] | Alvaredo, A., Atkinson, A.B., Chancel, L., Piketty, T., Saez, E., & Zucman, G. ((2016) ). “Distributional National Accounts (DINA) Guidelines: Concepts and Methods Used in the World Wealth and Income Database,” WID.world Working Paper no. 2016/2, December 2016, http://wid.world/document/dinaguidelines-v1/. |
[5] | Atkinson, A.B., & Bourguignon, F. ((2000) ). Handbook of income distribution, Elsevier. |
[6] | Atkinson, A.B., & Piketty, T. (Eds.). ((2007) ). Top incomes over the twentieth century: a contrast between continental european and english-speaking countries. OUP Oxford. |
[7] | Atkinson, A.B., & Harrison, A.J. ((1978) ). Distribution of personal wealth in Britain. Cambridge Univ Press. |
[8] | Blanchet, T., Chancel, L., & Gethin, A. ((2020) ). Why is Europe more Equal than the US? WID.world working Paper 2019/6. |
[9] | Blanchet, T., Flores, I., & Morgan, M. ((2018) ). The weight of the rich: Improving surveys using tax data. WID. world Working Paper, 12/2018. |
[10] | Chancel, L. ((2020) ). Unustainable Inequalities: Social justice and the environment. Harvard University Press. |
[11] | Chancel, L. ((2020) b). Global carbon inequality. WID.world Working Paper (forthcoming). |
[12] | Chancel, L., & Piketty, T. ((2017) ). Carbon and inequality: from Kyoto to Paris. WID.world working paper. |
[13] | Chancel, L., & Piketty, T. ((2019) ). Indian Income Inequality, 1922–2014: From British Raj to Billionaire Raj? Review of Income and Wealth. |
[14] | Garbinti, B., Goupille-Lebret, J., & Piketty, T. ((2018) ). Income inequality in France, 1900–2014: Evidence from Distributional National Accounts (DINA). Journal of Public Economics, 162: , 63–77. |
[15] | Germain, J.-M., et. al. ((2020) ). Rapport du groupe d’experts sur la mesure des inégalités et de la redistribution, INSEE, Paris: France. |
[16] | IMF ((2017) ). Fiscal Monitor 2017: Tackling inequality: International Monetary Fund. Washington D.C. |
[17] | IPP ((2018) ). Evaluation du budget 2018–2019. Institut des Politiques Publiques. Paris School of Economics, October 2018. |
[18] | Kuznets, S. Shares of Upper Income Groups in Income and Savings (New York: National Bureau of Economic Research, 1953). |
[19] | Lakner, C., & Milanovic, B. ((2015) ). Global income distribution: from the fall of the Berlin Wall to the Great Recession. The World Bank Economic Review. |
[20] | Piketty, T. ((2003) ). Income inequality in France, 1901–1998. Journal of Political Economy, 111: (5), 1004–1042. |
[21] | Piketty, T. ((2014) ). Capital in the twenty-first century. Harvard University Press. |
[22] | Piketty, T., & Saez, E. ((2003) ). Income inequality in the United States, 1913–1998. The Quarterly Journal of Economics, 118: (1), 1–41. |
[23] | Piketty, T., Saez, E., & Zucman, G. ((2017) ). Distributional national accounts: Methods and estimates for the United States. The Quarterly Journal of Economics, 133: (2), 553–609. |
[24] | Piketty, T.L.Y., & Zucman, G. ((2019) ). “Capital Accumulation, Private Property and Rising Inequality in China, 1978–2015,” American Economic Review. |
[25] | Saez, E., & Zucman, G. ((2016) ). Wealth inequality in the United States since 1913: Evidence from capitalized income tax data. The Quarterly Journal of Economics, 131: (2), 519–578. |
[26] | Sterner, T. (Ed.). ((2012) ). Fuel taxes and the poor: the distributional effects of gasoline taxation and their implications for climate policy. Routledge. |
[27] | UNECE ((2011) ). Canberra Group Handbook on Household Income Survey, United Nations Economic Commission for Europe, Second Edition, Geneva. |
[28] | UN ((2003) ). Handbook of national accounting: integrated environmental and economic accounting (with European Commission, International Monetary Fund, Organisation for Economic Co-operation and Development and World Bank). New York: United Nations. |
[29] | UN ((2009) ). System of National Accounts 2008. (with European Commission, International Monetary Fund, Organisation for Economic Co-Operation, and World Bank). New York: United Nations. |
[30] | UN ((2014) ). System of Environmental-Economic Accounting 2012: Central Framework. (with European Commission, Food and Agriculture Organization, International Monetary Fund and Organisation for Economic Co-operation, and World Bank.) New York: United Nations. |
[31] | Zucman, G. ((2016) ). The missing wealth of nations: Are europe and the U.S. net debtors or net creditors? Quarterly Journal of Economics, 128: (3), 1321–1364. |


