
The use of metadata modelling for the modernisation of information management of statistical classifications
Abstract
As statistical data is becoming more accessible, available in bigger and more complex datasets and can be analysed and interpreted in so many ways, opportunities exist for modernising the development processes for statistical classifications and its responsiveness to emerging user demands. Metadata modelling along with the use of semantic software tools enables significant advances to be explored in the way that traditional statistical classifications are developed, maintained, updated and implemented.
The system of economic statistics is one where there is overlap in concepts, definitions, classifications and metadata which often makes search and discovery by non-expert users challenging. New methodologies for managing and describing data, and the categories to which they are classified can benefit from a greater uptake of semantic web technology, such as Simple Knowledge Organisation Systems (SKOS), and Resource Description Frameworks (RDF).
This paper explores new approaches to statistical classifications and their role in the future of economic statistics through the use of metadata, conceptual and entity modelling rather than the traditional methodology of hierarchically structured, sequentially code based statistical classifications.
1.Introduction
Statistical classifications provide the taxonomical basis for information management, data description, and production of official statistics, and are a fundamental component of key economic frameworks such as the System of National Accounts (SNA), the Balance of Payments manual (BPM) or System of Environmental-Economic Accounting (SEEA). They help us understand and collate data on economic activities by using the International Standard Industrial Classification (ISIC), or describe and collate data on products using the Central Product Classification (CPC). But they are difficult to use, maintain and update across statistical systems or information management systems because of their traditional hardcopy nature. Embodying knowledge into a book does not translate into useful and usable knowledge [1].
In a world driven by instantaneous information availability, the use of social media tools such as InstagramTM or TwitterTMreinforces the fact that human communication and interaction is changing. Economic statistics need to take account of that changing world and move accordingly. Current programs do not keep pace with the changing economy and the current method for collection and dissemination is not sustainable [2]. Staying with traditional approaches and frameworks provides consistent time-series but doesn’t enable contemporary data to be created that will influence policy and decision-making. Without change we will be leaving people behind which is contrary to the philosophies embodied in the Sustainable Development Goals (SDGs) [3].
As national statistical offices grapple with the need to explore ways to integrate and identify new data needs for the global indicator framework and 2030 Agenda for Sustainable Development, traditional approaches and methodologies for producing official statistics and managing data are being heavily scrutinized and evaluated. The increased need for innovative solutions, real-time response to information collection and interpretation, coupled with evolving technology highlights that the traditional approaches of developing and maintaining monolithic, statistical classifications for use in economic statistics is no longer appropriate or cost-effective.
1.1Background
Whilst statistical classifications are the cornerstone of official statistics, the continued belief that turning text into code for storage, data production and analytical purposes using mutually exclusive and sequentially numbered categories in structured statistical classifications is no longer a viable approach. There is often great expense in time and resourcing to develop, revise and maintain a statistical classification which negates the ability to reflect the contemporary real world of data. Statistical frameworks and classifications have always been necessary because it is human nature to classify everything around us, and classifications enable the grouping and organisation of information and data into meaningful sets based on common criteria, concepts or definitions.
Associated with the challenges of the traditional approaches is the need for good supporting metadata, something statistical classifications and standards are not always good at providing. Metadata is generally defined as information about information and it is usually presented or characterised as either structural, reference, descriptive or administrative metadata [4]. Metadata is generally intended to provide a common understanding of the meaning of data or the semantics of it.
Metadata standards such as the Statistical Data and Metadata Exchange (SDMX), ISO 11179 Information Technology – Metadata Technologies, or the Data Documentation Initiative (DDI) are based upon conceptual or entity models that chunk content down into component parts for easier understanding, usage and consumption. This is the general purpose for economic statistical classifications and frameworks as well, and so taking a metadata approach means that each attribute within the economic statistical classification, knowledge or information system is better identified, maintained and implemented.
The supporting metadata that exists with the many international economic classifications is often not as extensive as it could be and has traditionally been generated for human understanding. It is predominantly descriptive text that may clarify a classification category, or definitional text describing a concept or particular treatment of a classification issue. But it does not enable easy sharing of that information across concepts and data and is limited by traditional methodologies for developing and maintaining statistical classifications.
Yet ironically, the component parts of a statistical classification are no different to those that sit within a conceptual or reference metadata model, they just haven’t been thought of in that context. Statistical classifications, like metadata models, have concepts, definitions, codelists, entities, categories and other similar attributes. They can be broken down into component parts and reconfigured accordingly, but we choose to stay in the mindset of a hardcopy publication that is replicated in electronic form that reflects hierarchic structures with parent-child category relationships.
Consequently, the intricate components of a statistical classification are not seen in isolation from each other, only as a whole because as human beings we have limited capacity to deal with data growth. What humans know compared to what is stored and processed in computer systems is exponentially decreasing [5]. This adds to the realisation that traditional approaches to classifying information need to change as human intervention is gradually replaced with machine learning and automation. To better share ideas, issues and economic data requires standardised approaches but the current suite of international economic classifications and frameworks have a perceived rigidity, dated content and inflexibility combined with an overlap in content, concepts and purposes.
2.Why do we need to modernise classifications for economic statistics?
The short answer to this question is that the real-world changes rapidly and our traditional classification model doesn’t keep up. ‘Classifications age because reality changes. Classifications need to be revised periodically, but that is a difficult exercise for statisticians’ [6]. Whilst National Accountants may be happy to live with taxonomies, frameworks and classifications that enable a consistent analysis and interpretation of data, users are increasingly struggling to appropriately use those same statistical classifications and understand what the data means. This is because of the complex nature of many economic frameworks and the extensive time it takes to make change and redefine classification content.
If one was to take the International Standard Industrial Classification (ISIC) as an example then the concept of manufacturing is still pretty much based upon the idea that you build a factory, employ staff, invest in tools and infrastructure, obtain and source raw goods and transform those goods into a product. Much of the ISIC classification either classifies activities into the types of processes used for manufacturing or by the products produced. With the advent of factory-less production or even the concept of outsourcing the focus changes in the real world to identifying services and intellectual property ownership yet we are still forced to try and classify those concepts and activities within the process or product scenario. If a business is widely diversified in its nature it becomes increasingly difficult to identify their core business or primary activity and that makes any decision for codifying to an industry classification difficult [7]. Traditional economic classification structures are no longer enabling quality information sharing, data analysis or definition provision because they are static monoliths updated on a somewhat cyclical basis and which are already out of date when published. There has to be a better way, hence the idea of metadata modelling or use of other approaches such as semantic web technology.
3.The vision for change
Innovative classification approaches can be introduced to alleviate the pain caused by the traditional methodology and this will need to be undertaken in a considered and transitional way. It is not about throwing the old out and immediately replacing with the new as users need time to assimilate and understand new ways of classifying economic statistics.
The future vision for all statistical classifications, not just economic classifications, is one which is concept based, that allows greater relationships to be established between relevant attributes, that is more efficient and automated in the authorisation and dissemination process, and which allows greater search and discovery of classification information. Storing the traditional components of a classification separately will enable greater reuse and reduce duplication – this is where the metadata modelling approach enables modernisation of the traditional processes to be implemented.
As data is now collected from sources that didn’t exist 10–20 years ago such as ATMs, Global Positioning Systems (GPS), mobile phones, supermarket scanners, internet activity and via social media, the variety and volume of it highlights new activities, new ways of describing entities and categories for which the current classification revision model cannot keep up. The time has come to look more widely at the use of relational databases, innovative classification management systems, computer created matrix software, advances in ontological engineering, semantic web and other ICT technologies to improve how classifications can be developed and how to improve search and discovery of associated metadata.
Greater emphasis now needs to be placed on what is the fundamental building block for a statistical classification – the concept. Statistical classifications are usually driven by sequential code structures and the limitations of the printed page. They are often based off one concept and often this concept is not well-defined or well utilised within a classification. This poses problems when users want to tell a story about the data as they have to take a number of related stand-alone classifications and map them together – they are unable to easily link concepts or utilise sub-concepts to provide a richer picture of the data.
A concept-based classification management approach such as that being developed and trialled in New Zealand and Canada can add value to data by increasing the content and metadata that can be created and associated within a classification category and can accompany greater integration of administrative and statistical concepts. It becomes no longer necessary to focus on standardising everything to a single economic classification or standard with a move to encouraging greater reuse of existing content by storing once and sharing across multiple locations. What matters is semantic consistency across measurements of the entities being classified, something that isn’t ideally achieved within the current way of developing and maintaining economic statistical classifications.
Taking a concept-based classification management approach has been the vision for change in New Zealand for some time as the cyclical review process for producing statistical classifications has become more labour intensive and costly in time and resource. This is particularly so when developments relating to regional classifications for industry, occupation, offence or research are considered. Having two countries, namely Australia and New Zealand, collaborate over a multi-year project to produce large classifications which took years to implement and which were effectively out of date on release highlighted a need for change. The vision for change was not about producing a solution or tool for the New Zealand national statistical office (Stats NZ) and then trying to sell that externally. Instead, the approach was to look at the global processes for statistical classification development and try and identify simpler and easier ways for a wider community of users to contribute and develop their own classification content and usage. This meant that the vision was about enabling a national data system, within which Stats NZ was a dominant player, rather than providing a niche internal tool which may then have some use to other parts of the system. This brought a different mindset for the direction for the end result, and the thinking that went into it. The underlying conceptual model and the overarching theory of the approach is exceptionally sound and has been recognised as a quantum leap forward by many agencies internationally.
Canada has been the first country to follow in New Zealand’s footsteps in moving to this new approach, with both countries sharing ideas on direction, and providing insights on the critical issues. Whilst each country as some different requirements, these have been accommodated in the system model, and tool itself, and each country then benefits from what the other has done. As more countries engage with the vision and tool a wider community of practice is initiated from which each member benefits from, or can choose to benefit from, ideas or changes implemented by another.
3.1Metadata modelling
Metadata modelling provides a new way of thinking which begins with a clearly defined concept, which may then have relationships to any number of other concepts or sub-concepts. Each concept is unique and forms a scope for all the entities or words that may then be categorised by that concept. This embodies two approaches to organising knowledge – intensional: whereby a concept is listed with properties or categories that the concept must have to be part of the set captured by the concept definition; – extensional: whereby a concept is defined by listing or specifying everything that falls within scope of the concept definition [8]. This then leads onto the use of entity-relationship models and relational database thinking as a way forward for how economic classifications can be better developed and integrated. It is about better identification and description of an information object, how it behaves, its function and use, how it relates to other information objects and how it is managed over time [9].
For example, ISIC broadly defines manufacturing as the physical or chemical transformation of materials into new products in plants or factories using power-driven machines and materials-handling equipment. It also acknowledges that the concept of manufacturing can be blurry and that it is about the transformation of materials into new products. But does this mean that all transformation of materials constitutes manufacturing? No – logging, whereby a tree is cut down and turned into logs is not considered manufacturing, but then the logs when transformed into building frames or furniture form part of the manufacturing process. So, there is a conceptual relationship which may not be easily articulated or visible in a classification structure without a lot of cross-referencing or inclusion/exclusion text.
Whilst the broad groupings in a classification such as ISIC are conceptually distinct, they are silos within an overarching framework of economic activities. Structuring a classification is then built around those silos using sequential code patterns, different levels or groups and then exhaustive lists of detailed categories, often including residual or ‘other’ categories to collect the statistically insignificant content. This traditional approach hides the conceptual relationships and doesn’t easily allow a consolidated output for something like ‘services’ or ‘information and communications technology (ICT)’. A better way is to have the traditional sections as stand-alone concepts which can be brought together to create different views of the global economy or brought together to produce an ‘industry’ or ‘economic activity’ view, that is, turning the framework around.
A traditional example can be seen here with a snapshot of Section A of the International Standard Industrial Classification (ISIC) [10].
Figure 1.
Illustrative example of ISIC.
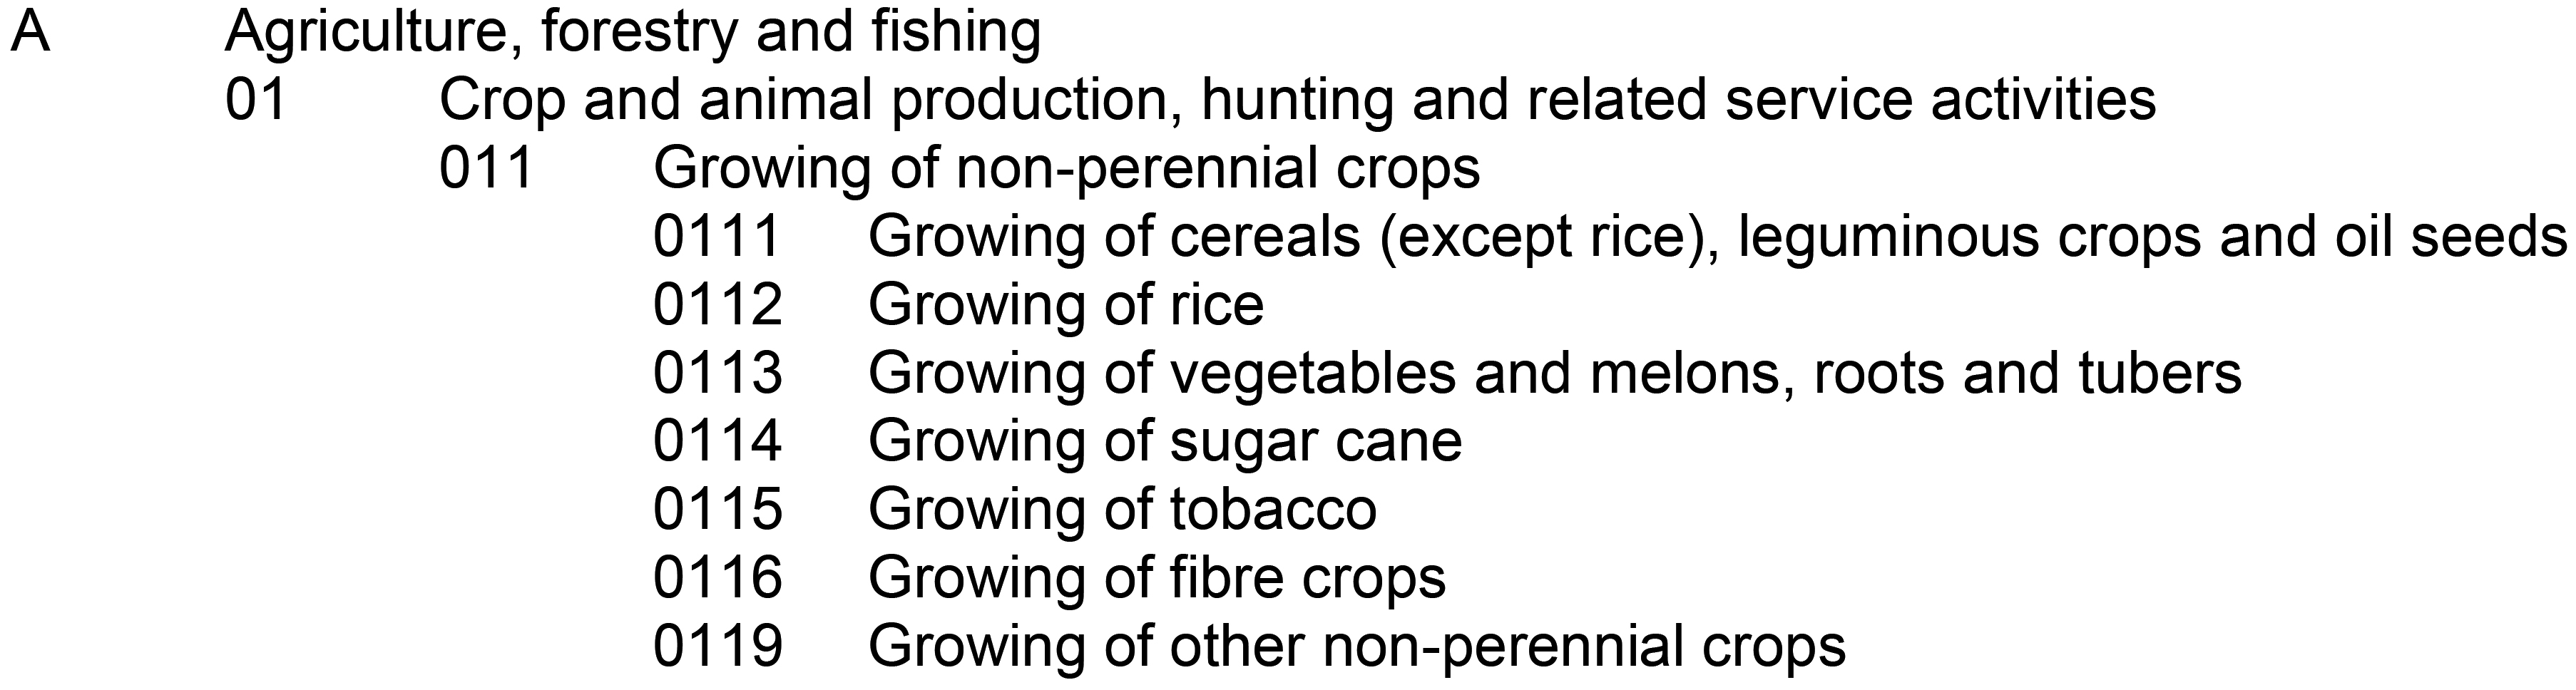
The ability to add new categories at the lowest level is constrained by the numbering system used as in the example above there are only three available slots for addition otherwise everything needs renumbering which may also impact the level above.
Within each of these levels there may be definition text, which is the primary classification metadata, and there may also be inclusion/exclusions within the detailed categories. For example, Division A of ISIC reads “This section includes the exploitation of vegetal and animal natural resources, comprising the activities of growing crops, raising and breeding of animals, harvesting of timber and other plants, animals or animal products from a farm or their natural habitats” [10].
For many classifications there will also be an alphabetic index or coding index of terms or words that can be classified to each detailed category and which can assist users to find where entities are classified.
Whilst this hardcopy approach is intuitive and represents how economic classifications are presented, the heavy text focus and the limitations of code patterns and sequences makes the maintenance and updating of this publication difficult, costly and time-consuming. Everything has to be revised as a whole, or incremental adjustments made which take time and result in another version or edition of the classification, often resulting in a complete republishing of a hardcopy or the electronic copy, which in itself may pose many operational issues for national statistical offices.
This approach no longer meets the needs of national statistical offices to produce data that enables the modern reality of the global economy to be described or understood, nor does it specify the concepts of data and knowledge in ways that support the sharing of information [11].
Metadata modelling reinforces the overarching issue when discussing or describing data that everyone needs to be talking about the same concepts, categories and content in the same way, something that traditional economic classifications strive to do but do not necessarily achieve. However, a move to a matrix style approach of relationships formed by linking multiple categories together and away from the traditional parent-child structure will enable more fit-for-purpose views of concepts and provide users with greater flexibility around their data, without comprising consistency.
Much of this approach is also about making search and discovery of content easier and interoperable, and to make the retrieval of metadata in a consistent and verified way. An example of this can be seen in the digital research protocols known as ‘FAIR’: Findability, Accessibility, Interoperability, Reuse [12]. It is about uniqueness of an entity or object (or classification component) that has descriptive metadata, and which is locatable in a way that goes beyond the purely statistical need and which enriches the value of data for the user community and data ecosystem.
4.The use of new methodologies
Changing from a traditional approach to the development and maintenance of economic statistical classifications provides numerous opportunities for efficient data management. There is a need to exploit existing data resources and map data, systems and analytics [5] particularly if there is greater need to assimilate big data and/or open data processes and principles into future direction.
The use of new methodologies will require better usage of service-oriented architecture (SOA) which will allow for integration with other system components or platforms, especially when utilising a cloud environment. The uptake of the Simple Knowledge Organisation System (SKOS) and/or integration of other systems such as the Statistical Data and Metadata Exchange (SDMX), ISO/IEC 11179 or the Generic Statistical Information Model (GSIM) enables the ability to do more things with classification components, structures and views than previously. These standards provide information models which specify concepts, relationships, rules and other elements that are not dissimilar to the content of economic statistical classifications.
Introducing these different methodologies enables better usage of taxonomies, thesauri, ontological engineering and concept management ideas to mix structured and semi-structured data to give new insights for how economic statistical classifications and standards can be developed and maintained.
International economic classifications and standards, as is the case with most statistical classifications, are not able to produce or provide multiple output views or different labelling options for categories because of the embedded constraints of the printed page and limitation of computer systems and how human beings use both, or are used to both. An economic classification traditionally needs to have mutually exclusive categories and therefore one label per category and have descriptors that do not exceed the length of a computer screen or A4 page, and so many other things that semantic web and metadata modelling can enable. The use of SKOS or RDF provides options that hardcopy and hierarchical frameworks cannot, especially in the application and usage of concepts.
4.1Simple Knowledge Organization System (SKOS)
In SKOS, concepts can have multiple relationships like the notion of an extended human family, electronic thesauri or neural network model. A traditional economic classification nearly always requires a parent-child relationship between each level due to the narrower to broader aggregation approach for refining the groupings and then relabelling each level to also provide a standalone output.
Using SKOS, concepts can be identified by using unique resource indicators (URIs), labelled with lexical strings that can utilise multiple languages, which can assign notations and link to other concepts and organise this into informal hierarchies and networks using defined concept schemes.
Making use of URIs changes the way in which content can be labelled, used and discovered which removes the constraint of single descriptors or mutually exclusive labels. In addition, the use of synonyms or aliases for categories, additional flexibility and power for describing and presenting information is obtained.
A major advantage of this approach using SKOS is that it makes for more granular metadata and easier integration accompanied by greater ability to share concepts and content across different classifications and/or views. This eliminates the time-consuming and costly overhead that comes with then having to create mappings or correspondence tables between classifications. The data is then able to provide a richer story to the user than it might otherwise have done so.
4.2Resource Description Framework (RDF)
Generally, RDF is used for representing resource information on the internet and is a tool for sharing information. It uses unique web identifiers for describing resources or entities which makes it a powerful option for structuring and storing economic classification content and provides a quantum leap forward for sharing an identical concept or category across multiple classifications. For example, the concept of aquaculture could be stored once and reused or shared across an industry, product, trade or sector classification, rather than having single entities in single classifications, each with potentially differing definitions.
The other aspect of RDF which makes it so powerful is the RDF triple. This comprises a subject (which describes the web resource for the information), predicate or relationship (which defines a property that the information is sought about) and an object (which contains the value for that predicate) enabling classification content to be disassembled into component parts to enable easier integration and sharing with other systems or frameworks. An illustrative example relating to aquaculture is shown here.
Figure 2.
RDF schema example.
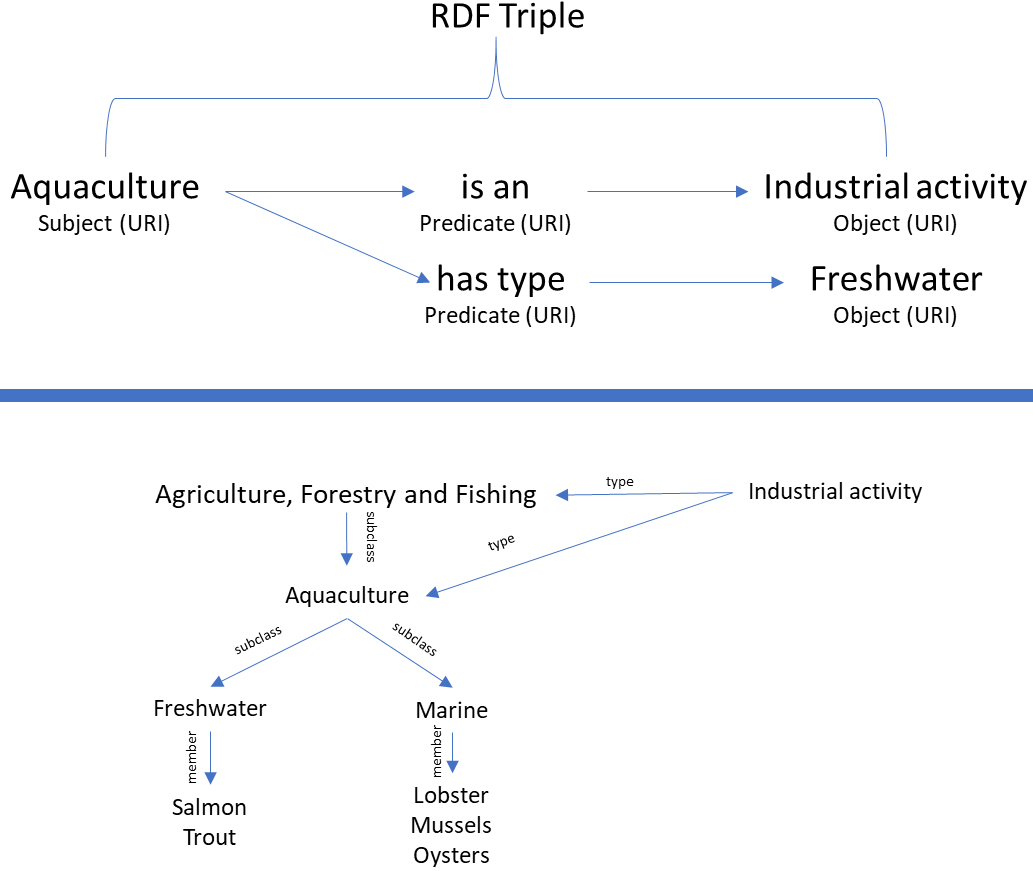
Effectively, this process breaks everything down to enable a reconfiguration or repackaging into traditional classification frameworks or alternatively into user defined views which are linked together by their relationship to an overarching concept. By connecting the triples, a graph network of relationships is defined within a set of controlled vocabulary terms [13]. A graph network is a set of nodes joined by a set of lines or arrows and can be created using graph knowledge software. An example of the software is SPARQL which is a query language used to retrieve and manipulate data stored in an RDF format.
5.Concept-based classification model
The move to a concept-based classification model is in some respects a natural evolution of the process of developing statistical classifications. As noted earlier, classifications are comprised of component parts – some of which are given more prominence than others when developing the classification. For example, the general approach is to identify all the things that need classifying and then determining whether these can comprise a flat list or require a hierarchic approach. With the latter it becomes a top-down, bottom-up process of determining what parent-child relationships are needed, how many levels are required, what the top or broad levels need to be and then putting the whole structural development on a sequential code pattern. This approach does not fully maximise the potential of the component parts nor allow a true reflection of the concept that is being measured, that is, levels can be based-off a primary concept, or sub-concepts or a hybrid thereof, and then other aspects are introduced to enable a statistical framework to be built for the data production and output process.
A classification such as the International Standard Industrial Classification (ISIC) is often referred to as the industry classification even though it is a measure of economic activities. But there is no definition of the concept of industry to support it as the scope of the classification covers the productive activities within the production boundary of the System of National Accounts (SNA). The SNA describes the production boundary as “the physical process, carried out under the responsibility, control and management of an institutional unit, in which labour and assets are used to transform inputs of goods and services into outputs of other goods and services” (SNA 2008, 1.40). Further the SNA states that “A necessary condition for an activity to be treated as productive is that it must be carried out under the instigation, control and responsibility of some institutional unit that exercises ownership rights over whatever is produced” (SNA 2008, 1.43). ISIC applies these principles by grouping the processes and units into broader sectors which effectively become the top level of the classification, e.g. agriculture, manufacturing, wholesale or retail trade. Then as many categories as practical are included within that structure either based on economic significance, statistical significance or user requirement and then numbered accordingly with residual categories to try and be exhaustive in coverage.
What this traditional approach fails to do is truly enable full analysis of the variable being classified and is very much a one size fits all attempt at measuring the national economies comparably and consistently. Whilst users often think they are talking on the same page under the guise of the industry classification or product classification they may not actually know the concept or agree on the concept they are talking about.
Yet all the component parts of an economic statistical classification can be applied quite differently to produce a much more meaningful outcome which gives greater flexibility for sharing data and telling richer stories about that data.
As a starting point for the new way of doing things the concept becomes the crucial element or entity around which everything is built. Each concept is given a label, and a definition which needs to be agreed upon by users, such that the definition forms the scope of what the concept measures. As with the use of subjects, objects and predicates within RDF, each concept will also have a relationship to other concepts which enables a conceptual framework to be created and an easier way for merging and transferring data – in some respects removing the need for one-to-one classification correspondences but also enabling a faster way of creating those correspondences. As concepts are related, the categories they contain are then linked to the other concepts very much in the vein of a neural network or electronic thesaurus.
Sitting underneath the concept is a category set which is simply all the words that fit within the scope of the concept definition – very similar to an SDMX codelist (but without the codes). These words can be user defined/suggested labels which can be dynamically added to and updated, and which could include words that would traditionally be confined to an alphabetic index or coding index.
Figure 3.
Concept model example – Country.
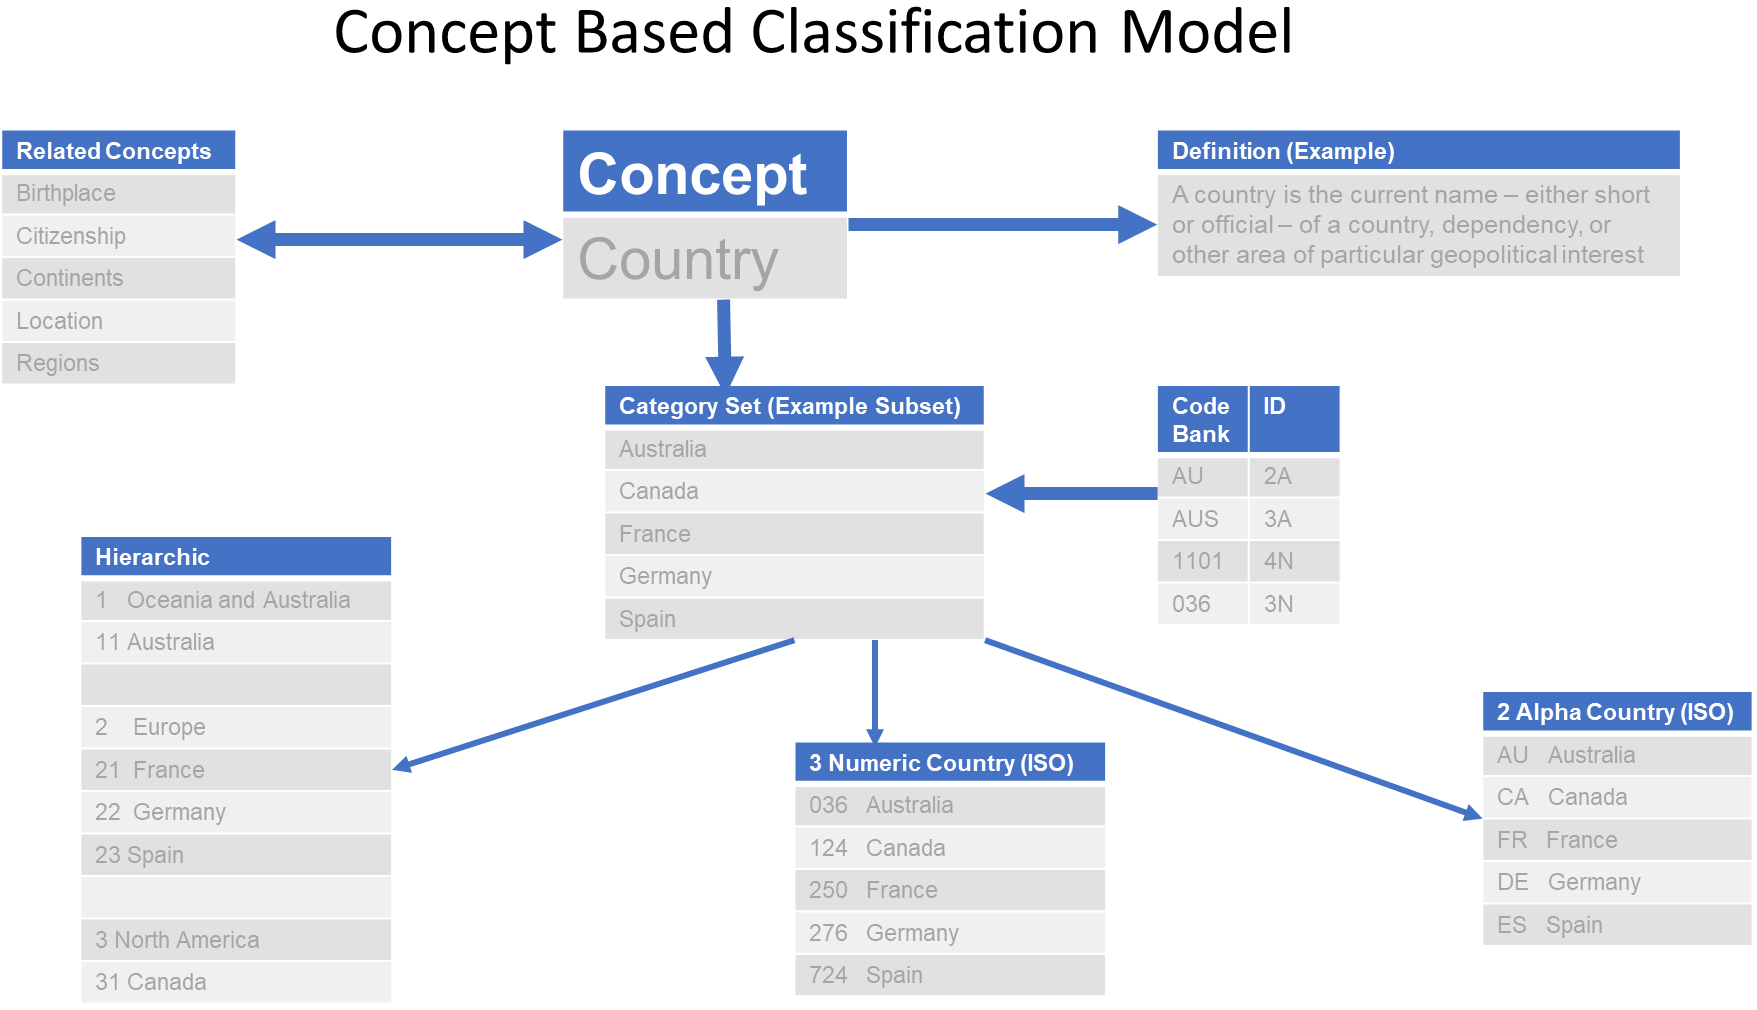
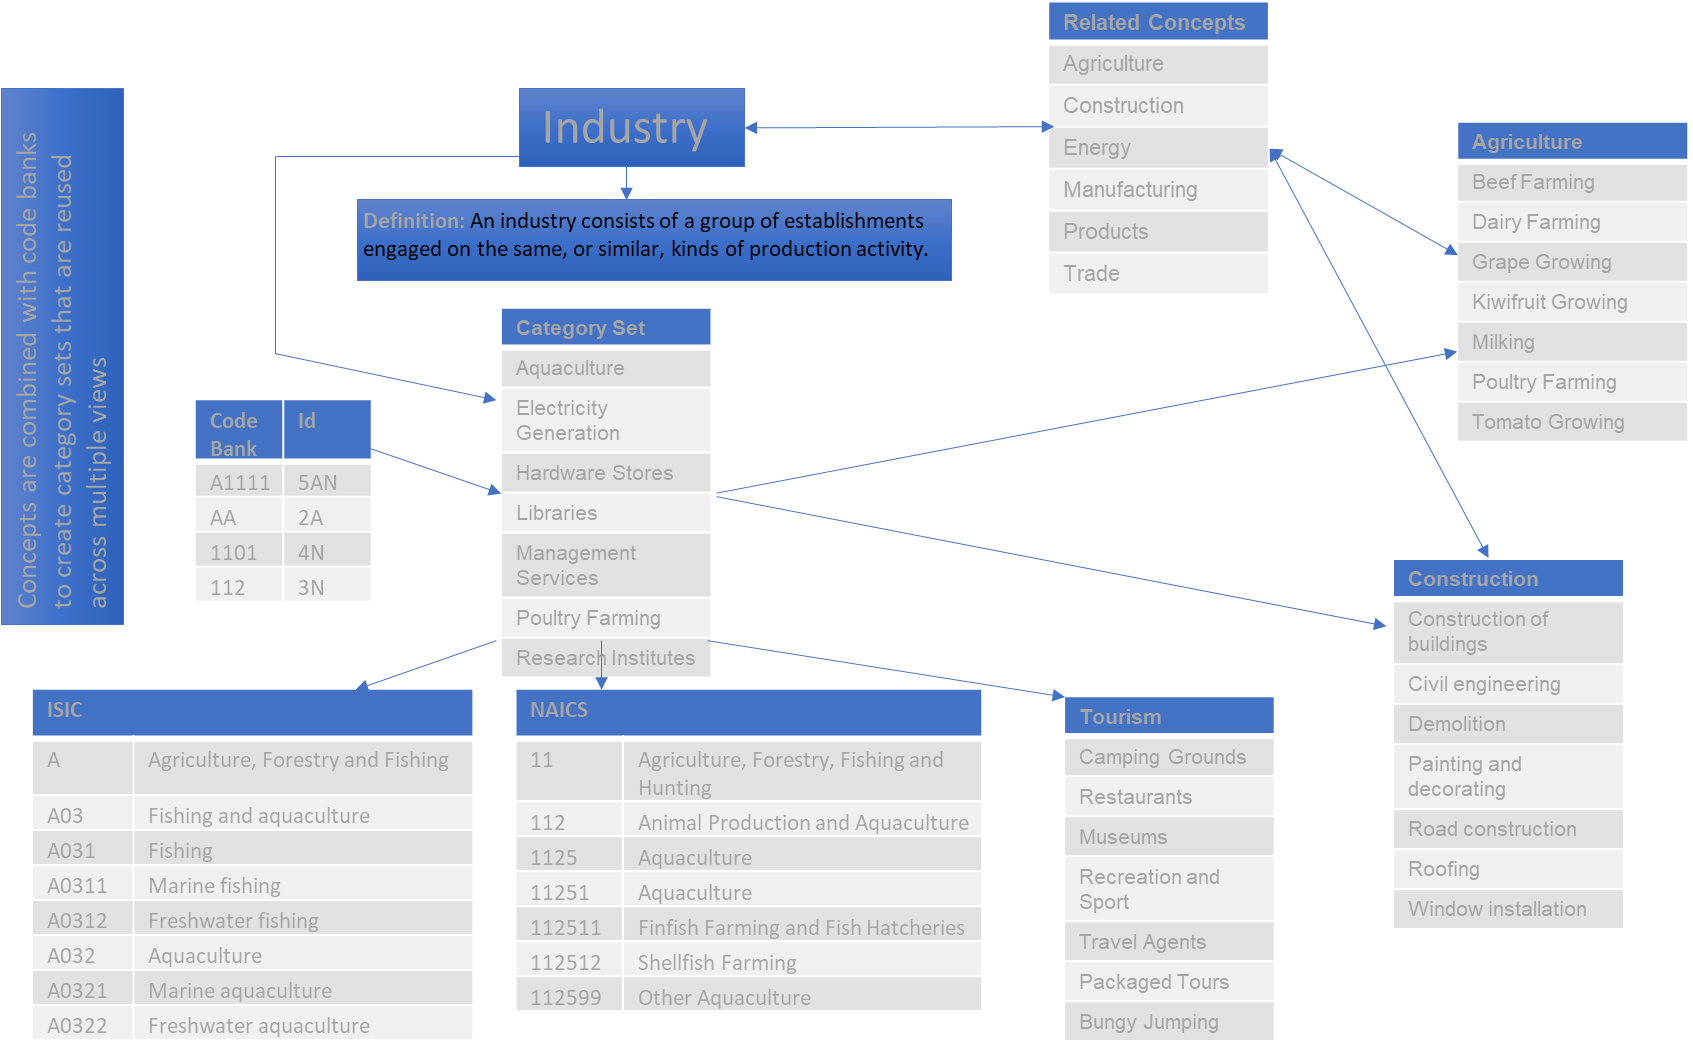
Figure 4.
Concept model example – industry.
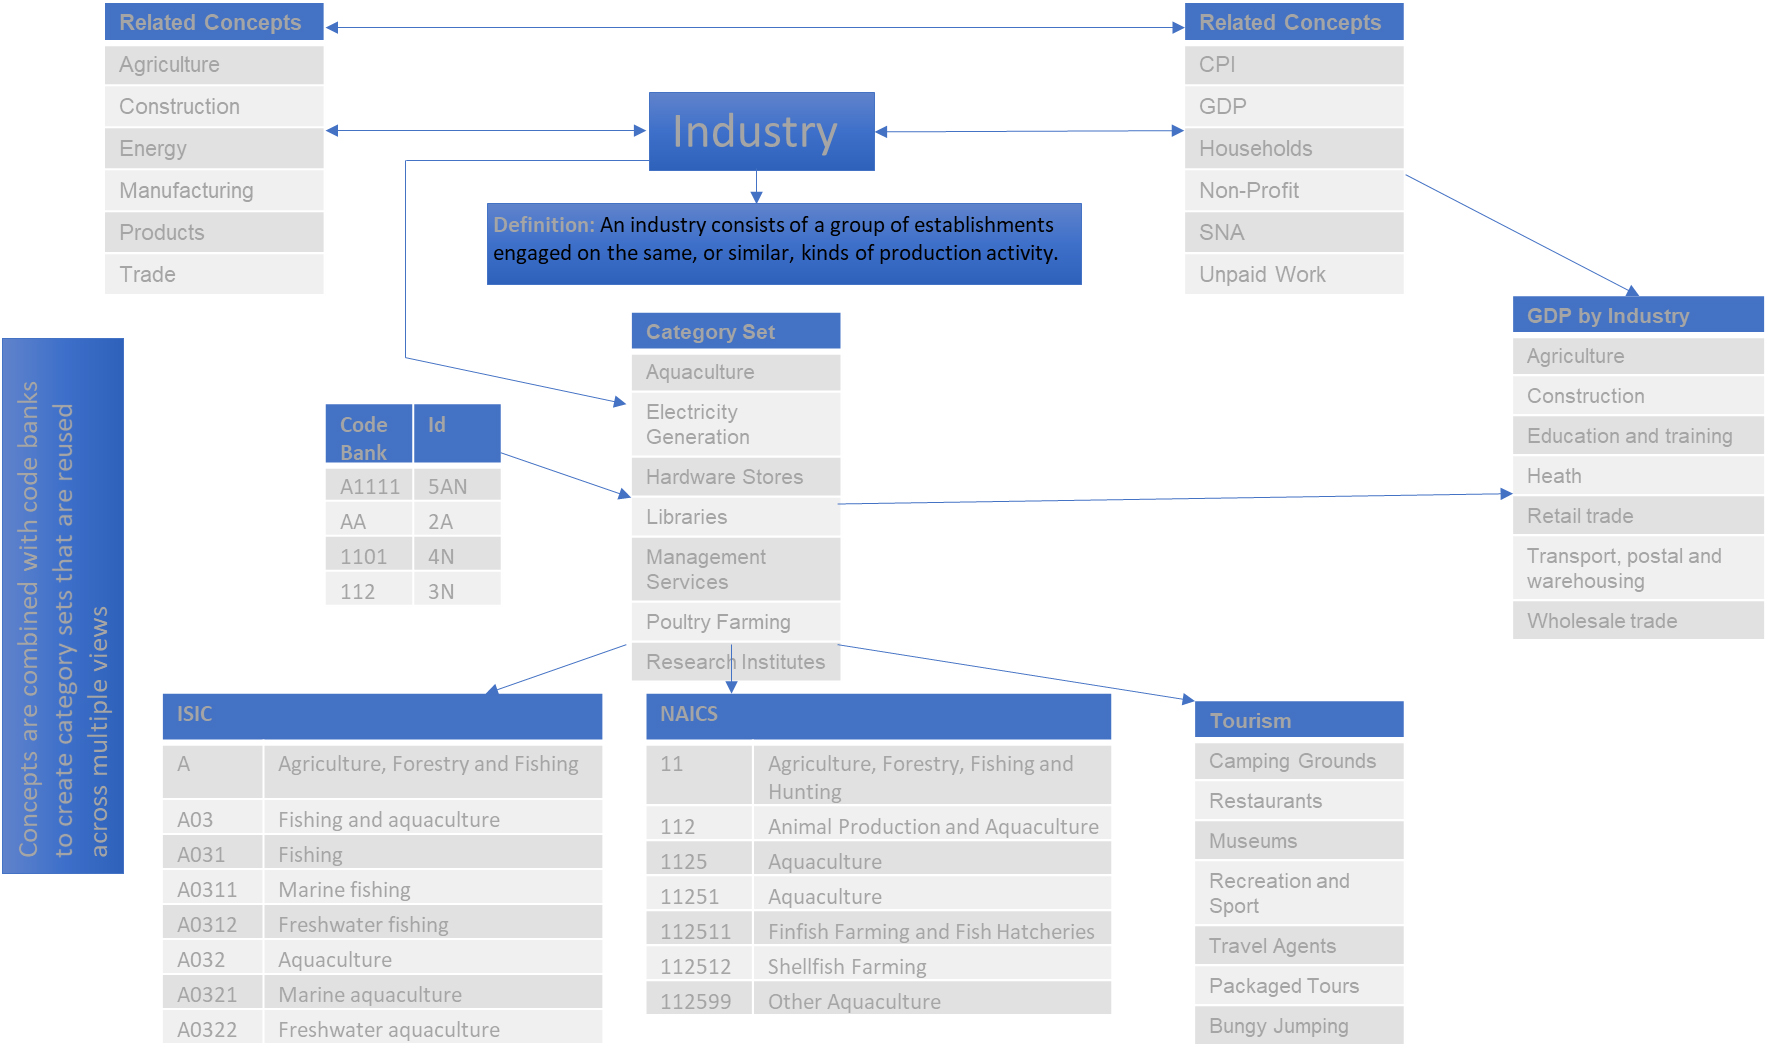
Figure 5.
Related concepts example.
Alongside the concept and category set is a code bank which provides all the codes that could be used with the concept. This code bank holds the approved codes, whether alpha, numeric or alpha-numeric, relevant to the concept and which can be used in the creation of any view or classification from a category set. The bank will potentially be linked to the category set by a universal resource indicator (URI). Again, these can be user defined or standardised but by storing these in a bank, users can determine which codes best suit their system or output needs. It also removes the problem that occurs when implementing economic statistical classifications in that users want to have an alpha-numeric code, but the standard only allows for one specific code type such as numeric.
Finally, the outcome of all this is the introduction of views of the category sets – these can be standardised, or user defined and are reusable and able to be shared. These views of category sets (or what we used to call statistical classifications) are effectively a cut and dice of a master list of content like ‘LegoTM blocks’, all linked via an overarching concept and only including content that is within the definition of that concept.
A simple example can be seen in the following diagram using the concept of Country which shows the main concept associated with a definition, and some example views created from a master list. There is a link to related concepts and a code bank for users to select pre-determined codesets for their views or classifications. All entities can be updated or added to upon user submission for change and validation for inclusion. Standardised attributes can be put in place such that a standard view can be maintained, for example an existing view of ISO 3166 Codes for the representation of names of countries, or the United Nations Standard Country code, or customised views can be created for collecting country of birth information, and trade and/or migration data.
The category set is a dynamic list of words associated with the concept that can be added to at any time. All instances are time-stamped and approved (either manually or automated) and users are then notified of changes to the master list. Users can choose to adopt change immediately or business rules can be applied to the concept to release updated content at regular points of time, for example quarterly, six-monthly or annually.
Another example can be shown using the concept of industry which illustrates a slightly more complex approach. In this example below, noting it is only illustrative of content, the primary concept of industry has a relationship to many other concepts which allows for the creation of related views. So as with the country example above, the concept has a definition, a category set, and a code bank attached to it. The category set can be used to produce standardised views to represent ISIC, or the North American Industrial Classification (NAICS), or an output view for the Tourism sector for example. Additionally, aggregated views such as GDP by industry can be created because of the relationships between the concepts which allows the category set to have wider application or linkages.
This provides a significantly greater range of outputs and views for users to create and to match with their specific datasets. The interlinkage of the concepts means that other content can be pulled through to provide hierarchical structures, flat lists, cross-cutting views or amalgamated views of concepts. For example, it is possible to create views of a related concept from a single category set noting that the related concepts in the illustration below could also be included as part of the industry category set. The user can decide whether an entity should simply exist as a category within a concept category set or be available as a stand-alone concept.
6.Conclusion
To move the development and maintenance of economic statistical classifications into the ideal of metadata modelling and conceptual classification management will take some time. But the benefits for national statistical offices in terms of cost-reduction, better resource utilisation and greater responsiveness to user demand, outweigh the continuation of the traditional time-consuming process of developing and maintaining statistical classifications that are out of date upon publication. This has been realised by Statistics New Zealand and Statistics Canada hence their investment in the vision, and tool, going forward. Users demand real-world reflection of the data and the current process does not enable that. Applying the thinking of metadata modelling and the greater use of conceptual relationships that are fully described, and which utilise the best features of the semantic web is the most practical way forward. Such an approach contains a wealth of information about the concept used in classification and provides rich and flexible information about the relationships and properties within economic statistical classifications [14]. However, adaptability to change is the real key to future success and staying with the status quo approaches does not reflect contemporary reality.
References
[1] | Al-Hawamdeh S. Knowledge management, re-thinking information management and facing the challenge of managing tacit knowledge. Information Research. 8: (1), 143. |
[2] | Jarmin RS. Evolving measurement for an evolving economy: Thoughts on 21st century US economic statistics. Journal of Economic Perspectives. 33: (1) ((2019) ). |
[3] | United Nations Statistic Division. Sustainable Development Goals (SDGs). Available at: https://sustainabledevelopment.un.org. |
[4] | Riley J. Understanding Metadata: What is Metadata, and What is it for? Baltimore: NISO (2017) . |
[5] | Kaufmann M. Big Data Management Canvas: A Reference Model for Value Creation from Data. Big Data and Cognitive Computing. (2019) . doi: 10.3390/bdcc3010019. |
[6] | Boeda M. The how and why of statistical classifications. Courier des statistiques, English series no. 15. (2009) . |
[7] | Hagedoorn J and Duysters G. External sources of innovative capabilities: The preferences for strategic alliances or mergers or acquisitions. Journal of Management Studies. 39: (2) ((2002) ), 167–188. |
[8] | Parker CT Jr et al. US Patent. Establishing semantic equivalence between concepts. (2020) . |
[9] | Baca M, ed. Introduction to Metadata 3rd Edition (2016) . Available at http://getty.edu/publication/intrometadata/. |
[10] | United Nations Statistics Division. International Standard Industrial Classification of All Economic Activities Rev. 4. Accessible at https://unstats.un.org/unsd/classifications/Econ/isic. |
[11] | Theocharis S and Tsihrintzis G. Knowledge management systems in the public sector: Critical issues. Lecture Notes on Software Engineering. 4: (1) ((2016) ). |
[12] | Juty N, Wimalratne SM, Soiland-Reyes S, Kunze J, Goble CA and Clark T. Unique, persistent, resolvable: Identifiers as the foundation of FAIR. Data Intelligence. 2: ((2020) ), 30–39. doi: 10.1162/dint_a_00025. |
[13] | Allen RB. Metadata for Administrative and Social Science Data. (2019) . |
[14] | Hancock A and Gregory A. Classification Management System Development for Statistics New Zealand, Working Paper 18. Work Session on Statistical Metadata, Geneva, Switzerland 6–8 May (2013) . |

