
New measures on contribution of corporations towards sustainability
Abstract
With the UN General Assembly’s adoption in September 2015 of the Sustainable Development Goals (SDGs) to be reached in 2030 a new, overarching and prominent policy framework was born. Following the adoption, the Danish government made Statistics Denmark (SD) the responsible authority for national SDG reporting. The strategy to fulfill this task has been to work closely with stakeholders in the business community, public authorities and NGO’s. SD has further worked to implement the SDG-framework on the business sector, in particular inspired by work done in UNCTAD about indicators for business entity reporting on economic, environmental, social and institutional issues. The work in SD has shown that it is possible to provide SDG-relevant information by type of industry using existing statistical data. Emission of CO2 and energy efficiency are examples from the environmental economic accounts. Social and business statistics can provide data on employment and wages broken down by gender, and also follow the development in occupational injuries, just to mention a few examples. However, existing data cannot provide information on how enterprises work with the SDGs. To cover this aspect, a survey among the largest private Danish enterprises was conducted in 2019. A third type of data source may be created by adding additional questions to existing surveys. The article is concluded by a discussion on the lessons learned so far and possible next steps are outlined.
1.New concept and new user demands
With the UN General Assembly’s adoption in September 2015 of the Sustainable Development Goals (SDGs) to be reached in 2030 a new, overarching and prominent policy framework was born. The SDGs have received massive attention and some would claim they have put in place a ‘new common language’ for political debate and policy innovation at all levels about the broad and complex concept ‘sustainable development’. The SDGs complex and detailed nature – with 17 objectives, 169 targets and 244 indicators in various tiers – puts a very demanding challenge before the international statistical community to compile existing and to develop new indicators for the monitoring of the SDGs – e.g. in relation to the Voluntary National Reviews (VNR) through which countries’ progress against the SDGs is being reported to the UN High Level Political Forum (HLPF).
Very substantial efforts are being displayed to meet this challenge; to strengthen communication and public awareness and to add new insights to political debate and decision making. Nationally, statistical institutes increasingly compile SDG indicators and coordinate data work with policy departments and researchers on the basis of the SDG framework. Internationally, the major organizations and custodians of statistical manuals and guidelines (UN, OECD, EU, etc.) actively use the SDGs in the prioritization and coordination of the development of official statistics.
However, much remains to be done on several aspects. Firstly, there is a big heterogeneity in the availability of the already established SDG indicators in countries depending on the economic (and statistical) development. Secondly, some SDG indicators are still in the process of being operationally defined and implemented. Thirdly, users do not ‘only’ request official indicators behind goals and targets (i.e. ‘national totals’), but often also a breakdown of the indicators for specific sectors, including the business sector. From a policy perspective such breakdown of indicators is necessary in order to analyze questions like ‘what is the business sector’s contribution to energy consumption, C02 emissions and waste generation’? Or ‘is there an increase in the business sector’s R&D in renewable energy and recycling of waste’? Fourthly, the interdependent nature of the three ‘components’ of sustainable development – i.e. economic development (‘prosperity’), social development (‘people’) and environmental protection/climate (‘planet’) – means that users need statistical tools that encompasses this interdependence; we cannot just describe the components one by one. This aspect also means that some users want tabular results, whilst others users demand micro-data. And, finally, the clock is ticking: 2030 is only ten years away and we have spent five years getting started!
The aim of this article is to present the work in SD on the SDGs, in particular in relation to the business sector and hopefully inspire to broader considerations and cooperation on the matter. As the first step, in section two, the approach to the work on the SDGs in general is presented. Now, the work also includes an ongoing project to develop additional indicators for domestic purposes. In section three, the possibilities to present meaningful SDG-results for the business sector is discussed – as well related to existing statistics as eventually new statistics, where SD has taken a first step by conducting a pilot survey among large enterprises. In section four, results are presented and discussed, starting by digging down in existing statistics and look for SDG-relevant results. Further, the outcome on the pilot project is presented. This is followed by a discussion on strengths and weaknesses in the approaches applied so far. In the final section, perspectives for the future work are discussed.
2.Statistics Denmark and the SDG-indicators
Following the adoption of the SDGs in 2015 the Danish government made SD the responsible authority for national SDG reporting. Against that background, SD plays a pivotal role in the development, compilation and communication of SDG-indicators and data for Denmark. Internationally, this is seen e.g. in the statistical annex of Denmark’s Voluntary National Reporting. All results for the SDG indicators are communicated through our SDG platform, https://www.dst.dk/ en/Statistik/Sdg.
Generally, although to various degrees, the SDG agenda has gained foothold in all sectors and at all levels of the Danish society. At the highest political level – among members of Parliament – a 2030 Network with members from all political parties promotes sustainable development towards the SDGs by holding the government accountable for its policies. Also, it supports the raising of awareness in the general public and stimulates international cooperation. This network has created a 2030 Panel consisting of scientific experts and leaders from different sectors in the civil society, which – on a politically independent basis – supports the 2030 Network via analyses, sharing of knowledge and interaction with different sectors of society. The 2030 Panel can also take up their own initiatives related to the sustainable development and SDGs. Senior managers in Statistics Denmark frequently interacts with the 2030 Network and the 2030 Panel.
The SDGs boosted the strategic significance, which statistics on sustainable development had been given in early 2015 with the adoption of SDs Strategy 2020. This was amplified in our current Strategy 2022. To support our work, a Partnership for SDG data was instituted where representatives of statistics users, data holders, municipalities, the business community, individual experts and other stakeholders meet and discuss various matters about data useable in this regard and how to access or collect them. A specific network related to business statistics has been created among members of this partnership, which has given valuable input to e.g. the pilot survey mentioned in Section 4.2 below.
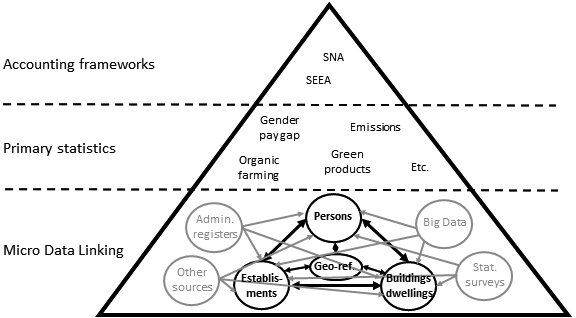
Figure 1.
Framework for busines related SDG information.
In 2019 a new national initiative was launched, the co-called ‘Our Goals’ project. The project will develop a baseline for the SDGs in Denmark and raise awareness of the SDGs, giving Danish citizens, the private sector, civil society and academia an opportunity to set targets for Denmark’s most urgent contributions to a sustainable development. All parts of the Danish society have been invited to join in and unfold the SDGs in a Danish context and develop supplementary indicators as milestones reflecting everyday life in Denmark. The project has aimed at reaching all Danes through events, workshops, social media, a dedicated web site etc., giving everyone an opportunity to offer their input to the supplementary Danish SDG indicators. The project will be concluded in the autumn of 2020 with a report to the Government and the Parliament. The intention is to end up with a minimum of 169 additional indicators – one per SDG target – if relevant for measuring progress in Denmark. The report is expected to form a sound basis for the Government’s upcoming review of the political action plan for the SDGs in Denmark. The project is financed jointly by a number of private funds.
3.A strategy to deliver new information
The SDG-concept of sustainability has from an early stage been taken on board in the policies for the work in SD. Indicators and statistics are essential for showing the development on particular fields and the SDGs are, among other frameworks, seen as a meaningful reference in the dissemination of statistical results in several domains.
3.1New information from existing statistics
Every year SD produces about 500 “Statistical News”, and the SDG perspective has been taken on board in several of these. For example, the presentation of statistics of the compositions of executive boards in companies (showing only about 20 per cent women) of course includes a reference to indicator 5.5.2 (women in managerial positions). Similarly, news about usage of IT makes references to indicator 17.8.1 (Proportion of individuals using the Internet), and also to indicator 5.b.1 (Proportion of individuals who own a mobile telephone, by sex). The statistics of income distribution, of course, also refer to target 10.1 (reduce income inequalities).
The results from the Environmental Economic Accounts also play a very important role in providing information from a SDG perspective, as the environmental and climate aspects are the most discussed SDG fields in Denmark. Emission of CO2 (indicator 9.4.1), and energy efficiency (indicator 7.3.1) are essential indicators in this field. Further, water use and production and treatment of waste are also elements in environmental accounts very closely linked to measuring needs in relation to the SDGs. The accounts are developed in accordance with the framework System of Environmental-Economic Accounting, which is a statistical standard in its own right since 2012 next to the System of National Accounts. The results are communicated by types of industry, making it easy to follow the performance in specific business sectors and to compare with the performance in the economic field.
However, also several social issues are related to the business sector. Statistics Denmark has very detailed data on employment and wages, why gender issues, also broken down by type of industry, can be covered very well. Differences and developments for specific sectors can be shown for all stakeholders. Further, for instance, differences in salaries, as well between women and men and between staff in leading positions and in non-leading positions can be highlighted. Further, data also exist for occupational injuries and sick leave, broken down by type of industry, making it possible to show a comprehensive picture of the working conditions in different sectors. The concept for development of comprehensive SDG-related statistics is shown in Fig. 1.
UNCTAD, in collaboration with financial experts, have developed a global set of so-called Core Indicators for Business entities (presented in the report: Guidance on core indicators for entity reporting on contribution towards implementation of the Sustainable Development Goals) – in brief GCI. In total 33 indicators are proposed, covering the economic, environmental, social and institutional areas, respectively. The GCI is now also part of the research program of the UN Committee of Experts on Business and Trade Statistics on wellbeing and sustainability. Analyses conducted by SD shows that the majority of the GCIs can be mapped to existing statistical information and individual SDGs. This means that selected parts of official statistics can provide macro-level information, where the companies themselves can provide micro-level information. By having results at both macro level and company level will the value of the information on changes in individual business sector be higher.
However, micro-data also exist in the statistical work, as most data in the business statistics are collected at enterprise level via a number of surveys on specific topics. Statistics Denmark has for some time worked to link different sets of micro-data to create a data warehouse with integrated information, as this will create new opportunities for analyses, also looking into sustainability issues. Where data on economic figures is linked to e.g. consumption of energy, it is possible to group by level of energy efficiency – for companies with comparable activities. By using such methods the statistical information comes closer to the situation for the single enterprise and also increase the outcome while comparing enterprises performance.
3.2Specific surveys – also an option
How does the business sector react to the SDG-agenda? That is a question of interest for the government, the business associations and the public in general and, increasingly, also for investors. As described above, existing statistics can indirectly provide knowledge in the area, but also dedicated surveys is an option. In the spring of 2019, a pilot exercise was conducted by SD with the aim of obtaining a picture on how larger enterprises have been working with the SDGs. Questions were asked about whether contribution to the SDGs has become an issue for the enterprises or was expected to become so in the near future.
If this was the case, the companies were asked to specify the steps taken; i.e. if SDGs already form part of the written corporate strategy, form part of company descriptions or reporting or in specific policies in the company. Regarding the policies, import policy, staff policy and product development policies were among the possible answers. The survey was voluntary for the companies and the response rate were one third only, as the survey was not made legally obligatory, which is normally the case for SDs business surveys.
Further, we asked about the enterprises’ motives behind the SDG orientation. Improvement of business opportunities, attraction of new investors, an increased attention to the input costs and better possibilities to attract new staff was included in the list of possible answers. The specific questions are partly reflected in the outcome shown below. For most of the questions the enterprises could choose between, “to a high degree”, “to a medium degree”, “to a low degree” or “No/not relevant”. For other questions only “Yes” and “No” were the options.
Specific elements in the SDGs were also part of the survey. We selected 21 SDG-targets which were considered of particular relevance for the enterprise sector. Targets related to products, environment and staff issues, covered the largest part, but also target (8.7) on child labor was included. The targets were changed into questions relevant for actions at enterprise level. It should be noted that targets related to SDGs 13–17 were not included, as the goals (and connected targets) are less specific than for SDGs 1–12.
SD also focuses at the possibilities to change or add elements in existing surveys, so that new information related to sustainability can be collected. An example is a survey on the use of IT, which will include questions about “green apps” with the aim to get a picture of the use of such tools to optimize sustainable behavior. Also, in the innovation statistics slight revisions are considered, as it can be relevant to include questions about innovation with the purpose of improved sustainability.
It will be considered if the specific survey will be repeated at a later stage during the lifetime of the SDG-agenda with the aim to catch up the reflections in the business sector on initiatives and the outcome of these.
4.Statistical results
The SDGs are goals and targets for our common world. They provide everybody with the orientation and the perspectives. However, the cornerstone in the work is the indicators, which provides information about the development to the decision makers as a basis for targeting new initiatives. Regarding the indicators, the global indicator framework for SDGs contains 244 indicators which are for international reporting, but the framework also encourages the countries to provide additional information and indicators more closely linked to their domestic situation. Further, indicators can also be developed for certain sectors, such as those proposed by UNCTAD regarding the business sector. SD has worked in several domains within the framework to further understand the evolution of the SDG indicators in Denmark (by for example providing additional breakdown making the indicators more relevant for sectors in the society, in example the business sector). The outcome of this work is presented in this section below.
4.1The SDG-indicators for Denmark – in general
SD coordinates the establishing and compilation of the indicators related to the full SDG agenda – in close cooperation with other governmental agencies and institutions. Most of the indicators can be compiled using existing data in SD, but several depend on data and research from other institutions in Denmark, in particular on goals 14 (Life under water), 15 (Life on Land), 16 (Peace, justice and strong institutions) and 17 (Partnership for the goals).
Currently, about 90 per cent of the defined SDG indicators are compiled and published at the official website (https://www.dst.dk/en/Statistik/Sdg). By the end of the year it is expected that only a few indicators from the official list will remain pending, including those where the definitions are still being elaborated internationally.
For quite a number of SDG indicators the reporting from Denmark has been easy, as the targets are already met or the issue is not relevant in Denmark. An example of the first type is indicator 6.b.1 about local policies (or not) on water supply. The indicator value from Denmark is in this case 100 per cent. An example of irrelevance is indicator 3.3.3 on malaria incidence, which is not a problem at all in Denmark, except for very few travelers returning from tropical regions.
In regard to the indicators referring specifically to the business sector, or part of the business sector, SD easily compiles the indicators for Target 9.2 (referring to the role of the manufacturing industry) as data are readily available. On the other hand, data for indicator 9.3.2 (Proportion of small-scale industries with a loan or line of credit) are not easily available, as the statistical coverage for small companies is low and business debt cannot be separated from personal debts for personally owned business units. However, it was decided to compile the indicator using a survey on access to finance, conducted every fourth year.
A more challenging indicator is 12.6.1 about the number of companies which disclose Corporate Social Responsibility reports. SD does not have information available which can be aligned to the definition in the official list of SDGs and thus we decided to use as proxy the number of companies obliged to provide reports under the legal framework on Corporate Sustainability Reporting, even though a lot of these reports contains no or only scarce quantitative information. Statistics Denmark is exploring new data sources to improve the reporting on this indicator, for instance based on the reporting of the UNCTAD GCIs.
4.2Business related results from existing statistics
Information on businesses and sustainability can to a large part be found or compiled from existing statistics, depending, of course, on which statistics is actually compiled in the country. Further, it is possible to provide results broken down by main types of industry – for different domains of the SDG concept. Key statistical information for monitoring sustainability is Environmental Economic Accounts, which include accounts on emissions and consumption of energy, among several other issues. From these statistics and the National Accounts a lot of statistical information can be shown on this matter.
By way of example, the CO2 emissions from the Danish business sector accounts for approximately 80 million tonnes of CO2 – excluding emissions from renewables as they are considered neutral. Broken down by main types of industry in 2018, the Transportation sector has the main share (56.4 per cent) of these emissions, followed by Agriculture forestry and fishing (15.6 per cent), Utility services (12.5 per cent) and Manufacturing (7.4 per cent), as shown in Fig. 2. The remaining types of industries only accounts for about 8 per cent of total emission.
Figure 2.
CO2-emission from the business sector in Denmark, by type of industry. 2018. Source: Statistics Denmark, Emission statistics. Note: The emission from renewable energy sources is not included. Bunkering abroad is included.
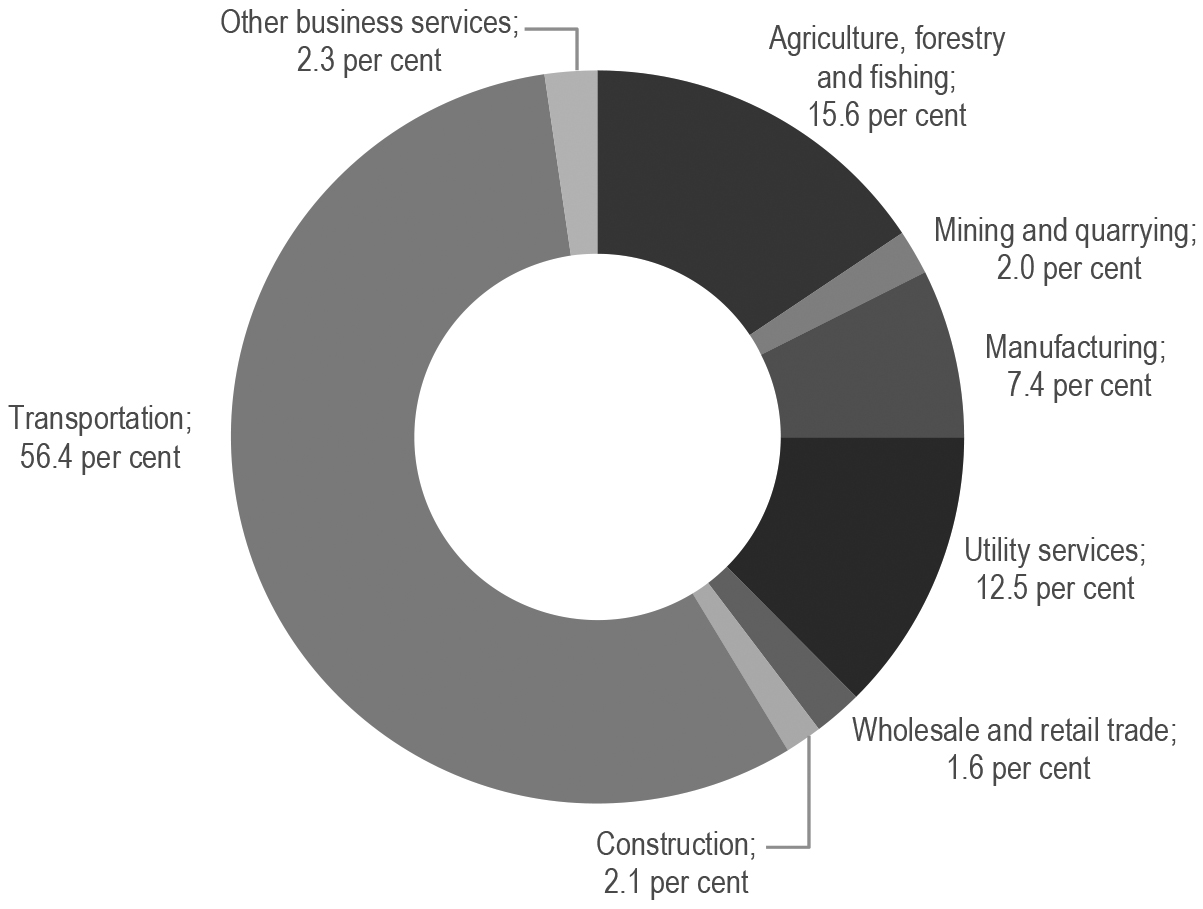
Figure 3.
CO2-emission over Gross Value Added in the Danish business sector, by type of industry. 2018. Source: Statistics Denmark, Emission statistics and National Accounts Statistics (GVA in constant prices). Note: The emission from renewable energy sources is not included. Bunkering abroad is included.
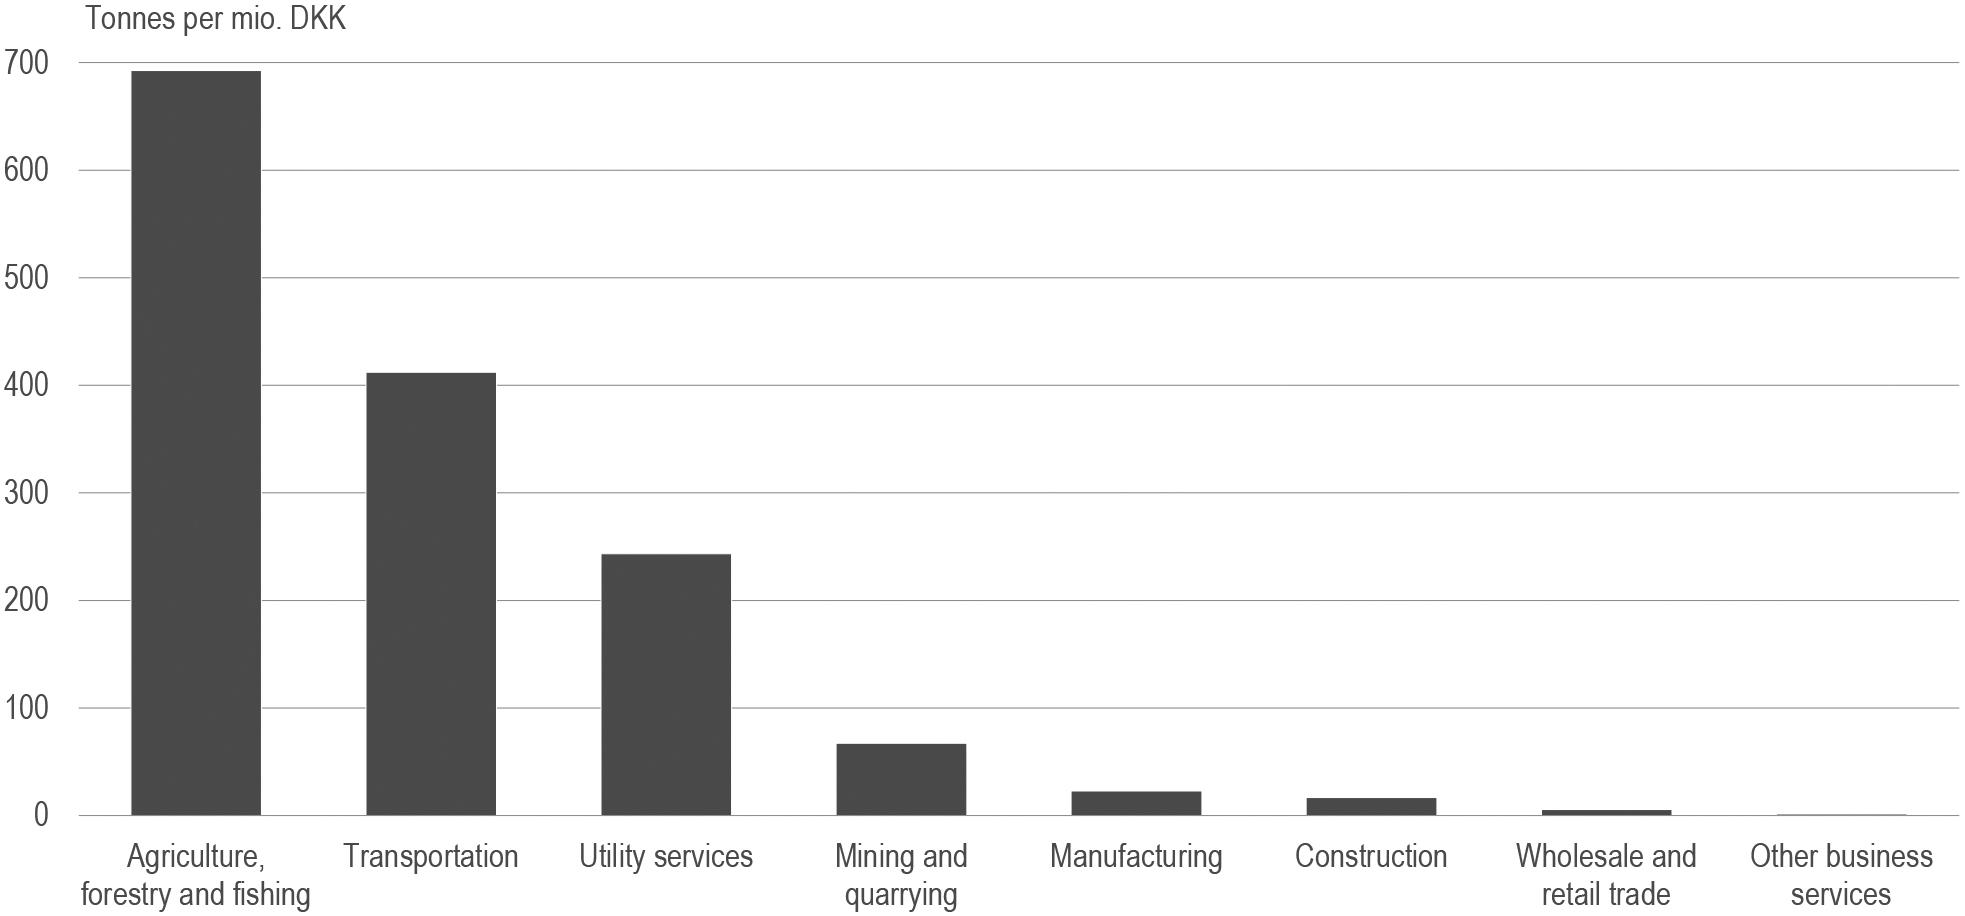
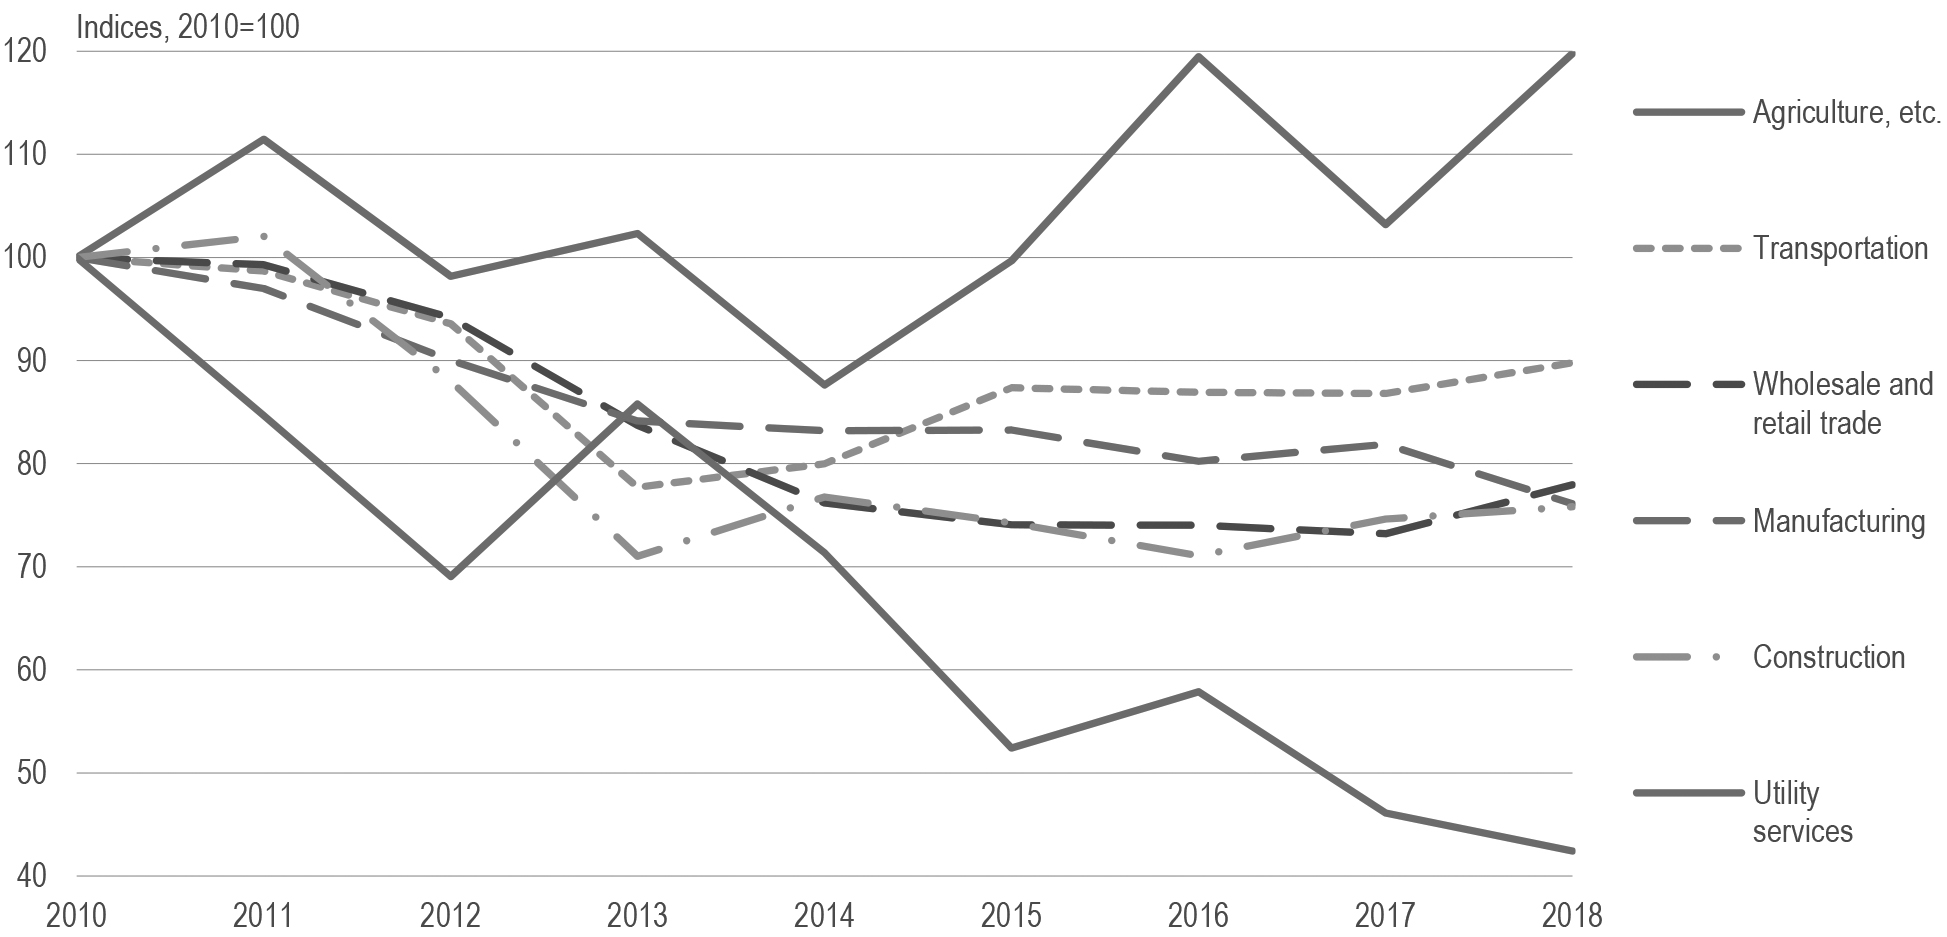
Figure 4.
Development in CO2-emission over Gross Value Added in Danish business sector, by type of industry. Source: Statistics Denmark, Emission statistics and National Accounts Statistics (GVA in constant prices). Note: The emission from renewable energy sources is not included. Bunkering abroad is included. Only selected types of industry are shown.
However, it is important to know, that 90 per cent of the emissions from Transportation is from international activities and thereby outside what should be measured according to the global agreements on reduction of emissions. Ignoring this part of emission in the picture for Denmark increases the relative significance of other types of industry significantly. Another angle is to use the definition of SDG indicator 9.4.1 more directly, i.e. calculating the emissions in relation to the value added. Similar figure is compiled at national level for comparison with other countries, but is can also be disaggregated by type of industry.
This analysis (Fig. 3) shows that CO2 emissions over gross value added (GVA), (shown in tonnes of CO2 emission per mio. DKK value added) are highest in Agriculture, forestry and fishing (692), while Transportation (412) is only number two when compared to the sectors GVA. The figures from Manufacturing (23) and Construction (17) is at a very low level using emissions per GVA, and trade and other services are almost invisible. However, the very different nature of business activity must be taken into consideration when interpreting these figures.
A third way to analyze the development is to look at the relative development in the specific sectors over time. This can be done as well for the total CO2 emissions by type of industry or by emissions over GVA.
Compiling the indices in CO2 emissions over GVA (Fig. 4), there is clearly a decreasing trend over time in most sectors. This is most significant in the utility sector, where emission over GVA has decreased by 58 per cent since 2010. This drastic change is mainly due to a steep increase in the use of renewable energy sources, but also higher efficiency in the energy production in general is part of the explanation. Construction and Manufacturing show a decrease at 24 per cent, followed by Wholesale and retail trade (22 per cent) and Transportation (10 per cent). An increase on CO2 emissions over GVA is observed for Agriculture by 20 per cent, affected by a relatively low GVA in 2018.
Explaining the development, better efficiency in the consumption of energy in most types of industry plays a vital role in the reduction of the CO2 emissions. SDG indicator 7.3.1 on energy efficiency (consumption over GVA) will highlight this, if broken down by type of industry. The varying development in the CO2 emission for Agriculture is, however, not a result of changes in energy efficiency, but is driven by varying results of harvest and GVA from year to year.
Similar analyses can be done on waste, water and energy, where the development can be followed and analyzed broken down by industry – as valuable information for the companies as well as for other decision makers. Further, in several domains, there are also statistics available for other countries, while comparisons also can be done for specific business sectors.
Also in other areas on sustainability it is possible to show results for the business sector’s performance. Several indicators could be chosen, but occupational injuries (SGD indicator 8.8.1 and C.3.2 in the UNCTAD GCI list) are selected as example for illustrating the possible use of the statistics.
In Fig. 5 the incident rate (non-fatal injuries per 100.000 workers per year) are shown for selected types of industry for 2017. It is obvious that the most dangerous jobs are in Construction and Transportation with over 3,000 incidents per 100,000 workers, followed by Manufacturing with an incident rate of approximately 2,000. Initiatives to improve sustainability from this perspective may, therefore, be of particular importance in these sectors, while initiatives seems less important in example Agriculture, Wholesale and retail trade and in Accommodation and food service activities, where the incident rates is between 1,000 and 1,500. It could be added, that the number of fatal incidents is at a level of 1 to 3 per 100.000 workers depending on type of industry.
Figure 5.
Occupational injuries in Denmark, by types of industry. 2017. Source: Eurostat, Health statistics. Note: Only selected types of industry are shown.
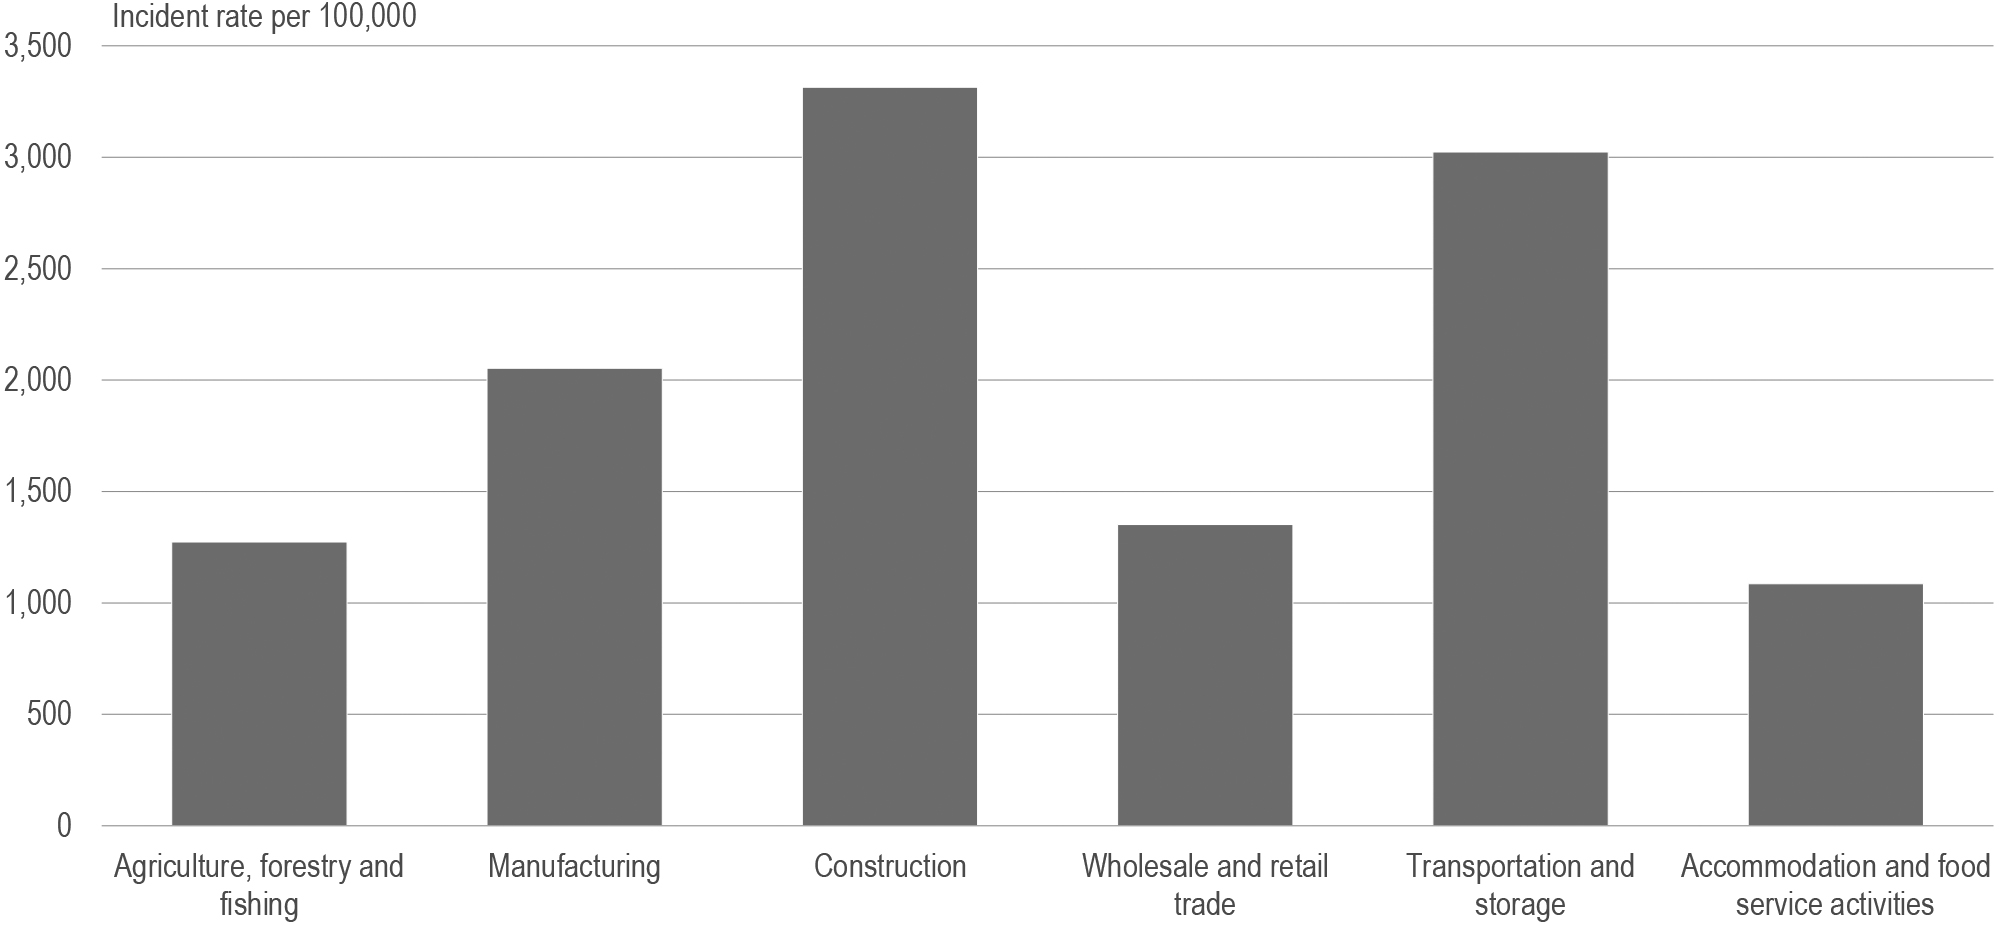
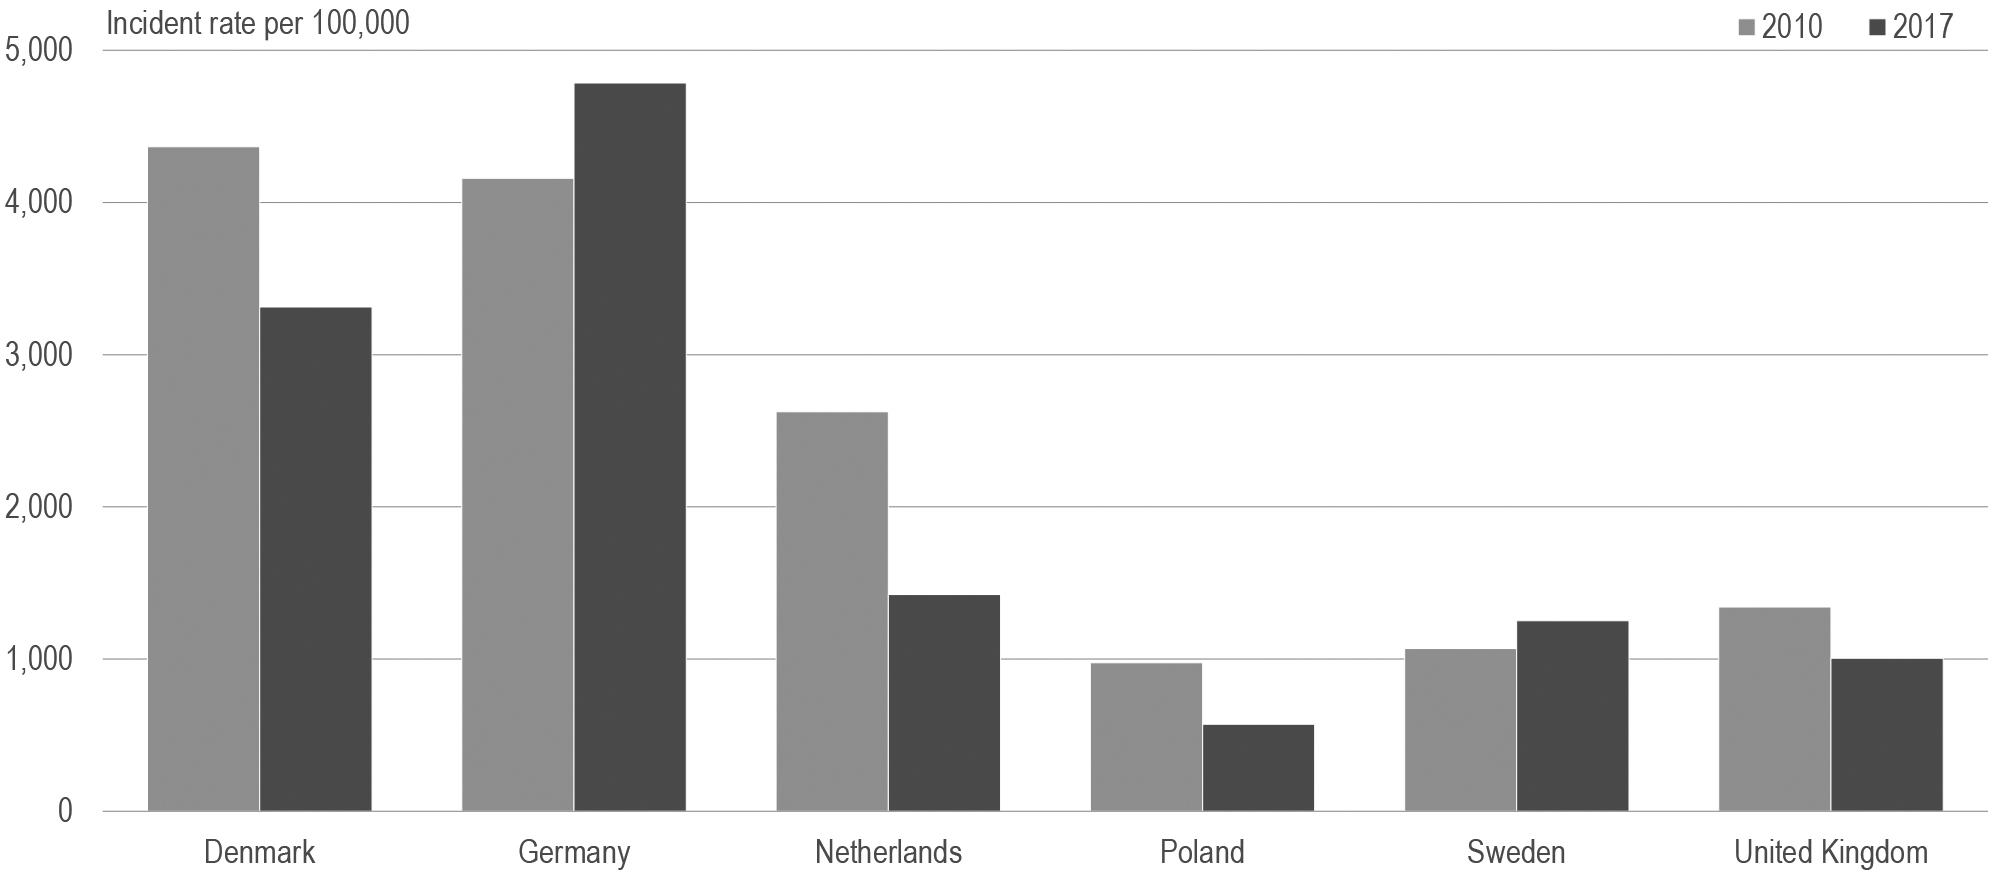
Figure 6.
Occupational injuries in construction activities by country. Source: Eurostat, Health statistics.
Looking at the time series, the figures show that much already has been done to improve health and safety at the work place. Within transportation the incident rate has gone down by 37 per cent since 2010 and within manufacturing and trade a decrease of 32 per cent is seen. The lowest decrease was in agriculture with only 13 per cent.
Similar statistics exist in other countries in the EU or the OECD, making it possible to monitor progress in sustainability on injuries across countries. As shown in Fig. 6, the incident rates among workers in Construction in Denmark and neighboring countries indicates that the most dangerous country for workers is Germany (2017: rate 4,800), and even has increased from rate 4,200 in 2010. However, also the situation in Denmark (2017: rate 3,300) indicates a need for awareness, even though progress has been observed, as mentioned earlier. It may be surprising that it seems much safer for the workers to work in the construction sector in The Netherlands (2017: rate 1,400), Sweden (rate 1,300), United Kingdom (rate 1,000) and Poland (rate 600). However, in-depth studies of metadata is needed when assessing the comparability, as the development in data depends on the legal situation and report practices in each country.
On the social part of the sustainability indicators also other elements can be covered by existing information – in particular on gender issues. In SD detailed statistics exist by type of industry. Women’s share of workers, their share of staff in leading positions and also on salary gaps are examples. Further, related to the institutional domain, statistics also exist on the composition of boards and top-management in the companies. By this, it is possible to show women’s share by type of industry.
4.3Outcome of the pilot survey
As previously mentioned, SD conducted in the spring of 2019 a pilot survey among larger enterprises. The main result was that two thirds of these were focusing at the SDGs in their business activities. The response also shows, that more companies will “be on board” within the next 2–3 years, meaning that a SDG approach is under consideration.
Figure 7.
Enterprises focusing on the SDG’s by industry. 2019. Source: Statistics Denmark, Pilot survey: How do large enterprises work with the SDG’s?
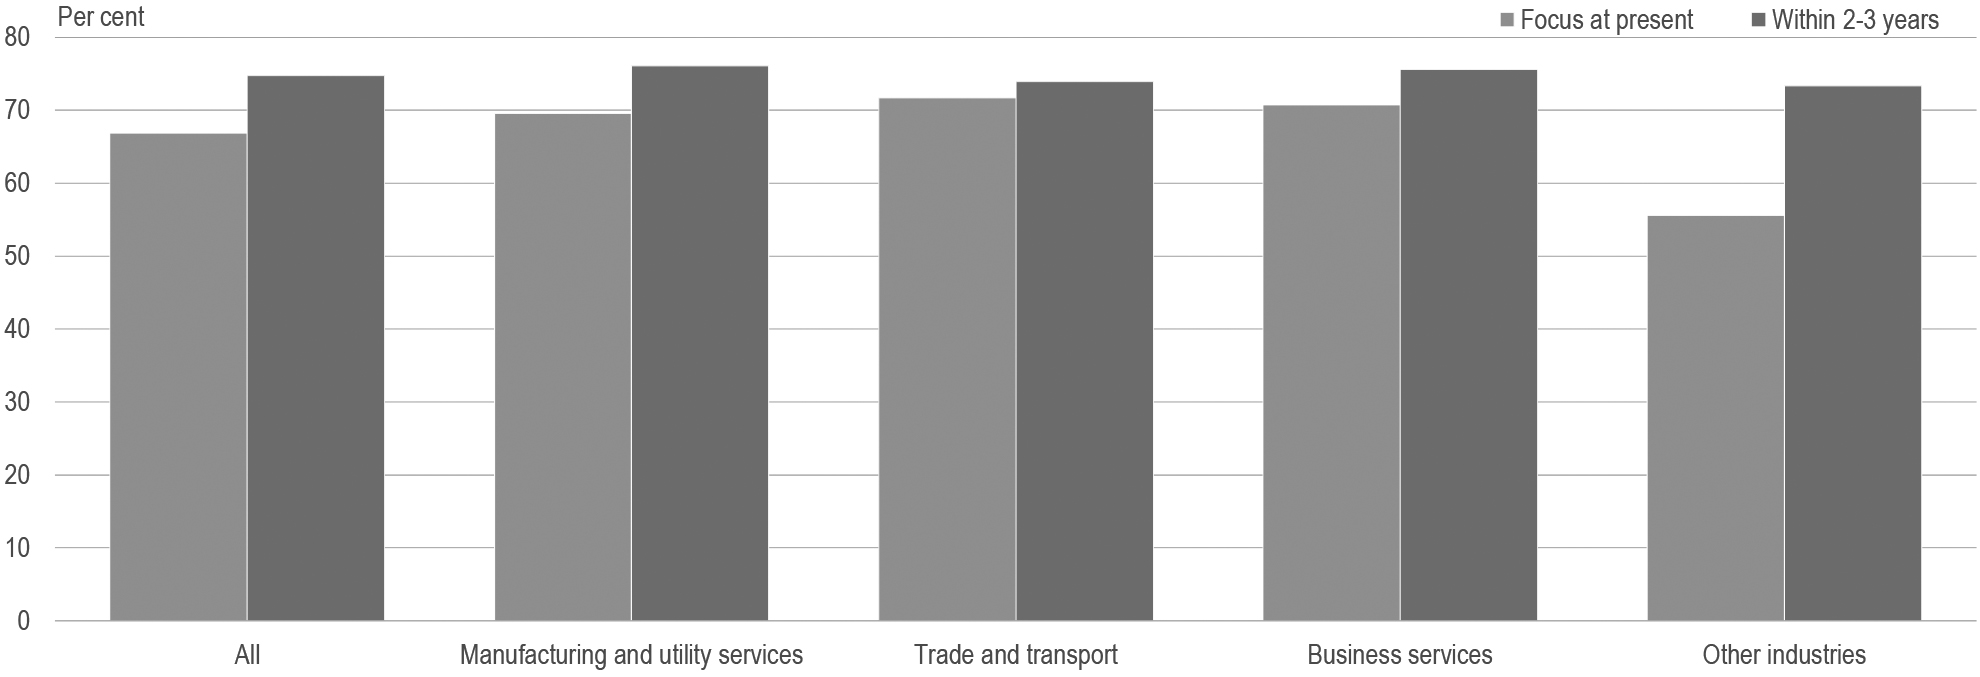
Figure 8.
Enterprises work on SDG’s, specific focus areas. 2019. Source: Statistics Denmark, Pilot survey: How do large enterprises work with the SDG’s? Note: The percentages are compiled as shares of all respondents.
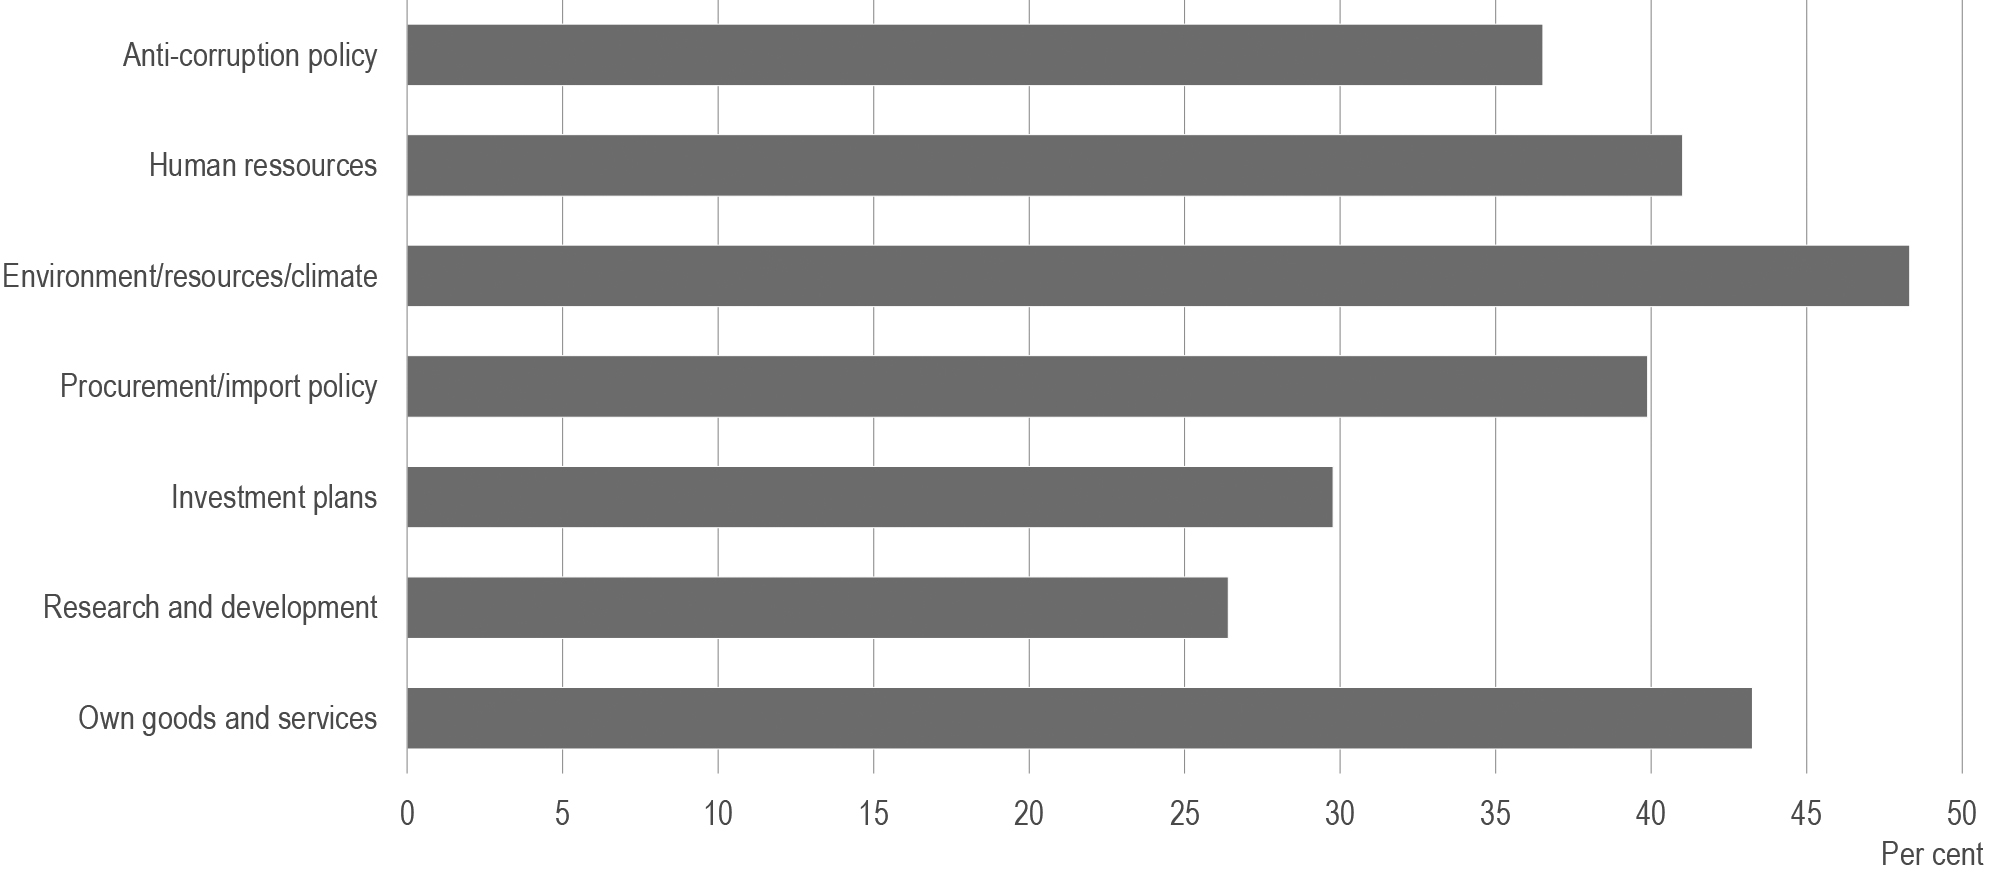
Figure 9.
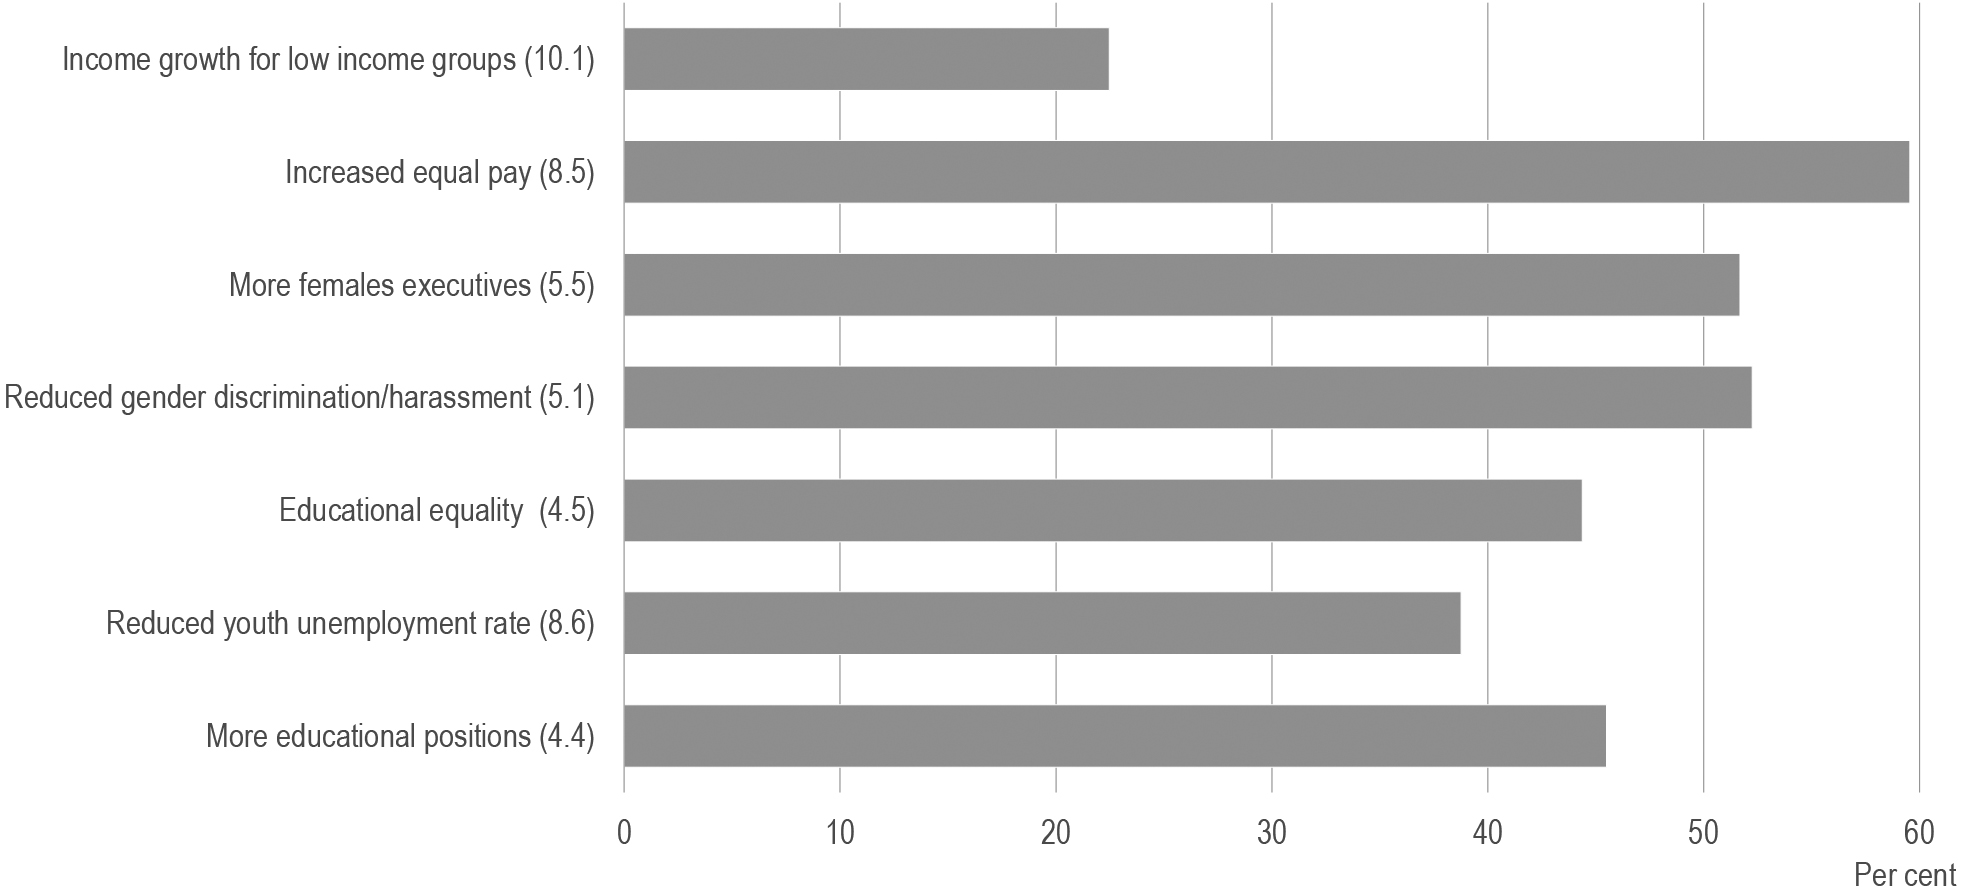
Enterprises work on SDG targets on inclusion and equality. 2019. Source: Statistics Denmark, Pilot survey: How do large enterprises work with the SDG’s? Note: The percentages are compiled as shares of all respondents. The figures in brackets refer to the numbering of SDG targets.
Another interesting result (also shown in Fig. 7) is that the level of attention is almost the same in all main types of industry. It is not only the case within the Manufacturing and utility services (70 per cent), where the business opportunities are quite high because of Denmark’s position on sustainable technologies. The high attention is also found in companies in Trade and transport (72 per cent) and Business services (71 per cent), where sustainability rather represents higher costs than higher earnings. These results indicate a very high level of responsibility towards the society.
Analyzed by policy areas in the companies, the highest attention was recorded at the environmental aspects (48 per cent), followed by a focus at the products and services provided by the companies with 43 per cent, as shown in Fig. 8. Number three in the ranking is Human resource (41 per cent), indicating that a “sustainability profile” is of high importance while attracting new staff or encouraging the staff to stay in the companies. The lowest in ranking are Research and development and Investment plans. However, hardly all responding companies have activities in all fields, why the comparing between policy areas has to be made with caution.
The response at the selected 21 SDG-targets showed high focus at reduction of CO2 emissions (target 9.4), at energy efficiency (target 7.3), efficient material consumption (target 12.2) and higher degree of reuse (target 12.5). For these targets more than 40 per cent of the responding enterprises answered “to a high degree” or “to a medium degree”. These results underlines that the Danish focus on sustainability is to a large extend on the climate issues.
Regarding the social elements of sustainable development, the most attention is at gender issues, meaning making society more equal between men and women. This focus is in particular clear as regard reduced pay gap (target 8.5), where 60 per cent on enterprises will work on this issue, which was even higher than the share focusing on greenhouse gas emissions (41 per cent). These results may be affected by the fact that gender issues are relevant for all companies, while CO2 emission is of low importance in some types of industry.
Further results (also shown in Fig. 9) is a high share of the companies has responded, that they are aware about how jobs and training can make their companies more active in creating an inclusive society. Forty-six per cent will work on More educational positions (target 4.4) and 39 per cent has focus at Reduced youth employment rate (target 8.6). This is of high relevance as one out of five in Denmark in the working age doesn’t have a work or are studying. Danish companies could contribute in offering those not employed a new chance to be a part of the labor market.
The lowest ranking target in the social field regards Income growth for low-income groups (target 10.1), where only 20 per cent answer “to a high degree” or “to a medium degree”. This is not surprising as this issue may be considered mainly an issue for collective agreements and general government to take forward, although the single enterprises could take action themselves.
For one of the selected 21 targets covered by the pilot survey, the positive response was very low. Only 2 per cent responded having activities on affordable medicines in developing countries. This response was expected, as the target only makes sense for companies in the medical industry. However, it would have been strange not having the target in the questionnaire. However, this reminds about the difficulty to design surveys relevant for all types of industry.
5.Strengths and weaknesses
SD has, as described above, built up a comprehensive approach to the work on SDG, focusing not only to provide data on the global indicators. It is of high priority to ensure a public interest in the matters, also from authorities and NGO’s. It is also an attempt to make the SDGs relevant to the business sector, by presenting existing statistics in a new way, by integration micro-data from surveys and administrative data and by collecting SDG-specific information. The following contains an overview of the strengths and weaknesses of the approach chosen to establish ‘SDG related business statistics’ in Denmark. The section is concluded by a brief assessment of the work done so far.
5.1Strengths
SD has access to a broad range of administrative registers that can be combined across areas, with survey data and with other data sources. This is clearly a strength when developing a new statistical area such as SDG activities of businesses. As the results in the previous chapter show, it is possible to draw a rather detailed picture of the SDG activities among Danish businesses using administrative data without collecting data directly from the businesses. The explorative phase of developing new statistics can thereby be carried out without collecting data from the businesses and thus without additional administrative burden.
This study has benefited from the collaboration with representatives from the business sectors, organizations, academia and authorities. This collaboration organized through a working group not only benefitted the interpretation of the data, but also ensured the stakeholders buy-in to the chosen approach. In addition, in particular the association FSR – Danish Auditors has been deeply involved in the work. The involvement of the business sector in the early phase of the study has not only guided the statistical work, but has also made the formulation of SDG related business statistics a collaborative project between the private and public sector. This is a collaboration that is expected to guide the future work in this area.
5.2Weaknesses
The weakness of using existing data is that this type of data is often only approximations of the official SDG indicators. An example is indicator 12.6.1 Number of companies publishing sustainability reports within the global goal Encourage companies to adopt sustainable practices and sustainability reporting. Not all Danish companies are legally obliged to report this information to a public authority. However, companies within specific size classes have to disclose reports on Corporate Social Responsibility, and the number of these companies will for the time being be used as an approximation of 12.6.1. When such approximations are robust they can be used to monitor the development over time in a given domain within a country. However, with national differences in definitions cross country comparisons may be hampered.
It is not possible to cover all business related SDG indicators within the global goals using existing data. A mean to fill in the gaps is primary data collection among representative samples of businesses. The pilot survey conducted in Denmark in 2019 is an example of this. There are several weaknesses with this approach. Firstly, it is difficult to formulate questions on the importance of the SDG agenda in the business that can be answered objectively. In many cases the businesses’ replies will reflect their strategy or intention and not their actual behavior. Secondly, the assessment of what is sustainable behavior may be based on comparisons with the peers of the business and therefore differs across sectors and changes over time. For instance, in a male dominated sector the self-assessment of a company with only a few women in managerial positions may be that they fulfill a goal of gender equality. If the company operates in a female dominated sector the self-assessment may be that they do not fulfill the goal.
Thirdly, and most importantly, a value chain approach, as applied by the UN Global Compact, should be followed to the extent possible. This implies that indicators on for instance increased use of renewable energy should be answered for the whole value chain the business is part of and not only the local unit participating in the survey. The experience from the dialogue with businesses in Denmark is that it will be very difficult if not impossible for most businesses to provide these value chain related data. Apart from emissions, indicators on gender equality, decent work and responsible production may be costly for the businesses to collect from the value chain and disseminate for statistical purposes.
Finally, it should be noted that sampling may be a challenge. SDG activities come in many forms and may be relevant for all businesses independent of size and sector. Thus, a comprehensive questionnaire and a large sample may be needed to provide robust statistics. This will be a costly exercise for the statistical institutions to conduct and for the business sector to comply with.
6.Perspective for future work
In terms of developing official statistics that can be used to monitor contributions of businesses towards sustainable development SD is still in the preliminary phase. However, the foundation has been laid and several ways forward have been identified that can strengthen the relevance, accuracy and robustness of the statistics, fill in the gaps and ensure a broader coverage of the SDG activities undertaken by businesses.
Information in the administrative registers to which SD currently has access have been analyzed in detail and probably there is not substantial relevant information that remains to be identified. The information may be utilized further by combining the various registers, but in order to make significant progress additional sources of data are needed in order to make significant progress.
The Danish Business Authority is working on extending the annual account reporting requirements to include information relevant to SDG indicators. The reporting will be in the XBRL format making data accessible for statistical purposes. SD follows this work, which may be a valuable data source on SDG statistics in the future. Closely related to this is the work undertaken by UNCTAD and others on defining SDG related statistics and indicators that are applicable globally. SD also follows this line of work by participating in the UNCTAD conferences and presenting the needs from the perspective of statistical institutions.
Traditionally, business statistics produced by the statistical institutions are based on data collected directly from the businesses. The pilot survey on SDG activities conducted by SD had some weaknesses, but could certainly be a central source of data for SDG related business statistics. Dedicated SDG related business surveys are expensive, but resources may be forthcoming with the increasing demand for SDG related business statistics from the general public, business sector and government in the coming years.
A less expensive alternative to specific surveys will be to add a key questions to existing surveys, for instance in the Structural Business Statistics survey SD has tried this approach when developing other new areas such as on the sharing economy. Progressively, businesses may be willing to self-report on their SDG activities with sustainability becoming a decisive parameter in their reputational risk assessments, their branding and the financing of the business operations. SD tested the willingness to self-report by setting up the SDG homepage for businesses. The number of businesses that self-reported was limited, but this may have been due to the timing of the initiative as the interest in the SDG agenda was limited when the test was done (2018).
To sum up, the future work of SD on the data input side is to utilize the administrative registers even more, to work closely with other authorities and organizations to ensure new requirements on business reporting can be used for statistical purposes, and to work on expanding the collection of primary SDG data as part of SDs official work programme.
On the data output side actions are taken internally to highlight the SDG agenda in our releases of existing
statistics and publications. An example is the press release of the business statistics on executive board members, where it was highlighted that part of the statistics was related to the SDG on gender equality, including women’s participation in public as well as private management (target 5.5). Finally, publishing specifically on businesses activities towards sustainable development is planned in the autumn of 2020. This will show what can be done statistically in this area with existing statistics and also highlighting what cannot be covered. The work on this is again planned to also involve representatives from the business sector and academia.
References
[1] | Den generelle SDG-side https://www.dst.dk/en/Statistik/Sdg Pilotundersøgelsen https://www.dst.dk/en/Statistik/Sdg/aktiviteter/virksomheder/pilot. |
[2] | UNCTAD-rapporten bør bestemt nævnes Guidance on core indicators for entity reporting on contribution towards implementation of the Sustainable Development Goals https://unctad.org/en/PublicationsLibrary/diae2019d1_en.pdf. |
[3] | Skal vi nævne manualerne til nationalregnskabet og til det grønne nationalregnskab (forslag fra reviewer 2)? |
[4] | UN https://www.un.org/sustainabledevelopment/sustainable-development-goals/ Sustainable Development Goals. |
[5] | UNCTAD https://unctad.org/en/PublicationsLibrary/diae2019d1_en.pdf Guidance on core indicators for entity reporting on contribution towards implementation of the Sustainable Development Goals. |
[6] | Statistics Denmark: https://www.dst.dk/en/Statistik/Sdg/aktiviteter/virksomheder Enterprises and SDGs. |
[7] | Statistics Denmark: https://www.statbank.dk/statbank5a/default.asp?w=1536 Statbank Denmark. |
[8] | Eurostat: https://ec.europa.eu/eurostat/data/database Your key to European Statistics. |

