
SNA and beyond: Towards a broader accounting framework that links the SNA, SDGs and other global initiatives1
Abstract
The System of National Accounts (SNA) has adapted, and will adapt, as economic, social and environmental conditions change. The revision process of the SNA2008, which is now underway, will take place in the context of developments such as globalization, digitalization, climate change, biodiversity loss, inequality as well as the COVID19-pandemic. The new SNA will have to make clear how the economy relates to concepts such as wellbeing, sustainability and equity and will also need to be linked to major global initiatives such as the Sustainable Development Goals (SDGs).
I propose a broad accounting framework for Wellbeing, Sustainability and Equity (WiSE). This provides a wider context for the System of National Accounts (SNA) and links to the other frameworks such as the Sustainable Development Goals, and other global initiatives such as the Better Life Initiative (OECD), Changing Wealth of Nations (World Bank) and the Inclusive Wealth Index (UN).
The WiSE framework is not a new system, but rather a combination of existing accounting frameworks which have been proposed in the last five decades. The paper starts off by formulating principles to guide the work on the broader framework. Subsequently, seven accounts are proposed which quantify the various dimensions of the economic, societal and environmental systems. This interdisciplinary accounting framework involves knowledge from many scientific disciplines and multiple units are used (mass, energy, people, time, money etc).
The most controversial part of any discussion about the future of the SNA is the valuation of non-market phenomena such as unpaid household work/care or environmental damages. This paper argues that the discussion is too focused on methods derived from welfare economics. Rather than valuation we should be focusing on evaluation methods from many scientific disciplines which help to assess progress towards wellbeing, sustainability and equity. This interdisciplinary perspective should also guide our thinking to select key indicators to replace GDP.
1.Introduction
1.1Centuries of debate about The Economy
A key question concerning economic statistics is the future of the System of National Accounts (SNA). The SNA is the global accounting framework to measure economic activity, economic wealth and the general structure of the economy. It rapidly proliferated all over the world after the Second World War and its key indicator, the Gross Domestic Product (GDP), has become the most influential indicator in society.22 The success of the SNA/GDP is characterized by Nobel Prize Winners Paul Samuelson and William Nordhaus as: “while the GDP and the rest of the national income accounts may seem to be arcane concepts, they are truly among the great inventions of the twentieth century.”33
The way we measure the economy has been debated for centuries. Since the first national accounts in the late 17th century, the “boundaries” of “the economy” have been disputed [2, 3, 4]. In the first couple of centuries there were debates about which sectors were productive and which were not. After the Second World War, when the first edition of the SNA was drafted, the inclusion of government services was a major point of contention [5, 6]. In the end, most countries adopted the Keynesian-inspired SNA which includes government. However, countries with centrally planned economies used a different system called the Material Product System, which focused on material goods rather than services. It was only after the collapse of the Soviet Union that these countries adopted the production boundaries, including all services, defined by the SNA1993.
All in all, in the 400+ years history of national income accounting, there has only been a globally agreed boundary of “the economy” for the last 27 years. This historical perspective makes it clear that “the economy” is not an objective phenomenon: it is a convention which reflects the scientific, empirical and socio-economic situation of that era. Debate about the boundaries therefore continues and will (and should) never cease.
In the discussion of the boundary of the economy, specific issues have been raised. These include unpaid household work/care as well as other time use categories. Certain activities, on which people spend quite a bit of time, are argued to be part of production (e.g. unpaid household work/care) or welfare (leisure). Including these items can have a significant effect on GDP [7, 8]. The proponents of these adjustments argue that current conventions lead to incorrect interpretations of societal developments. For example, the exclusion of unpaid household work/care or childcare in the SNA leads to an underappreciation of the contribution of woman to society [9, 10, 11].
The exclusion of environmental damages or resource depletion from the SNA has also been criticized. Problems such as resource limits, acid rain, ozone depletion, climate change and biodiversity loss have made it abundantly clear that the way we measure the economy is missing important phenomena affecting our current wellbeing and that of future generations (i.e. sustainability). Many authors have also pointed out the problems related to some accounting rules of the SNA. For example, some environmental disasters, such as oil spills, are “good” for the economy because the clean-up leads to greater economic activity.
Measuring the economy is also increasingly problematic because of economic phenomena such as digitalization and globalization. For example, multinationals can use their global presence to lower their tax burden through transfer pricing or other means. The profit thereby no longer is an indication of economic activity but rather an administrative phenomenon, which affects GDP. A famous example is the upward revision of the Irish GDP by 26.3% which was due to the globalization activities of multinationals [12]. In the case of digitalization, the welfare impacts of free internet services by consumers (search engines, encyclopedia, social media, free games) and various other services have been quantified [13, 14].
2.Decades of debate about gross domestic product (GDP)
A lot of the criticism of economic measurement has focused on the key indicator of the SNA, Gross Domestic Product (GDP). GDP is a measure of economic activity, given the production boundary agreed upon in the SNA. Yet the societal interpretation of GDP has become so much broader. GDP has become the de facto measure of success of a nation although the SNA handbook explicitly warns against this interpretation:
‘GDP is often taken as a measure of welfare, but the SNA makes no claim that this is so and indeed there are several conventions in the SNA that argue against the welfare interpretation of the accounts.” [15]
Despite this clear guidance, the GDP is too-often seen as the key benchmark indicator of society. On the one hand it is viewed from an intertemporal perspective though the change in “real”, price-adjusted, GDP: economic growth. It is frequently taken for granted that economic growth is “good” and recessions are “bad”. The second, inter-country perspective, quite often leads to the conclusion that a country with a high GDP (or economic growth) is successful and one with low GDP (growth) is unsuccessful. There is ample literature which disputes this interpretation and discusses the many reasons why GDP should not be the “key performance indicator” of society [16, 17, 18, 19, 20, 21].
The quest to find an “alternative” to GDP, a measurement that would better reflect societal progress, took off in the early 1970s.44 The first example of a “Green Accounting” index, the Measure of Economic Welfare (MEW), was created by Nordhaus and Tobin in 1972 [22]. The starting point of this approach is macro-economic data, but certain SNA elements are removed or adjusted (e.g. divorce lawyers, durable goods). In addition, environmental and social “externalities” which fell outside of the SNA boundary, are monetized and included in the overall index. For example, environmental damages are subtracted from the macro-economic data while increases in leisure time are added. The MEW later evolved into Green Accounting indicators such as the Index for Sustainable Economic Welfare (ISEW) [23] and the Genuine Progress Indicator (GPI) [24].
For much of the 1970 and 1980s, the idea of Green Accounting dominated the “Beyond-GDP” space. Starting from the early 1990s new insights emerged. For example, indexes that were not based on welfare economics started to emerge, the most notable of which was the Human Development Index (HDI) which was introduced in 1991. It was developed together with Nobel Prize winner Amartiya Sen as it was based on his capability approach [25]. In addition, the measurement of subjective wellbeing, which had already been given a boost in the 1970s, started to expand rapidly after the 1990s/2000s.
A fundamental shift which occurred in the early 1990s was the introduction of indicator “dashboards”. This development was stimulated by Brundtland report in 1987 [26] and the subsequent First “Earth Summit” in Rio de Janeiro in 1992. The Brundtland report was instrumental in coining the phrase “sustainable development” which was defined as “Sustainable development is development that meets the needs of the present without compromising the ability of future generations to meet their own needs”.
At the Rio Summit governments and international institutes put their weight behind the term “sustainable development”. One of the was agreed at the Earth Summit was to start measuring this phenomenon. The UN Commission for Sustainable Development came up with a set of indicators, not a single index, to measure Sustainable Development [27]. The goal was to offer countries a longlist of indicators from which they could choose to suit their own situations. While the CSD indicators were eventually discontinued, they did stimulate the use of indicator sets amongst governments and international institutes all over the world [28]. The UN process on sustainable development evolved into one of the most influential Beyond-GDP initiatives: the Sustainable Development Goals (SDGs). This is a set of goals and targets that was agreed globally in 2015.
What happened to Green Accounting after 1990s? The original indicators such as ISEW and the GPI continue to have a lot of support, especially amongst academics. The most significant institutional traction has been in the United States, where laws have been passed to measure the GPI in states such as Vermont and Maryland. However, the discussion about intertemporal sustainability in 1990s stimulated another economic method referred to as the “capital approach”. This approach makes a distinction between current welfare and future welfare. Future welfare, sustainability, is dependent on the amount of assets (economic, natural, social and human capital) that are left to future generations. An increase in capital, which is referred to as Genuine Savings [29] or Adjusted Net Savings [30], is interpreted as an indication of improved sustainability. This monetary valuation of all capital stocks has been used in the Comprehensive Wealth calculations of the World Bank [30] and the Inclusive Wealth Index of the United Nations [31]. It also the basis of the Depletion-Adjusted Net Value Added indicator, which is part of the System of Environmental Economic Accounts (SEEA) [32].55
At the same time Green Accounting was also criticized for the monetization techniques that are used [33]. Several international working groups and task forces, notably the Stiglitz-Sen-Fitoussi commission, therefore advised against this practice [34, 35, 36]. Their conclusion was to keep using the capital approach theory, but to quantify the development in their physical units, rather than money. Their recommendation was therefore to create two indicator dashboards: one for “here and now” (wellbeing) and one for “later” (sustainability). The Better Life Initiative (BLI) of the OECD also adopts this approach as well as several countries (e.g. The Netherlands, Belgium and New Zealand).
Table 1
Beyond-GDP Methodologies (International Institute)
| Index | Indicator dashboard | |
|---|---|---|
| Conceptual | Measure of Economic Welfare Index of Sustainable Economic Welfare Genuine Progress Indicator Genuine Savings/Adjusted Net Savings/Comprehensive Wealth (World Bank) Inclusive Wealth Index (UN) Depletion-Adjusted Net Value Added* | Stiglitz-Sen-Fittoussi Commission (OECD) CES recommendations (UN/OECD/EC) Better Life Initiative (OECD) |
| Non-conceptual | Human development index (UN) | Sustainable Development Goals (UN and other international institutes) |
Source: Adaptation from Hoekstra (2019). *This is a green accounting index from the SEEA which is the result of collaboration of the UN, EC, FAO, IMF, OECD and World Bank.
Table 1 shows the four methodological approaches to Beyond-GDP measurement. There are two dimensions: 1) an index vs. an indicator dashboard 2) A conceptual foundation or a non-conceptual basis. Some approaches have been institutionalized by international institutes (see brackets in the table), with the World Bank preferring capital-based monetary aggregates and the OECD preferring conceptual dashboards. The UN has initiatives in all four methodological schools, but two influential ones are non-conceptual (HDI66 and SDGs). The SDGs stand out because they are supported by many international and national organizations, NGOs and businesses.
2.1Objectives of this paper
The previous sections have shown that the measurement of the economy has shifted as societal, economic and environmental conditions have evolved. The world is currently experiencing important developments such as the COVID19 pandemic, climate change, biodiversity loss, inequalities within and between countries, growing populism, globalization and digitization. At the same time, this is the era of “big data” in which data is becoming increasingly abundant and detailed (e.g. micro-data about individuals and companies as well as detailed spatial information). How will these phenomena affect the way we measure the economy and how will it relate to developments in society and the environment? What key indicators will emerge from these conversations? What new data collection strategies and what policies might be applied?
The last version of the SNA was published in 2008. Given the many changes in the world it stands to reason that the major international institutes have started a revision-process. The Inter-Secretariat Working Group on National Accounts (ISWGNA), which guides this process has formed three sub-groups to discuss major areas which require further development: 1) Globalization 2) Digitalization and 3) Well-being and Sustainability. The first 2 groups are related to what is sometimes referred to as the “core”, the SNA as it is currently defined. The third group deals with the relationship between the SNA and issue that clearly go beyond current economic measurement. This subgroup on wellbeing and sustainability has identified six topics which need further illumination:
• Unpaid household work
• Distribution of household income, consumption, savings and wealth
• Environmental-economic accounting
• Education and Human Capital
• Health and social conditions
• A broader framework for capturing economic activities, well-being and sustainability
The aim of this paper is to contribute to the last issue. What broader accounting framework might conceivably capture the most important phenomena of the economy, society and environment? How does it relate to the current SNA? Could all these dimensions be captured by a coherent measurement system? Do we need to think of a new system or has enough thought been given to this field? How does the framework relate to major international initiatives such as the Sustainable Development Goals and other global initiatives? How might big-data play a role in designing and implementing this broader system? These are some of the questions that will be addressed in the next few sections.
In Section 2, the principles will be discussed which should guide the discussion of the broader framework. Section 3 provides a high-level description of the seven accounts of the broader framework to measure Wellbeing, Sustainability and Equity (WiSE). Section 3 also discusses evaluation of the developments and the key indicators which should replace GDP. In Section 4 the link between the WiSE framework to the major global initiatives, such as the SDGs and projects of the OECD, World Bank and UN are discussed. Section 5 concludes.
3.Principles for broader accounting framework
3.1Do not start from scratch
The work on the broader accounting framework should be informed by the decades of thinking that has already gone into this topic [28, 37]. Some of the founding fathers of modern national accounting, such as Simon Kuznets, already suggested adaptations to the system at a very early stage [5]. Others, such as Richard Stone suggested extension such as the System of Social and Demographic Accounts proposed in the early 1970s [38, 39]. Environmental Accounting took off in the early 1990 and eventually led to the adoption of the SEEA by the UN Statistical Commission in 2014. Human capital theory, which was developed in the 1960s [40], has also been integrated into national accounts frameworks [41, 42]. Natural and human capital data collection is proliferating rapidly across the globe. For example, it is expected that this year, 2020, there will be around 100 countries that have implemented one of more accounts of the SEEA.77
This is not an exhaustive list of the research and data which the broader framework should be based on. However, it makes clear that designing a broader system should not start from scratch. It is more a matter of synthesizing the empirical, statistical and scientific knowledge that it already out there. Many Nobel Prize winners, eminent scientists, prominent statisticians and institutes have thought and implemented accounts to complement or adjust the SNA. The only minor shift in mindset is to stop seeing them as individual extensions to the SNA and start viewing this as an overall framework. In other words, a “system of systems” is needed, which encompasses the environment, societal and economic systems.
3.2A framework for measurement & policy
One of the key factors that has made the SNA so successful is that it is a measurement framework which provides an empirical basis for policy (macroeconomics). The SNA-process after the second world war helped this fledgling policy science by harmonizing terminology and data at the global level. Just imagine that countries would have different national accounting conventions and terminology (as was the case in the 1930s.) In such a scenario, it would be difficult for macro-economists from different countries to discuss their findings, models or compare country performance. It seems likely that the overall body of knowledge of macroeconomics would be less advanced as it is today.
There are three separate dimensions to the macro-economic community:
1. Policy Science. The community includes academic macro-economists and researchers that work at economic policy institutes, ministries, (central) banks or businesses. One of the main research goals of these researchers is to understand economic growth and to create policies that stimulate it.88
2. Accounting Framework. The community also includes statisticians working on the SNA at statistical institutes (or central banks or finance ministries). They provide information about economic transactions, assets and the economic structure, which provides the empirical foundation of the policy science. The SNA acts as a global “dictionary”, which defines all the relevant macro-economic terms. It also formalizes the relationship between core variables (e.g. Y=C+I+G+X-M).
3. Key Indicators. The outputs of the community are usually summarized in a few powerful SNA-indicators which provide an overall picture of macro-economic developments.99 Some examples include Gross National Income (GNI), labor compensation, labor productivity and savings rate. The indicator that attracts most attention is growth in real GDP. This is used as a summary indicator for statistical publications but is usually also the key indicator in scenario models or other policy applications.
The success of the macro-economic community cannot be ascribed to just one of these dimensions. The dominance of the macro-economic thinking is not due to policy applications or measurement (SNA/GDP). The community is successful because of macro-economic policy and measurement have developed together. A broader framework should therefore not just be based on measurement, but also on policy models, applications and tools.
3.3A framework without “externalities” or “satellite accounts”
The dominance of economic thinking in society has led to “the economy” being a primary focus for governments and the general public. The SNA is therefore seen as the “core” account. By implication other societal and environmental developments are peripheral, which is also reflected in some economic terminology. For example, the term “externality” refers to a cost or benefit that affects a third party who did not choose to incur that cost or benefit. These are often costs or benefits in the social and environmental domain. Again, the implication is that these externalities are peripheral, not part of the core [21]. A similar term is the “satellite account” which became commonplace during the discussion about the SNA1993. At that time, environmental issues and sustainable development were increasingly discussed and it was decided that the SNA “core” would not deal with them. Instead, the SNA1993 allowed for “satellite accounts” which use similar conventions as the SNA to create accounts for policy-relevant areas such as the environment, tourism, labor or unpaid household work/care.
One of the most successful satellite accounts is the System of Environmental and Economic Accounts (SEEA). The drafting of this handbook took from the early 1990s to 2012 and by the end of that process the SEEA practitioners no longer were comfortable with the term “satellite account”. The underlying sentiment is that this term does not do justice to the importance of the environment. The SEEA was subsequently been adopted as a global statistical standard, i.e. on an equal footing to the SNA.1010
The idea that the economy, society and environment are three systems, with many interlinkages, is common in sustainability science. The economy is part of society. And society is part of nature. All three interdependent systems have their own dynamics and scientific disciplines to help understand how they function. If there is any hierarchy to be imposed many would argue that nature and society are higher-level systems than the economy.
3.4A framework based on interdisciplinary accounting
Accounting is often associated with money. Bookkeeping is associated to money units since Lucas Pacioli formalized the financial accounting practices of the Merchants of Venice in 1494 [43]. However, an important lesson from the SEEA framework has been that other units of measurement, such as mass, can be used as accounting units. The SEEA process made clear that physical and monetary accounting are two dimensions of reality. Market transactions of goods, such as cars or food, can be accounted for in both volume as well as monetary units. The extraction of oil creates monetary revenues as well as reduction in the physical reserves of fossil fuels. However, in other cases the physical flows do not have any monetary value, such as air emissions. The bottom line as that interdisciplinary accounting implies that stock/flow accounting systems can be conceived of in many different units. Examples include:
Economics (Money)
Financial reserves (year 0) + Revenues – Costs = Financial reserves (year 1)
Resources (Mass/Energy Equivalents)
Oil reserves (year 0) + Discoveries – Extraction = Oil reserves (year 1)
Demography (People)
Population (year 0) + Births – Deaths – Net migration = Population (year 1)
Climate Science (Mass)
Atmospheric Carbon (year 0) + Emissions – Uptake oceans – Uptake vegetation = Atmospheric Carbon (year 1)
The broader system should be based on interdisciplinary accounting in multiple units. Viewed from this perspective, a climate scientist or demographer could be considered “climate accountant’ and “population accountant” respectively. This is also the view of one of the founding fathers of the SNA, Richard Stone, said in his Nobel acceptance speech in 1984: “By organising our data in the form of accounts we can obtain a coherent picture of the stocks and flows, incomings and outgoings of whatever variables we are interested in, whether these be goods and services, human beings or natural resources, and thence proceed to analyse the system of which they form part.”1111
3.5A framework based on interdisciplinary evaluation
A core debate in Beyond-GDP has been the role of valuation, and this has often been reduced to the issue of finding a monetary value for a non-market phenomenon. For example, environmental pressures do not have a market “price” but environmental-economists have developed methods to provide empirical estimates of the gains or losses in “welfare” in monetary terms. These approaches are based on welfare economics and involve combining physical data with monetary valuation estimates. E.g. CO2 emissions and the “social cost of carbon”; time spent on unpaid household work/care and an imputed price. Similarly, the value of a statistical life, a monetized quantification of the value of a year of human life is used in health economics. An impressive body of literature has emerged with which to measure shadow prices for the environment, health and many other phenomena [44].
There are many scientists who are critical of using monetary values while others defend their use [45, 46]. This is not just an academic debate because it has also spilled over into institutional discussions. For example, the Intergovernmental Science-Policy Platform on Biodiversity and Ecosystem Services (IPBES) experienced a significant setback in its deliberations in 2019. Opponents of the term “Ecosystem Services” preferred the term “Nature’s Contribution to People”, because it was less economic and more reflective of a broader evaluation of the role of nature.1212 An IPBES group has been set up to look at valuation in a much broader fashion. At the same time, there is a discussion about whether monetary values should be measuring the welfare impacts or should be measured at “exchange values”.1313
This paper argues that the broader system should not focus on welfare-economic methods alone, but should allow for multiple perspectives on valuation. There are fields of economics, such as behavioral economics, happiness economics, neuro-economics which could provide alternative valuation perspectives. But valuation is already a viewpoint which is anthropocentric in its focus. I argue that we need a broader evaluation of the environmental, social and economic systems. For example, there are insights from natural sciences, such as planetary boundaries, that can contribute to evaluating the prospect of long-term sustainability. One of the valuable lessons of the SEEA is that an accounting system can separate the physical accounting (mass, time, people etc) from evaluation, so that it is possible to link the physical data to multiple evaluation theories.
3.6A framework with regional, national and global scopes
Official statistics are primarily associated with data at the national level. This spatial scale is logical because, in many countries, governance is most powerful at the level of the nation-state. However, there are many urgent challenges that require data at a different spatial scale. Issues such as migration, globalization and the spread of the COVID-19 pandemic have shown us how interconnected our world is and require global perspective. A prime example is economic globalization and integration of trade which accelerated from the early 1990 to the financial crisis of 2008/9. Formulating policies without addressing the role of international trade and economic conditions around the world is no longer an option [47, 48].
In the case of the environment, a global perspective is also needed. There is a need to understand the relationship between the environmental flows caused by society and the economy and how they impact global material balances and natural cycles.1414 It is also necessary to understand how consumers in one country can affect environmental pressures in other countries and how globalization is affecting these environmental “footprints”.
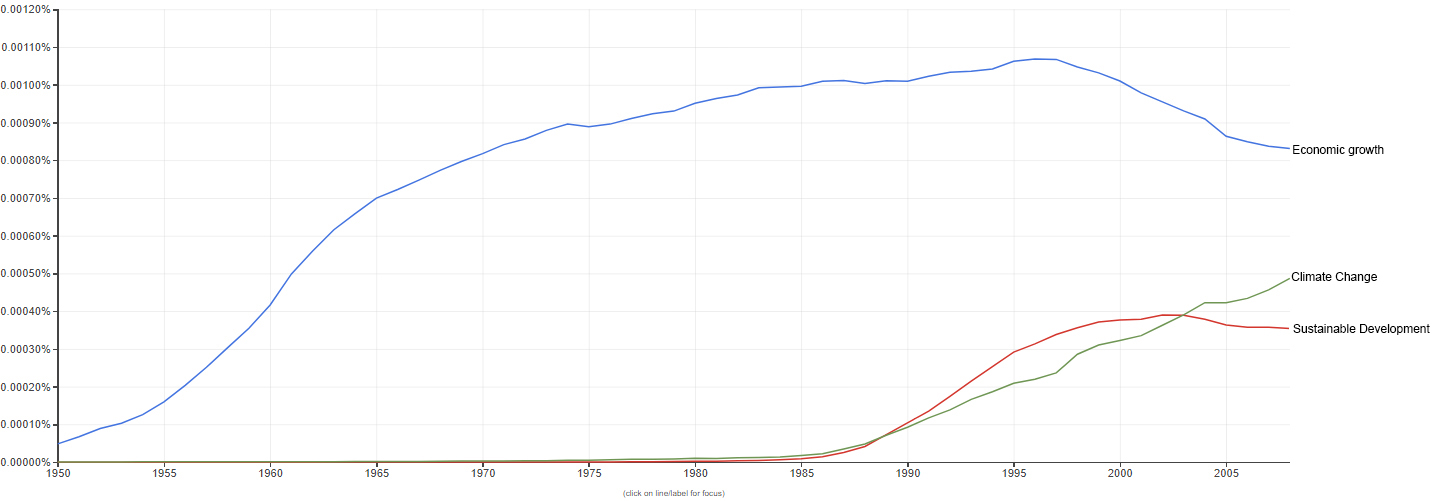
Figure 1.
Prevalence of “economic growth”, “sustainable development” and “climate change” in books (1950–2007). Source: Google Ngrams
At the same time there are many policy actions which require data at regional or even local levels. The system should be able to cater for additional spatial detail, where it is necessary. Again, the SEEA has gained a lot of experience, especially the Ecosystem Accounts, in translating detailed satellite/GIS data into actionable information, while maintaining its link to national accounts.
3.7A framework which generates new narratives
Measurement is not a neutral activity. What you measure becomes more visible and affects societal discourse. Nobel Prize winner Robert Shiller, in his book Narrative Economics shows that society’s narratives can have real influence on the decisions of individuals, companies and governments [49]. Narratives help to shape society. One way in which Shiller analyses narratives is by looking at the prevalence of words for long time periods. Figure 1 shows that prevalence of the words “economic growth”, “sustainable development” and “climate change” for the period 1950–2007. The figure is based on the Google Ngrams database which has an electronic repository of books starting from 1800.
Table 2
Macro-economic community vs. WiSe community
| Area | Community features | Macro-economic community | Wellbeing, sustainability and equity (WiSE) community |
|---|---|---|---|
| Policy | Policy science | Macro-Economics To understand economic growth To create policies that enhance economic growth | WiSE science To understand wellbeing, sustainability and equity. To create policies that enhance wellbeing, sustainability and equity. |
| Measurement | Accounting framework | System of national accounts (SNA) | WiSE accounts |
| Indicators (examples) | Gross Domestic Product (GDP) Gross National Income (GNI) Labor Compensation Labor Productivity Savings rate | WiSE indicators |
The figure is indicative of the success of macro-economic community. The word “economic growth” hardly existed before 1950 and now is a common term which is known by just about everyone. In fact, it is so well known that “economic growth” and “growth” can often be used as synonyms. The term “economic” has become so successful that it is not even necessary to use it!
The other two lines in Fig. 1 show the prevalence of “climate change” and “sustainable development” which both became more prevalent in the late 1980s. In the case of climate change, this was a term that existed in the scientific literature before the 1980s but it was given a real boost when the UN started the Intergovernmental Panel on Climate Change (IPCC) in 1990. The term “sustainable development” was basically non-existent when it was coined by the Brundtland Commission in 1987. It was subsequent heavily promoted by the UN and many other international institutes, national governments, academic and others.
What does this mean for the SNA-revision? The take-away is that revising the SNA is not just an intellectual exercise. It is not just about accounting and getting the conceptual aspects right. The outcome and execution of the new SNA, and the broader system, will shape global discourse in the years to come. The impact will depend heavily on the way in which the various systems are implemented. The current situation is that SNA economic accounts are applied for all countries of the world, often every quarter with only a couple of weeks delay. There is a great deal of resources coupled to the timely, accurate and frequent output of these data.
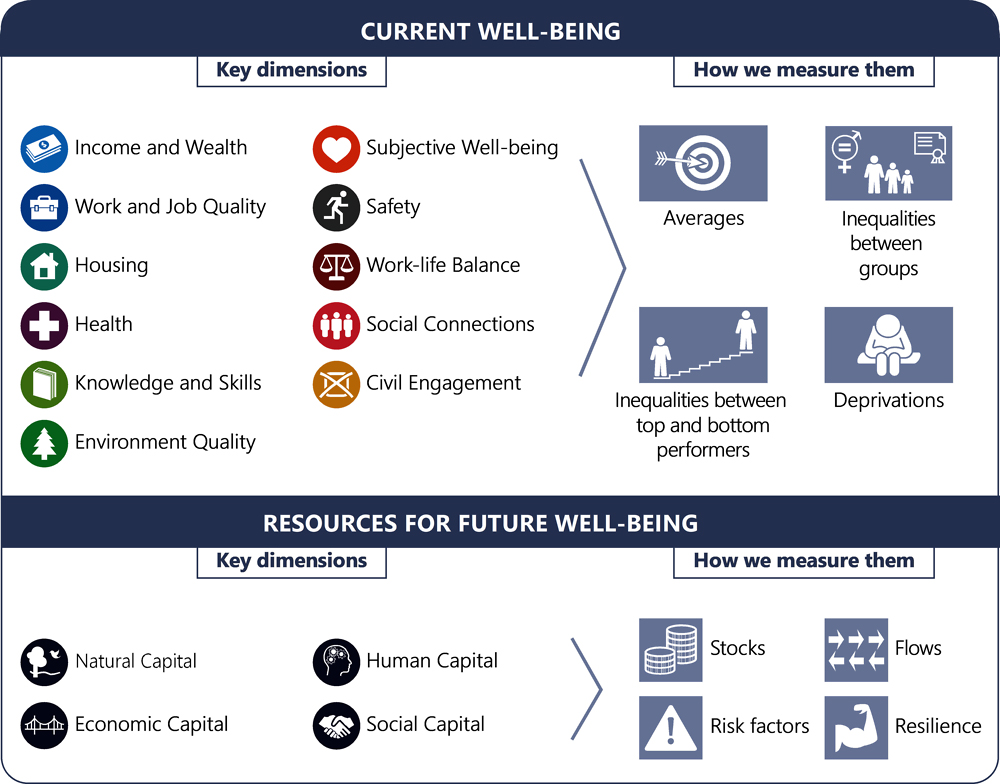
Figure 2.
The OECD framework for the Better Life Initiative.
Currently, the extended accounts of the SNA are less frequent, less timely, and adopted in fewer countries in the world. In some cases, broader accounts might publish data with a 1–4 year delay. Unless this situation changes and more resource are available for global implementation of the broader system the current “economic” narrative will have little competition from an alternative narrative about wellbeing, sustainability and equity.
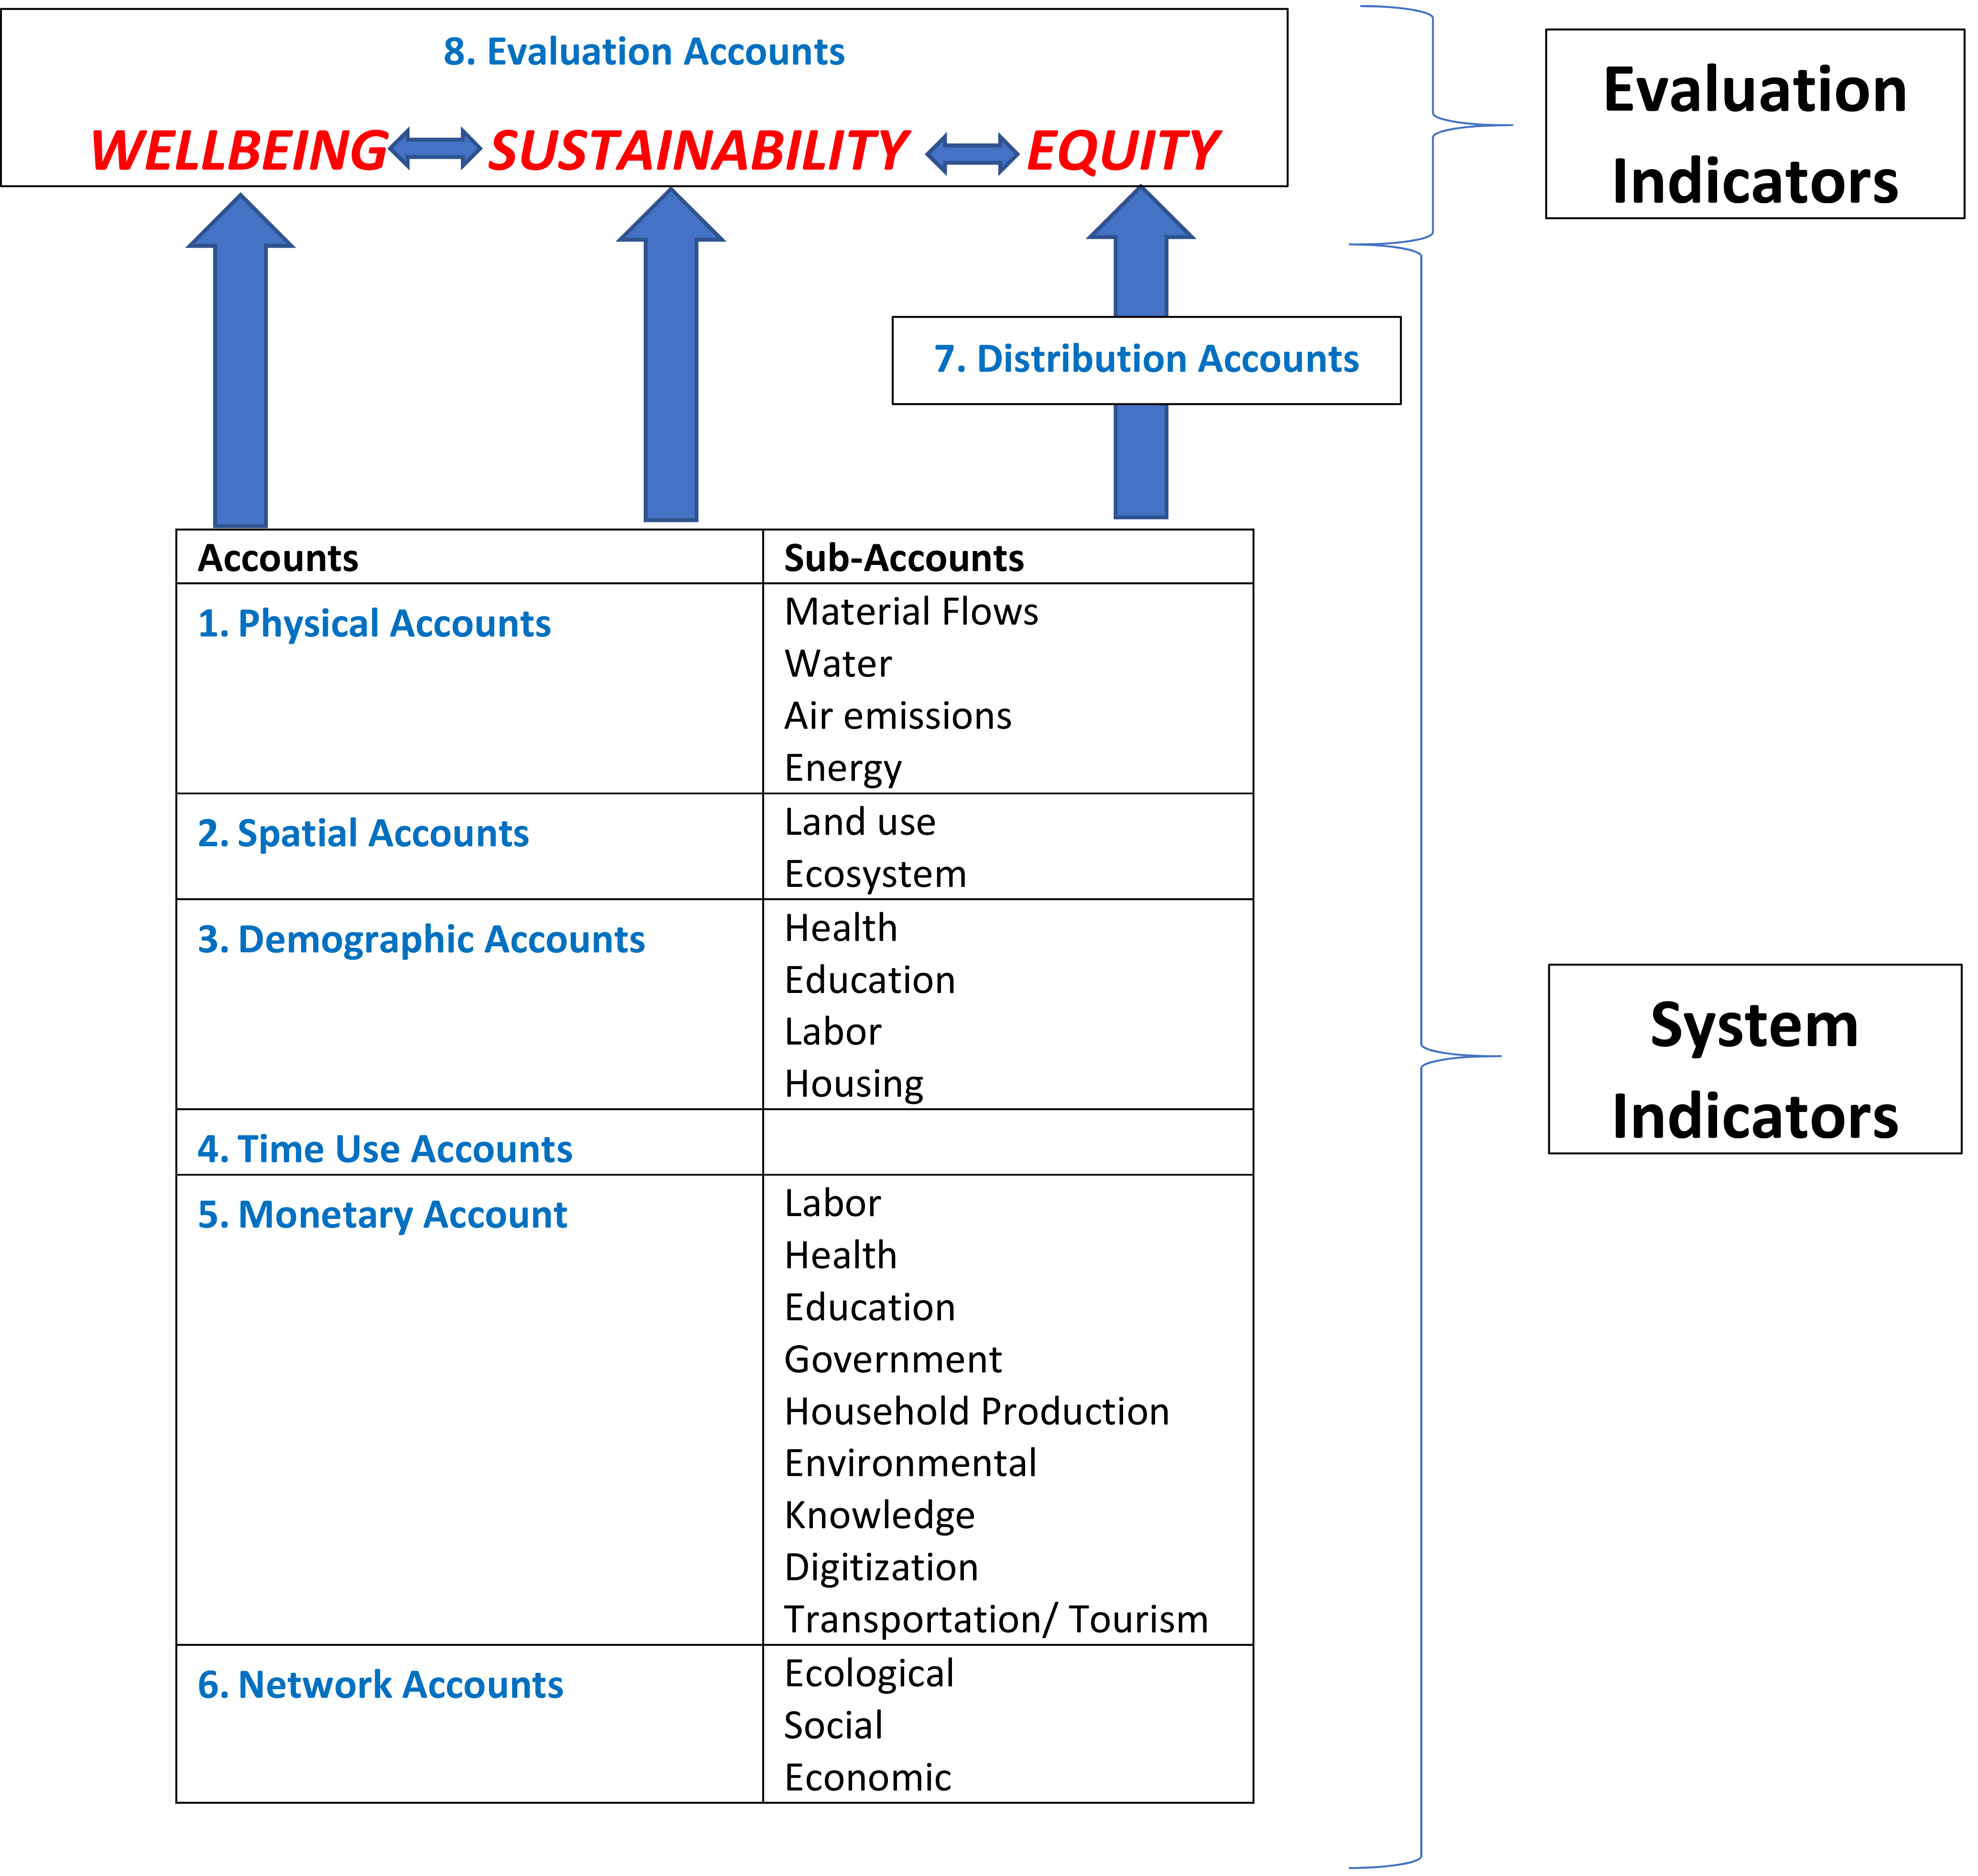
Figure 3.
WiSE accounting framework and indicators.
4.An accounting framework for wellbeing, sustainabily and equity
4.1The wellbeing-sustainability-equity (WiSE) framework
Table 3
Summary of the system accounts
| Accounts | Unit | Based on | Conceptual adaptation |
|---|---|---|---|
| 1. Physical Accounts | Mass and Energy | SEEA-Central Framework Work on Global Material Flows Accounts Global Carbon Budget Project | Link the Physical Supply and Use Tables to global environmental stocks and flows |
| 2. Spatial Accounts | Land Area (and function) | SEEA-Experimental Ecosystem Accounts | Expand spatial techniques to include social and economic phenomena |
| 3. Demographic Accounts | People | Principles and Recommendations for Population and Housing Censuses Richard Stone’s Demographic and Social accounts | Harmonize conceptual foundation of demographic and economic accounting. |
| 4. Time Use Accounts | Time | Harmonised European Time Use Surveys (HETUS) and Multinational Time Use Study (MTUS) | Harmonize conceptual foundation of time use, demographic and economic accounting. |
| 5. Monetary Accounts | Money (Volume & Price) | System of National Accounts Labor accounts Globalization Databases | Expanded the SNA to become a framework for the global economy. Develop economic satellite accounts, which could include volume and prices. |
| 6. Network Accounts | Network quantity and quality (many units) | Research on species networks Research on social networks and governance Guidelines on Global Value Chains Accounting | This is a new accounting structure which looks at the quantity and quality of ecological, social and economic networks |
| 7. Distribution Accounts | All of above | World Inequality Database Distributional National Accounts Research on inequalities in social and environmental dimensions | Harmonize conceptual foundation of data for inequality (in income and wealth) and economic accounting. |
Section 3.2 argued that the success of the macro-economic community is the combination of a global policy science and measurement. The SNA is the glue that keeps it all together because it provides a global “dictionary” of the terminology underlying macro-economics. Table 2 shows that a framework for wellbeing, sustainability and equity should also tick the same boxes. There should be a policy science and measurement framework. The goal of the science should be to create policies for “sustainable development”, which has three distinct dimensions:
1. Wellbeing of the current generation
2. Sustainability – the wellbeing of future generations.
3. Equity – Distribution amongst individuals, demographic groups (gender, age, background etc.) and countries
The split between wellbeing and sustainability was forcefully argued by the Stiglitz Commission in 2009 [34]. It has since been adopted by many initiatives such as the Better Life Initiative (OECD) framework shown in Fig. 2. However, the OECD also stresses that the measurement system should not just look at averages in a population. Inequalities in income and wealth have been growing in many countries since the 1980s [50]. The third dimensions is therefore “equity”, which is necessary to assess to what extent the distribution of all types of characteristics is “fair”. But an equitable society is not just a moral issue. There is also research which shows that more equal societies are more stable and achieve higher levels of overall wellbeing. Equity covers within-country inequalities also differences between countries. Equity and sustainability therefore tackle intergenerational and intergenerational distribution of resources and outcomes. The issue of sustainability has the additional problem of uncertainty because it concerns the future.
Together, Wellbeing, Sustainability and Equity are part of the broad definition of “sustainable development” as defined by the Brundtland report. However, making a distinction between the three helps to frame the three core dimensions of social progress.
An accounting system functions as the dictionary of terms and shows the accounting relationships between variables. This is the task of the WiSE accounts. The accounts are shown in Fig. 3 and are based on decades of research and data collection on environmental, social, demographic and other accounting frameworks. In fact, many of the systems are currently already being implemented.
The accounts adopt the SEEA-approach which separates the physical accounts from evaluation. The figure shows that there are seven accounts which record the developments in environmental, social and economic systems. These are therefore referred to as the “system accounts”.
The system accounts are generally less contentious than the subsequent step in accounting: evaluation. Various methods, from various scientific disciplines, are needed to evaluate the progress towards wellbeing, sustainability and equity. These methods lead to “evaluation indicators” which provide summary indicators that would be capable of replacing GDP as the headline indicator of society. The topic of evaluation and indicators will return after a brief description of each of the system accounts.
4.2System accounts
As Table 3 shows, the seven system accounts are based on existing accounting frameworks. At the same time these frameworks might require some conceptual adjustments or changes in scope. For example, all the accounts need to adopt a global perspective which will require adjustments to the boundaries of the accounting system. The various accounts have different accounting units which each provide a different view of the developments in the environmental, social and economic systems.
There are many overlaps between the accounts. “Hours worked” will be recorded in the time use accounts but will also exist in an economic satellite account on labor/productivity. Sometimes they provide two or more dimensions of the same flows. For example, the sale of natural gas will have a monetary and multiple physical dimensions (mass and energy). Implicitly, the prices (per kg and per Joule) is therefore also part of the accounting framework.
4.2.1Account 1. Physical accounts
The physical accounts are based on Physical Supply and Use Tables (in the SEEA-Central Framework) which provide a total overview of the physical flows related to the economy. The PSUT includes goods in the economic system, the extraction of natural resources and emissions to land, water or air. Even the use of oxygen or the emission of water vapor by economic activities are conceptually part of these physical flows.
The SEEA-PSUT needs to be put in a global perspective in two ways. Firstly, it needs to apply to all countries of the world in a global PSUT system. Scientific groups are already collecting data in this way and connecting it to data on global economic input-output data [51]. Second, the physical flows from the SEEA-PSUT need to be connected to global natural cycles (carbon, nitrogen, hydrological, minerals and metals etc). For natural resources reserves, the SEEA central framework already include sub-soil accounts that is recorded in physical units. However, on the emissions side, the registration of the natural cycles is not complete [28].
For individual substances the link between the SEEA-PSUT and natural cycles is already being made. For example, the Global Carbon Budget project has published carbon “budgets” data for the period 1959–onwards. These provide a consistent overview of annual emissions and global stocks of carbon, whether they are in the economic system or not. The budgets also include the emissions per activity (starting from 1990) consistent to the SEEA air emission accounts. The GCB could act as a model for all-natural cycles, although in each case pragmatic choices need to be made about which elements are relevant. The physical should also include energy fluxes on the planet which could be linked to the energy accounts of the SEEA.
4.2.2Account 2. Spatial accounts
Within 10 years, the SEEA experimental ecosystem accounts have caused a revolution. Detailed spatial data is being linked to the economic concepts of the SNA. The revolution has been made possible because in-situ and remote sensing data have become available and to classify ecosystem types, measure their extent, condition and ecosystem services. At the same time considerable progress has been made with asset and flow valuations.
Taking a broader view of satellite data, they reveal far more information than just ecosystems. They show transportation infrastructure, agricultural activities, logging patterns, irrigation systems, urbanization, location of factories and many other social and economic phenomenon. It is conceivable that the GIS methods being developed by the ecosystem accounting community could in future be used in analysis of social and economic questions. In a generic sense, ecosystem accounting is pioneering a new research agenda that will be able to link macro-level aggregates (environmental, social and economic) to detailed spatial information.
4.2.3Account 3. Demographic accounts
Accounting for population has an even longer history than national accounting. Due to taxation and other reasons, there is a strong incentive for governments/leaders (at whatever level) to know how many people live within their jurisdiction. The demographic accounts should record the stock and flows of people including many characteristics such as health, education, skills, age and labor status. Also, the housing aspects, which are also an integral part of the Principles and Recommendations for Population and Housing Censuses should be included [52].
There are some differences between demographic accounts and economic accounts which need to be resolved. However, there is ample experience at the country level to bring these concepts together. This type of work started as far back as the early 1970s with Richard Stone’s of demographic and social accounts. Later the work on human capital provided an impulse to link the demographic features such as employment, education attainment and income.
4.2.4Account 4. Time-use accounts
Once you have measured the stocks and flow of people (demographic accounts), time use accounts are needed to understand the lives people lead. A study from 2015 found that since the early 1970s, 102 time use surveys have been carried out in 65 countries [53]. They are rare because they require detailed survey responses are therefore expensive studies. There are however other data sources such as with Labor Force Surveys which record one time use category (hours worked).
There have also been efforts to harmonize or enhance comparability of time use surveys: International Classification for Time-Use Statistics (ICATUS), Harmonised European Time Use Survey (HETUS) and Multinational Time Use Study (MTUS). There are some conceptual differences between time use measurement and demographic and economic accounts which would need to be addressed. For example, time use usually surveys one single period, while time use accounting requires an estimate for the full year.
Big data provides an opportunity to make time use surveys far cheaper. There are many electronic systems that are recording people’s time and activities. Either combining these sources or using tracking devices (or even telephones could make time use accounting far more prevalent. The use of electronic movements by some governments in the COVID-19 crisis has shown the huge potential of this technology, but also raise important red flags on privacy. If these technologies are to be used for statistical purposes, special care will need to be taken that it is not too intrusive of people’s privacy.
4.2.5Account 5: Monetary accounts
The monetary accounts will be based on the SNA, as it is now defined, although the precise production boundary will again be subject to debate. The primary change compared to the current SNA will be to start viewing the national accounts as part of a global economic accounting structure. Already, many academic groups have created input-output database for the global economy [54]. The OECD (ICIO) and Eurostat (FIGARO) have agreed to create an institutionalized version of these accounts.
The economic accounts could also be expanded to a couple of “economic sub-accounts” which describe and detail a portion of the economy (tourism, environmental activities) etc.1515 There are also labor accounts, education and health accounts. Note that some of these topics are also covered by the demographic accounts. The difference is that the demographic accounts focus on the population perspective- the health situation, education attainment, skills and labor status in relation to the entire population. The economic satellite accounts focus on the role of labor in the production process and the provision of educational and health services.
The monetary should be augmented by volume and price information, where relevant. For example, hours worked is an important volume component which is used in productivity research. Other volume information as well as price data may be of interest for specific domains. For example, the mass and price of agricultural products, the passengers and prices of transportation, the expenditures per tourist, might be important for policy purposes.
4.2.6Account 6. Network accounts
Phenomena such as globalization, migration, social networks and ecological networks have led to increased attention to interconnected networks. The corona pandemic has reasserted the notion that understanding the networks underlying our world is important. On the one hand there are the social connections which contribute to the virus spreading which also has economic ramifications through global production networks. On the other hand, the inter-species transmission of the COVID-2019 virus has also pressed home the point that human beings are part of an interconnected network of species.
Stock/flow accounting is not sufficient to understand the ramifications of ecological, social and economic networks at the macro-level. Already, network research is increasingly available [55]. For example, global input-output databases are being used to understand the global value chains [56]. Work in this area has resulted in a UN Guidelines on Accounting for Global Value Chains which provides guidance for the measurement of industry specific mulit country SUT and institutional sector accounts for global value chains from a national multi country perspective [57]. This research will probably experience an impetus because of the Corona pandemic and its disruptive effect on supply chains. However, there are many other instances of economic network effect (advertising, knowledge spillovers etc) that should be included in the economic network accounts.
Social network accounts, while not as well developed in a global accounting framework as value chains, should show the interrelationships between people and other members of a family, neighborhoods, companies, sports associations, religious organization and many other groups. The quality and quantity of the network connections should be quantified. Also the relationship between the government and its people should be quantified. Research into ecological networks of species should be integrated into the spatial/ecosystem accounts so that the dynamics of ecosystems are connected to the species networks.
While the idea of network “accounts” is new, big data offers many opportunities to develop such accounts. Since professional social media platforms (such as Linkedin) and private social networks (Facebook etc) are recorded in all sorts of electronic formats, interpersonal relationships can be discovered far more easily than in surveys. In addition, the satellite imagery which is currently being used for ecosystem accounting may also provide an opportunity to look at ecosystem through the lens of species networks.
4.2.7Account 7. Distribution accounts
The demographic accounts already contain a lot of information about the demographic breakup of the population (age, health, education, housing conditions). They are therefore an important part of the distribution accounts which show the full range of inequities in society. They include the distributional aspects, per demographic group, for all physical, spatial, time use, income and wealth dimensions.
There are conceptual differences in inequality measurement from personal data (such as the data in World Inequality Database) and national accounting principles. For example, the definitions of income and wealth in both lines of research are different. Various scientific and institutional groups are trying to create “Distributional National Accounts” to overcome these differences [58, 59, 60].
Distribution accounts are not only at the personal level but are also important at the household level. The Stiglitz report advise to use the SNA aggregates about households rather than GDP. The OECD and other institutes have been doing a lot of work to promote this perspective as well as the distribution amongst household [37].
4.3Evaluation accounts
Table 4
Evaluation approaches
| Evaluation theory | Wellbeing | Sustainability | Equity | Indicator example |
|---|---|---|---|---|
| Welfare economics | X | X | Genuine progress indicator | |
| Capital approach | X | Comprehensive wealth | ||
| Capability approach | X | X | Human development index | |
| Life evaluation | X | Subjective wellbeing | ||
| Affect evaluation | X | U-index | ||
| Physiological measurement | X | Unknown | ||
| Thermodynamic | X | Exergy | ||
| Ecological Networks | X | Unknown | ||
| Resilience | X | Resilience index | ||
| Limits | X | Distance to planetary boundary |
The seven system accounts described above provide descriptions of system dynamics and interconnections in the network. They do not however answer the crucial question: “Overall, are the developments good or bad?”. For example, are we progressing towards wellbeing and sustainability? Are the developments becoming more equitable? The data from the system accounts cannot answer these questions. They need to augmented by scientific evaluation methods.
Valuation is a subset of evaluation methods. What is the damage caused by climate change? What is leisure time worth? How should we value unpaid household work/care? One stream of economic thought, welfare economics, dominates the thinking about these questions. The welfare economic techniques that have been developed provide monetary value for many of these “non-market transactions” They can be used to estimate the value of household production, or to estimate the value of health damages caused by air pollution. Welfare economics is also the basis of green accounting aggregates such as the Genuine Progress Indicator. A special version of welfare economic is the so-called capital approach, which estimates the value of assets (such as human and natural capital) by estimating future rents. The total value is estimated by calculating the net present value of future rents using an appropriate discount rate.
Welfare economics/capital approaches provide useful information and there is ample literature and empirical research to implement this type of valuation. The prime advantage is that they provide monetary values which can be compared to economic aggregates. However, welfare economics is based on certain assumptions to approximate a market situation. The literature also has some blind spots for which it is unlikely to ever find a solution. For example, welfare economics has little to say on the monetary value of social relationships with your friends, family and spouse, while these are important to wellbeing. Establishing the monetary value of “social capital” has therefore remained elusive. Another area of criticism is the treatment of distant unpredictable events in relation to the discount rate [61]. This can cause large differences in the results, because the discounting assumptions play a major role in the empirical outcome. For example, the social cost of carbon can easily vary a factor 10 or more depending on the discount rate or model used [62]. Another example is the valuation of natural capital stocks which is calculated using information from the past which is extrapolated towards the future. Catastrophic environmental collapse is often implicitly excluded from the calculation. However, even if collapse is assumed to take place 20–50 years from now, this would make little difference in the empirical results if a high discount rate is used.
So welfare economics/capital approaches provide useful information but at the same time have caveats. Some have even argued that monetization needs to be avoided all together. This paper does not agree with this conclusion but argues that more attention needs to be given to other valuation approaches from other scientific schools. In fact, rather than only looking at valuation, which is anthropocentric concept, to evaluation which is a broader assessment of system change. Table 4 summarizes some of the other social sciences and natural sciences which provide ways of evaluating wellbeing, sustainability and equity. Many have been suggested by eminent scientists , some of whom are Nobel Prize laureates such as Amartya Sen (Capability Approach) or Daniel Kahneman (Affect Evaluation).
It is beyond this paper to discuss all the methods mentioned in Table 4. Hoekstra (2019: Chapter 10) provides a more comprehensive discussion. The bottom line is that 1) interdisciplinary evaluation assessments can illuminate developments that welfare economics/capital approach cannot 2) However, none of the approaches are perfect, each having some blind spots and other weaknesses. 3) The WiSE accounting structure is flexible so that the system accounts can be linked to multiple evaluation methods 4) Various institutional groups, such as the IPBES, are grappling with the topic of valuation and would benefit from a broader interdisciplinary perspective.
4.4Indicators to replace GDP: The Illusive search for a global tricorder
There has been a long debate about which indicators should replace GDP. Some suggest that a single index needs to be defined. The reasoning is that GDP is one indicator, so we need to strive for one single indicator as a replacement. For example, there are many environmental economists that support green accounting approaches such as the Genuine Progress Indicator or Comprehensive Wealth. However, there are also many institutes and reports (such as the Stiglitz Report) that have concluded that composite index methods based on monetization should not be adopted. It is argued that a dashboard of indicators is the only scientifically acceptable alternative as it avoids attributing weights. Indicators such as GHG emissions, educational attainment, leisure time should therefore be provided separately so that society and policy makers provide their own weights.
Few scientists would argue that there is a perfect way to weight all dimensions of societal progress. Even welfare economists would probably not argue that their method is “perfect”. It provides useful insights If there was a perfect way of weighing all the developments, then a perfect index of “success” could be formulated. This is science fiction. But is that really a problem? Let me try to argue why I think it is not a big issue by using a metaphor.
In the science fiction TV show Star Trek there was a doctor called Dr. Leonard McCoy. He had at his disposal a “tricorder”. This medical device could be pointed at an individual and, within seconds, provide a perfect diagnosis of their health. A single instrument that perfectly quantifies someone’s health status. This is clearly science fiction, because despite the enormous gains in medical science, it has not led to a single perfect instrument to diagnose patients. Instead we have many imperfect instruments which are good at certain areas of diagnosis. Some instruments, such as the thermometer or a blood pressure device, are useful to assess the current health of a patient. Other instruments such as an echograph or blood test could be used to see whether you will become ill in future due to cancer or other latent medical issues. None of these instruments are perfect because none, like a tricorder, can cover all dimensions of health. This is not as great a problem as one might think. If we consider all the information from the imperfect instruments together they generate a near-perfect diagnosis. So even if it is impossible to develop a tricorder, there is a fairly good second-best option.
Table 5
Link of broader framework accounting framework to SDGs
| Account | Sub-topic | Number of SDGs | Total |
|---|---|---|---|
| Physical accounts | Material flows | 8 | 15 |
| Water | 3 | ||
| Energy | 2 | ||
| Air emissions | 2 | ||
| Spatial accounts | Land use | 5 | 18 |
| Ecosystems | 13 | ||
| Demographic accounts | Housing | 6 | 73 |
| Health/crime | 47 | ||
| Education | 8 | ||
| Labor | 4 | ||
| Income/wealth/poverty | 8 | ||
| Time use accounts | Household | 1 | 1 |
| Monetary accounts | Core | 11 | 67 |
| Tourism/culture/transport | 4 | ||
| Labor/productivity | 6 | ||
| Disasters | 2 | ||
| Environmental | 7 | ||
| Government | 11 | ||
| Illegal | 1 | ||
| ODA&Remittances | 17 | ||
| R&D | 1 | ||
| Agriculture | 4 | ||
| SME | 2 | ||
| Technology | 1 | ||
| Network accounts | People | 6 | 17 |
| Government | 7 | ||
| Economy | 4 | ||
| No link to account | 57 | 57 |
What is the “health” of our planet and society, now and in the future? Do we have a “global tricorder” that can tell us instantaneously whether we are progressing towards wellbeing in a sustainable and equitable fashion? The answer is of course no. If medical science cannot produce a tricorder for one dimension (health), is it realistic that this can be done for all the environmental, social and economic dimensions all at once? As Table 4 shows there are many scientific evaluation methods which could cover specific parts of the diagnosis. Some are good at assessing the current situation (see column with “wellbeing) while others are better for assessing the future health of our planet (see “sustainability”) or the fairness in society (“equity”). Although none of these valuation instruments are perfect, together they can provide a good diagnosis of the health of our planet and society.
What is potentially dangerous is that one of these methods claims that it should be the only instrument. For example, some economists argue that welfare economics is the only route to follow. This is comparable to a doctor that turns up to your house only with a blood testing kit. There is a high probability that they will miss a crucial disease which may even lead to fatal results. Most people would choose to throw out the doctor immediately. Similarly, any claim by a scientist that there is a perfect instrument to evaluate wellbeing, sustainability and equity should be rejected. This is like claiming to have created a “global tricorder” – the realm of science fiction.
If a single index is scientifically unfeasible, what is the minimum number? In terms of communication we should strive towards the lowest possible number, while still maintaining the ability to provide good diagnosis. Again, the medical metaphor helps. Although a doctor has dozens of medical instruments, usually 2–5 instruments are enough to home in on a medical problem and come to conclusion with a reasonable degree of certainty. This would also seem to be a reasonable range for the number of indexes needed for wellbeing, sustainability and equity.
5.Linking the WiSE framework to major global initiatives
It is important to understand how the broader accounting framework relates to some the most visible initiatives. In this section, the WiSE framework will be linked to four initiatives which have been promoted by international institutes.
5.1Sustainable development goals
How does the WiSE framework link to the SDGs? An inventory was made to show which of the WiSE accounts corresponds to the SDG indicators which have been defined by the Inter-agency and Expert Group on SDG Indicators (IAEG-SDGs). The official list of indicators was taken of the UNSD site in March 20201616 and linked to the WiSE accounts (summarized in Table 5). The full database of SDGs indicators and WiSE accounts is provided in the supplementary material.
Note that this matching exercise is not definitive. In some cases, the SDG indicator could credibly be part of two WiSE accounts. In other cases, the SDG is equal to a ratio from two different accounts (e.g. material use (from the physical accounts) per unit of GDP (from the monetary accounts). In these cases, for the sake of this exercise, we have linked the numerator the WiSE accounting framework.
Table 5 leads to the following observations:
• There are 57 SDG indicators that do not link at all. These are mostly SDG indicators related to administrative situations such as: “Indicator 1.5.4: Proportion of local governments that adopt and implement local disaster risk reduction strategies in line with national disaster risk reduction strategies.”
• Distribution accounts are not shown in the table because this is a dimension which transcends all accounts. In practice, the description of many SDG indicators specifies that they should be split according to demographic characteristics (such as gender or age).
• Demographic accounts are the most prevalent accounting system (73 indicators), of which health/crime dominates [47].
• The economic accounts also could provide a sizeable number of indicators with the core providing 11 of them. The remaining indicators come from economic satellite accounts which highlight a certain area of the economy, e.g. tourism.
• The SDG process seems to have quite a few “network” indicators. These are indicators that show the quantity and quality of ecological, economic and social networks.
5.2Better life initiative (OECD)
The theoretical framework of the OECD Better Life Initiative is shown in Fig. 2. It is based on the theory of the capital approach, but it does not aggregate the various resources into a monetary aggregate. Also the indicators for current wellbeing are presented in a dashboard of indicators as prescribed by the Stiglitz report. The only aggregation that is done is on the website, where equal weighting is used or weights that are chosen by web-site visitors.
The BLI indicators are easily linked to the WiSE system accounts. I have not done a full link analysis to the WiSE framework just like the SDGs, but this would be straightforward. What might be the advantage of connecting the BLI indicators to an accounting framework? One key advantage is to identify win-win policies or trade-offs between domains, because indicators are interconnected. There are relationships between them and when policies targets one indicator they may lead to improvements or deterioration of other indicators. Having an accounting structure shows the relationship between the domains and thus adds to “policy coherence” which the OECD has stressed in the past [37, 63].
The WiSE framework could benefit from the data and methodologies that have been developed by OECD. The OECD has put a lot of effort into finding distributional data for many of the BLI indicators. They also have created the Distributional National Accounts which ensure consistency of National Accounting concepts and datasets for income and wealth inequalities. In addition, they have created a handbook on the measurement of subjective wellbeing which is one of the valuation methods discussed in the Section 4.3 [64].
5.3Changing wealth of nations (World Bank)/inclusive wealth index (UN)
There are two global initiatives that adopt a monetary capital approach: The Changing Wealth of Nations (World Bank) and the Inclusive Wealth Index (UN).1717 These projects are valuable because they collect a lot of physical stock data for a wide range of countries. Stock data is usually not as systematically collected as flows so this a valuable public good. They also have a lot of experience applying monetary valuation of the capitals across a broad range of countries. These insights should be used in the development of the broader framework.
If the WiSE framework were to be implemented, the CWON and IWI projects could build their statistics on these data. For example, the natural capital measurement would rely mostly on the Physical and Monetary Accounts. The Human Capital Accounts would be based on the demographic accounts and the Labor/Productivity Satellite of the Economic Accounts.
6.Conclusions
This article has shown that there exists a significant amount of scientific and statistical data to build a broader framework around the SNA which would be capable of measuring wellbeing, sustainability and equity (WiSE). It is not a matter of thinking of an entirely new accounting system, but rather putting the existing thought together in a coherent way. There is one fundamental change in scope which is that the current accounting systems, which are at the national level, needs to be set within the global context.
An important feature of the accounting framework is that it uses the SEEA approach to separate systems accounts from evaluation. This makes the framework flexible and makes it possible to link the physical data to multiple evaluation methods. This paper has argued that we need an interdisciplinary perspective on accounting and evaluation which includes ideas from economic, social and natural sciences.
Some accounts, such as spatial, time use and network accounts, stand to benefit from new electronic big data sources. These data strategies will open up data that was previously non-existent or prohibitively expensive [65]. Just like the SNA benefited from methodological improvements in surveys after the Second World War, the WiSE accounts should benefit fully from the current data revolution.
When developing the accounting systems, it should not be forgotten that the measurement is not the end goal. The data should serve as input for policy decisions. The interdisciplinary policy science should reflect the insights from the various disciplines and should be able to weigh trade-offs between domains. In that way it should contribute to policy coherence, where policy actions are viewed from a systems perspective.
How does this all relate to current revision process of the SNA2008? It should be clear that the workstreams on globalization, digitalization, wellbeing and sustainability could easily be linked to the WiSE framework of accounts and indicators. They are all in some way related to one of more of the system accounts proposed. The only difference seems to be that the WiSE framework advocates a broader perspective on evaluation while the SNA revision process is dominated by welfare economics and the capital approach. This paper argues that the addition of multiple evaluation perspectives will help to ensure longer-term relevancy and broader acceptance of these macro-level accounts.
Notes
2 The key indicator was not always called GDP. For example, Gross National Product was used for much of the post war period.However, to avoid confusion, we will keep refering to GDP althought it may not correctly reflect the naming convention during a certain period.
3 As quoted in [1].
4 Measurement of Subjective Wellbeing, which led to the field of “Happiness Economics”, did however start soon after the second world war.
5 The capital approach has become popular amongst academics and some international institutes. There are a couple of reasons which might explain this popularity. First, it aligns well with the idea of sustainable development (“current generations” versus “future generations”. Second, this also aligns well with the existing accounting frameworks such as the SNA and SEEA which also distinguishes a current account (current) and balance sheet (future). Third, long-term environmental problems such as climate change and biodiversity loss were also becoming more increasingly visible in the 1990/2000s which enhanced discussion of intergenerational trade-offs.
6 The Human Development Index is based on the work of Amartya Sen so in that sense it is conceptual. Howver, the weights used to weight education, health and income are not based on any theory.
8 Macro-economics has more research objectives, such as the managing inflation, but understanding economic growth is certainly one of the core research goals.
9 There is also a clear division of labor within the macro-economic community. There are institutes which produce the statistics, such as national statistical offices and national banks. These data are then used for policy or scientific work in government, academia or policy institutes.
10 The SNA2008 still has a chapter on Satellite Accounts.
13 See the process of drafting the handbook for SEEA ecosystem accounts.
14 Currently the SEEA boundaries are set a the economic territory of a country. From a ecological systems perspective it does not make sense set the boundary there, since a large amount of the Earth’s surface is not owned by any country.
15 These accounts are still referred to as “economic satellite accounts” because they are, indeed, a sub-set of the economic accounts.
17 There are also academic inititives such as “the Wealth Economy: Social and Natural Capital” project at the Bennett Institute for Public Policy at Cambridge University.
Acknowledgments
The author would like to thank Ivo Havinga, Jeroen van den Bergh, Bram Edens, Esmé Berkhout and Matthéüs van de Pol for valuable comments.
References
[1] | Landefeld JS. GDP: One of the Great Inventions of the 20th Century. Surv Curr Bus. January (2000) ; 80: : 6-14. |
[2] | Bos F. The National Accounts as a Tool for Analysis and Policy. Saarbrücken: VDM Verlag Dr. Muller, (2009) . |
[3] | Studenski P. The income of nations: theory, measurement, and analysis: past and present; a study in applied economics and statistics. New York: New York University Press, (1958) . |
[4] | Vanoli A. A History of National Accounting. IOS Press, (2005) . |
[5] | Kuznets S. National Income: A New Version. Rev Econ Stat. (1948) ; 30: (3): 151-79. |
[6] | Gilbert M, Jaszi G, Denison EF, Schwartz CF. Objectives of National Income Measurement: A Reply to Professor Kuznets. Rev Econ Stat. (1948) ; 30: (3): 179-95. |
[7] | Suh J, Folbre N. Valuing Unpaid Child Care in the US.: A Prototype Satellite Account Using the American Time Use Survey. Rev Income Wealth. (2016) Dec 1; 62: (4): 668-84. |
[8] | van de Ven P, Zwijnenburg J, Queljoe MD. Including unpaid household activities. (2018) ; Available from: https//www.oecd-ilibrary.org/content/paper/bc9d30dc-en. |
[9] | Waring M. If Women Counted: A New Feminist Economics. Harper & Row, Macmillan, Allen & Unwin, (1988) . |
[10] | Ironmonger D. Counting outputs, capital inputs and caring labor: Estimating gross household product. Fem Econ. (1996) ; 2: (3): 37-64. |
[11] | Folbre N. Accounting for Care: A Research and Survey Design Agenda. In Paris, France, (2015) . |
[12] | Stapel-Weber S, Verrinder J. Globalisation at work in statistics – Questions arising from the ‘Irish case’. Eurona. (2017) ; 2: . |
[13] | Brynjolfsson E, Mcafee A. The Second Machine Age Work, Progress, and Prosperity in a Time of Brilliant Technologies. Norton, (2014) . |
[14] | Brynjolfsson E, Hu (Jeffrey) Y, Smith MD. Consumer Surplus in the Digital Economy: Estimating the Value of Increased Product Variety at Online Booksellers. Manag Sci. (2003) Nov 1; 49: (11): 1580-96. |
[15] | EC IMF, Oecd UN, World Bank. System of National Accounts 2008 [Internet]. European Commission, International Monetary Fund, Organisation for Economic Co-operation and Development, United Nations and the World Bank; (2009) . Available from: http//unstats.un.org/unsd/nationalaccount/docs/SNA2008.pdf. |
[16] | Coyle D. GDP: A brief but affectionate history. Princeton University Press, (2014) . |
[17] | Philipsen D. The Little Big Number: How GDP Came to Rule the World and What to Do about It. Princeton University Press, (2015) . |
[18] | van den Bergh JCJM. The GDP Paradox. J Econ Psychol. (2009) Apr; 30: (2): 117-35. |
[19] | Jackson T. Prosperity Without Growth: Foundation for the Economy of Tomorrow. Second Edition. London and New York: Routledge, (2017) . |
[20] | Masood E. The Great Invention: The Story of GDP and the Making and Unmaking of the Modern World. New York and London: Pegasus Books, (2016) . |
[21] | Raworth K. Doughnut Economics: Seven Ways to Think Like a 21st-Centruy Economist. Penguin Random House, (2017) . |
[22] | Nordhaus WD, Tobin J. Is Growth Obsolete? In: Economic Growth. National Bureau of Economic Research (NBER); 1972. (Economic Research: Retrospect and Prospect; vol. Volume 5). |
[23] | Daly HE, Cobb JB. For the Common Good: Redirecting the Economy toward Community, the Environment, and a Sustainable Future. Boston: Beacon Press, (1989) . |
[24] | Cobb C, Rowe 1946-Jonathan, Halstead T, Progress (Firm) R. The genuine progress indicator: summary of data and methodology. San Francisco, Ca.: Redefining Progress, (1995) . |
[25] | Sen A. Commodities and Capabilities. Amsterdam, New York and Oxford: North-Holland, (1985) , (Professor Dr. P. HEnnipman Lectures in Economics). |
[26] | WCED. Our Common Future - Report of the World Commission on Environment and Development [Internet]. Oxford: World Commission on Environment and Development, Oxford University Press; (1987) ; [cited 2016 Sep 7]. Available from: http//www.un-documents.net/wced-ocf.htm. |
[27] | UN. Indicators of Sustainable Development Framework and Methodologies. New York: United Nations Sales Publication, (1996) Aug. |
[28] | Hoekstra R. Replacing GDP by 2030: Towards a common language for the well-being and sustainability community. Cambridge: Cambridge University Press, (2019) . |
[29] | Pearce DW, Atkinson GD. Capital theory and the measurement of sustainable development: an indicator of “weak” sustainability. Ecol Econ. (1993) Oct 1; 8: (2): 103-8. |
[30] | Lange G-M, Carey K, Wodon Q. The Changing Wealth of Nations 2017. World Bank, (2017) . |
[31] | UNEP. Inclusive Wealth Report 2018: Measuring Sustainability and Well-Being, 2018. |
[32] | UN, EC, FAO, IMF, OECD, World Bank. System of Environmental-Economic Accounting 2012-Central Framework [Internet]. New York: United Nations, European Commission, Food and Agriculture Organization of the United Nations, International Monetary Fund, Organisation for Economic Co-operation and Development and the World Bank; (2014) [cited 2016 Sep 7]. Available from: http//unstats.un.org/unsd/envaccounting/seeaRev/SEEA_CF_Final_en.pdf. |
[33] | Victor PA. Cents and nonsense: A critical appraisal of the monetary valuation of nature. Ecosyst Serv. (2020) Apr 1; 42: : 101076. |
[34] | Stiglitz JE, Sen A, Fitoussi J-P. Report by the Commission on the Measurement of Economic Performance and Social Progress [Internet]. (2009) . Available from: http//www.insee.fr/fr/publications-et-services/dossiers_web/stiglitz/doc-commission/RAPPORT_anglais.pdf. |
[35] | UNECE, OECD, Eurostat. Measuring Sustainable Development: Report of the Joint UNECE/OECD/Eurostat Working Group on Statistics for Sustainable Development. Geneva and New York: United Nations Economic Commission for Europes, Organisation for Economic Co-operation and Development and Eurostat, (2008) . |
[36] | UNECE, OECD, Eurostat. Conference of European Statisticians Recommendations on Measuring Sustainable Development [Internet]. New York and Geneva: United Nations Economic Commission for Europes, Organisation for Economic Co-operation and Development and Eurostat; (2014) [cited 2016 Sep 7]. Available from: http//www.unece.org/fileadmin/DAM/stats/publications/2013/CES_SD_web.pdf. |
[37] | van de Ven P. Measuring economic well-being and sustainability: a practical agenda for the present and the future. Eurona. (2019) Jul 9; 1: : 7-41. |
[38] | Stone R. Demographic Accounting and Model-Building. Paris: Organisation for Economic Co-operation and Development (OECD), (1971) . |
[39] | Stone R. Towards a System of Social and Demographic Statistics. New York: United Nations; (1975) . (Statistics and Statistical Methods Publications). |
[40] | Becker GS. Investment in Human Capital: A Theoretical Analysis. J Polit Econ. (1962) ; 70: (5): 9-49. |
[41] | Jorgenson DW, Fraumeni BM. The accumulation of human and nonhuman capital, 1948-1984. In: RE Lipsey and HS Tice (Eds), The Measurement of Savings, Investment and Wealth. Chicago, I.L.: The University of Chicago Press, (1989) , pp. 227-82. |
[42] | Nordhaus WD, Landefeld JS, Jorgenson DW, Conference on Research in Income and Wealth. A New Architecture for the US. National Accounts [Internet]. Chicago: University of Chicago Press; (2006) . (Studies in Income and Wealth). Available from: https//login.ezproxy.leidenuniv.nl:2443/login?URL=http://search.ebscohost.com/login.aspx?direct=true&db=nlebk&AN=212653&site=ehost-live. |
[43] | Gleeson-White J. Double Entry How the Merchants of Venice Created Modern Finance. Ww Norton & Co, (2012) . |
[44] | Freeman AM, Herriges JA, Kling CL. The Measurement of Environmental and Resource Values: Theory and Methods. RFF Press, (2014) . |
[45] | Kallis G, Gómez-Baggethun E, Zografos C. To value or not to value? That is not the question. Ecol Econ. (2013) Oct 1; 94: : 97-105. |
[46] | Gsottbauer E, Logar I, van den Bergh J. Towards a fair, constructive and consistent criticism of all valuation languages: Comment on Kallis et al. (2013). Ecol Econ. (2015) Apr 1; 112: : 164-9. |
[47] | Baldwin R. Globalisation: The Great Unbundling(s). Helsinki: Economic Council of Finland, (2006) Sep. |
[48] | UNECE. Guide to Measuring Global Production. Geneva and New York, (2015) . |
[49] | Shiller R. Narrative Economics: How Stories Go Viral and Drive Major Economic Events. Princeton University Press, (2019) . |
[50] | Piketty T. Capital in the Twenty-First Century [Internet]. Harvard University Press; 2014. Available from: http//www.jstor.org/stable/j.ctt6wpqbc. |
[51] | Merciai S, Schmidt J. Methodology for the Construction of Global Multi-Regional Hybrid Supply and Use Tables for the EXIOBASE v3 Database. J Ind Ecol. (2018) ; 22: (3): 516-31. |
[52] | UNDESA. Principles and Recommendations for Population and Housing Censuses Revision 2. New York: Department of Economic and Social Affairs Statistics Division, (2008) . |
[53] | Charmes J. Time Use Across the World: Findings of a World Compilation of Time Use Surveys. (2015) . (2015 UNDP Human Development Report Office; vol. Background Paper). |
[54] | Tukker A, Dietzenbacher E. Global Multiregional Input-Output Frameworks: An Introduction and Outlook. Econ Syst Res. (2013) Mar 1; 25: (1): 1-19. |
[55] | Strogatz SH. Exploring complex networks. Nature. (2001) Mar 8; 410: (6825): 268-76. |
[56] | Timmer MP, Erumban AA, Los B, Stehrer R, de Vries GJ. Slicing Up Global Value Chains. J Econ Perspect. (2014) ; 28: (2): 99-118. |
[57] | UNSD. Accounting for Global Value Chains: GVC Satellite Accounts and Integrated Business Statistics – Final draft prior to official editing. New York: United Nations Statistical Division, (2019) . |
[58] | Zwijnenburg J. Unequal Distributions? A study on differences between the compilation of household distributional results according to DINA and EGDNA methodology, (2017) Aug. |
[59] | Zwijnenburg J, Bournot S, Giovannelli F. Oecd expert group on disparities in a national accounts framework – results from the 2015 exercisE. Paris (2016) . |
[60] | Piketty T, Saez E, Zucman G. Distributional National Accounts: Methods and Estimates for the United States. Natl Bur Econ Res Work Pap Ser [Internet]. (2016) ï¼› No. 22945. Available from: http//www.nber.org/papers/w22945. |
[61] | Weitzman ML. Why the Far-Distant Future Should Be Discounted at Its Lowest Possible Rate. J Environ Econ Manag. (1998) Nov 1; 36: (3): 201-8. |
[62] | van den Bergh JCJM, Botzen WJW. Monetary valuation of the social cost of CO2 emissions: A critical survey. Ecol Econ. (2015) Jun; 114: : 33-46. |
[63] | OECD. Policy Coherence for Sustainable Development 2017: Eradicating Poverty and Promoting Prosperity. Paris, (2017) . |
[64] | OECD. Guidelines on Measuring Subjective Well-being [Internet]. Organisation for Economic Co-operation and Development (OECD); (2013) [cited 2016 Sep 7]. Available from: 10.1787/9789264191655-en. |
[65] | IEAG. A world that counts: Mobilising the Data Revolution for Sustainable Development. United Nations Secretary-General’s Independent Expert Advisory Group on a Data Revolution for Sustainable Development (IEAG), (2014) Nov. |

