
The interlinkages between the SDG indicators and the differentiation between EU countries: It is (mainly) the economy!
Abstract
The United Nations adopted in September 2015 the 2030 Agenda, which contains 17 Sustainable Development Goals (SDGs) and 169 targets. It covers the three traditional dimensions of sustainable development: the economic, social and environmental. A fourth institutional dimension (governance) has also been included. A global indicator framework has been developed to monitor the 2030 Agenda. The European Union (EU) has developed its own dashboard involving 100 indicators, structured along the SDGs and adapted to the EU context and policies. Our study is based on the EU’s dashboard indicators. Our objective is to measure interlinkages between these indicators, knowing that the United Nations considered from the start that taking into account these interlinkages and the integrated nature of the SDGs was a prerequisite to achieve these goals. The Principal Component Analysis (PCA) used to measure the correlation between indicators distinguishes three main groups of economic and social indicators: income/poverty; health; education/employment. It also puts in evidence a fourth category regarding governance. In contrast, the indicators relating to the environment in a broad sense are much more heterogeneous. On the basis of the Hierarchical Cluster Analysis (HCA) which is also conducted to complement the PCA, two groups of countries can be identified within the EU. On the one hand, the countries of Western and Northern Europe, and on the other, the countries of East and Southern Europe. The segmentation between EU countries is directly related to their economic development level.
1.Introduction
In September 2015, the 193 Member States of the United Nations (UN) adopted the 2030 Agenda for Sustainable Development, known as the 2030 Agenda [1], which established an integrated global policy framework for the next 15 years. In line with its standard definition [2], sustainable development aims to meet the needs of the present without compromising the ability of future generations to meet their own needs. It is a global approach consisting of three dimensions, the economic, social and environmental, which are very closely linked and which must be analysed consistently and as a whole.
The 2030 Agenda contains 17 goals and 169 targets. It brings together two previous agendas, that of the Millennium Development Goals (MDGs) and that of the World Summits.11 The MDGs, adopted in 2000, only covered developing countries and focused essentially on poverty and human development. The last World Summit, held in 2012 and called “Rio
The 2030 Agenda led to the development of a set of monitoring indicators known as the Sustainable Development Goals indicators, of which there have been 231 since the revision adopted by the United Nations statistical commission in March 2020.22 This dashboard approach is within the spirit of the recommendations made by the Stiglitz Commission on the Measurement of Economic Performance and Social Progress [3, 4]. The SDG indicators now constitute a reference framework for monitoring national policies. The European Union (EU) has developed its own dashboard, structured along the SDGs, though more restricted, involving 100 indicators.
When adopting the 2030 Agenda, the UN noted specifically that “the interlinkages and integrated nature of the Sustainable Development Goals are of crucial importance in ensuring that the purpose of the new Agenda is realized” [1]. Indeed, policies towards one objective might have some positive or negative impact on other objectives. Overall, defining policies to implement SDGs requires understanding synergies and trade-offs between them.
In this paper, interlinkages are defined as correlations (or causalities) between objectives, targets and indicators. According to the typology proposed by Miola et al. [5], 5 main methodological approaches have been used to measure these interlinkages: (a) a linguistic approach, assessing the interlinkages based on their respective wording and meaning; (b) a literature approach, based on the results of the scientific literature, mostly with reference to the SDGs; (c) an expert judgement approach, identifying relationships among the concepts involved; (d) a quantitative approach, which aims to establish interlinkages by quantitative statistical analysis of the indicators; (e) last of all, modelling complex system interactions to understand interdependencies among variables.
Two reports presented to the United Nations statistical commission in 2019 [6] and 2020 [7] conducted a survey of several studies following some of these approaches, with a focus on quantitative studies based on network analysis. Our paper adopts a quantitative approach using standard data analysis techniques, which presents the advantage of using a systematic and rigorous well proven methodology. In order to avoid the problems of availability and quality of time series, our study analyses cross section data, based on the 2018 EU’s dashboard indicators.33
We conduct a Principal Component Analysis (PCA), which is a widely used data analysis technique, and which is well adapted to analyze this kind of data sets. This method provides quantitative measure of correlations between indicators and a clear visualization of these correlations [8]. It also compares the situation of EU countries for their contribution to the variance and their position along the axes composed from a linear combination of indicators, providing however only very general results in this respect. Detailed progress analyses have been conducted by SDSN [9] at the world level and by OECD [10] for its member countries, as well as by Eurostat [11] and by Cling et al. [12] for EU countries. In order to complement the PCA and to classify EU countries in a more systematic way than Eurostat [11], we conduct a Hierarchical Cluster Analysis (HCA) on the EU Sustainable Development Indicators [13], which measures the distance between EU countries for these indicators.
Our study brings two main kinds of results:
• The Principal Component Analysis (PCA) groups indicators into three broad categories of the economic and social domain: income/poverty; health; education/employment. The indicators for each of these categories are strongly correlated. To sum it up, SDG 1 (Poverty), SDG 9 (Innovation) and SDG 10 (Inequality) are strongly interlinked; there are also interlinkages between these SDGs and with SDG 3 (Health). SDG 4 (Education) and SDG 8 (Employment) are also interlinked between themselves, as well as with to a lesser extent with the first group of SDGs here above (SDG 1, 9 and 10). Indicators of SDG 16 (Governance) are related to those of SDG 3 (Health) and SDG 10 (especially GDP/capita). Indicators for other SDGs, that is for the large majority of them, have few interlinkages with indicators for these SDGs or between themselves.
• On the basis of the Hierarchical Cluster Analysis (HCA), two groups of countries can be identified within the EU. On the one hand, the countries of Western and Northern Europe, and on the other, the countries of East and Southern Europe. For socio-economic indicators (especially GDP/capita), as well as for indicators related to governance issues, the values are generally more positive in Western and Northern Europe than in other EU countries. The results of the HCA are consistent with those of the PCA, insomuch as the group of indicators with the strongest interlinkages is globally similar to the group of which contribute the most to the segmentation between countries.
Although the intention was to broaden the approach “beyond GDP” as mentioned here above, our results show that the differences between countries for SDIs derive primarily from their level of economic development, measured especially by their gross disposable income of households per capita (GDI/capita), and to a lesser extent their GDP/capita. In contrast, the indicators relating to the environment in a broad sense are much more heterogeneous, generally having tenuous links with each other and with those of other categories. These indicators do not contribute to the segmentation between countries, with the notable exception of exposure to air pollution by particulate matter (which is strongly related to GDP/capita and to GDI/capita).
The remainder of this paper is organized as follows. Section 2 presents the data used for monitoring the SDGs, and especially the European Sustainable Development Indicators (SDIs) which are the basis of our study. Section 3 presents the main results of the Principal Component Analysis applied to these Sustainable Development indicators for all EU countries. Section 4 presents the results of the Hierarchical Cluster Analysis applied to the same set of indicators. Section 5 concludes.
2.Data
The monitoring of the 2030 Agenda required the creation of a list of indicators. A group of experts (IAEG-SDGs),44 composed of representatives of 27 national statistical institutes (including one of the authors of this paper) was tasked with defining those indicators. They were adopted in March 2017 by the United Nations Statistical Commission and in July 2017 by the UN General Assembly [14]. Since the 2020 revision, the list consists of 231 indicators for which a common methodology has been adopted and metadata is available.55
The global indicators are not necessarily applicable to all national contexts owing to the specific characteristics of each country. For instance, indicators related to oceans, seas and marine resources (SDG 14) are obviously not relevant for land-locked countries. Moreover, some targets are already largely reached in some countries (e.g. access to electricity, which is almost universal in developed countries), so these targets must be adapted and therefore the indicators also. Last of all, additional indicators are sometimes needed to follow national policies (e.g. gender equality policies in some countries). Therefore, complementary regional, national or even infra-national indicators may be necessary in order to monitor and track the proper implementation of the 2030 Agenda. Furthermore, the level of statistical development in a given country may make it possible to use more context relevant indicators than those used at a global level. For these reasons, the list adopted by the UN to monitor the SDGs at a global level is, in part, different from that chosen by the European Commission for monitoring at European level.
Since adopting the 2030 Agenda in 2015, the EU, in coordination with its Member States, has committed to integrating the Sustainable Development Goals into the European political framework and has announced that it will regularly conduct detailed monitoring of the SDGs from 2017 onwards [15]. It is in this context that a new list of indicators, selected on the basis of defined principles and criteria, has been drawn up for the EU by Eurostat, after consulting the national statistical institutes of the Member States and the European Commission services. While the EU SDIs set aims to be structured along the SDGs, it is also adapted to the EU context and policies. All the EU SDIs have been selected to be highly relevant for EU policies and initiatives. Furthermore, all the indicators must make it possible to unambiguously interpret the intended direction of change, as defined in the EU policies. In this sense, this set of indicators monitors the Sustainable Development Goals from an EU perspective.
The European list of SDIs, in contrast with the global list, was established on the basis of data current availability – i.e. all indicators had to be already produced and available. The list of indicators also takes into consideration the standard quality criteria for European statistics that feature in the European Statistics Code of Practice: frequency of dissemination, timeliness, geographic coverage, comparability between countries and across time, as well as the length of chronological series. Most of the indicators selected comply with international or European standards, where applicable, which is the case for the indicators based on the European statistics produced within the European Statistical System. However, the set of European SDIs also includes several indicators produced outside of the European Statistical System, in particular in the areas not sufficiently covered by the official European statistics, but for which data from external sources are available and meet reasonable quality requirements (for example women’s rights). This list is revised every year, to take into account the availability of new indicators, of additional information on the poor quality of some existing indicators which should then been removed from the list, etc.
The set of EU SDIs is structured in line with the 17 Sustainable Development Goals with slight adjustments occurring every year. The 2018 version analysed in this paper includes 100 different indicators. The indicators have been distributed evenly across the 17 goals to ensure a balance among the various areas. As a result, each goal has five or six indicators (Annex). As a consequence of the integrated nature of the SDGs, 41 indicators are multi-purpose, i.e. they are assigned primarily to one goal, but are also used as secondary indicators for other goals. This means that each objective is monitored via a total of 5 to 12 indicators. These multi-purpose indicators are useful for highlighting the links between the various goals and improving the analysis in the monitoring reports. Of the 100 indicators, 88 are updated annually, and the remaining 12 less frequently; 69 indicators are derived from European statistics and 31 from other sources. This list of indicators is aligned when possible to the UN list: Eurostat considers that 55 indicators come from or are similar to the list of SDG indicators drawn up by the UN [16], while according to our comparison only half a dozen indicators are strictly identical.
Although an almost equal number of indicators has been adopted for monitoring each objective, the quality of the monitoring of the different dimensions of sustainable development by EU indicators is very unequal in practice, as it clearly comes out of the EU annual quality report on these indicators [16]. Whereas economic and social dimensions of sustainable development are monitored by numerous, recent and comparable indicators, such is not the case for environment and climate. These differences undoubtedly derive from strong statistical investment in economic statistics over the last century (the first national accounts started in the 1930s), both in conceptual and measurement terms, as well as relatively old investment in social statistics.66 The opposite situation stands for environmental statistics, which are still under-developed and for which new investment efforts are badly needed.
Quality problems especially affect indicators related to three SDGs, for which only aggregate values for the whole of the European Union are available, or for which missing data are too numerous to allow comparison between countries (see Annex): out of 6 indicators defined for the monitoring of SDG 6 (“Clean water and sanitation”), only one meets the comparability requirements for our analysis. Moreover, this indicator (% of the population having neither a bath, nor a shower, nor indoor flushing toilet in their household) is more a social indicator than an environmental one. The same applies to SDG 14 (“Life below water”), for which only one indicator can be retained (% of freshwater & seawater bathing sites with excellent water quality) and to SDG 15 (“Life on land”) to a lesser extent. For the latter, only half of the indicators meet our requirements (% of forest area; artificial land cover per capita; % of estimated soil erosion by water). Overall, among the 17 indicators of the list most affected by quality or comparability problems, 15 concern SDGs related to environment and climate.77
As mentioned here above, while maintaining an almost constant total number of indicators, the list drawn up by Eurostat in 2017 is adjusted each year in order to incorporate indicators from new sources of available data and to take into consideration the new European priorities in the best way possible. The progress made by the EU in achieving the Sustainable Development Goals is analysed in an annual report using this list of indicators [11].
Throughout the rest of this paper, we will refer to the EU list of indicators (SDIs) in order to analyse how the EU countries are performing in terms of the Sustainable Development Goals. Of the 100 Eurostat indicators, we have selected 83, removing indicators for which we were not able to make an inter-country comparison (lacking data for too many countries or lack of data for specific countries). In three cases, the indicator on the Eurostat list in fact covers two or three sub-indicators: this refers to the indicator relating to underachievement broken down into reading, maths and science (three indicators), the energy consumption indicator, which differentiates between primary and final energy (two indicators) and the indicator relating to confidence in the European institutions (three indicators). Including these sub-indicators brings the list examined to 88 indicators.
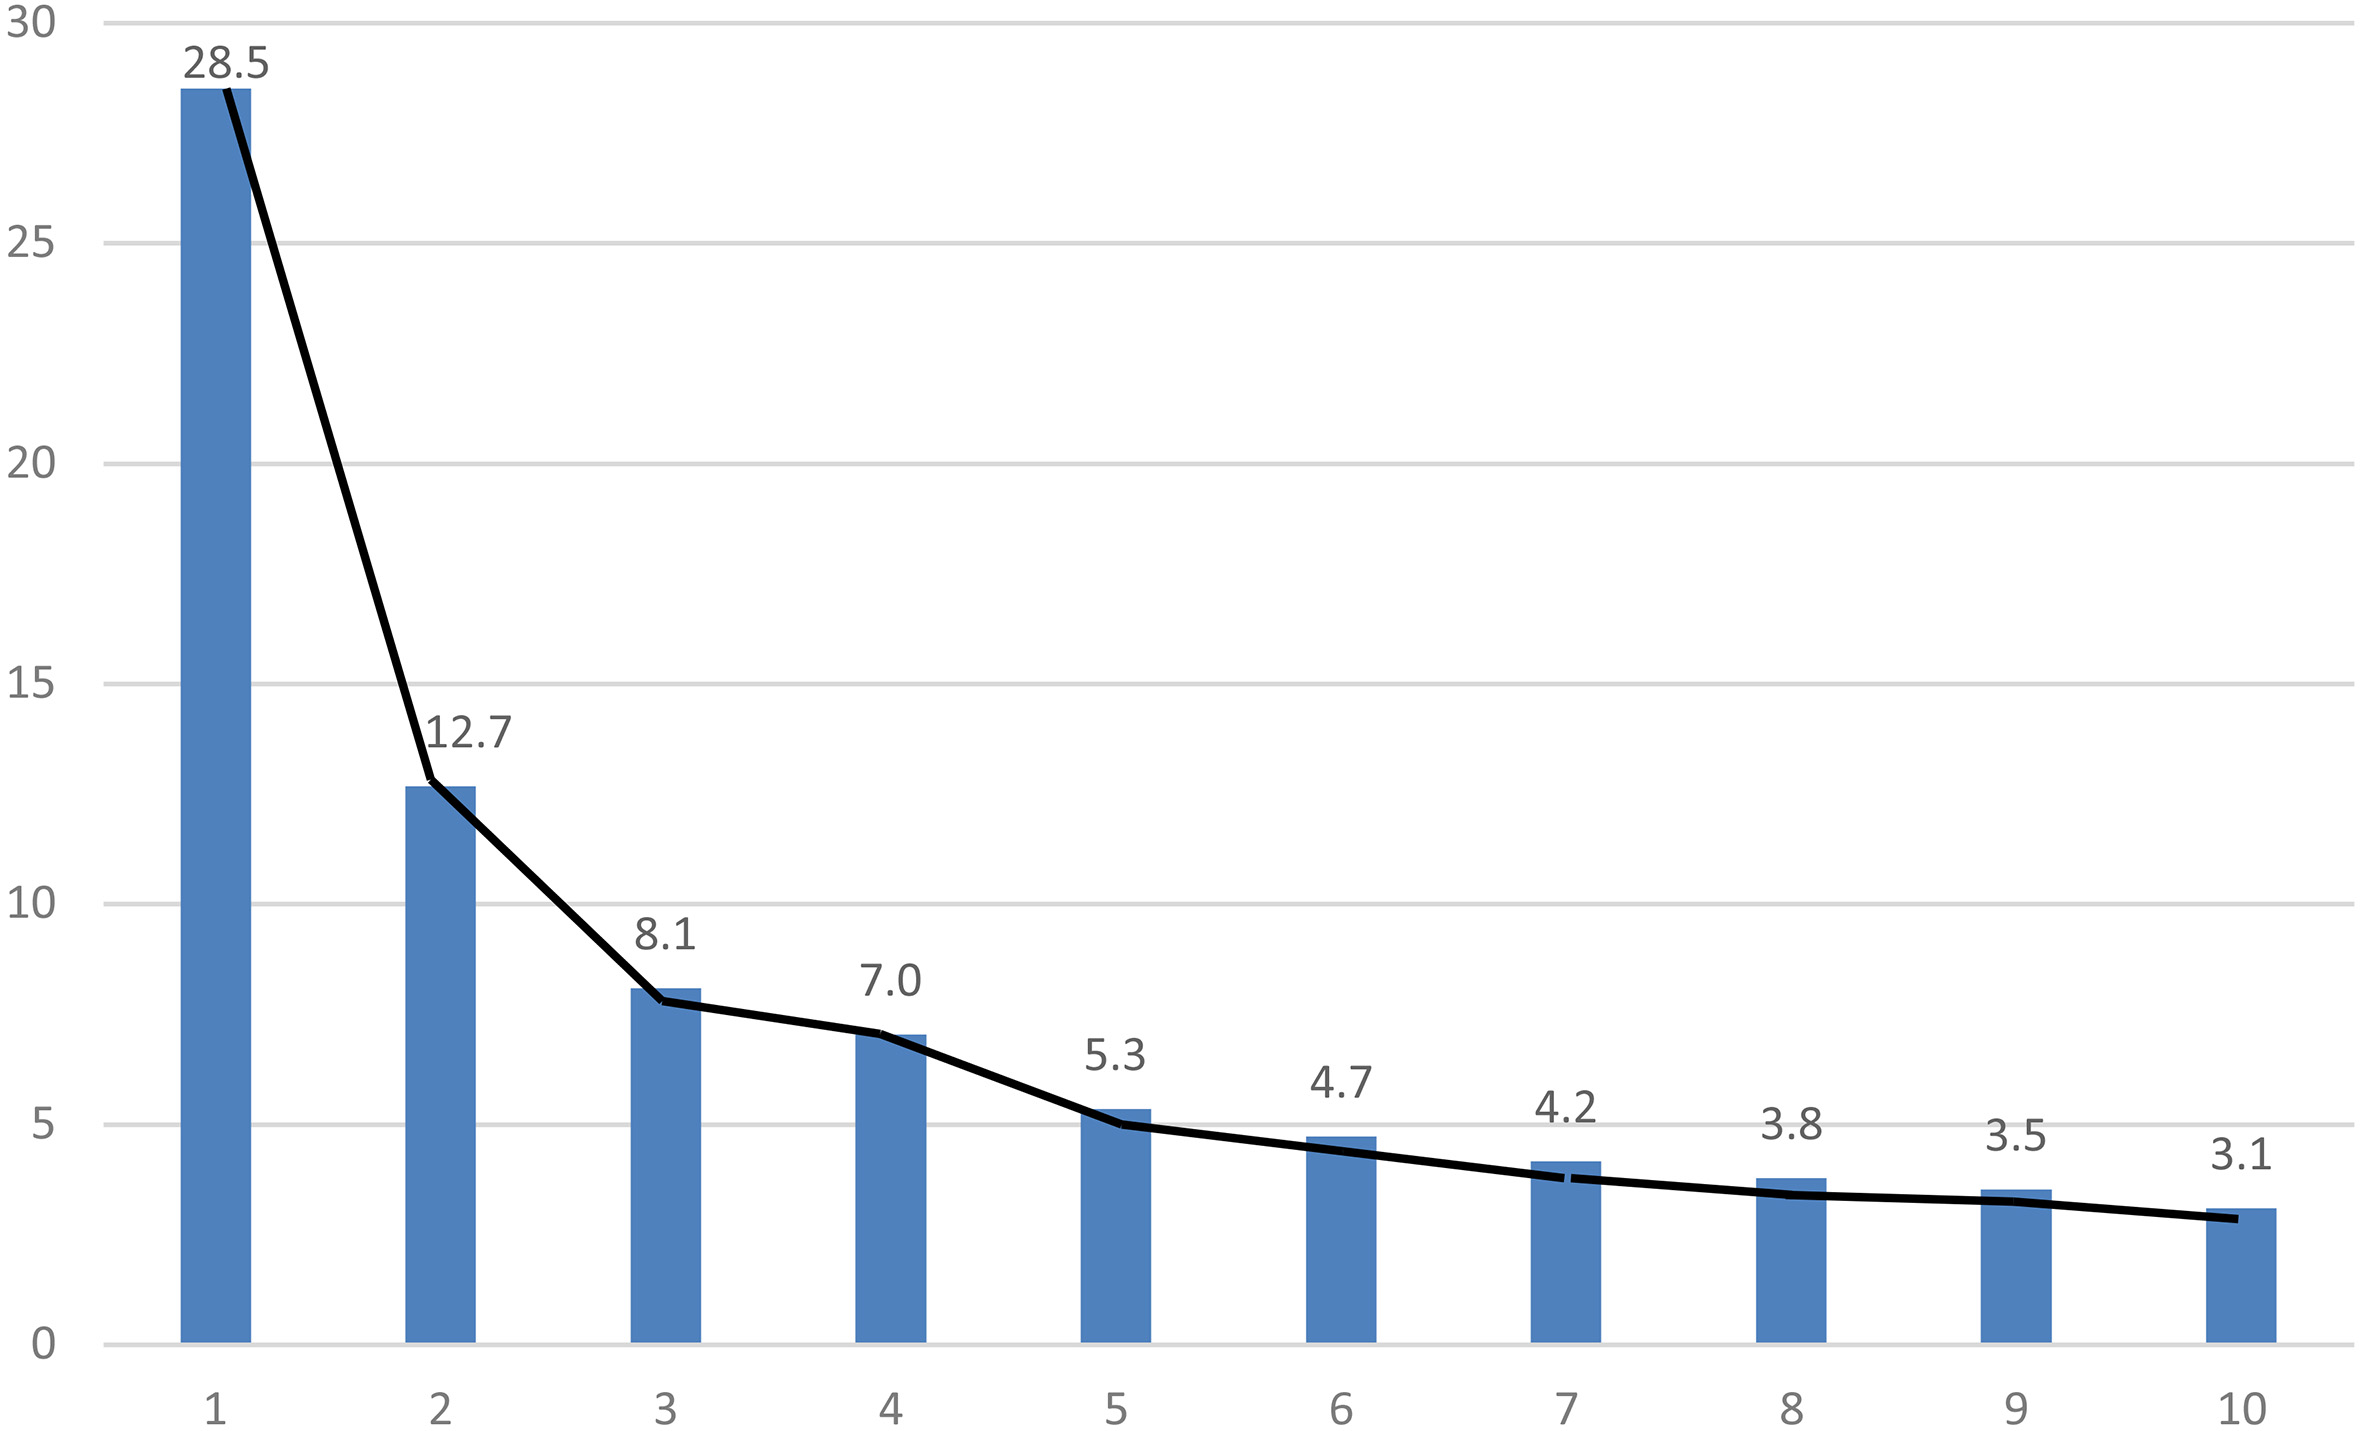
Figure 1.
Percentage of variance explained by each principal component (%). Source: Eurostat; authors’ calculations. Only the 10 first principal components are represented on this figure. The % of variability explained by each principal component is obtained by dividing the eigenvalue for this component by the sum of all eigenvalues.
3.Three indicators groupings derived from the Principal Component Analysis
The Principal Component Analysis (PCA) makes it possible to visualize correlations, whether positive or negative, between indicators. It helps to identify patterns in the data in the case of large sets. In our case, we aim to analyse a 28
We start by standardizing all the variables (indicators).99 We then figure out the principal components (i.e. eigenvectors), which are new variables that are constructed as linear combinations of the initial variables. The first principal component axis is calculated in such a manner that it maximizes the variance.1010 The second principal component axis is calculated in the same way, with the condition that it is perpendicular to the first principal component and that it accounts for the next highest variance, etc.
Table 1
Indicators which contribute the most to the first principal component and their correlation with GDI/capita
| Contribution to axis 1 (%) | Correlation GDI/cap | |
|---|---|---|
| SDG 1 “No Poverty” | ||
| People at risk of poverty or social exclusion (%) | 2.5 | 0.59 |
| Severely materially deprived people (%) | 2.8 | 0.73 |
| SDG 4 “Quality Education” | ||
| Adult participation in learning (%) | 2.7 | 0.64 |
| SDG 9 “Industry, innovation and infrastructure” | ||
| Gross domestic expenditure on R&D (%) | 2.7 | 0.67 |
| Employment in (…) high technology manufacturing sectors and knowledge intensive service sectors (%) | 3.2 | 0.77 |
| R&D personnel (%) | 3.1 | 0.78 |
| Patent applications to the European Patent Office (number per million inhabitants) | 2.9 | 0.74 |
| SDG 10 “Reduced inequalities” | ||
| Adjusted gross disposable income of households per capita (EU28 | 3.0 | 1 |
| SDG 11 “Sustainable cities and communities” | ||
| People killed in road accidents (number per 100 000) | 2.8 | 0.72 |
| SDG 16 “Peace, justice and strong institutions” | ||
| Perceived independence of the justice system (good-bad) | 2.3 | 0.70 |
| Corruption Perceptions Index (score scale of 0 to 100) | 3.4 | 0.80 |
| SDG 17 “Partnership for the goals” | ||
| Official development assistance as share of gross national income (%) | 2.5 | 0.79 |
The amount of variance retained by the first two principal components axes is 41.2%. This suggests that the indicators are spread out along many other dimensions (Fig. 1). The analysis conducted in this section focuses on these first two components, as it is difficult to draw any clear message from the analysis of the following components.
The first component (axis 1) retains 28.5% of the variance. This component separates high-income and low-income countries. Indeed, the adjusted gross disposable income of households (GDI) per capita, as well as indicators strongly correlated with this indicator contribute the most to this component (Table 1): share of people at risk of poverty or social exclusion (AROPE) and of materially deprived people (SDG 1); adults participation in learning (SDG 4); the four indicators related to innovation in SDG 9 (gross domestic expenditure on R&D, employment in high and medium-high technology manufacturing sectors and knowledge-intensive service sectors, R&D personnel, patent applications); people killed in road accidents (SDG 11); as well as perceived independence of the justice system, corruption perceptions (SDG 16) and official development assistance (SDG 17). Bulgaria and Romania, which are the poorest EU countries in terms of GDI/capita are the two countries which contribute the most to this component, with overall performance for these indicators far lower than the average of the EU. Conversely, the Western and Northern European countries (which are the richest of the EU) perform better than average. Four of these countries (Denmark, Finland, the Netherlands and Sweden) contribute strongly to this component axis, and stand at the opposite side from that of Bulgaria and Romania along it.
The second component (axis 2/12.7% of the variance) is more of a catch all, with strong contributions of three main groups of indicators: first, health indicators related to SDG 3 such as life expectancy, share of people with good or very good perceived health, death rate due to chronic diseases, and also death rate due to homicide (with is not part of the list of health indicators); second, employment indicators related to SDG 8 such as the employment rate and the long-term unemployment rate; third, energy indicators (SDG 7) such as the evolution of final energy consumption, the share of renewable energy in gross final energy consumption and energy dependence. Other indicators add up to the list: share of rail and inland water ways activity in total freight transport; resource productivity; general government gross debt, etc. In spite of this diversity, it is remarkable to observe that two groups of countries, which contribute the most to this axis, are clearly opposed along it: on the one hand, the three Baltic states (Estonia, Latvia and Lithuania), which characterize by the highest death rates due to homicide in the EU, the lowest share of people with good or very good perceived health, low life expectancy, high employment rate, as well as a very high share of rail and inland waterways in freight transport, low general government debt, etc.; on the other hand, Greece, Italy and Malta, and more generally Southern European countries, which have opposite performances for these indicators.
Figure 2 features the best represented indicators in the PCA on the correlation circle according to the first two principal component axes of this PCA, that is to say those closest to this circle. By convention we have retained the indicators whose distance to the circle of radius 1 is less than 1/3. These indicators number 38, which represents nearly half of the total indicators selected in our analysis. According to the usual interpretation of the PCA, the proximity between two indicators proves a strong positive correlation between these two indicators. In a correlation circle, each variable is shown as a vector, The angle between two vectors signals the degree of correlation between two indicators. A right angle indicates that two indicators are completely uncorrelated. Figure 2 represents the correlation circle drawn from the corrected values of these indicators: in order to make the correlations (positive or negative) between indicators more visible on this circle, we give a negative sign to the indicators for which a great value is considered negatively by Eurostat [11]. As a consequence, almost all indicators stand to the right of the origin on Fig. 2.
Figure 2.
Correlation circle with axes 1 and 2. Source: Eurostat; authors’ calculations.
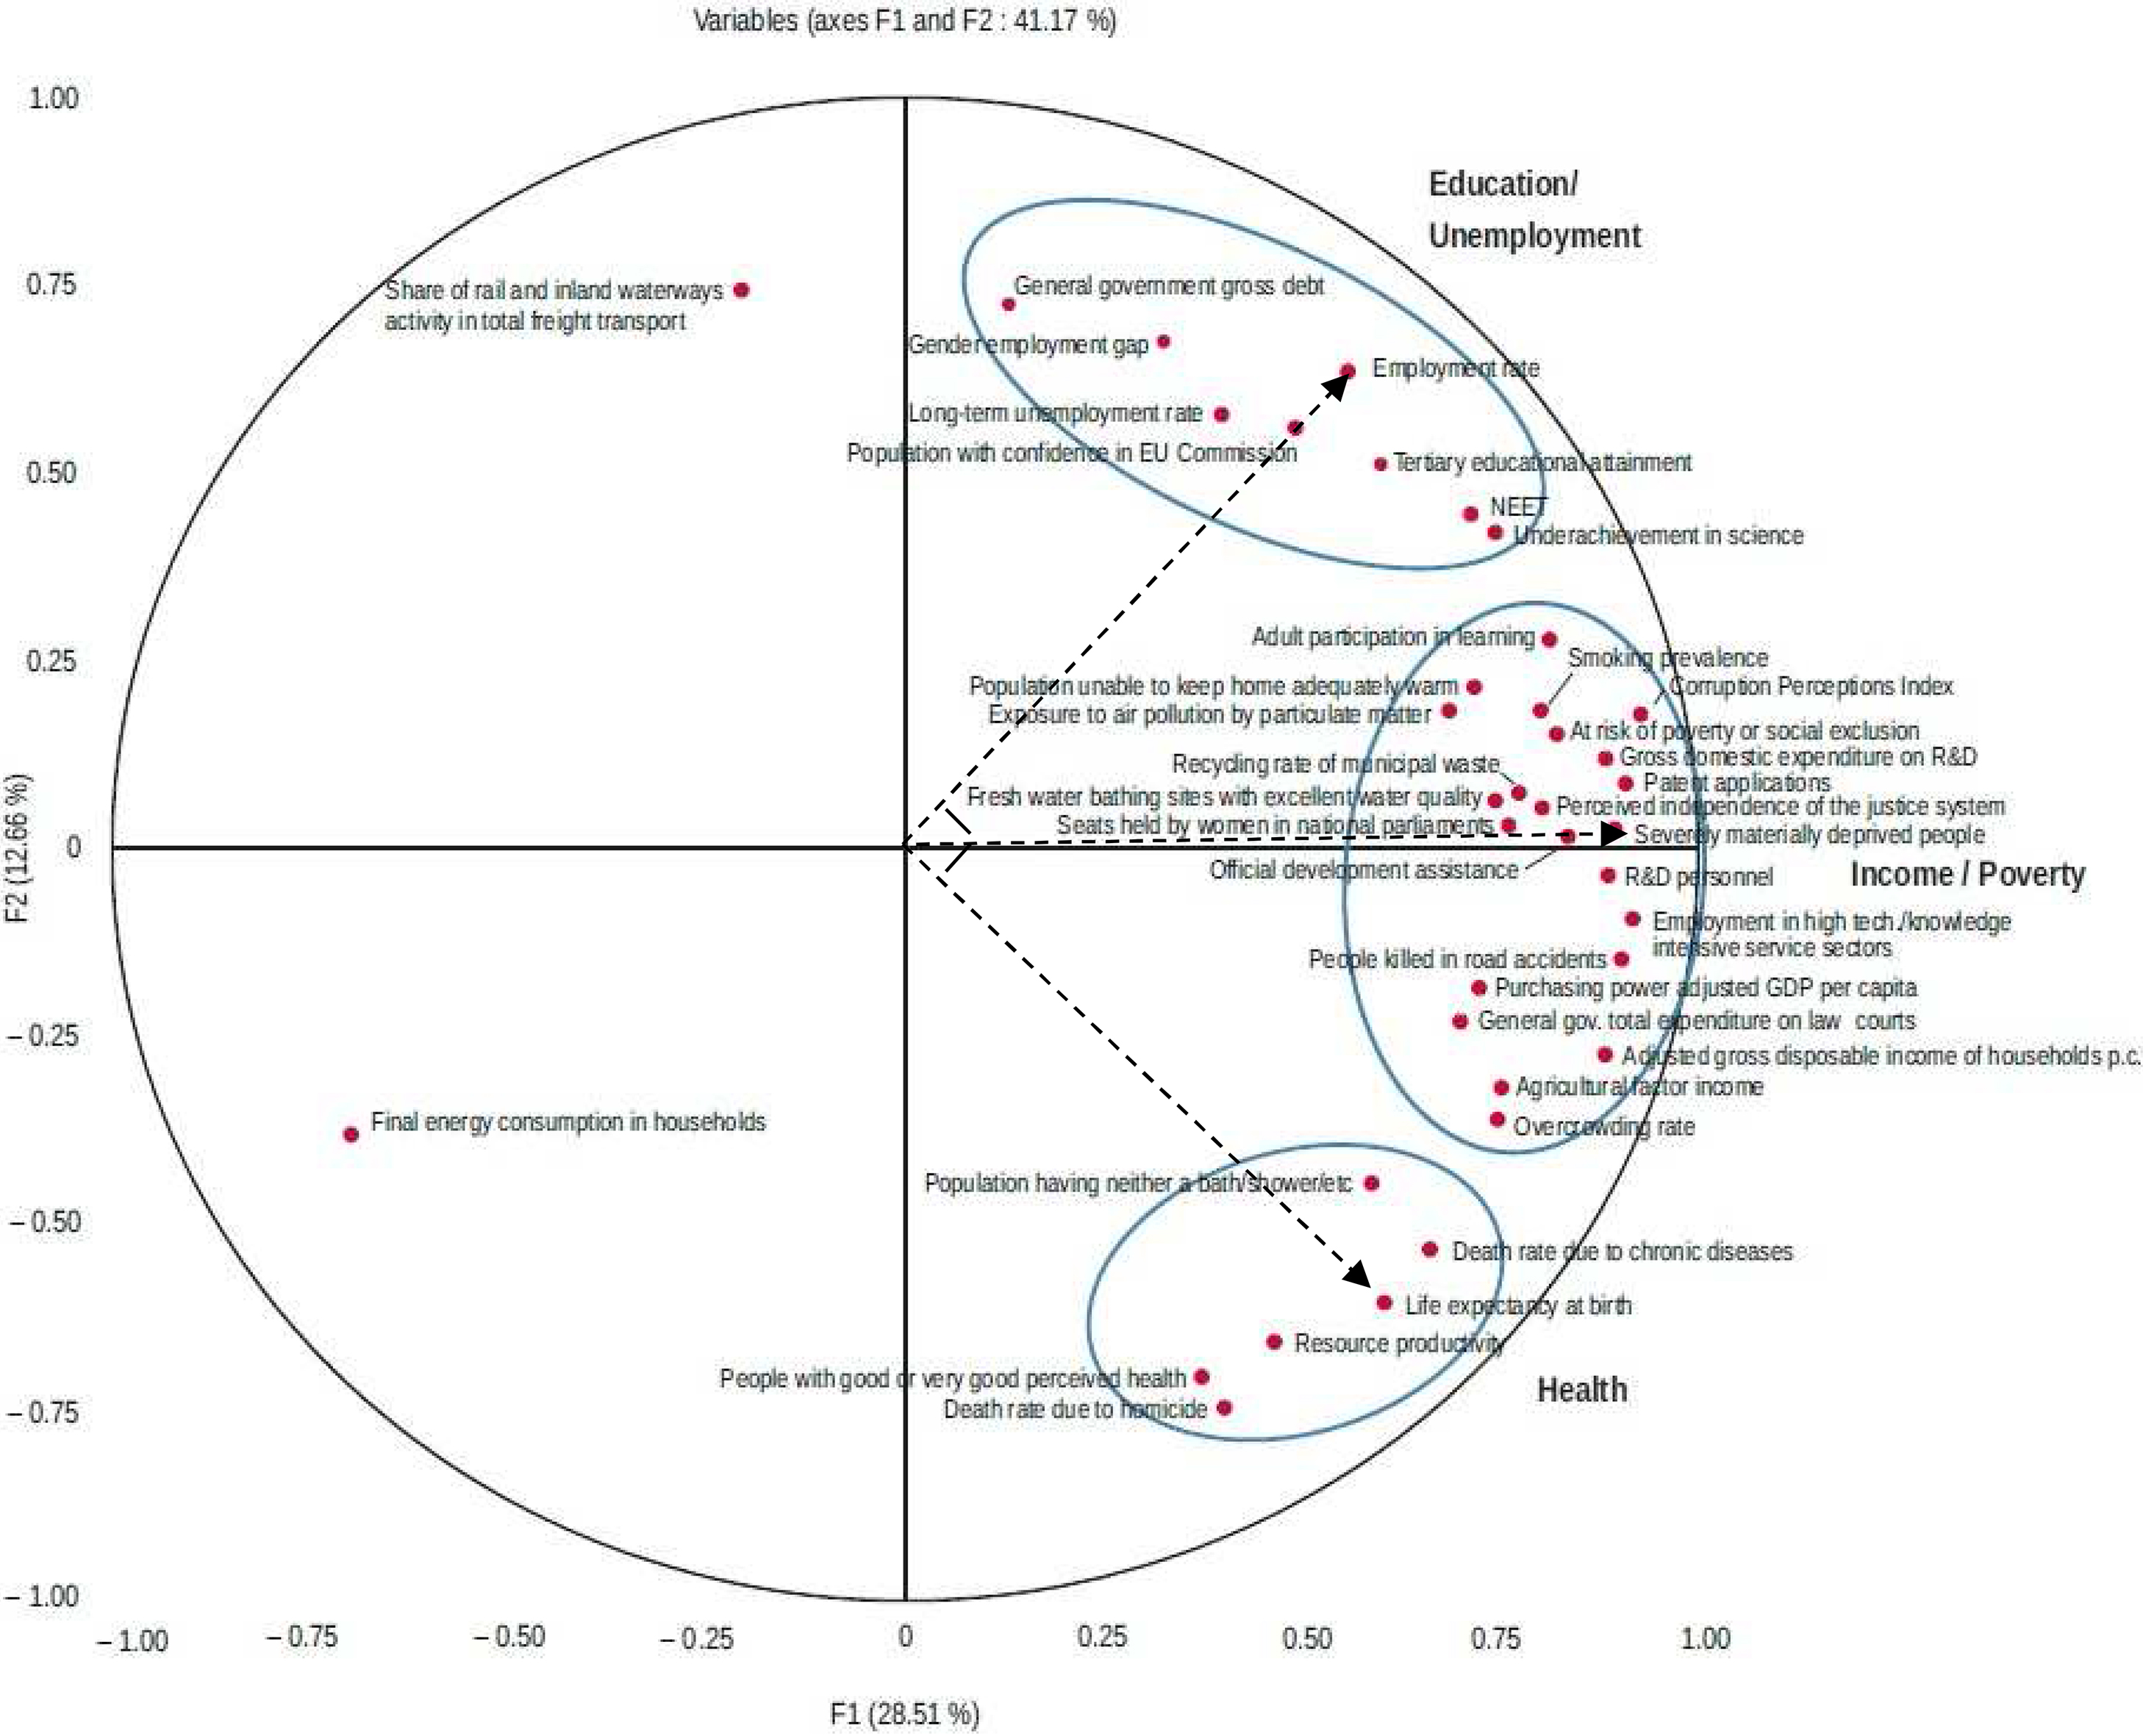
In order to help the reader, although we have removed for clarity reasons most of the vectors corresponding to each variable, we have kept three examples: the share of severely materially deprived people (which stands to the right, very close to the correlation circle above axis 1 after making the correction mentioned here above); life expectancy at birth in the lower right quadrant and the employment rate in the upper right quadrant. The share of severely materially deprived people is correlated to the two other indicators,1111 as shown by the low angle between the vectors. However, life expectancy at birth and the employment rate are not correlated, as there is a right angle between the vectors.
The PCA, which was carried out for the 28 European Union Member States and 88 Sustainable Development Indicators, groups indicators into three broad categories of the economic and social domain (Fig. 2): income/poverty (22 indicators well represented on the correlation circle, mainly belonging to this category); health (6 indicators); education/employment (8 indicators).1212 The indicators for each of these categories are strongly intercorrelated, which is reflected by their proximity on this figure. Two outliers also appear on the left hand side of the correlation circle (share of rail and inland waterways activity in total freight transport; final energy consumption in households).
The income/health/education categories correspond to the components of the Human Development Index as defined by the United Nations Development Programme [17]. In addition, there is also correlation between the three categories: income/poverty correlates with both health and employment/education (health and education/employment, however, do not generally correlate), as shown before based on the examples of three indicators, that is one indicator of each category. Governance is associated with one of the three categories above depending on the indicator.
• The first category of indicators comprises those associated with income, poverty and inequalities. This group includes the majority of the indicators for SDG 1 “Poverty” and SDG 10 “Inequalities”.1313 There are also other indicators on this list that have high correlation with the incidence of poverty in a country: smoking prevalence (SDG 3 “Health”), the share of the population unable to keep home adequately warm (SDG 7 “Energy”) and the rate of overcrowding in housing (SDG 11 “Sustainable Cities”). It should be noted that none of these three indicators appear as strong contributors to neither of the first two components of the PCA. In spite of this, their projection on the plan constituted by these two axes is good enough (in terms of distance to the circle of correlation) to make them appear on Fig. 2. As it has been remarked here above, the majority of indicators for SDG 9 (“Industry, Innovation and Infrastructure”) also fall into this group, which reflects the correlation between the importance of innovation within a country and its level of income.1414
• In terms of health, there is close correlation between the indicators of SDG 3 (“Health”), which also often correlate with those relating to poverty and the level of national income (with the exception of self-reported unmet need for medical care). To give an example, the correlation coefficient between life expectancy at birth and the percentage of severely materially deprived people is
• In terms of education and employment, the indicators for SDG 4 (“Education”) are intercorrelated and correlate with the three indicators for SDG 8 (“Employment”), which relate to employment directly: young people neither in education, nor in employment and training (NEET indicator); employment rate; long-term unemployment rate. The employment gap between men and women (SDG 5 “Gender”) also correlates with these indicators (they are all close to each other). The latter likewise correlate with the indicators for SDG 9 on innovation (see above): gross domestic expenditure on R&D; R&D personnel in the country; patent applications, etc. As already mentioned, the indicators for education and employment also correlate negatively with the poverty indicators.
• Indicators associated with governance also relate to one of the three groups stated above depending on the case. For example, the death rate due to homicide relates, in practice, to indicators associated with health (see above). The indicators associated with perceived independence of justice and perceived corruption are strongly inter correlated and also correlate with the country’s income per capita (as mentioned before, they also contribute strongly to the first component). The correlation between confidence in the judicial system and the level of GDP/capita has been highlighted in comparisons of developed countries [19]. Finally, the proportion of the population with confidence in the European institutions is strongly linked to employment conditions in each country (NEET and long-term unemployment in particular). Only the indicator relating to the population reporting occurrence of crime, violence or vandalism in their area seems to be weakly correlated to the other indicators on the list.
In contrast, the indicators relating to the environment in a broad sense (in particular SDG 7 “Energy”, SDG 13 “Climate” and SDG 15 “Life on Land”) are much more heterogeneous,1515 generally having tenuous links with each other and with those of other categories. Among environment indicators, only two – that is exposure to pollution from fine particulates and the recycling rate of municipal waste – appear on Fig. 2 and therefore correlate strongly with other indicators of the list, especially with the country’s level of income (GDP/capita or GDI/capita). This specificity of environmental indicators should be analysed further. Apart from data quality issues,1616 it might suggest that EU countries follow different environmental models and policies, which go beyond the structure of their economy or their economic development level. For example, as only 6% of France’s electricity comes from fossil fuels compared to 55% in Germany (2015), the former ranks among the lowest greenhouse gas emitters per capita in Europe, whereas the latter ranks among the highest (the strong weight of manufacturing in Germany also contributes to this ranking). Public policy choices, cultural values as well as geographic characteristics play a definite role in this domain.
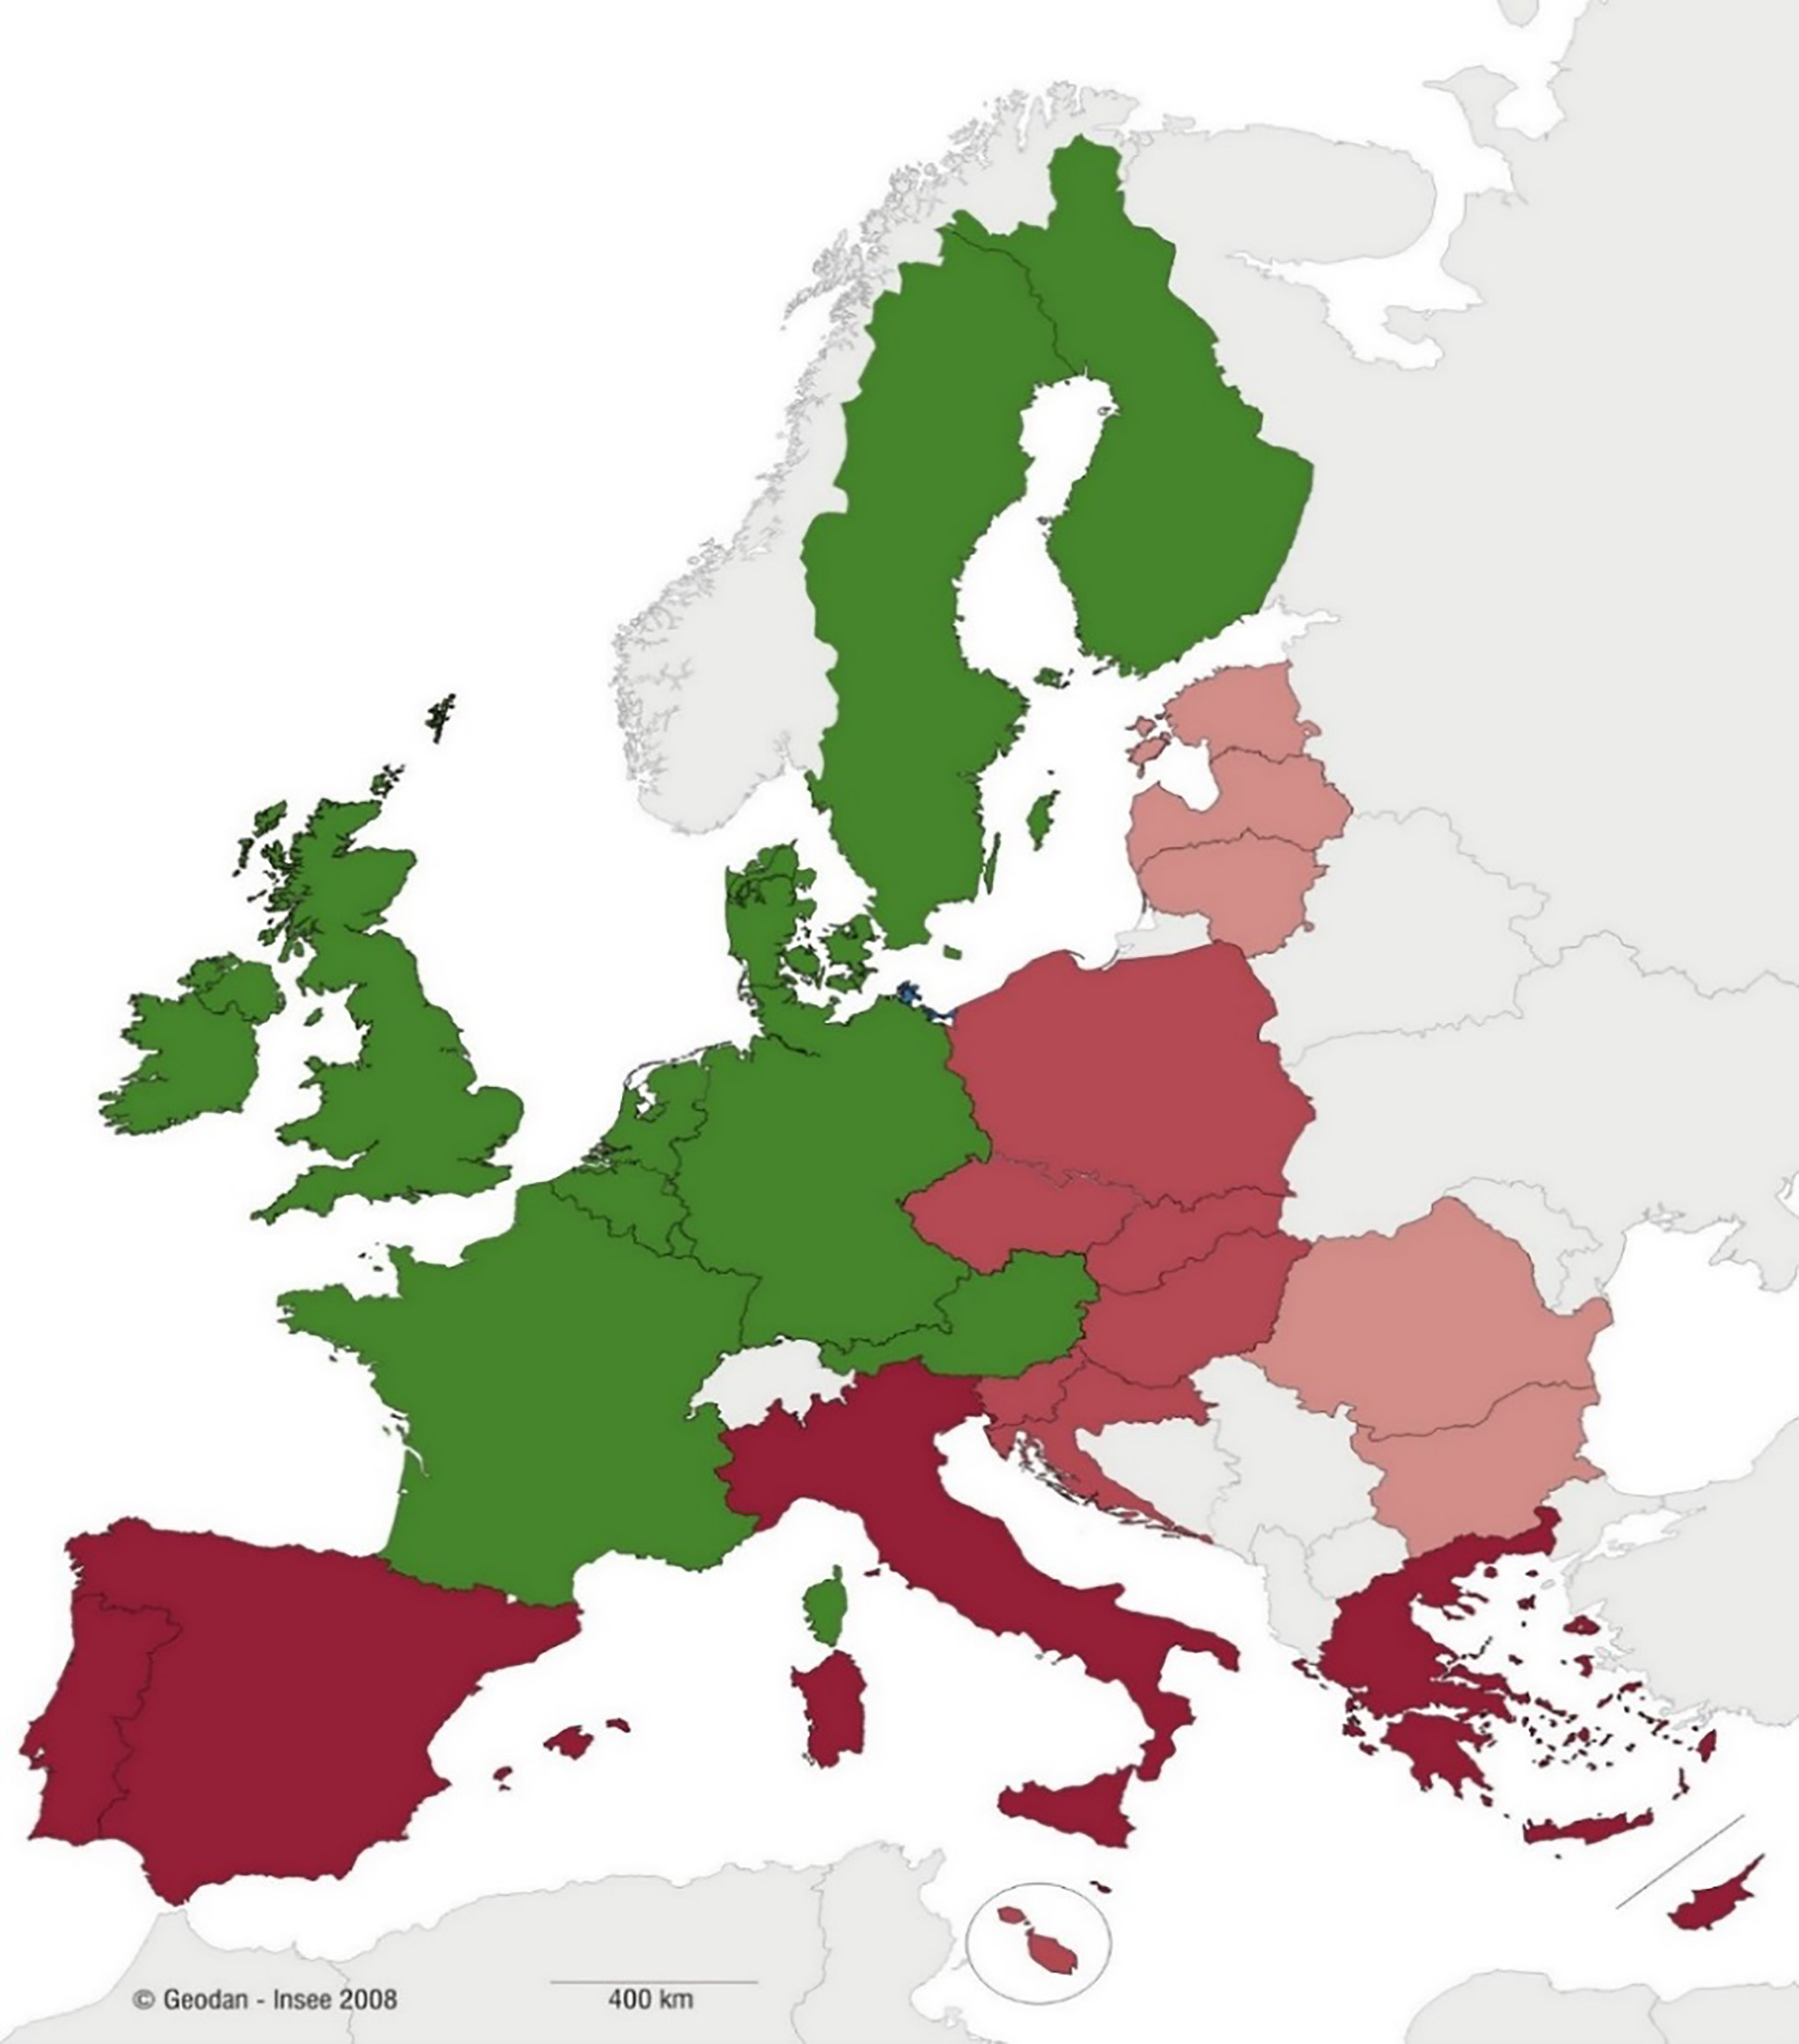
Figure 3.
Classification of the EU countries for the SDG indicators. Source: Eurostat; authors’ calculations. Notes: On this map, Western and Northern Europe is shown in green; Eastern and Southern Europe has been split into three subgroups, shown in different shades of red: Southern Europe; Eastern Europe and Malta; Baltic states, Bulgaria and Romania.
France is the country that is overall closest to the non-weighted average of the EU 28 for these indicators. In statistical terms, France is the country which contributes the least to the overall variance of the observations on the 28 countries according to the results of the Principal Component Analysis (PCA). It is the country with the lowest sum of the squares of the distances for each standardised indicator between the French value and the non-weighted EU average.
At the other end of this scale, there are four countries with the greatest differences: three countries from Eastern and Southern Europe (Bulgaria, Greece and Romania) and Luxembourg. Bulgaria and Romania have a particularly unfavourable situation compared to the EU average in terms of economic and social performance (see hereafter), as well as governance (see corruption perception) and for some environmental indicators. Greece has the most difficult situation in the EU in macroeconomic terms (lowest growth rate in the EU between 2012 and 2017, highest level of public debt, etc.), in terms of employment (the lowest rate of overall employment and employment rate among young graduates, in particular) and in terms of confidence in European institutions (lowest percentage).
Like Bulgaria, Greece and Romania, Luxembourg is among the countries with the greatest distance from the non-weighted average of the EU 28, but this is mostly for opposite reasons as it is the richest country in the EU. On this basis, its economic and social performances are, on the whole, very positive, and for some indicators among the best in the EU. However, Luxembourg has mediocre performance for several environmental indicators (emissions of ammonia from agriculture, of CO
4.Two groups of countries derived from the Hierarchical Cluster Analysis
The Hierarchical Cluster Analysis method (HCA) makes it possible to measure the proximity between EU countries. This method measures the distance between two countries using the distances between the standardised Sustainable Development indicator values for each of those countries. The countries can be split neatly into two groups, roughly dividing the EU population into two equal parts:1717 on the one hand, the countries of Western and Northern Europe, and on the other, the countries of East and Southern Europe (Fig. 3). This classification is the same as that used by the United Nations,1818 and is justified by the fact that the resulting differentiation has an economic, social and institutional, as well as geographical dimension.
The variables that contribute significantly to the segmentation between these two groups are generally similar to the economic, social and governance factors that also emerge from the Principal Component Analysis, and generally belong to the four categories described below. In the case of these indicators, the values are more positive in Western and Northern Europe than in Eastern and Southern Europe in terms of the average and median, with a few exceptions where the classification is the other way around (in particular household final energy consumption per capita, climate-related economic losses and the share of environmental and labour taxes in total in tax revenues).
The first group, which is relatively homogeneous, consists of 11 countries in Western and Northern Europe: Austria, Belgium, Denmark, Finland, France, Germany, Luxembourg, Netherlands, Republic of Ireland, Sweden and the United Kingdom. These are the richest countries in the EU, all with a GDP/capita above the European average. In particular, this group includes all the signatories to the Treaty of Rome, with the exception of Italy, as its recent performance is closer to that of the second group of countries. As a result of their high level of income and a lower level of income inequality, these countries are also the least affected by poverty in its various forms. In accordance with the usual analyses [19], the richest countries in terms of GDP/capita are also, on the whole, those with the healthiest population. In addition, these countries also benefit from both a better level of education and better employment conditions, as well as better governance.
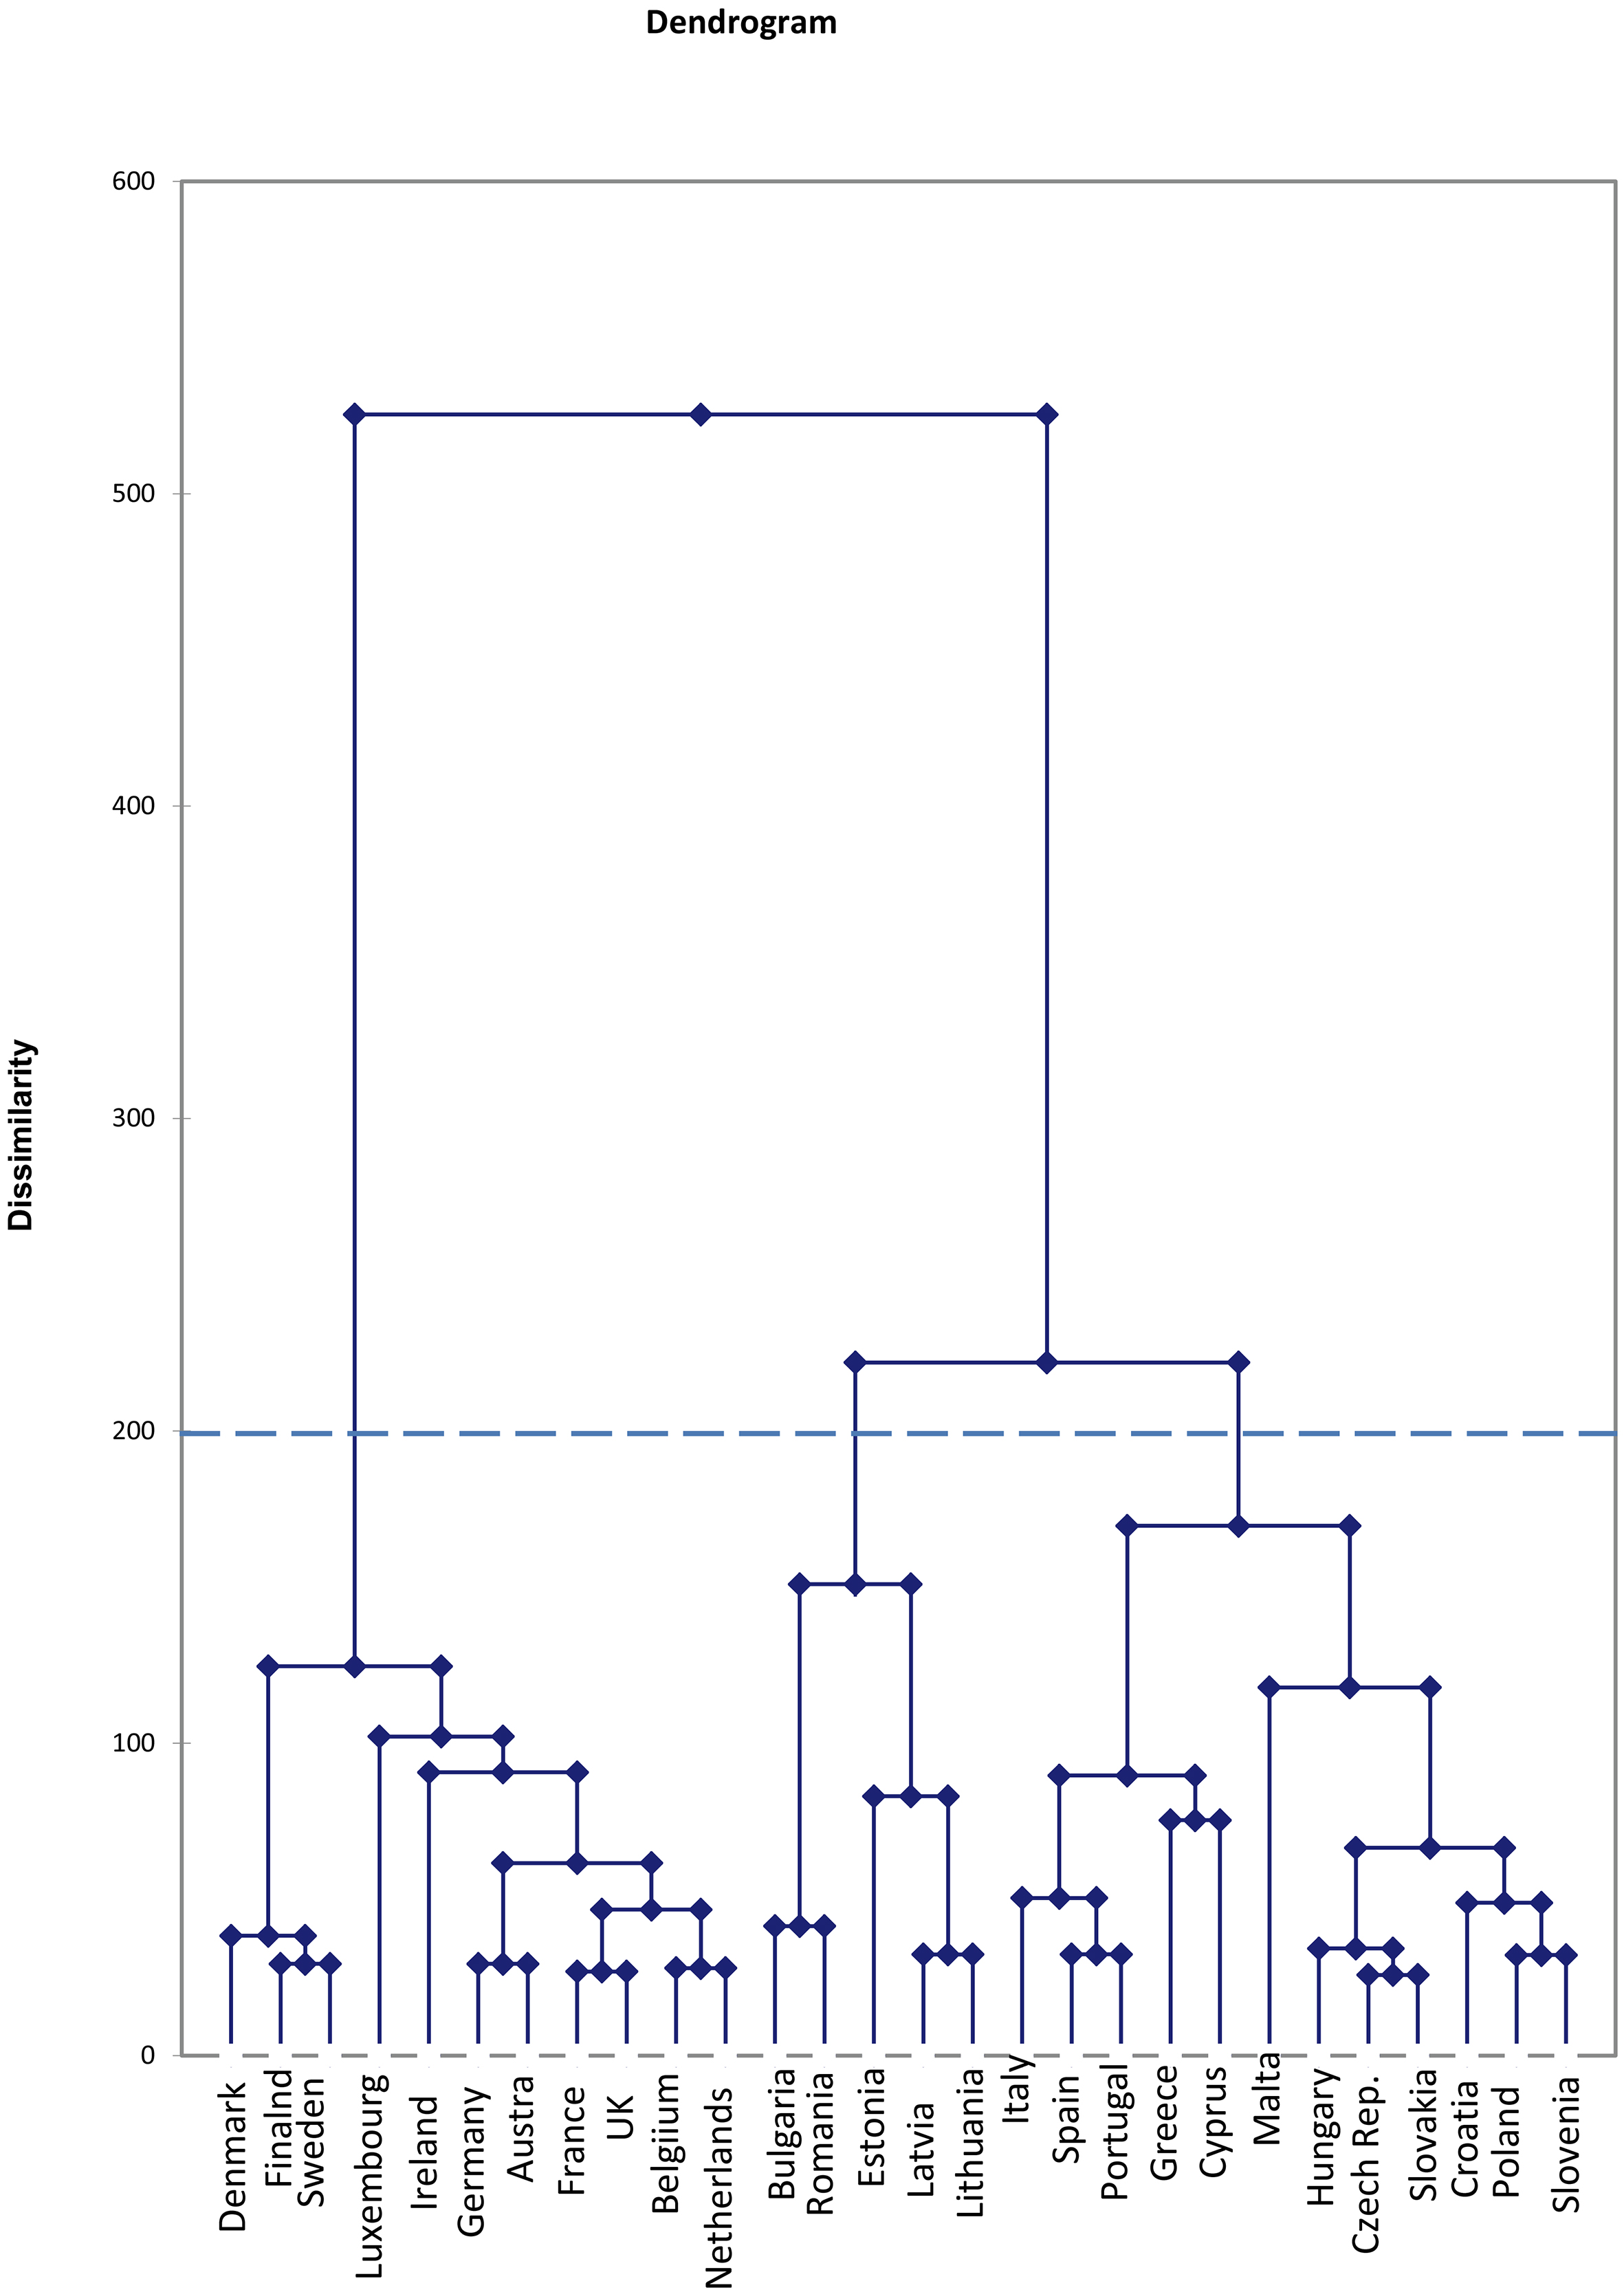
Figure 4.
Dendrogram from the HCA. Source: Eurostat; authors’ calculations.
The second group consists of 17 countries from Eastern and Southern Europe: Bulgaria, Croatia, Cyprus, Czech Republic, Estonia, Greece, Hungary, Italy, Latvia, Lithuania, Malta, Poland, Portugal, Romania, Slovakia, Slovenia and Spain. These countries are classified as being behind those of the first group and below the European average in terms of GDP/capita (even though the gap is minimal between Italy, which belongs to this group, and France, which belongs to the previous group). The median GDP/capita in the second group is less than two thirds (62%) of that of the first group (
Among the 17 countries of Eastern and Southern Europe, a more detailed classification creates three subgroups, which is revealed by the dendrogram (Fig. 4):
• The first subgroup of Mediterranean countries consists of Cyprus, Greece, Italy, Portugal and Spain; this group is primarily categorised by the highest level of public debt in the EU (together with Belgium), low homicide rates (with the exception of Cyprus) and high life expectancy, a high poverty rate among people in employment and low rates of employment of recent graduates, a high percentage of young people neither in employment nor in education and training, a low employment rate, significant levels of long-term unemployment and a rate of growth in GDP/capita significantly lower than in the rest of the EU over the period from 2012 to 2017, etc.;
• The second subgroup consists of the three Baltic states (Estonia, Latvia and Lithuania) together with Bulgaria and Romania; in particular, these countries have a low standard of living and the highest rates of poverty after social transfers and inequalities in the EU (together with Spain), a moderate level of public debt, the highest rates of homicide and road traffic accidents and the lowest life expectancy in the EU (although Estonia’s performance in terms of mortality and life expectancy is slightly higher than that of the other four countries in this group), etc.; in contrast, the rate of growth of GDP per capita in this group of countries was very high between 2012 and 2017;
• Finally, a third subgroup consists of the other former Communist states in Eastern Europe (Croatia, Czech Republic, Hungary, Poland, Slovakia and Slovenia), together with Malta; this group is characterised in particular by a low number of people who have completed tertiary education, low levels of inequalities, fairly negative perceptions of the independence of the justice systems and of the level of corruption.
5.Conclusion
As underlined by Kanbur et al. [20], the measurement of economic performance and social progress faces the inevitable and enduring tension between the pull to broaden and expand indicators on the one hand, and the imperative to keep a relatively small number of top-level indicators on the other. Following the adoption of the SDGs in 2015, the definition by the UN of an extensive list of several hundreds of indicators (
The results of the principal component and hierarchical cluster analyses conducted in this paper show that the interlinkages between EU sustainable development indicators and that the differences between EU countries for these indicators are both quite strong. They also show that they lie mainly on economic and social dimensions. It is especially striking to observe that the breakdown of the EU into two groups of countries, which results from this analysis, clearly distinguishes “rich” and “poor” countries.
As the objective of the SDGs was to go beyond GDP, in order to encompass the different dimensions of sustainable development, further studies based on a more detailed indicators list should try to analyze more in-depth the question of interlinkages, especially the overall lack of correlation of environmental indicators with the others, as well as the strong contribution of economic indicators to the differentiation between countries.
In this perspective, as improving the measurement and the comparability of environment and climate indicators is clearly a long-term objective, some specific analysis could be conducted on environmental and climate issues and their interlinkages with economic and social issues using other kinds of approaches. One should also bear in mind that the EU list of indicators is a mixed bag of input, intermediate and outcome indicators (which is also the case of the UN list); this characteristic should be taken into account into further comparative analysis.
Notes
1 Summits between world leaders held every ten years since 1972 by the UN with the aim of defining means of stimulating sustainable development at a global level. The last World Summit, known as “Rio
2 In fact, the number of indicators is much higher if one takes in account sub-indices. It will be even higher (several thousand) when the disagregations between different categories of population (esp. gender) are adopted.
3 This list of indicators was established in 2018, which means that most indicators refer to 2017.
4 Inter-Agency and Expert Group on Sustainable Development Goals indicators.
5 It has been decided to review this list every 5 years (2020 and 2025), to take into account the progress in statistical methodology.
6 To take an example, the harmonized EU definition of relative poverty, which is based on the 60% to the median ratio, was adopted in 1975, that is almost half a century ago.
7 The 2 remaining ones are related to EU financing to developing countries and to EU imports from developing countries, which by definition can only be measured at the EU level.
8 This study was conducted before the United Kingdom left the European Union on 1/1/2020. Therefore, our data set comprises 28 countries including United Kingdom.
9 Which means substracting the mean from the value of each indicator and dividing by the standard deviation.
10 To be more precise, this component is set such that it contains a maximal amount of the variance in the data set.
11 Before correction, the share of severely materially deprived people is negatively correlated to life expectancy at birth and the employment rate. After inverting the sign of the share of severely materially deprived people in order to displace this indicator to the right-hand side of Fig. 2, the correlation appears to be positive.
12 To check the robustness of these categories, we did the same exercise based on the first and third components of the PCA, instead of the first and second components. The list of indicators close to the correlation circle changes slightly. However, and this is what matters for the robustness of our analysis, the thematic categories remain unchanged (and the correlation between the indicators of these categories).
13 With the exception of the indicator relating to asylum applications, inclusion of which under this goal seems atypical.
14 The last two indicators for SDG 9 relating to the proportion of public transport used for passenger travel and the share of railway and inland waterways activity in total freight transport are quite different in nature and are therefore not part of this group.
15 For instance, while all the indicators of goal 1 on poverty share the same unit (that is the % of population), the indicators of goal 7 on energy are measured using a large variety of units: absolute consumption index (base 2000 or 2005), kgoe, %, etc. By definition, these indicators are very heterogeneous.
16 The sustainable development indicators related to the environment suffer from various quality problems and their overall quality is inferior to the quality ensured for socio-economic indicators. For several of these indicators a breakdown by EU countries is not available, which forced us to remove these indicators from our analysis. There are many missing values for other indicators (see indicators commented in box 3), which also prevented us from including them in the PCA/HCA.
17 The population of the first group of countries is 278 million and the population of the second group is 233 million (2016).
18 Our grouping differs marginally from that of the UN, as it includes the Baltic States and Cyprus in Eastern and Southern Europe.
Acknowledgments
The authors would like to thank Olivier Sautory for his invaluable support in analyzing the data compiled in this study, Sébastien Roux for his most relevant comments on a previous version of this paper, as well as two anonymous referees. The views expressed in this paper are entirely those of the authors and do not reflect those of their employer.
References
[1] | United Nations. Transforming our world: the 2030 Agenda for Sustainable Development, A/RES/70/1, New York, (2015) . |
[2] | United Nations. Report of the World Commission on Environment and Development (chaired by G.H. Bruntland): Our Common Future, A/42/427, New York, (1987) . |
[3] | Stiglitz J.E., Sen A., Fitoussi J.-P. Report by the Commission on the Measurement of Economic Performance and Social Progress, Paris, (2009) . |
[4] | Stiglitz J.E., Fitoussi J.-P., Durand M. Beyond GDP; Measuring what counts for economic and social performance, Paris: OECD, (2018) . |
[5] | Miola A., Borchardt S., Neher F., Buscaglia D. Interlinkages and policy coherence for the Sustainable Development Goals implementation: An operational method to identify trade-offs and co-benefits in a systemic way, EUR 29646 EN, Publications Office of the European Union, Luxembourg, (2019) . |
[6] | United Nations. Interlinkages of the 2030 Agenda for Sustainable Development, Background document prepared for the 50 |
[7] | United Nations. Second report of the Interlinkages Workstream, Background document prepared for the 51 |
[8] | Joliffe I.T. Principal Component Analysis, 2 |
[9] | Sachs J., Schmidt-Traub G., Kroll C., Lafortune G., Fuller G. Sustainable Development Report 2019. New York: Bertelsmann Stiftung and Sustainable Development Solutions Network, (2019) . |
[10] | OECD. Measuring Distance to the SDG Targets 2019; An Assessment of Where OECD Countries Stand, Paris: OECD, (2019) . |
[11] | Eurostat. Sustainable development in the European Union, Luxembourg: Eurostat, (2018) . |
[12] | Cling J.-P., Eghbal-Téhérani S., Orzoni M., Plateau C. The Differences between EU Countries for Sustainable Development Indicators: It is (mainly) the Economy! Working Paper N |
[13] | Lebart L., Morineau A., Warwick K.M. Multivariate Descriptive Statistical Analyis, New York: Wiley, (1984) . |
[14] | United Nations. Work of the Statistical Commission pertaining to the 2030 Agenda for Sustainable Development, A/RES/71/313, New York, (2017) . |
[15] | European Commission. Next steps for a European sustainable future; European action for sustainability, Communication from the Commission to the European Parliament, the Council, the European Economic and Social Committee and the Committee of the Regions, 22 November (2016) . |
[16] | European Commission. EU SDG Indicator Set 2018; Result of the Review in Preparation of the 2018 Edition of the EU SDG Monitoring Report, Eurostat, 3 April (2018) . |
[17] | UNDP. Human Development Report, New York: United Nations Development Programme, (2018) . |
[18] | Algan Y. Trust and social capital, in Stiglitz J.E., Fitoussi J.-P., Durand M. eds., “For Good Measure: Advancing Research on Well-Being Metrics Beyond GDP”, Paris: OECD (2018) . |
[19] | Deaton A. The Great Escape: Health, Wealth and the Origins of Inequality, Princeton: Princeton University Press, (2013) . |
[20] | Kanbur R., Patel E., Stiglitz J.E. Sustainable Development Goals and the measurement of economic and social progress, in Stiglitz J.E., Fitoussi J.-P., Durand M. eds., For Good Measure: Advancing Research on Well-Being Metrics Beyond GDP, Paris: OECD, (2018) . |
Appendices
Annex: List of EU sustainable development indicators (2018)
| Indicators for SDG 1 ‘No poverty’, by sub-themes |
| Multidimensional poverty |
| People at risk of poverty or social exclusion (%) |
| People at risk of income poverty after social transfers (%) |
| Severely materially deprived people (%) |
| People living in households with very low work intensity (%) |
| In work at-risk-of-poverty rate (%) |
| Basic needs |
| Population living in a dwelling with a leaking roof, damp walls, floors or foundation or rot in window frames or floor (%) |
| Self-reported unmet need for medical care (%) ( |
| Population having neither a bath, nor a shower, nor indoor flushing toilet in their household (%) ( |
| Population unable to keep home adequately warm (%) ( |
| Overcrowding rate (%) ( |
| Indicators for SDG 2 ‘Zero hunger’, by sub-themes |
| Malnutrition |
| Obesity rate (%) |
| Sustainable agricultural production |
| Agricultural factor income per annual work unit (Euro) (AWU) |
| Government support to agricultural research and development (Euro/cap.) |
| Area under organic farming (%) |
| Gross nitrogen balance on agricultural land (kg/ha) |
| Adverse impacts of agricultural production |
| Ammonia emissions from agriculture (kg/ha) |
| Nitrate in groundwater (mg NO |
| Estimated soil erosion by water (%) ( |
| Common farmland bird index ( |
| Grassland butterfly index ( |
| Indicators for SDG 3 ‘Good health and well-being’, by sub-themes |
| Healthy lives |
| Life expectancy at birth (years) |
| Share of people with good or very good perceived health (%) |
| Health determinants |
| Smoking prevalence (%) |
| Obesity rate (%) ( |
| Population living in households considering that they suffer from noise (%) ( |
| Exposure to air pollution by particulate matter ( |
| Causes of death |
| Death rate due to chronic diseases (number/100 000) |
| Death rate due to tuberculosis, HIV and hepatitis (number/100 000) |
| People killed in accidents at work (number/100 000 employees) ( |
| People killed in road accidents (number/100 000 inhabitants) ( |
| Access to healthcare |
| Self-reported unmet need for medical care (%) |
| Indicators for SDG 4 ‘Quality education’, by sub-themes |
| Basic education |
| Early leavers from education and training (%) |
| Participation in early childhood education (%) |
| Underachievement in reading, maths and science (%) |
| Young people neither in employment nor in education and training (%) ( |
| Tertiary education |
| Tertiary educational attainment (%) |
| Employment rate of recent graduates (%) |
| Adult education |
| Adult participation in learning (%) |
| Indicators for SDG 5 ‘Gender equality’, by sub-themes |
| Gender-based violence |
| Physical and sexual violence to women experienced within 12 months prior to the interview (%) |
| Education |
| Gender gap for early leavers from education and training (%) ( |
| Gender gap for tertiary educational attainment (%) ( |
| Gender gap for employment rate of recent graduates (%) ( |
| Employment |
| Gender pay gap in unadjusted form (%) |
| Gender employment gap (percentage points) |
| Inactive population due to caring responsibilities (%) |
| Leadership positions |
| Seats held by women in national parliaments (%) |
| Positions held by women in senior management (%) |
| Indicators for SDG 6 ‘Clean water and sanitation’, by sub-themes |
| Sanitation |
| Population having neither a bath, nor a shower, nor indoor flushing toilet in their household (%) |
| Population connected to at least secondary wastewater treatment (%) |
| Water quality |
| Biochemical oxygen demand in rivers (mg O |
| Nitrate in groundwater (mg NO |
| Phosphate in rivers (mg PO |
| Freshwater bathing sites with excellent water quality (%) ( |
| Water use efficiency |
| Water exploitation index (%) |
| Indicators for SDG 7 ‘Affordable and clean energy’, by sub-themes |
| Energy consumption |
| Primary and final energy consumption (2005 |
| Final energy consumption in households per capita (kgoe) |
| Energy productivity (PPS/kgoe) |
| Greenhouse gas emissions intensity of energy consumption (2000 |
| Energy supply |
| Share of renewable energy in gross final energy consumption (%) |
| Energy dependence (%) |
| Access to affordable energy |
| Population unable to keep home adequately warm (%) |
| Indicators for SDG 8 ‘Decent work and economic growth’, by sub-themes |
| Sustainable economic growth |
| Real GDP per capita (average annual growth rate 2012–2017 in %) |
| Investment share of GDP (%) |
| Resource productivity (PPS/kg) ( |
| Employment |
| Young people neither in employment nor in education and training (%) |
| Employment rate (%) |
| Long-term unemployment rate(%) |
| Inactive population due to caring responsibilities (%) ( |
| Decent work |
| People killed in accidents at work (number/100 000) |
| In work at-risk-of-poverty rate (%) ( |
| Indicators for SDG 9 ‘Industry, innovation and infrastructure’, by sub-themes |
| R&D and innovation |
| Gross domestic expenditure on R&D (%) |
| Employment in high- and medium-high technology manufacturing sectors and knowledge intensive service sectors (%) |
| R&D personnel (%) |
| Patent applications to the European Patent Office (number per million inhabitants) |
| Sustainable transport |
| Share of buses and trains in total passenger transport (%) |
| Share of rail and inland waterways activity in total freight transport (%) |
| Average CO2 emissions per km from new passenger cars ( |
| Indicators for changes in SDG 10 ‘Reduced inequalities’, by sub-themes |
| Inequalities within countries |
| Inequality of income distribution (income quintile share ratio) |
| Income share of the bottom 40 % of the population (%) |
| Relative median at-risk-of-poverty gap (%) |
| People at risk of income poverty after social transfers (%) ( |
| Inequalities between countries |
| Purchasing power adjusted GDP per capita (EU28 |
| Adjusted gross disposable income of households per capita (EU28 |
| EU financing to developing countries (%) ( |
| EU imports from developing countries (%) ( |
| Migration and social inclusion |
| Asylum applications (number per million inhabitants) |
| Indicators for SDG 11 ‘Sustainable cities and communities’, by sub-themes |
| Quality of life in cities and communities |
| Overcrowding rate (%) |
| Population living in households considering that they suffer from noise (%) |
| Exposure to air pollution by particulate matter ( |
| Population living in a dwelling with a leaking roof, damp walls, floors or foundation or rot in window frames or floor (%) ( |
| Population reporting occurrence of crime, violence or vandalism in their area (%) ( |
| Sustainable transport |
| Difficulty in accessing public transport (%) |
| People killed in road accidents (number per 100 000) |
| Share of busses and trains in total passenger transport (%) ( |
| Adverse environmental impacts |
| Recycling rate of municipal waste (%) |
| Population connected to at least secondary wastewater treatment (%) ( |
| Artificial land cover per capita ( |
| Indicators for SDG 12 ‘Responsible consumption and production’, by sub-themes |
| Decoupling environmental impacts from economic growth |
| Consumption of toxic chemicals |
| Resource productivity (PPS/kg) |
| Average CO |
| Energy productivity (PPS/kgoe) ( |
| Energy consumption |
| Primary and final energy consumption (2005 |
| Share of renewable energy in gross final energy consumption (%) ( |
| Waste generation and management |
| Circular material use rate (%) |
| Generation of waste excluding major mineral wastes (kg/capita) |
| Recycling and landfill rate of waste excluding major mineral waste (%) |
| Indicators for SDG 13 ‘Climate action’, by sub-themes |
| Climate mitigation |
| Greenhouse gas emissions (tonnes/capita) |
| Greenhouse gas emissions intensity of energy consumption (2000 |
| Primary and final energy consumption (2005 |
| Share of renewable energy in gross final energy consumption (%) ( |
| Average CO |
| Climate impacts |
| Mean near surface temperature deviation ( |
| Climate-related economic losses (Euro/capita) |
| Mean ocean acidity (pH value) ( |
| Support to climate action |
| Contribution to the international 100 bn USD commitment on climate related expending (Euro million) |
| Population covered by the Covenant of Mayors for Climate and Energy signatories (%) |
| Indicators for SDG 14 ‘Life below water’, by sub-themes |
| Marine conservation |
| Surface of marine sites designated under Natura 2000 (km |
| Sustainable fisheries |
| Estimated trends in fish stock biomass (2003 |
| Assessed fish stocks exceeding fishing mortality at maximum sustainable yield (%) |
| Ocean health |
| Freshwater & Seawater bathing sites with excellent water quality (%) |
| Mean ocean acidity (pH value) |
| Indicators for SDG 15 ‘Life on land’, by sub-themes |
| Ecosystem status |
| Share of forest area (%) |
| Biochemical oxygen demand in rivers (mg O |
| Nitrate in groundwater (mg NO |
| Phosphate in rivers (mg PO |
| Land degradation |
| Artificial land cover per capita (m |
| Estimated soil erosion by water (%) |
| Biodiversity |
| Surface of terrestrial sites designated under Natura 2000 (km |
| Common bird index (2000 |
| Grassland butterfly index (2000 |
| Indicators for SDG 16 ‘Peace, justice and strong institutions’, by sub-themes |
| Peace and personal security |
| Death rate due to homicide (number/100 000) |
| Population reporting occurrence of crime, violence or vandalism in their area (%) |
| Physical and sexual violence to women experienced within 12 months prior to the interview (%) ( |
| Access to justice |
| General government total expenditure on law courts (Euro/capita) |
| Perceived independence of the justice system (%) |
| Trust in institutions |
| Corruption Perceptions Index (score scale of 0 to 100) |
| Population with confidence in EU institutions (%) |
| Indicators for SDG 17 ‘Partnership for the goals’, by sub-themes |
| Global partnership |
| Official development assistance as share of gross national income (%) |
| EU financing to developing countries (billion Euro) |
| EU imports from developing countries (billion Euro) |
| Financial governance within the EU |
| General government gross debt (%) |
| Shares of environmental and labour taxes in total tax revenues (%) |
Source: Eurostat.

