
Methods of statistical estimation of circular migration and formal and informal employment in the Moscow agglomeration based on the integration of various data sources
Abstract
Assessing circular migration, formal and informal employment and its spatiotemporal characteristics is a complex methodological and practical task for official statistics.
A combination of various data sources, including official statistics, administrative data, and data from mobile operators, may provide new opportunities for obtaining circular migration, formal and informal employment estimates for the purposes of various levels of government, including the level of city management.
The purpose of this paper is to demonstrate how the use of administrative data together with the mobile operators’ data can promptly improve the accuracy and informativeness of statistical indicators of the labor market including formal and informal employment, circular migration, etc. The population and employment in Moscow and in the Moscow agglomeration are the subjects of this paper.
Authors combine several data sources such as the federal administrative data from the Pension Fund of the Russian Federation and the Federal Tax Authority, data from the Moscow city online public services, data from the mobile phone operators, as well as official statistical information provided by Russian Statistic Authority.
The cross-analysis of the data provides important information for the city governance:
• estimations of the permanent and temporary population of Moscow and the Moscow agglomeration;
• the scale and main directions of the circular migration to and from Moscow and the subsequent delimitation of the real borders of the Moscow agglomeration;
• formal and informal employment in the city.
The limits of the data used, as well as recommendations for the incorporating administrative and mobile operators’ data into the system of official statistics and city management, are also discussed in this paper.
1.Introduction
Population and labor market statistics including the formal and informal employment evaluation is important for the decision-making on the national (federal), regional and local levels of administration. It is necessary for the budgeting, development of public transportation, social security, health protection, education, etc. The official statistical data is insufficient for managing entire urban agglomerations in part because of their population size and ensuing consequences [29]. The key problems in this field include lack of data, incorrect selection of companies for representing economy of a city, late availability of data, methodological changes and gaps in time series, etc. [3, 46]. The combination of different data sources including official statistics, the administrative and the mobile operators’ data can give a new perspective for the city management.
Over the past few decades, many of the largest urban agglomerations have faced the problem of explosive growth of their influence on neighboring territories and, as a result, the problem of increasing circular migration [2, 13, 20]. Its extremely poor controllability by direct regulation and varying nature of this migration (labor, leisure, social, etc.) predetermined the challenges for the agglomeration authorities and national statistical institutions to assess the extent of this phenomenon. At the current stage of the world economic development, it is the largest urban agglomerations that face with the need for more reliable statistics of their population and its flows between neighboring territories due to their significantly higher unit costs of infrastructure developing, in the broad sense of the word, in comparison with less urbanized territories. The largest cities and their agglomerations, which have large financial, labor and intellectual resources, act today as drivers of the new statistical tools’ development, including methods for estimating the population size, circular migration and employment structure.
Large cities authorities are not the only parties concerned by quality population statistics – national (federal) authorities are also interested in it [15]. The main interest from the view of national authorities is a combination between a better understanding of the socio-economic processes taking place in the country and, the associated with it, more advantageous budget spending [28]. In the context of the growing role of the largest urban agglomerations in the overall economic deve- lopment of the whole country the allocation of priorities for the national budget spending is of particular relevance [47]. Involving the interests of various levels authorities in the processes of assessing statistical indicators of population size, circular migration and the labor market suggests the multiscale relevance of this study.
The purpose of this paper is to demonstrate how the use of variation of different data sources, such as administrative and the mobile operators’ data, can promptly improve the accuracy and informativeness of statistical indicators including permanent and day population, formal and informal employment and its localization, circular migration, etc. The population and employment in the Moscow city and in the Moscow agglomeration as one of the largest in the world are the subjects of this paper. The authors’ view is primary the view of the users of the statistical information for the tasks of the city governance.
2.Study of the problem
The problem of estimating the population, in general, and the components of it, in particular, has been discussed in scientific and authority communities for a long time. The increasing complexity of socio-economic processes in society and the accelerated trend of urban sprawl necessitate advancing the method of population statistics. The scientific community has begun to develop tools for estimating the population size and scale of migration flows, which differed from previously dominant direct accounting methods. The most important works for the current stage were the works in the field of studying migration systems as an element of a systems approach in demographic and geographical research [41]. A greater emphasis in such works was on the processes of international migration, however, the concept of “migration chains” was applied at the micro level of cities [39]. This method involved the analysis of local groups of migrants (usually united by ethnicity) and their “migration chains” – combination of the main direction of movement, the reasons for migration and communication with familiar people in the destination city. This allowed the first researches in the field of the current assessment and forecast of the scale of population migration in cities and the level of informal employment in them.
A fundamentally new round of migration analysis, especially circular migration, has been the development of chronographic concepts, which is closely related to the Swedish geographer T. Hagerstrand and his students. In these works, individual trajectories of the movement of people were analyzed for the first time [6, 16, 38]. Researches in this area was mainly based on field studies of road traffic analyses in the suburban area of large cities and highlighting main borders of the circular labor migration. This served as a prototype for present researches with the using of modern technology.
For now, the key problem in field of estimating the extent of circular migration and informal employment in the economy, as well as other adjacent topics, was imperfection and significant limitations on use of the “classical” statistical data sources such as companies’ surveys, census and other similar methods [22, 23]. Moreover, the old methods of statistical observations in many cases did not allow calculating indicators in the field of circular migration and informal employment. The solution was the usage of alternative data sources and their inclusion in the general statistical system.
One of the earliest kinds of such sources became administrative data from authorities and their subordinate organizations. Pioneers in this area were national statistical authorities of Nordic countries [35, 44] and, to a lesser extent, Canada [43] and several Western European countries [45]. The Nordic countries have a long tradition in using administrative data sources – their comparatively small population and area allowed the administrative data to be included in the general national system of statistical observations from a very early time (first experiments can date back to the 1960s). The earliest practices of using administrative data are related to the use of data from registering authorities regarding population and migration in the country and its individual parts or regions [19]. Further, the practice of using the data of the registering authorities for statistical purposes extended to such indicators as the number of households and living conditions, the number of firms and entrepreneurs, the employment of the population in various sections, the level of income, the level of education, etc. Later, similar experience was used in other Western European countries, and then included in the general system of European statistical observations and started to be used by the Eurostat. The administrative data can be also used for the production of the official statistics even without the existence of the population register (e.g., in New Zealand) [4].
At the present day, many authors notice that usage of administrative data by national statistical authorities has come out from the experimental stage and has become common practice in the developed countries and regions [40]. However, innovative approaches to the use of administrative data continue to evolve. New tools are associated mostly with the development of GIS systems. The Nordic countries have developed a point-based statistical system – the locations of buildings or other statistical units are specified using geographical coordinates, giving the exact location of them using developed linking system [35].
Development of mobile connection and Internet technologies combined with their widespread penetration into everyday life provide new opportunities for the circular migration and informal employment analysis. The first circular labor migration studies using such data were carried out in the USA and EU countries in the late 1990s – early 2000s [7]. A significant part of these studies examined the distance of daily rides and their causes, as well as the main and local centers delimitation in agglomerations [8, 37]. Earlier research was based on the analysis of the simple density of mobile signals (number of calls per square) depending on their time and location. This allowed to study the pulsation of economic activity in the city during the day, week or year, but did not allow to accurately determine the direction of people’s movement during these periods [7, 11, 18]. More modern methods of using mobile operations’ data involve an individualized analysis of personal movements (without disclosing data about the owner himself). This made it possible to give information not just about the scale of the activity itself at a given time, but also to answer the questions about the sources, directions and purposes of movements [5]. The similar analysis can be found in recent experience of Estonia [26], Finland [36], and Indonesia [10].
In Russia, one of the first attempts of using mobile operators’ data to research circular migration on the example of Moscow agglomeration was the work of researchers group for the Moscow Urban Forum in 2013 [1]. The very deep penetration of mobile communications in Russia and almost total coverage of the entire population with mobile communications (the number of mobile subscriptions in Russia as a whole exceeds the population by more than 2 times, and in Moscow and Moscow oblast more than 3 times by the survey-based Rosstat data) made extremely detailed statistics of the permanent population, circular and inter-regional migration estimations possible. Afterwards, a number of studies of the circular migration and informal employment in other large urban agglomerations of Russia based on new data sources have been published [25, 31, 32, 33].
Overall, most works note the disadvantages of using only one data source in the description of the migration situation and labor market condition especially in large urban agglomerations. Combination of the various data sources (such as statistical surveys of companies and population, administrative data, Big Data sources from mobile and Internet-related companies, etc.) is presented as the optimal solution for the correct assessing of the scale of circular migration and informal employment [17]. Using of several data sources can provide the quality advantage to the final statistical values due to annihilation of each other’s shortcomings and errors.
3.Data source description
For the purposes of this study, including the estimations of the population of Moscow and the Moscow agglomeration, the extent of circular migration and informal employment, the authors used a combination of the following data sources and their subsequent analysis:
1. Official statistic data provided by Russian Statistic Authority (the Rosstat). It is an example of using “classic” statistical analysis tools. The Rosstat calculate the resident population based on a continuous population census (the last one in Russia was in 2010) and subsequent adjustment for the birth rate, mortality rate and the registered migration balance. Between censuses, an error accumulates due to accounting for population growth born in the Moscow, but immediately moved out to another region; and omission of persons who changed their place of actual residence, but did not change their place of registration. The scale of circular migration in the large urban agglomerations of Russia is not currently calculated by the Rosstat. Such assessment can only be created by using alternative data sources;
2. The federal administrative data from the Pension Fund of the Russian Federation (PFR): individual anonymized data on monthly basis, official employment, salaries and data on registered individual entrepreneurs. In 2016, the Moscow Government and the PFR signed the agreement on information interaction. In accordance with the agreement, the PFR transfers depersonized data of employees and employers operating in the territory of Moscow city and paying insurance premiums to the Department of Economic Policy and Development of Moscow. In contrast to official statistics by the Rosstat, we have continuous, and not selective, monitoring of all employers and workers who pay and receive official wages. In Moscow, this is about 9.5 million people, more than 330 thousand organizations, and about 200 thousand individual entrepreneurs and self-employed;
3. Data from the Moscow city registers and online public services such as the Unified Medical Information Analysis System (UMIAS), the educational system (KIS GUSOEV), the “My Documents” system, housing and utility payment system (EIRC). These data sources allow us to identify in more detail the population groups receiving various services in Moscow, and take them into account when assessing circular migration from the other regions of Russia;
4. Data from the 3 biggest mobile phone operators in Russia provided by the Department of Information Technologies of Moscow City Government. The people’s location is determined based on measurements of their distance from the 3 nearest stations, depending on the signal strength (its power), and generalized to the 300 to 300 meters surface cells. The system registers subscribers who make calls during the day with a gap of 30 minutes. Thus, data of the movement of the subscriber is generated. After this, there is the process of depersonalizing information and clearing the sample from various distortions such as signals of modems, tablets, signals of subscribers with two or more SIM-cards, random signals from airplanes and others.
Based on the above data, the authors conducted a comprehensive analysis of the population of the Moscow agglomeration and its changes over a given period of time, as well as the labor market analysis. Based on the balance of these data sources, the key statistical indicators for Moscow were calculated: the number of permanent and temporary “daylight” population, the scale of circular migration and the level of informal employment. The key findings for the Moscow agglomeration are the following.
Figure 1.
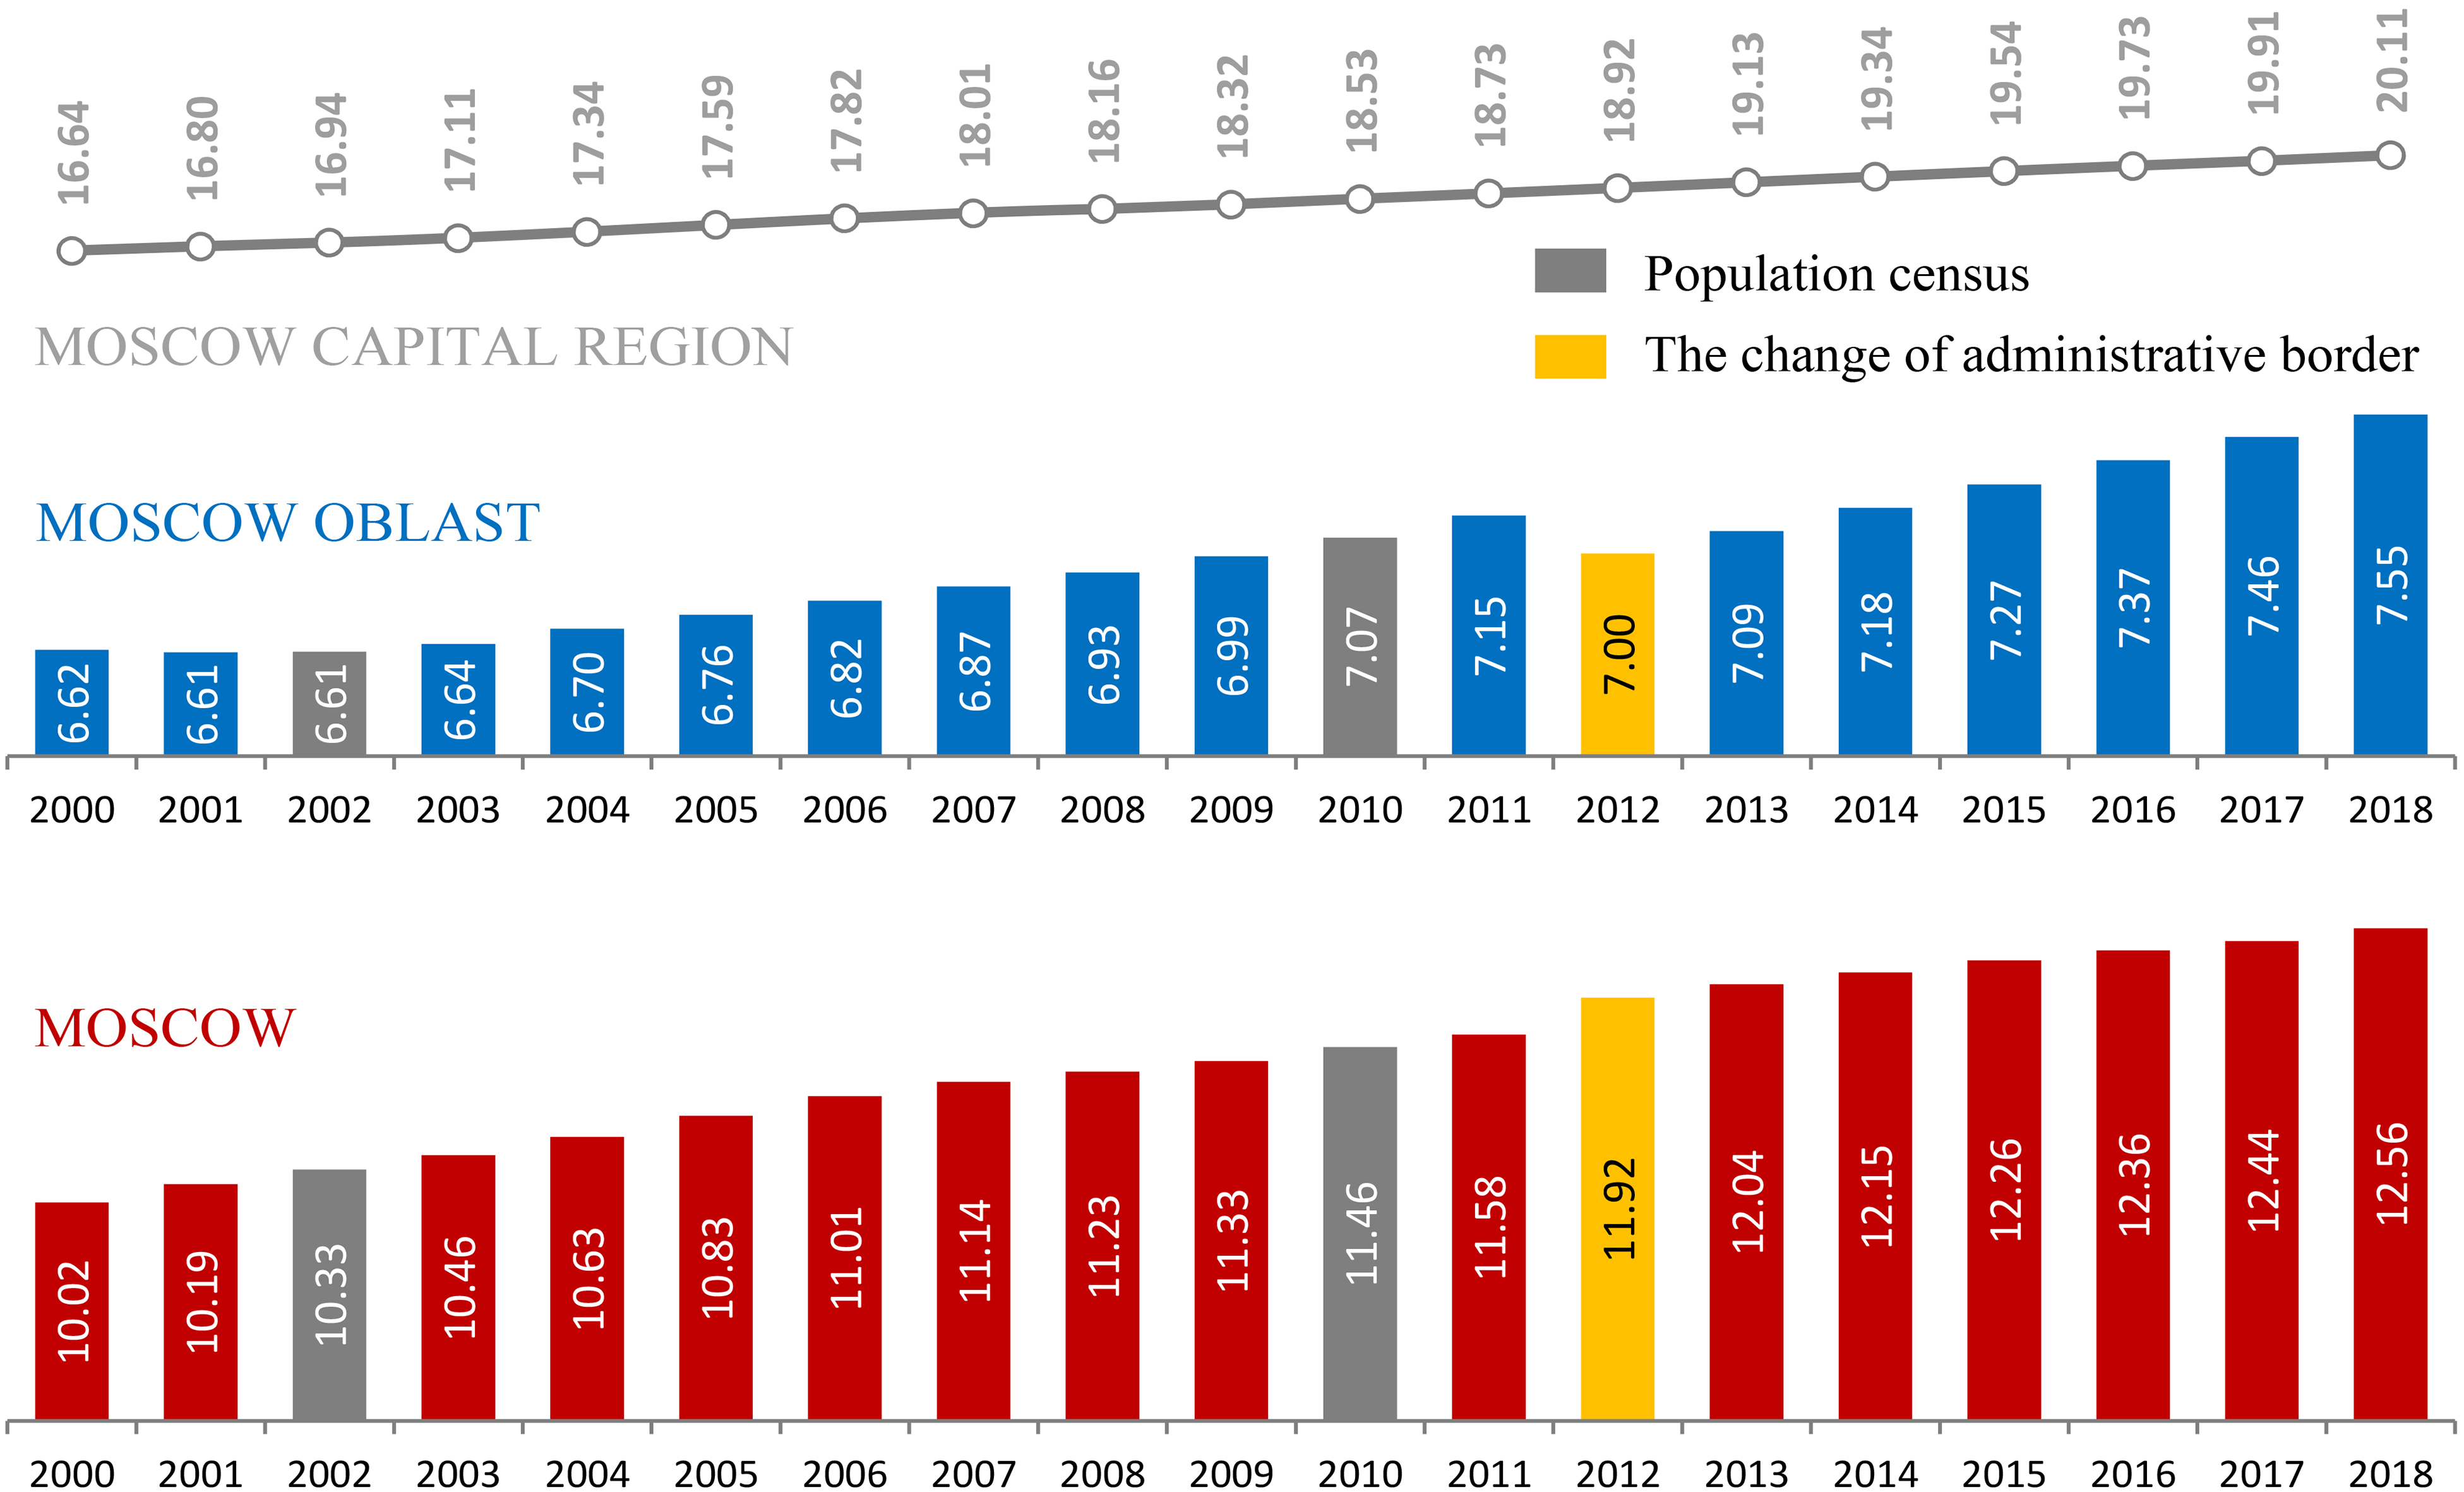
Permanent population of Moscow and Moscow oblast in 2000–2018 (in million people on average per year). Sources: Rosstat.
4.Permanent population of the Moscow agglomeration
The official statistical estimation by the Rosstat notes that permanent population of Moscow city is 12.6 million people, of Moscow oblast – 7.5 million, totally in both regions (also unofficially known as Moscow capital region) – about 20 million in 2018 (Fig. 1). Official statistic shows that both federal subjects experience a population growth of about 1% per year each in the last decade.
However, the official statistics do not fully take into account the features of living within the urban agglomeration and, as a result, does not correctly display the permanent population of Moscow. There is a constant diversion of population between Moscow and Moscow oblast, as well as other surrounding regions. It is difficult to distinguish part of the population between the city and the region because people use social services in both federal subjects. A combination of data sources is necessary to calculate a more accurate statistical border of the permanent population of both federal subjects (in this case, overlays in the population of Moscow with other federal subjects, except Moscow oblast, can be ignored due to their insignificance).
For an alternative assessment, we combined data from EIRC and UMIAS to estimate the number of adults (18
There is a discrepancy between our results and the official statistics data. The main reasons for the discrepancy in the data may be the following causes:
• part of the population, which actually living in the Moscow oblast, retains Moscow registration and partially uses Moscow social services;
• part of those who born in Moscow, whose parents are from other regions, and actually not living in Moscow, were included in the calculation of the permanent population by the Rosstat.
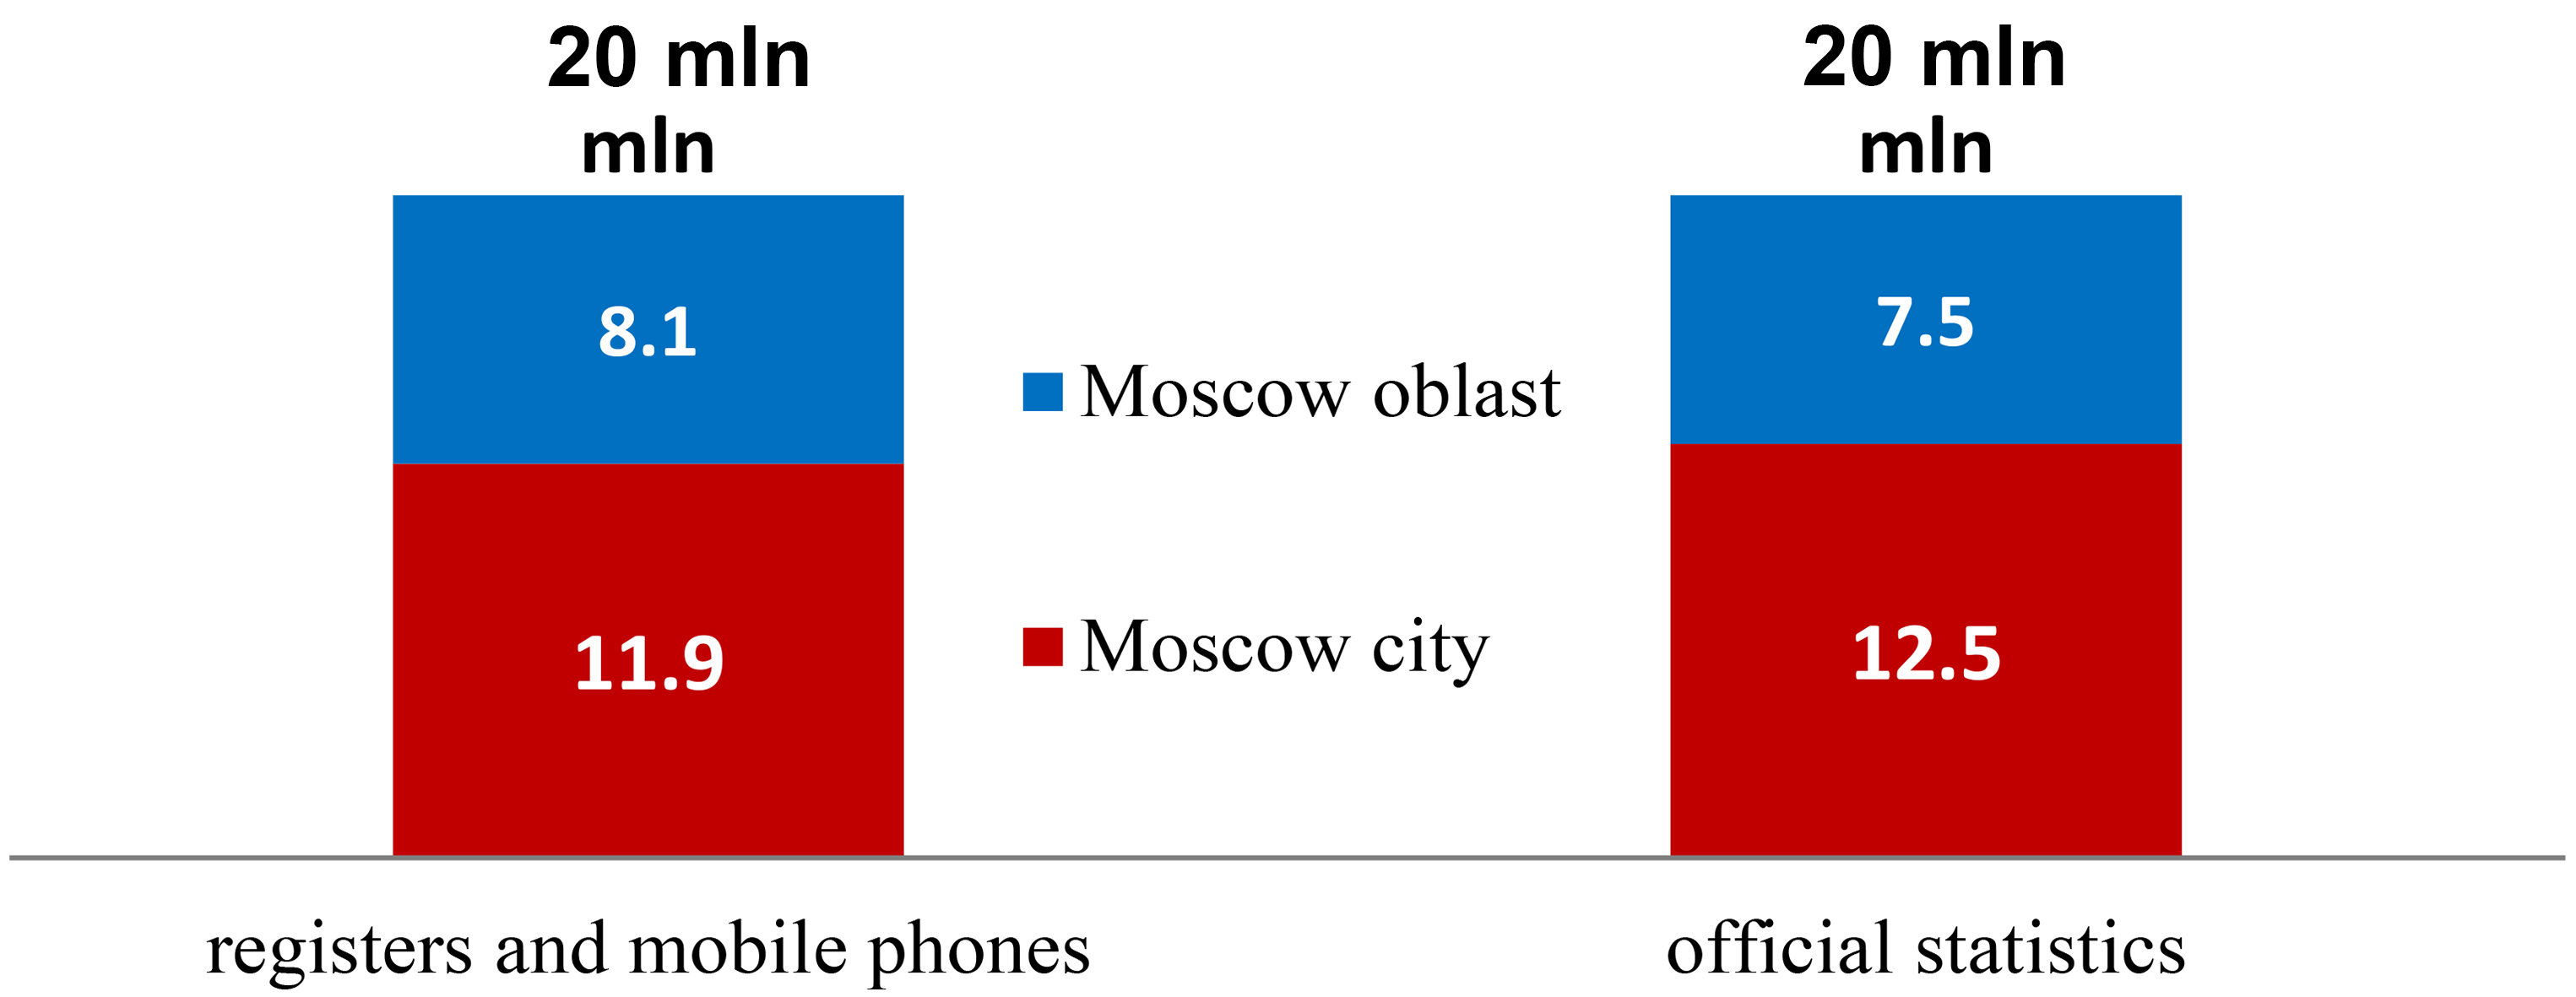
A similar method was used to calculate the permanent population of Moscow oblast, which amounted to 8.1 million people in 2018 (official data is 7.5 million by the Rosstat). As a result of the calculations, the minimum values for the permanent population of Moscow and Moscow oblast in 2018 were obtained, as well as the range of the population that can be attributed to both regions. The 600–1200 thousand people permanently use the different public services in both federal subjects (e.g., registration in Moscow, housing in Moscow oblast, health services in Moscow, school in Moscow oblast, etc.) and even divide the night time between these two (Fig. 2).
The total summary population of Moscow and Moscow oblast is 20 million is the same in all data sources. That means that the main differences in estimates of the number of the permanent population are associated with the accounting or non-accounting of individual population groups between these two federal subjects, depending on the assessment methodology. That difference can be interpreted as the absence of the economic and social border between Moscow and Moscow oblast (especially the municipalities, which are situated closest to Moscow) within the Moscow agglomeration.
Figure 2.
Comparison of the permanent population of Moscow and Moscow oblast based on various data sources in 2018 (in million people). Source: authors’ estimations.
5.Circular migration and delimitation of the Moscow agglomeration borders
The determination of agglomeration boundaries is critical for the state regulation of territorial development and is often associated with an assessment of the flows of circular migrants from neighboring territories. However, delimitation of the boundaries of an agglomeration depends not only on the methods of analysis, but also on the very meaning that is embedded in this term. In the most general sense, agglomeration is a geographically coupled congestion of urban settlements connected by socio-economic ties. The majority of specialists today adhere to this general definition, but its specific interpretation used through the indicators varies greatly. There is a large number of approaches to delimitation the boundaries of an agglomeration. However, the most common methods include following approaches:
1. using the criterion of transport accessibility, including the analysis of the average time in the way to the agglomeration center by various types of transport and the calculation of transport isochrones. The most common values taken for agglomeration boundaries are isochrones of transport accessibility at 1 hour, 1.5 hours or 2 hours, depending on the population size and type of transport [31, 37]. This is the most popular method of delimitation agglomeration boundaries to date;
2. analysis of the size and direction of labor circular migration flows [1, 4, 7, 18]. Like the previous method, it is one of the most popular. However, its use is associated with great statistical limitations and difficulties in use, which predetermined its later use for practical purposes of state regulation of territorial development. Most experts draw the boundaries of an agglomeration in the range of values from 10 to 30% of the population making regular trips to work in the agglomeration core;
3. using the urban density criteria – it means the delimitation the boundaries of continuous urban built-up area or as some scientists call the “urban continuum” [14, 27, 30, 42]. This method has a limitation on its use without integration with other methods. Many urban agglomerations include green spaces (e.g., parks) between separate parts, which makes it very difficult to draw agglomeration boundaries exclusively by urban built-up area. In most cases, this method is used as a complement to other methods to distinguish the core of the agglomeration;
4. sociological research methods, which include conducting surveys among the population for the purpose of determining territorial identity [25, 32, 33]. This method of delimitation agglomeration boundaries is gaining popularity among representatives of the scientific community within the scientific postmodernism. However, the method is used extremely rarely for public administration purposes due to its low accuracy.
It is more common to find a simplified delimitation of the boundaries of the Moscow agglomeration in Russian scientific and specialized literature by combining the borders of Moscow and Moscow oblast. In most cases, this is a forced simplification due to the incompleteness of the statistical information and its not enough fractional representation.
In this study, we will adhere to the OECD methodology for identifying agglomeration boundaries, mainly based on data of circular migration to Moscow from mobile operators. This methodology was developed in 2012 jointly by the OECD and the Department of Regional and Urban Development of the European Commission for the consistent determination of functional urban areas in different countries using population density and travel flows to work as key criteria. According to the OECD methodology, an agglomeration consists of a densely populated city core and an adjacent territory (commuting zone), whose labor market is closely integrated with the city core [12]. The separation of agglomeration according to the OECD methodology goes through three successive stages [9]:
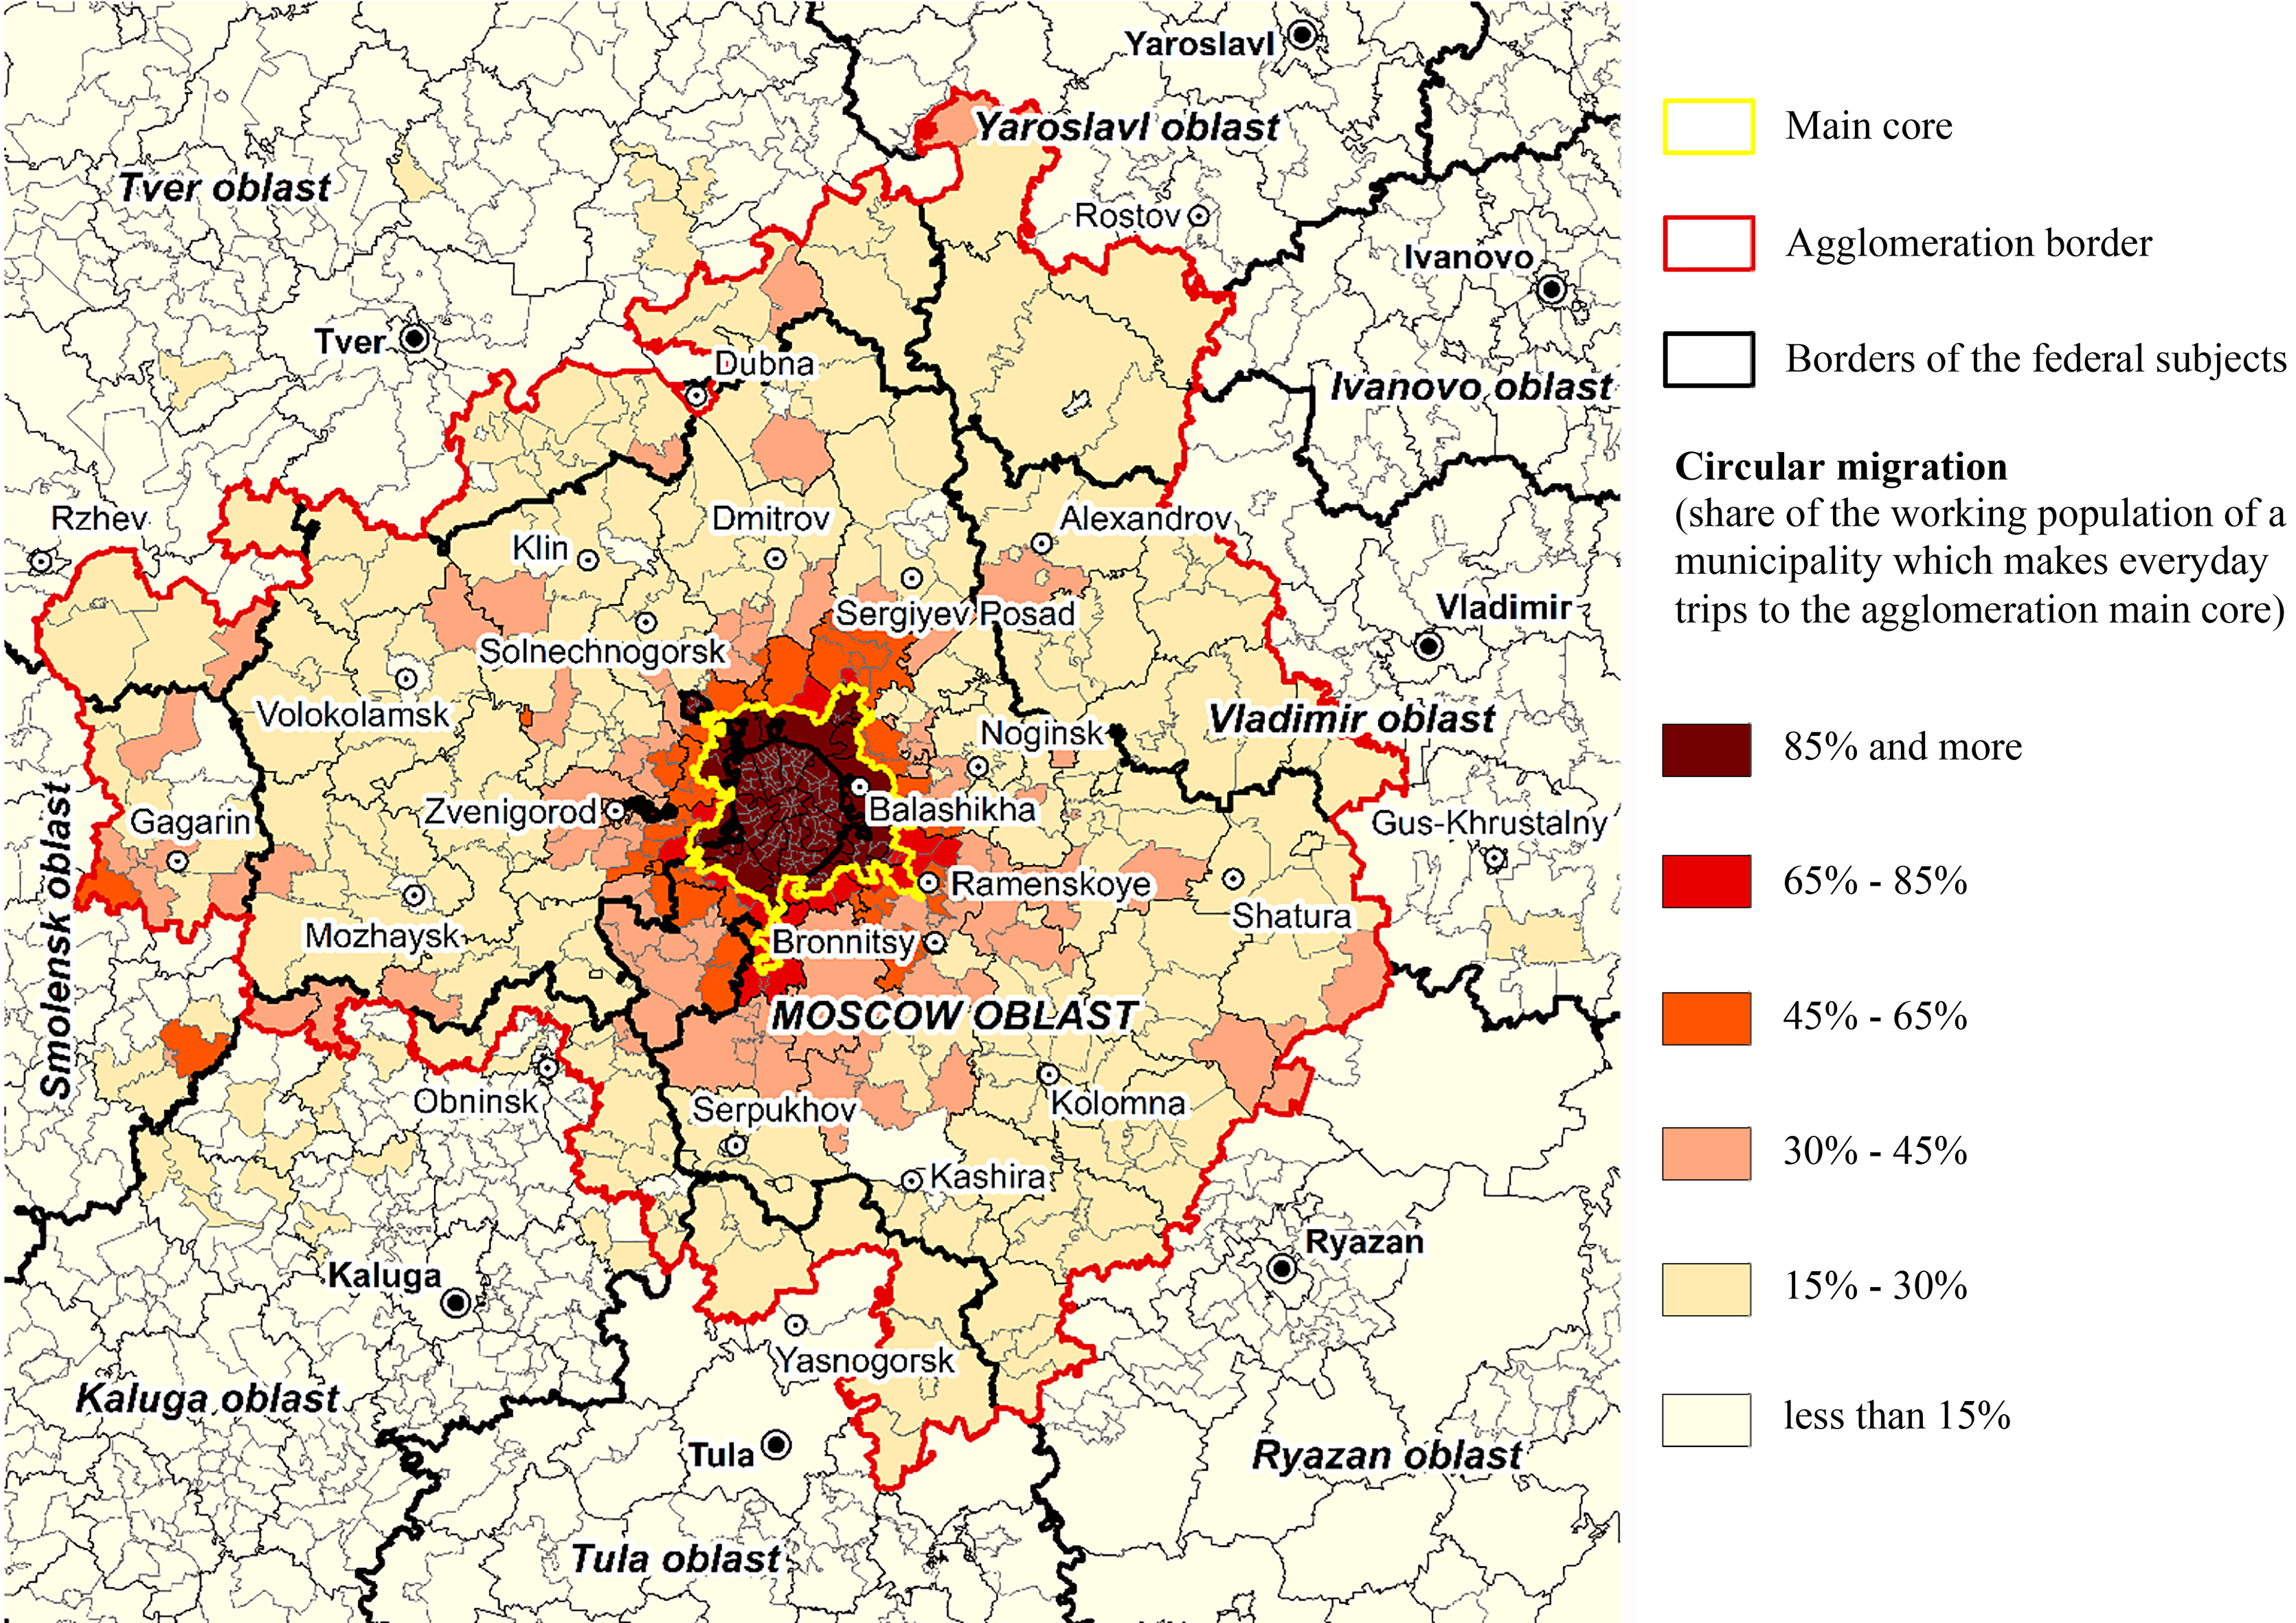
Figure 3.
The Moscow agglomeration border based on circular migrants ratio. Sources: MC Sputnik based on mobile operators’ data, authors’ estimations.
1. agglomeration core (or cores) are distinguished – urban areas with a population of more than 50 thousand people and population density more than 1.5 thousand people per sq. km. In some cases, this value is reduced to 1.0 thousand people per sq. km due to the characteristics of residential areas (e.g., USA, Canada, Australia and other countries with a predominance of low-rise housing);
2. calculation of the “zone of active interaction”, where more than 15% of the employed population make labor circular migrations to the agglomeration core more than 3 times a week. The value of 15% as the main border was chosen based on empirical studies of the largest urban agglomerations of OECD countries;
3. the establishment of the urban active territory boundaries, including the elimination of “outbreaks” and “islands” of active interaction outside the main array of the active zone, as well as the subsequent correlation of the obtained agglomeration zone with the smallest cells of the administrative-territorial division.
The scope and directions of circular migration within the Moscow agglomeration were determined based on the mobile operators’ data and the determination of the main day (work and study place) and night (home place) stay places. Place of living is determined as the place where a person (mobile phone owner) spend more than 20 hours per week from 11 p.m. till 6 a.m. Respectively, place of work is the place where a person (mobile phone owner) spend more than 20 hours per week from 10 a.m. till 5 p.m. Based on the data obtained, the proportion of the municipality population that makes regular trips to the Moscow center – the core of agglomeration – was determined. After that, a continuous border of municipalities was delimitated with 15% or more of the population participating in the circular migration to the Moscow center. As a result, the border of the Moscow agglomeration was obtained (Fig. 3).
The use of this method of determining the person state during the day has some disadvantages. The main restrictions affect the part of the population that works either during the night, or works at an unsteady workplace (e.g. taxi drivers or couriers, etc.), or works from home. They may have unusual movement patterns, which would not allow to accurately determine the location of their work. Nonetheless, the total share of these categories of people in the structure of the employed population in Moscow does not exceed 5% according to the Rosstat Labor Force Survey in 2018. It means that such an assumption does not have a significant effect on the final results and can be further adjusted using other data sources.
Estimates show that the labor circular migration to Moscow is about 2 million people daily, of which 1.1 million are from the Moscow oblast. The obtained boundaries of the Moscow agglomeration include the territory not only of almost the entire Moscow oblast (with the exception of the urban district of Dubna in the north of the region), but also of municipalities from 6 other neighboring entities – Kaluga, Smolensk, Tula, Tver, Vladimir, and Yaroslavl oblasts (federal subjects). However, the largest share of circular migrants is concentrated in the near belt of municipalities around Moscow with individual “tails” along the main transport tracks. The boundary of the conditional fracture of the flow of circular migrants runs approximately 50 km from the Moscow Automobile Ring Road, thereby highlighting the zone of “effective” circular migration. Also, inside the agglomeration, second-order cores with a low proportion of labor circular migrants to the main core are quite clearly distinguished. These are the large cities in Moscow oblast (such as Kashira, Klin, Kolomna, Mozhaysk, Serpukhov, Volokolamsk and others) with a relatively developed labor market of their own, as well as located at a considerable distance from the center of Moscow, which makes them more attractive for workers [42].
The use of mobile operators’ data from has some limitations regarding to the analysis of circular migration. The mobile operators’ data do not take into account people who do not use mobile services. However, In the vast majority of cases, they are people of two polar age categories: the youngest (mostly preschool children) and the oldest who significantly older than working age. These two categories of the population have no significant impact on the scale of circular labor migration. Because these groups of people are not involved in main economic activity in most cases.
The presence of reverse labor circular migration – from Moscow to Moscow oblast – should also be mentioned. It is about 0.2 million and includes people mainly living on the outskirts of Moscow and working in the near zone of municipalities of Moscow oblast. As a result, the balance of labor circular migration to Moscow is 1.8 million people daily.
The border of the Moscow agglomeration, obtained based on data of circular migration, in its general form correlates to the conception of its delimitation prevailing in the scientific community. The highlighted borders correspond to the “classical” concepts of the boundaries location of the Moscow agglomeration – the presence of elongated “tails” along the main transport routes towards neighboring regions [14, 30]. However, the boundaries of the Moscow agglomeration delimited in this study differ in their further distribution from the main core of the agglomeration, which reflects current trends in the all-around growth of Moscow and its socio-economic development.
The most significant distinguishing feature of the agglomeration boundaries identified by the authors was the almost complete inclusion of the territory of Moscow oblast. When using the method of border delimitation based on transport accessibility, many of the most remote municipalities in Moscow oblast are not included in the Moscow agglomeration, because they are outside the 1.5-hour and even 2-hour transport isochrones [32]. However, using the border delimitation method taking into account the actual circular migration allows us to talk about real economic ties between the periphery and the core of the agglomeration, and not about hypothetical as previous methods use [34]. As a result of this, verification of identified borders with existing economic realities in society is increasing.
A distinctive feature of the Moscow agglomeration is the relatively large main core due to the OECD methodology delimitation, significantly exceeding the cores of other major global cities. The core of the Moscow agglomeration includes not only the immediate center of the city, as in most other agglomerations, but a significant part of the suburban residential zone with population density more than 1.5 thousand people per sq. km. This is due to the predominance of multi-story residential buildings in the near suburbs of Moscow, which increases the average population density and formally makes them similar to the city center by the OECD methodology [27, 48].
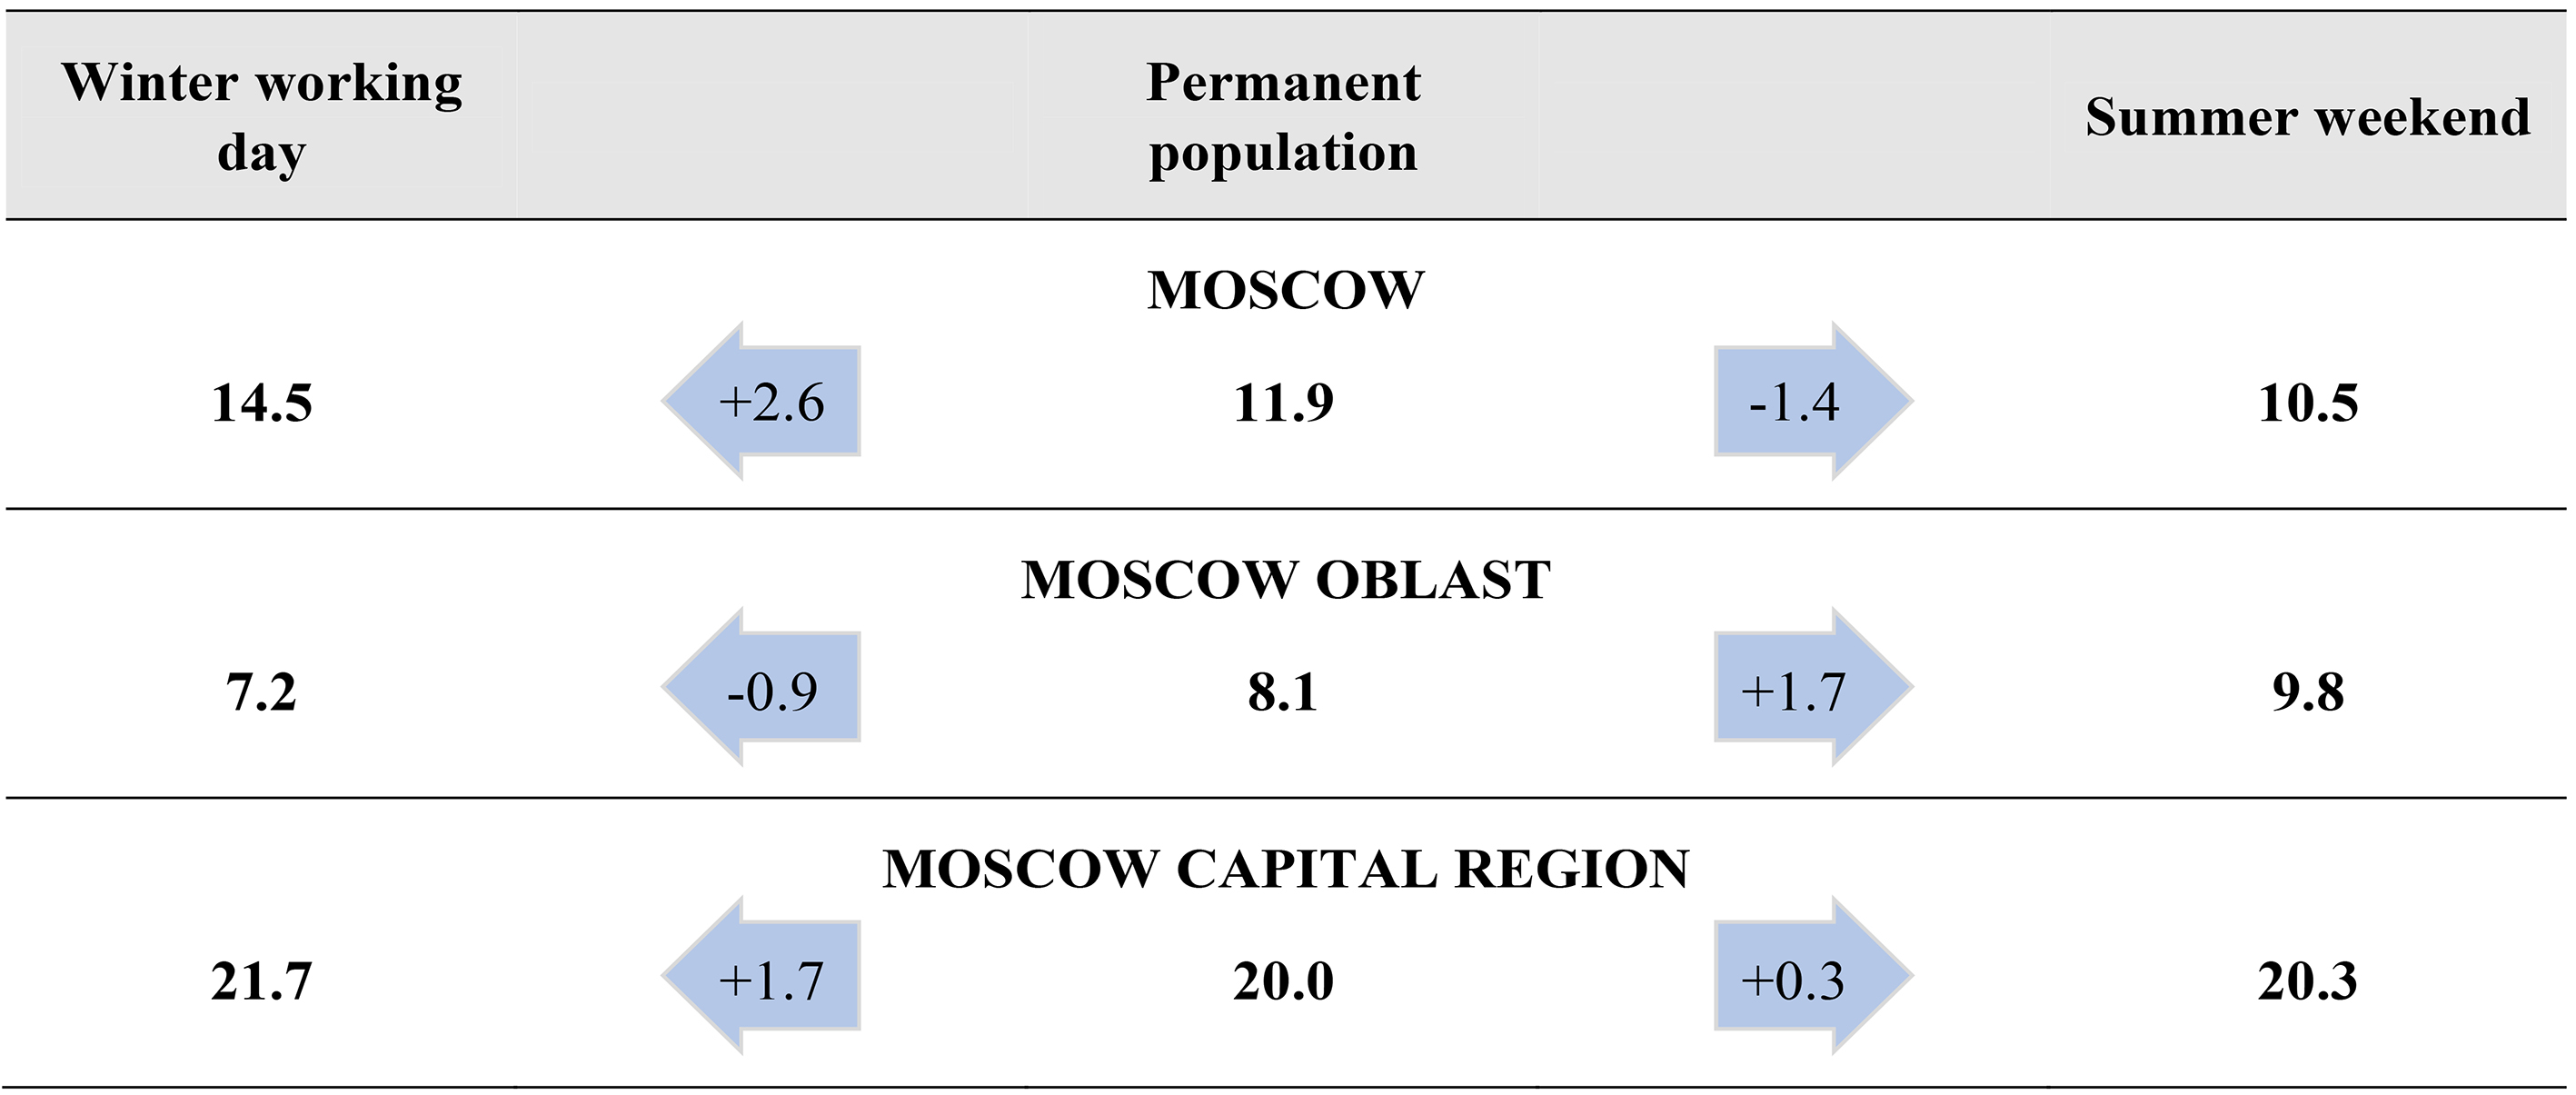
Figure 4.
Fluctuations of the daylight population of Moscow and Moscow oblast in 2018 (in million people). Source: authors’ estimations.
The use of mobile operators’ data of the people’s movements showed the presence of significant fluctuations in the number of circular migrants and the population within Moscow as a whole during the week and throughout the year. A similar population pulsation is observed not only between Moscow and Moscow oblast, but also between neighboring regions. Not just the total population of a given territory is subject to change, but the dominant direction of people’s movement is too. During working days, the overwhelming majority of people move towards the center of Moscow, where the main jobs and leisure are concentrated, and in the evening, return migration to homes occurs. During the weekend, labor circular migration to Moscow is greatly drooped off (although it does not completely disappear). Also, on the contrary, significantly increased the people’s movement from the main part of Moscow to the suburban area for the purpose of recreation. These fluctuations in the daily population of Moscow are further enhanced by seasonal changes throughout the year. During the summer, the flow of residents of Moscow who go on vacation to Moscow oblast, to other regions of Russia or abroad increases significantly. At the same time, labor circular migration to Moscow is reduced during the summer vacation season. As a result, two extremum points are formed during the year in the daylight population of Moscow and the Moscow agglomeration.
The high peak of the daylight population of Moscow is on a weekday in winter and amounts to 14.5 million people (Fig. 4). At the same time, the population of Moscow oblast is 7.2 million, and the total population of the Moscow capital region – 21.7 million. It includes not only the circular migrants but also tourists, recreational visitors, students, etc., which were calculated based on mobile operators’ data of the people’s movements from other territories, as well as the balance with other data sources mentioned before.
The minimum daylight population of Moscow is in summer weekend – about 10.5 million. However, in the same period, the population of Moscow oblast increased to 9.8 million due to the Muscovites traveling on vacation, and thereby almost reached the parity in the population of the two federal subjects. The total population of the two regions is also slightly reduced to 20.3 million people due to the population leaving for vacation in other regions of Russia and other countries, as well as a reduction in labor migration during the summer season.
The estimations of the population pulsation during the week and during the year are critically important for the purposes of public administration, especially in the field of development of the Moscow agglomeration transport complex. Data of the daylight population of Moscow and Moscow oblast at the different time periods should be taken into account when predicting the load on various infrastructure objects (transport, social, recreational, etc.). Peaks in population indicate precisely the maximum possible load on these objects, which should be taken into consideration when regulating territorial development. Further, estimation of the permanent population, as well as circular migration, can be supplemented by using data from various transport departments and companies about the scale of people’s movement.
6.Estimations of the formal and informal employment
Assessments of the employment structure of Moscow with the allocation of informal employment imply the use of all previous calculations for the analysis of the permanent population and labor circular migration. The estimations of the formal and informal employment in Moscow were received by the balancing the data of the estimated workforce and data from the FTA, PFR, KIS GUSOEV and mobile operators, as well as official statistics by the Rosstat.
Figure 5.
Scheme of the informal employment assessment in Moscow (in million people). Source: authors’ estimations.
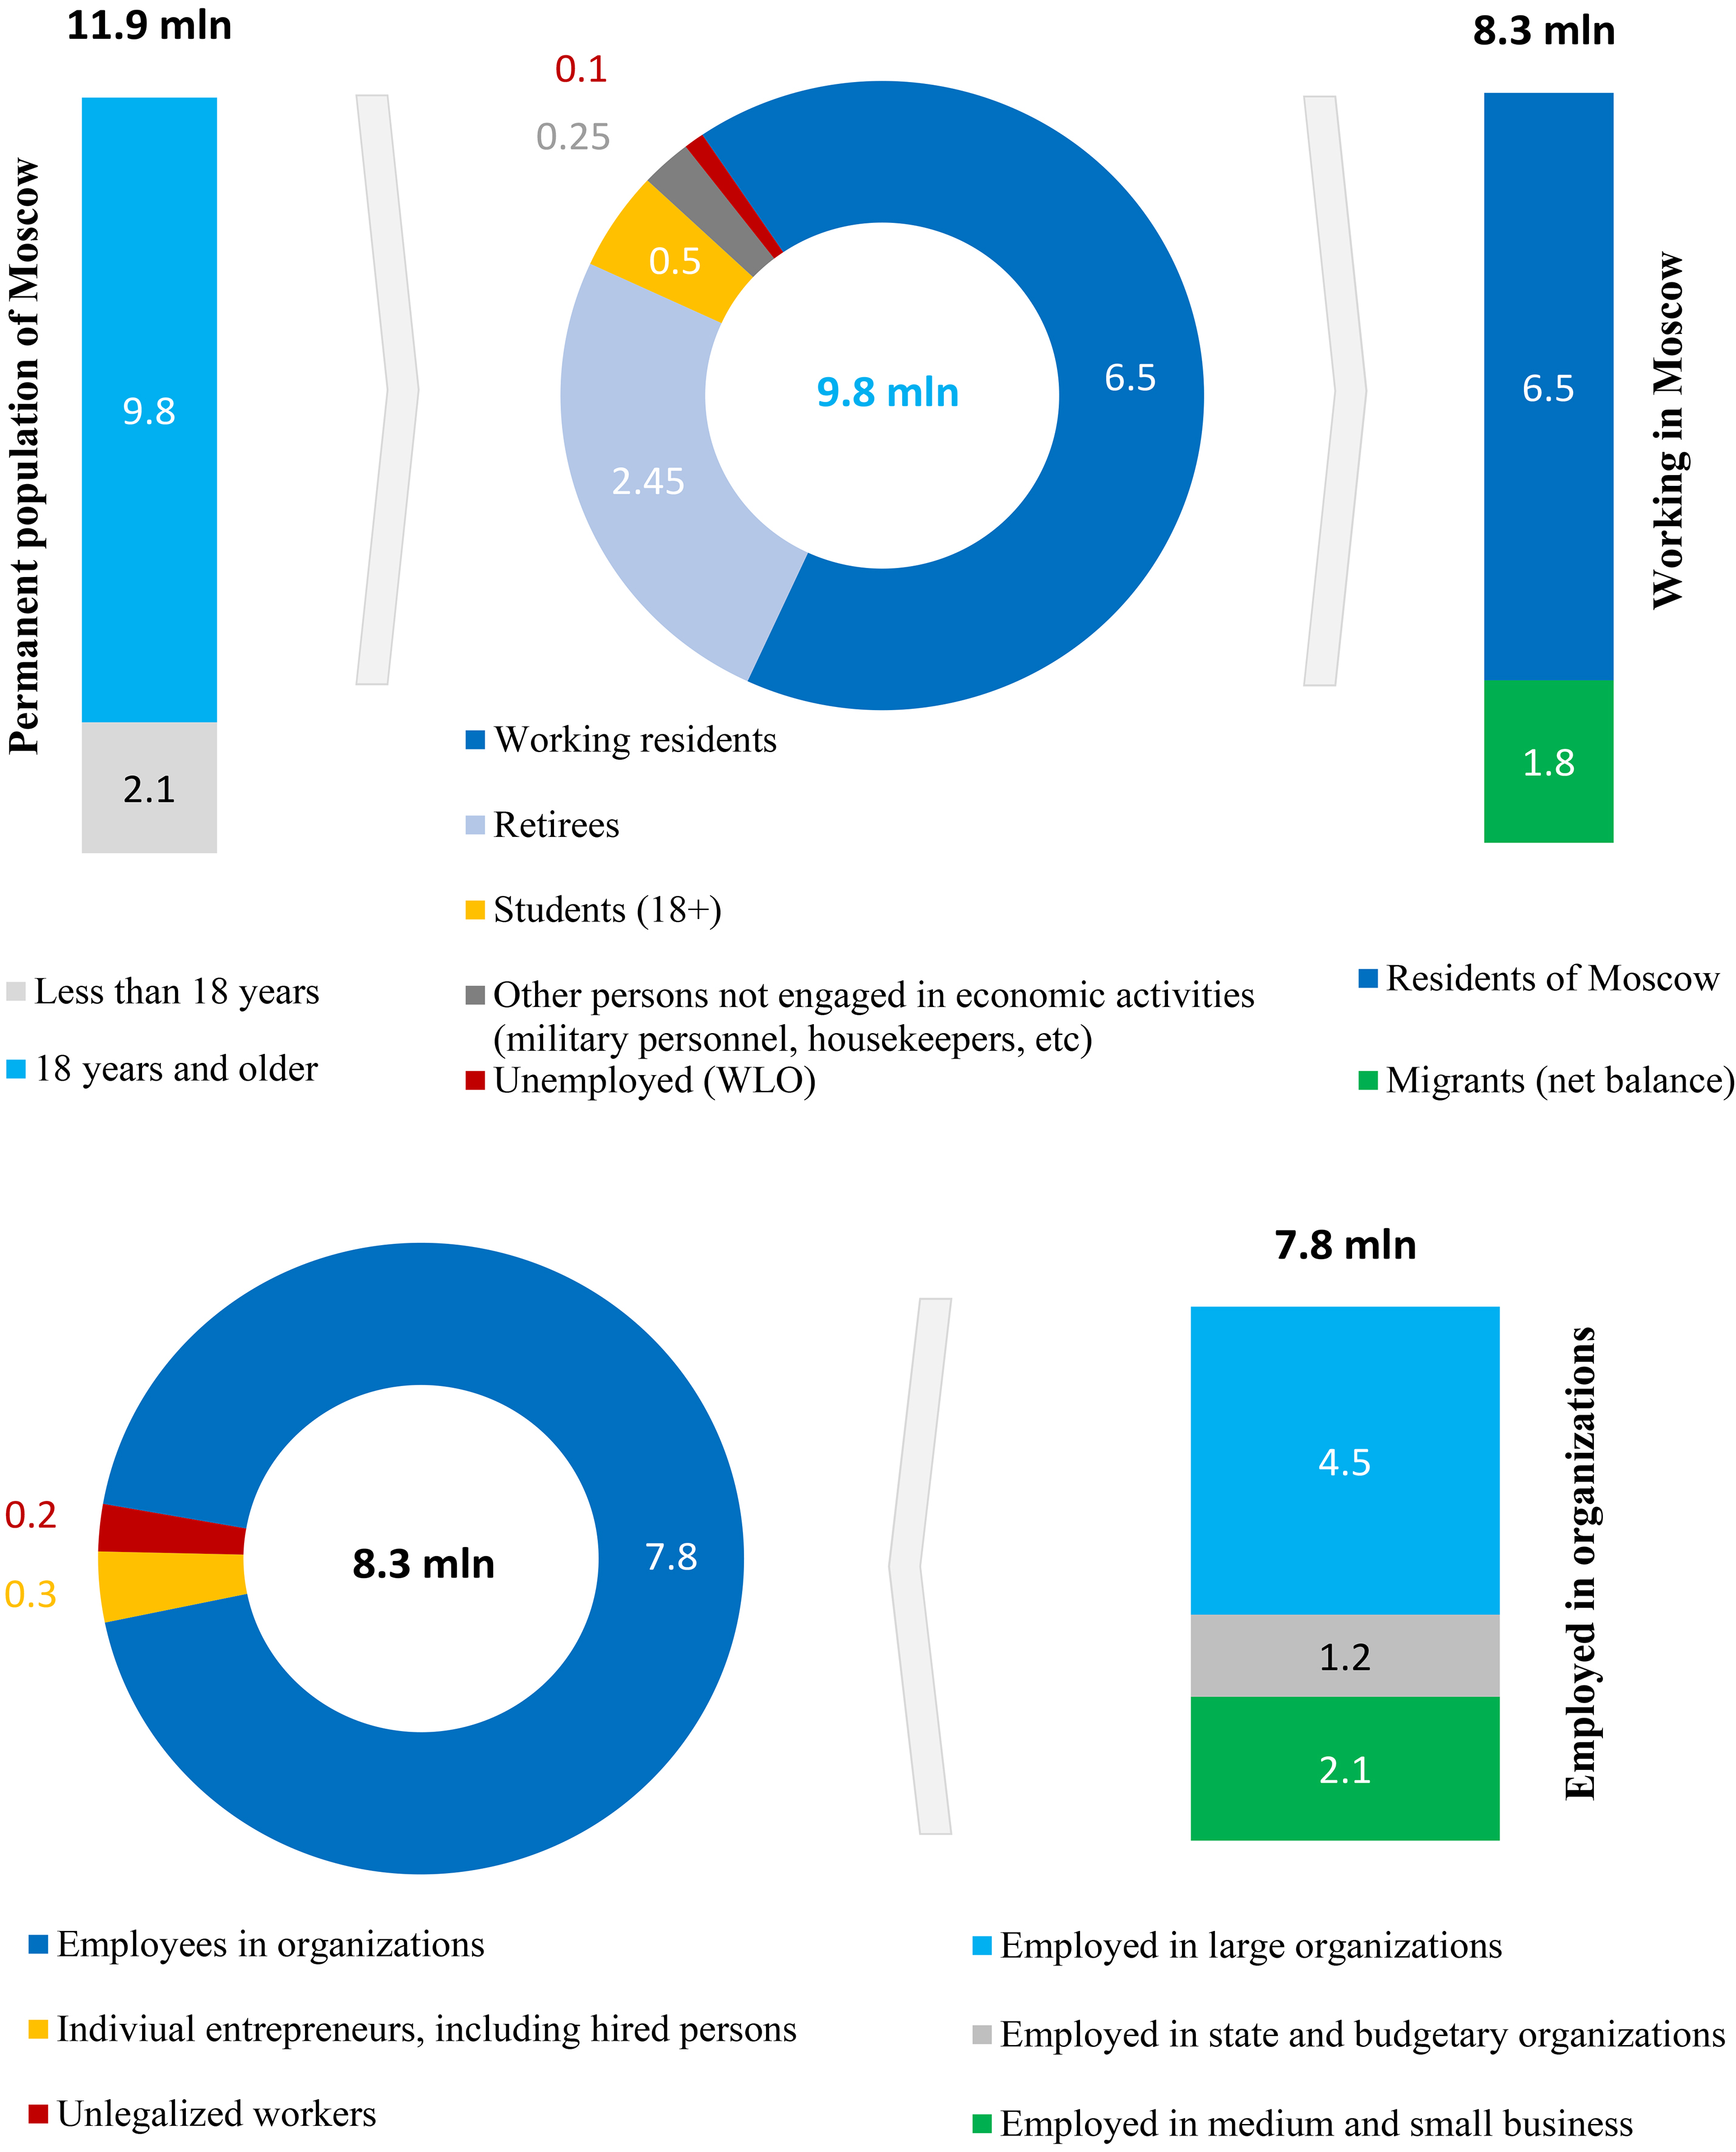
The estimation of informal employment level in the Moscow economy based on the balance method of various data sources (all indicators are the year average) was carried out according to the following scheme (Fig. 5):
1. Persons under 18 years old who are not actively involved in labor activities were excluded from the total permanent population of Moscow at 11.9 million. The total permanent population of 18
2. Based on data from the PFR, KIS GUSOEV, and the Rosstat the current working population, as well as various population groups excluded from work activity for various reasons (unemployed retirees, unemployed university students, military personnel, other unemployed persons, etc.), were allocated from the adult permanent population of Moscow. The total number of the working Moscow residents is 6.2 million;
3. The total number of the population working in Moscow was calculated by adding up the employed resident population of Moscow and the net balance of labor circular migration. The total number of working persons in Moscow is 8.3 million;
4. Employees in organizations (7.8 million people) and individual entrepreneurs (including 0.3 million hired persons) according to the PFR and Federal Tax Service (FTS) were excluded from the total number of working persons in Moscow;
5. As a result, the number of informally employed people in Moscow was obtained – 0.2 million.
The final result of the assessment of informal employment is influenced by the particularities of assessing the permanent population of Moscow and labor circular migration, the methodology which was described earlier in the article. The greatest dependence from a theoretical point of view may be associated with the estimation of the permanent population since this is the largest base numeric component. However, this figure is largely verified using administrative data (FTA, PFR, KIS GUSOEV). There are some risks of underestimating the number of labor circular migrants based on mobile operators’ data. This can happen both due to methodological assumptions in terms of recognition or, on the contrary, non-recognition of a subscriber as a working in Moscow person, and due to the use of data from only three mobile operators (even the largest in the country). However, the influence of individual assumptions mentioned above is extremely low and does not have a significant effect on the final result.
The pure informal employment around 200 thousand people is rather low in Moscow – it is just 2.5% of total employment. It is lower than the official statistics data even for the permanent Moscow residents (3.6% of total employment), because the Rosstat publishes the informal employment estimation only for the residents and not for the all employed on the territory of the city. One of the reasons is the methodology of informal employment calculation by the official statistics. In accordance to the Rosstat’s methodology, the individual entrepreneurs and the registered self-employed (in terms of tax legislation of Russia) are included in the informal sector.
That is the point of discussion about the implementation of ILO recommendation on concerning statistics of employment in the informal sector. Informal employment is defined by the ILO according to the resolution concerning statistics of employment in the informal sector adopted by the 15
From the city governance point of view, the individual entrepreneurs and the registered self-employed are a part of the formal sector: they are legal taxpayers, there is no economic difference between them and the micro-enterprises (legal entities), as for instance.
The main problem is the partly informal employment or the “gray zone” – the only minimal wage is officially paid for 18% of employed according to the FTS data [24]. The relatively low level of informal employment in the economy of Moscow in comparison with the level of “gray” employment makes the latter a more significant point of attention for pursuing a policy of Moscow authorities in terms of sustainable socio-economic development of the city.
Subsequently, the methodology for assessing informal employment through the balance of various data sources can be improved by more accurately taking into account international labor migration to Moscow in low-skilled sectors, e.g., by including data from the Federal Migration Service in the balance sheet. Moreover, features of subscribers’ movement during the day can serve as an additional characteristic for the level of informal employment assessment.
7.Conclusions
The analysis in this research showed that the combination of various data sources provides a more detailed and complicated picture of the population and labor market than each of the sources separately. Certainly, each data source has its own limits on use and disadvantage, as well as conveniences. The new alternative data sources like mobile operator’s data cannot replace the “classical” statistical or administrative data. For the time being at least, the direct usage of mobile operator’s data is limited for estimation of some population groups, e.g., small children and the elderly (80
There is a general methodological problem of using mobile operators’ data. Currently, there are no generally accepted definitions of what we consider as a place of work, a place of residence, or what scale territorial cells do we use for analysis, etc. As a result, all the studies existing to this day are not comparable among different cities and regions of the world.
Nevertheless, the combination of various data sources creates the new opportunities for the decision-making at the different levels of administration. All findings of this work are not the only analytical exercise but the base of the practical implications of the city management. The assessments made it possible to use the results obtained in terms of a comprehensive state policy of territorial development including areas such as the development of the transport complex of Moscow agglomeration, development of secondary centers of agglomeration, job creation in new districts with low density of workplaces, housing construction, economic forecasting, etc. Such opportunities are available not only to the Moscow city authorities, but also to federal authorities, authorities of Moscow oblast and other regions of Russia, as well as municipal authorities.
The existing lack of clear boundaries in the territorial positioning of the population within the Moscow agglomeration enormously complicates the process of statistical accounting. The research showed the absence of real economic and social borders between Moscow and Moscow oblast. About 600–1200 thousand people use on a permanent basis different public services in both federal subjects. The health and educational, as well as transport, planning is aware of the existing “soft border” between Moscow and Moscow oblast.
Despite the estimates of the permanent population of Moscow being lower than official statistics data, the study showed a greater seasonal fluctuation in the actual daylight population located in the city. During the period of maximum peak load in Moscow, there are at least 2 million people more than according to the Rosstat. This value indicates the need to take into account the greater load on the existing infrastructure of the city than only taking into account the permanent population of Moscow.
This paper presents one of the first and most complete estimates of the extent of circular migration within the Moscow agglomeration based on non-survey methods. The reverse labor circular migration from Moscow to Moscow oblast was also assessed, which has rarely been presented in the scientific literature. The scale of the circular migration in the Moscow agglomeration is one of the key factors that must be taken into account when conducting the urban policy of territorial development. The long-term priorities of the housing construction policy in Moscow should aim at stabilizing circular migration. It means that the housing construction in the medium zone of Moscow (including renovation of the former industrial areas) should be continued.
The correction of the labor force balance and better understanding of the scale of formal and informal employment. The estimations showed that the real scale of informal employment in Moscow is not as high as indicated in the official statistics due to the inclusion of individual entrepreneurs with hired persons in the real employment structure. It means that the main focus in the labor and economic policy in Moscow is not the legalization of the pure informal employment but the partly informal “gray zone”.
In further, the all methods of combining of various data sources can be supplemented and improved by including additional sources of information. Improving the use of mobile operators’ data may also go on by including a larger area for analysis, as well as reducing the size of the statistical cell for microgeographic studies.
References
[1] | Arkheologiya periferii [Archeology of Periphery] ((2013) ). Moscow: Strelka Institution. (in Russian). |
[2] | Bangasser, P.E. ((2000) ). The ILO and the informal sector: an institutional history. P.E. Bangasser, ILO Geneva. |
[3] | Bessonov, V.A. ((2012) ). Vzglyad na rossiyskuyu statistiku so storony polzovatelya [Russian Statistics from the User’s Point of View]. Statistics Issues. 5: , 50-61. (in Russian). |
[4] | Bycroft, C. ((2015) ). Census transformation in New Zealand: Using administrative data without a population register. Statistical Journal of the IAOS: Journal of the International Association for Official Statistics. 31: (3), 401-411. |
[5] | Calabrese, F., Di Lorenzo, G., Liu, L., Ratti, C. (April (2011) ). Estimating origin-destination flows using mobile phone location data. IEEE Pervasive Computing 10. 4: , 36-44. |
[6] | Carlstein, T., Parker, D., Thrift, N.J. ((1978) ). Timing space and spacing time. London, Edward Arnold. |
[7] | Colak, S., Alexander, L.P., Alvim, B.G., Mehndiratta, S.R., González, M.C. ((2014) ). Analyzing cell phone location data for urban travel current methods, limitations, and opportunities. Transportation Research Record: Journal of the Transportation Research Board. 2526: , 126-135. |
[8] | Csaji, B.Cs., Browet, A., Traag, V.A., Delvenne, J.-Ch., Huenc, E., Van Dooren, P., Smoreda, Z., Blondel, V.D. ((2013) ). Exploring the mobility of mobile phone users. Physica A: Statistical Mechanics and Its Applications. 392: (6), 1459-1473. |
[9] | Dijkstra, L., Poelman, H., Veneri, P. ((2019) ). The EU-OECD definition of a functional urban area. OECD. |
[10] | Dimulyo, S., Lestari, T.K. ((2019) ). Combining mobile phone data and survey data for the best result: experience from Indonesia. In 62nd ISI World Statistics Congress. Available at: https://drive.google.com/file/d/1sAM_3u3sKxU4gEImqvUML3lCHVn2aVxf/view (accessed: 13 December, 2019). |
[11] | Frias-Martinez, V., Soguero, C., Frias-Martinez, E. ((2012) ). Estimation of urban commuting patterns using cellphone network data. In The International Workshop on Urban Computing (UrbComp 2012). Beijing, China, pp. 9-17. |
[12] | Functional urban areas by country ((2019) ). OECD. Available at: http://www.oecd.org/cfe/regional-policy/functionalurbanareasbycountry.htm (accessed: 28 November, 2019). |
[13] | Gimpelson, V.E., Zudina, A. ((2011) ). “Neformaly” v rossiiskoi ekonomike: Skol’ko ikh i kto oni? [“Informals” in the Russian economy: How many and who are they? Economics Issues. 10: , 53-76. (in Russian). |
[14] | Golts, G.A., Lappo, G.M., Treivish, A.I. ((1987) ). Moskovskii stolichnyi region: Zakonomernosti i perspektivy razvitiya territorialnoi struktury [Moscow capital region: Patterns and prospects for the development of the territorial structure]. Proceedings of the Russian Academy of Sciences. Geographical Series. 5: , 55-70. (in Russian). |
[15] | Groves, R., Harris-Kojetin, B. ((2017) ). Innovations in federal statistics: Combining data sources while protecting privacy. Washington DC, The National Academic Press. |
[16] | Hägerstrand, T. ((1970) ). What about people in regional science? Papers of the Regional Science Association. 24: (1), 6-21. |
[17] | Hand, D. ((2018) ). Statistical challenges of administrative and transaction data. Journal of the Royal Statistical Society: Series A. Available at: https://rss.onlinelibrary.wiley.com/doi/pdf/10.1111/rssa.12315 (accessed: 08 August, 2019). |
[18] | Herrera, J.C., Work, D.B., Herring, R., Ban, X.J., Bayen, A.M. ((2014) ). Evaluation of traffic data obtained via GPS-enabled mobile phones: the mobile century field experiment. Available at: http://escholarship.org/uc/item/0sd42014 (accessed: 26 November, 2019). |
[19] | Horn, S., Czaplewski, R. ((2013) ). Combining survey and administrative data using state space models. NTTS. 174-183. |
[20] | Hussmanns, R. ((2004) ). Defining and measuring informal employment. Geneva: International Labour Office. |
[21] | ILO Guidelines concerning a statistical definition of informal employment. ILO. Available at: https://www.ilo.org/public/english/bureau/stat/download/guidelines/defempl.pdf (acce- ssed: 10 December, 2019). |
[22] | ILO Measurement of the informal economy: Addressing statistical challenges Geneva ((2013) ). ILO. |
[23] | ILO Relevant SDG Targets related to Informal Economy ((2019) ). Available at: http://www.ilo.org/global/topics/dw4sd/themes/informal-economy/lang–en/index.htm (accessed: 28 November, 2019). |
[24] | Kim, Y.S., Matytsin, M., Freije-Rodriguez, S. ((2019) ). The World Bank. Informal employment and worker’s well-being in the Russian Federation. |
[25] | Kirillov, P.L., Makhrova, A.G., Nefedova, T.G. ((2019) ). Current trends in Moscow settlement pattern development: A multiscale approach. Geography, Environment, Sustainability. 4: , 6-23. |
[26] | Kroon, J. ((2019) ). Mobile phone and credit card data: experience from 10 years of public private partnership. In 62nd ISI World Statistics Congress. Available at: https://drive.google.com/file/d/1vT08EOBo2E4FTjN_QnH15LwqY0jAMQwM/view (accessed: 13 December, 2019). |
[27] | Kuricheva, E.K., Popov, A.A. ((2016) ). Dynamics of housing construction in 2010s as a factor of transformation. |
[28] | Kuznetsova, O.V. ((2017) ). Structural changes in employment and the quality of life of the populations of Russian million-plus cities. Studies on Russian Economic Development. 28: (6), 663-671. |
[29] | Laikam, K.E., Zarova, E.V. ((2018) ). Novatsii v statistike trudovykh otnoshenii (po materialam 20-i Mezhdunarodnoi konferentsii statistikov truda) [Innovations in labor relations statistics (based on the materials of the 20th International conference of labor statisticians)]. Statistics Issues. 11: (25), 37-45. (in Russian). |
[30] | Lappo, G.M. ((1978) ). Razvitie gorodskikh aglomeratsii v SSSR [The development of urban agglomerations in the USSR]. Moscow: Nauka. (in Russian). |
[31] | Makhrova, A.G., Kirillov, P.L. ((2018) ). Trends in the development of the new Moscow sector of the metropolitan agglomeration. Regional Research of Russia. 8: (3), 238-247. |
[32] | Makhrova, A.G., Nefedova, T.G., Pallot, J. ((2016) ). The specifics and spatial structure of circular migration in Russia. Eurasian Geogr. Econ. 57: (6), 802-818. |
[33] | Nefedova, T.G., Treivish, A.I. ((2019) ). Urbanization and seasonal deurbanization in modern Russia. Regional Research of Russia. 9: (1), 1-11. |
[34] | Newland, K. ((2009) ). Circular migration and human development. Human development research paper 2009/42/UNDP. |
[35] | Nordbotten, S. ((2010) ). The Use of administrative data in official statistics – past, present and future: with special reference to the Nordic countries. In Carlson, M., Nyquist, H., Villani, M. (eds). Official Statistics: Methodology and applications in honour of Daniel Thorburn. Stockholm: Statistics Sweden, pp. 205-223. of Moscow agglomeration. Reg. Res. Russ. 6(1), 9-20. |
[36] | Nurmi, O., Piela, P. ((2019) ). The use of mobile phone data in tourism statistics. In 62nd ISI World Statistics Congress. Available at: https://drive.google.com/file/d/1QxB8paPFbo3k2v-XuVezIgRYZMz9IyfW/view (accessed: 13 December, 2019). |
[37] | Phithakkitnukoon, S., Smoreda, Z., Olivier, P. ((2012) ). Socio-geography of human mobility: a study using longitudinal mobile phone data. Available at: http://journals.plos.org/plosone/article?id=10.1371/journal.pone.0039253 (accessed: 08 August, 2019). |
[38] | Pred, A. ((1977) ). The choreography of existence: Comments on Hägerstrand’s time-geography and its usefulness. Economic Geography. 53: (2), 207-221. |
[39] | Price, C. ((1963) ). Southern Europeans in Australia. Melbourne: Oxford University Press. |
[40] | Ruggles, P. ((2015) ). Review of administrative data sources. Available at: https://www.census.gov/content/dam/Census/library/working-papers/2015/acs/2015uggles01.pdf (accessed: 08 August, 2019). |
[41] | Savoskul, M.S. ((2015) ). Migration study in social geography in Russia: Interdisciplinary approach. Regional Research, no. Special Is., 24-34. |
[42] | Treivish, A.I. ((2016) ). Capital cities and state borders: Spatial relationships and shifts. Regional Research of Russia. 6: (3), 244-257. |
[43] | Trepanier, J., Pignal, J., Royce, D. ((2013) ). Administrative data initiatives at statistics Canada. Available at: http://www.copafs.org/UserFiles/file/fcsm/G1Trepanier2013FCSM.pdf (acce- ssed: 08 August, 2019). |
[44] | UNECE. ((2007) ). Register-based statistics in the Nordic countries. Review of best practices with focus on population and social statistics. United Nations Economic Commission for Europe. Available at: http://www.unece.org/stats/publications/Register_based_statistics_in_Nordic_countries.pdf (accessed: 08 August, 2019). |
[45] | Van der Laan, L., Schalke, R. ((2001) ). Reality versus policy: The delineation and testing of local labour market and spatial policy areas. European Planning Studies. 9: (2), 201-221. |
[46] | Wieser, C. ((2011) ). Establishment surveys that measure employment and wages. ILO Survey of country practices. |
[47] | Zubarevich, N. ((2017) ). Russian agglomerations: Trends, resources and governability. Social Sciences. 48: (4), 66-80. |
[48] | Zyukova, N.B. ((2012) ). Evolution of the concepts and models of functional and territorial development of urban agglomerations. Moscow: Gradostroitelstvo. 1: , 47-50. |


