
Using the index method for international comparison of indicators of GDP factors
Abstract
In the article were discussed the conceptual framework of international comparison of the dynamics, structure of GDP and the influence of factors on GDP at the production stage, using the index method and data from the national accounts. The three-factor multiplicative model was proposed. On this basis were drawn conclusions about and the impact of defining factors on GDP of Ukraine and Poland for 2014–2016. This made it possible to compare the effect of individual factors on the GDP of the selected countries.
1.Introduction
International comparisons of the dynamics, structure of gross domestic product (GDP) and the impact of factors on GDP at the stage of production require the use of adequate methods and relevant time series of indicators for individual countries. One of such methods is the index method. The important source of such data are the System of National Accounts (SNA) of the countries, where it compiled to date. SNA is used to represent to international organizations national accounts data that meet the standard, internationally accepted concepts, definitions and classifications. National accounts data are widely used for international comparisons of such key aggregates as GDP or GDP per capita, as well as for comparisons of structural statistical indicators such as the ratio of investment volumes, taxes, or public expenditure to GDP. As underlined in SNA 2008, the results of such comparisons are used by economists and other analysts to assess the effectiveness of the economy of the country compared to countries of similar levels of economic development. They can influence public and political opinion about the relative effectiveness of economic programs. In addition, databases, which include country sets of national accounts, can be used for econometric analysis, in which time series of data and cross-classification data are combined, which provides a wider range of observations for the assessment of functional interconnections [1].
The objectives of this research are international comparisons of GDP factors using the index method.
Performing this task will help to compare the dynamics, structure and factors of influence on the GDP of individual countries and to understand at what level economies of these countries were at the time of the survey.
We are not trying to present a general survey of the subjects that are touched upon, but instead a very selective and incomplete one subordinated to the needs of the main topic of interest. Most subjects have been discussed extensively by more distinguished authors: for a deeper and more extensive treatment of approximation of economic indices and indicators, the reader is referred to Theil [2, 3], Diewert [4], Diewert and Blackorby [5] and Balk [6], on subindices of economic indices to Gorman [7], Pollak [8] and Blackorby et al. [9], and finally, on additive welfare change indicators to Diewert [10], and Balk et al. [11].
2.Methodical approaches
In order to solve these tasks were used the data of the production accounts and the generation of income account of the national accounts ESA 2010 [12]. The production account occupies a special place in the SNA because it is the first account among other accounts of current operations. It does not cover all operations related to the production process, but reflects only the result of the production of goods and services (output) and use of goods and services in the production of this output (intermediate consumption). Production account at the level of the country’s economy as a whole is shown below (Table 1).
Table 1
Production account
| Uses | Resources |
|---|---|
| Intermediate consumption | Output at basic prices |
| Net taxes on products and imports | |
| Gross domestic product at | Gross output at market prices |
| market prices | |
| Total | Total |
Source: [12].
The resource part of the consolidated account comprises the output of goods and services and taxes less subsidies on products and imports. The use section shows the intermediate consumption of goods and services. Balancing item is Gross Domestic Product. At the level of sectors and types of economic activity, the balancing item in the production account is the gross value added. The generation of income account also linked to the production process (Table 2). It shows how GDP is distributed between labor (wages), capital (operating surplus or mixed income) and public administration (taxes on production and imports less subsidies in so far as they are included in the assessment output).
Table 2
Generation of income account
| Uses | Resources |
|---|---|
| Compensation of employee | Gross domestic product at |
| market prices | |
| Net taxes on products and imports | |
| Operating surplus or mixed income | |
| Total | Total |
Source: [12].
The resource part includes the gross domestic product at market prices. The use part includes compensation of employees, taxes and subsidies on production and imports and operating surplus or mixed income (balancing item).
There is a problem of converting data in national currencies into one currency, comparing indexes of national accounts, in absolute terms because neither market nor fixed exchange rates reflect the relative internal purchasing power of different currencies. Converting GDP or other statistical data into one currency using exchange rates, the prices at which goods and services are valued in countries with higher income are generally higher than in countries with a relatively low income [1]. This leads to exaggeration of the differences between their real incomes. Therefore, data calculated using exchange rates can not be used for international comparisons of indexes of national accounts in absolute terms. In international practice, this problem is solved by purchasing power parity (PPP), which is an index of currency conversion. It is necessary in order to equal the prices of a general basket of goods and services in two countries under consideration. However, PPPs are mainly used for GDP recalculations as part of the International Comparison Program (ICP) [13], the main purpose of which is to provide comparable price, volume measures of GDP, and its expenditure aggregates among countries within and between regions. Through a partnership with international, regional, sub-regional and national agencies, the ICP collects and compares price data and GDP expenditures to estimate and publish purchasing power parities (PPPs) of the world’s economies [14, 15, 16]. In 2018, the ICP celebrated the 50th anniversary of its foundation in 1968 as a joint venture of the United Nations and the University of Pennsylvania, under the leadership of Irving Kravis, Robert Summers and Alan Heston. The program has come a long way since then and has evolved into the largest statistical partnership in the world with the participation of about 200 countries, 20 global, regional and sub-regional agencies, and renowned experts. In recognition of the ICP’s relevance and impact, the United Nations Statistical Commission (UNSC) instituted the program as a permanent element of the global statistical work program in 2016 [17].
According to François Lequiller and Derek Blades, cross-country comparisons are more difficult because: the statistical methods for estimating national accounts variables can vary from one country to another; countries’ national institutions may be different; and countries do not have the same currency and the same price levels. Nevertheless, such comparisons can be made, even if in some cases adjustments are to be made. They are achieved by comparing: the growth rates of certain variables (such as GDP in volume), certain ratios (such as the profit rate or the public debt ratio) and the absolute levels of certain national variables among several countries (such as the level of GDP per capita) [18].
Considering these circumstances, only the relative indicators were used to solve the problems of our research.
The structure of production was calculated as the share of GDP and intermediate consumption in the output according to national accounts data in market prices. Efficiency of production was calculated using the coefficient of coordination, as the ratio of GDP to intermediate consumption.
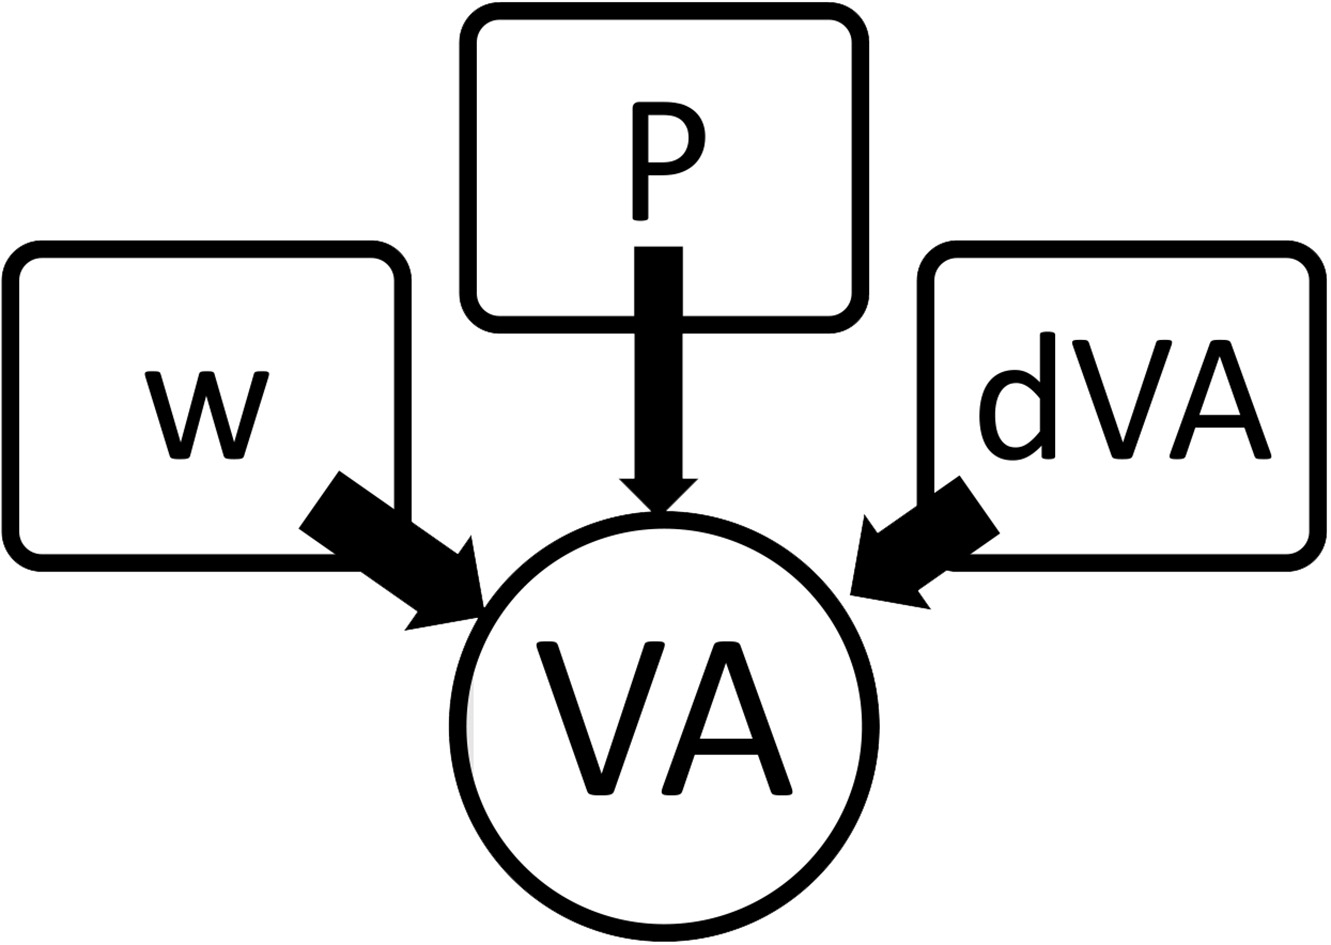
For the assessment of the impact of factors on GDP we can articulate the hypothesis that the gross value added at the level of the institutional unit or branch of economy (VA) are influenced by the following factors (see Fig. 1): labor costs (we use the indicator of income formation – wages of hired workers – W), productivity (output divided by unit labor costs – P) and the share of gross value added in output (dVA).
Figure 1.
Model of the relationship of factors gross value added.
The great majority of multifactor multiplicative models considered in the literature is constructed according to a single principle, namely by “dissecting”, detailing one of the factors in the original two-factor model [19]. For example, the initial two-factor model of the dependence of GDP on output and the share of GDP in output can be transformed into a three-factor model by presenting the initial indicator – output as a function of two factors. In this case, we will use the indicators of labor costs and labor productivity (we will divide output by labor costs).
This procedure provides the possibility of reverse enlargement of the model, carried out by presenting the product of two adjacent factors as one enlarged factor. When considering most of the models known from literary sources, it is found that enlargement of factors is possible not only “from left to right”, but also “from right to left” [20]. Multiplying the indicator of labor costs by labor productivity, we obtain the output.
Therefore, despite the formal independence of the product value from the permutation of the factors, when constructing multifactor models having a volumetric indicator as an effective one, one can always indicate the only possible sequence of arrangement of factors satisfying the above conditions (enlargement of factors is possible not only “from left to right”, but also “from right to left”). These conditions are satisfied by the model with the arrangement of factors according to the serial numbering of their indices and the model with the reverse order of the arrangement of factors, which for this reason is no different from the original model.
A model that has a volumetric indicator as a productive (complete model) can always be converted to an incomplete one by eliminating the last factor in volume from it. In this case, not a volumetric but a qualitative indicator (labor productivity) will act as an effective one. Such a model, obtained by “truncating” the complete model, will retain all the properties of the pairwise products of factors considered above.
Based on this special feature, the question of the sequence of the arrangement of factors in incomplete models is easily solved. A model linking GDP from output and the share of GDP in output is incomplete:
GDP
Converting this model into (useful) complete one, we will get:
GDP
where the labor productivity
At the level of institutional units, sectors or branches of economy for gross value added holds the same factorization (with the same argumentation):
(1)
where
At the same time, labor costs are an extensive factor, but labor productivity and the share of gross value added in gross output are intensive factors.
The relative form of the analysis of the influence of changing factors on the change in the effective indicator is extremely simple:
(2)
where
Table 3
Comparison of the structure and efficiency of production of Ukraine and Poland in 2014 and 2016, percentage
| Indicator | 2014 | 2016 | ||
|---|---|---|---|---|
| Ukraine | Poland | Ukraine | Poland | |
| Output at market prices | 100.0 | 100.0 | 100.0 | 100.0 |
| Intermediate consumption | 55.4 | 52.6 | 56.0 | 52.8 |
| GDP at market prices | 44.6 | 47.4 | 44.0 | 47.2 |
| Level of efficiency of using the | 80.5 | 90.2 | 78.6 | 89.5 |
| intermediate consumption | ||||
Growth of GDP as a sum of
total change of GDP in absolute terms. where
The contribution of each of the factors is defined as:
(3)
where
Change of GDP as a sum of
(4)
The influence of each of the factors is defined as:
change of
3.Case study: Comparing Ukraine and Poland
International comparisons of indicators of dynamics, structure and influence of factors on GDP at the production stage are made on the basis of data of national accounts of Ukraine and Poland in 2014 and 2016 [21, 22]. The choice of these years was based on the desire to show how the results of economic reforms affected the structural economy of Ukraine compared to similar changes in the Polish economy.
The share of GDP in gross output in Ukraine is smaller than in Poland (by 3.2 percentage points in 2016 and in 2014 by 2.8 percentage points), which indicates that the level of efficiency of intermediate consumption in Ukraine is lower (see Table 3). The share of the value of products consumed during this period in the process of production in Ukraine increased faster than in Poland.
Comparison of the efficiency of using intermediate consumption of the two countries by sector of the economy in 2016 indicates a higher level of use of intermediate consumption in the sectors of non-financial corporations, general government and households in Poland, but in the sectors of financial corporations and non-profit organizations serving households this indicator is much higher in Ukraine.
Analyzing the influence of individual factors on the dynamics of GDP of Ukraine and Poland, we can draw the following conclusions.
Table 4
Indexes of the influence of individual factors on the dynamics of GDP of Ukraine and Poland for 2015–2016
| Country | VA | Due to | ||
|---|---|---|---|---|
| Ukraine | 1.197633136 | 1.128163054 | 1.060723762 | 1.000805383 |
| Poland | 1.027551659 | 1.075122219 | 0.965605598 | 0.989796817 |
Regarding indicators of gross value added changes due to changes in labor costs in 2016 relative to 2015 should be noted greater impact of this factor in Ukraine versus Poland (difference of index by 5.3 percentage points in favor of Ukraine). This goes to provide that the expansion of GDP growth in Ukraine is more strongly influenced by the extensive factor of the rate of economic growth compared with Poland (see Table 4). In assessing the impact of labor productivity indicators on the dynamics of gross value added (intensive factor), it can be noted that the situation in Ukraine is better than in Poland. While there is a negative indicator in Poland (96.6%), in Ukraine, it has a tendency to increase (106.1%).
Analyzing the indicators of the share of gross value added in the volume of output (intensive factor), it seems fair to say, that the effect of this factor negatively affected the dynamics of gross value added in Poland, and in Ukraine it has practically not changed.
In summary, comparing the overall impact of factors on the dynamics of GDP in two countries, we note that in Ukraine compared with Poland, the GDP dynamics are heavily influenced by intensive factors than extensive ones.
4.Conclusion
In this paper we have reexamined the conceptual framework of international comparisons of indicators of GDP factors, proposed a new approach using the index method and considered the possibility of its approximation in practice. Besides, the paper shows how national accounts data can be used for international comparisons of various indicators of the economic development of different countries.
From our point of view, it is necessary to take into account the scale and specificity of the development of economies of compared countries. Otherwise, such comparisons will not be of practical value.
References
[1] | System of National Accounts, (2008) . European Commission, IMF, OECD, UN, World Bank, New York, 2009. [Electronic resource]. Access mode: http://unstats.un.org/unsd/nationalaccount/sna2008.asp – Title from the title screen. |
[2] | Theil, H. ((1974) ). More on log-change index numbers. Review of Economics and Statistics, 54: : 552-554. |
[3] | Theil, H. ((1975) ). Consumer Demand. Theory and Measurement. Vol 1. Amsterdam: North-Holland. |
[4] | Diewert, W.E. ((1978) ). Superlative index numbers and consistency in aggregation. Econometrica, 46: : 883-900. |
[5] | Blackorby, C., Diewert, W.E. ((1979) ). Expenditure functions, local duality and second order approximations. Econometrica, 47: : 579-602. |
[6] | Balk, B.M. ((1990) ). On calculating cost-of-living indices for arbitrary income levels. Econometrica, 58: : 75-92. |
[7] | Gorman, W.M. ((1959) ). Separable utility and aggregation. Econometrica, 27: : 3. |
[8] | Pollak, R.A. ((1975) ). Subindices in the cost of living index. International Economic Review, 16: : 135-150. |
[9] | Blackorby, C., Primont, D., Russell, R.R. ((1978) ). Duality, Separability, and Functional Structure: Theory and Economic Applications. North Holland, New York. |
[10] | Diewert, W.E. ((1992) ). Exact and superlative welfare change indicators. Economic Inquiry, 30: : 565-582. |
[11] | Balk, B.M., Färe, R., Grosskopf, S. ((2004) ). The theory of economic price and quantity indicators. Economic Theory, 23: : 149-164. |
[12] | The European System of Regional and 4. National Accounts, (2010) . Eurostat. Regulation (EU) No 549/2013 21 May 2013. [Electronic resource] https://eur-lex.europa.eu/legal-content/EN/TXT/PDF/?uri=CELEX:32013R0549&from=en. |
[13] | International Comparison Program [Electronic resource]. Access mode: https://www.worldbank.org/en/programs/icp. |
[14] | International Comparison Program. OECD. 25 March (2005) . Retrieved 18 January 2014. [Electronic resource]. Access mode: https://stats.oecd.org/glossary/detail.asp?ID=6280. |
[15] | Lewis, Sherman; Dustyn Bindel. ((2014) ). International Comparisons.org (web). Retrieved 18 March. |
[16] | Peter Neary, J. ((2004) ). Rationalizing the Penn World Table: True Multilateral Indices for International Comparisons of Real Income/American Economic Review? December 2004. [Electronic resource]. Access mode: https://www.researchgate.net/publication/4981096_Rationalizing_the_Penn_World_Table_True_Multilateral_Indices_for_International_Comparisons_of_Real_Income. |
[17] | The 50th anniversary of the ICP [Electronic resource]. Access mode: http://www.worldbank.org/en/programs/icp/brief/50th-anniversary. |
[18] | Lequiller, F., Blades, D. ((2014) ). Understanding National Accounts: Second Edition, OECD Publishing. [Electronic resource]. Access mode: http://dx.doi.org/10.1787/9789264214637-en2014. [Electronic resource]. Access mode: http://internationalcomparisons.org/index.html. |
[19] | Andrienko, V.Y. ((2004) ). Statistical indices in economic research. Kyiv 2004. |
[20] | von der Lippe, P. ((2001) ). Chain Indices. A Study in Price Index Theory. Statistisches Bundesamt, Wiesbaden 2001. |
[21] | Official site of the State Statistics Service of Ukraine [Electronic resource]. Access mode: http://www.ukrstat.gov.ua. |
[22] | Official site of the Statistics Service of Poland [Electronic resource]. Access mode: http://stat.gov.pl. |


