
The five V’s, seven virtues and ten rules of big data engagement for official statistics
Abstract
Faced with increasing demands from users of official statistics, declining budgets, increasing data collection costs and coupled with the increasing supply of new data sources, national statistical offices (NSOs) are attracted to using these newer sources for the production of official statistics. However, given the under or over-coverage biases and measurement errors inherent in these sources and the high standard of accuracy required for official statistics, what are the rules of engagement that NSOs would need to take into account before deciding to use these sources? In this paper, against the background of the 5 V’s and 7 virtues of big data that are discussed in the literature, we suggest ten rules of engagement, seven of which are considered as non-negotiables and three as essential for official statistics. We also provide three use cases to illustrate the ten rules.
1.Introduction
In 2011, the UNECE in its Handbook of Principles and Practices for using administrative and secondary data sources for official statistics [1], wrote
“Statistical organisations around the world are coming under increasing pressure to improve the efficiency of the statistical production process, and particularly to make savings in costs and staff resources. At the same time, there are growing political demands to reduce the burden placed on the respondents to statistical surveys. This is particularly the case where respondents are businesses, as many governments see reducing bureaucracy as a key measure to support and promote business development. Given these pressures, statisticians are increasingly being forced to consider alternatives to the traditional survey approach for gathering data. Naturally, the most obvious approach is to see if usable data already exist elsewhere. Many non-statistical organisations collect data in various forms, and although these data are rarely direct substitutes for those collected via statistical surveys, they often offer possibilities, sometimes through the combination of multiple sources, to replace, fully or partially, direct statistical data collection.”
Figure 1.
Existing and emerging data sources.
Nearly ten years on, these pressures still exist. Statistical organisations continue to be pressured to improve the efficiency of statistical production processes, make savings in costs and staff resources, reduce the burden placed on respondents to statistical surveys, and to consider alternatives to the traditional survey approach as a way of gathering data.
2.Emerging data sources for official statistics
To ensure national statistical systems in market-oriented democracies produce appropriate and reliable data that adhere to certain professional and scientific principles, the international statistical community have developed and endorsed a set of ten Fundamental Principles of Official Statistics (FPOS) [2]. According to FPOS five “data for statistical purposes may be drawn from all types ofsources, be they statistical surveys or administrative records. Statistical agencies are to choose the source with regard to quality, timeliness, costs and the burden on respondents.”
The Principle endorses the use of all types of data sources and mentions two data sources in particular – statistical surveys and administrative records. However, these are just two of a large number of data sources which exist in contemporary society. Big data is a new data source gaining much attention.
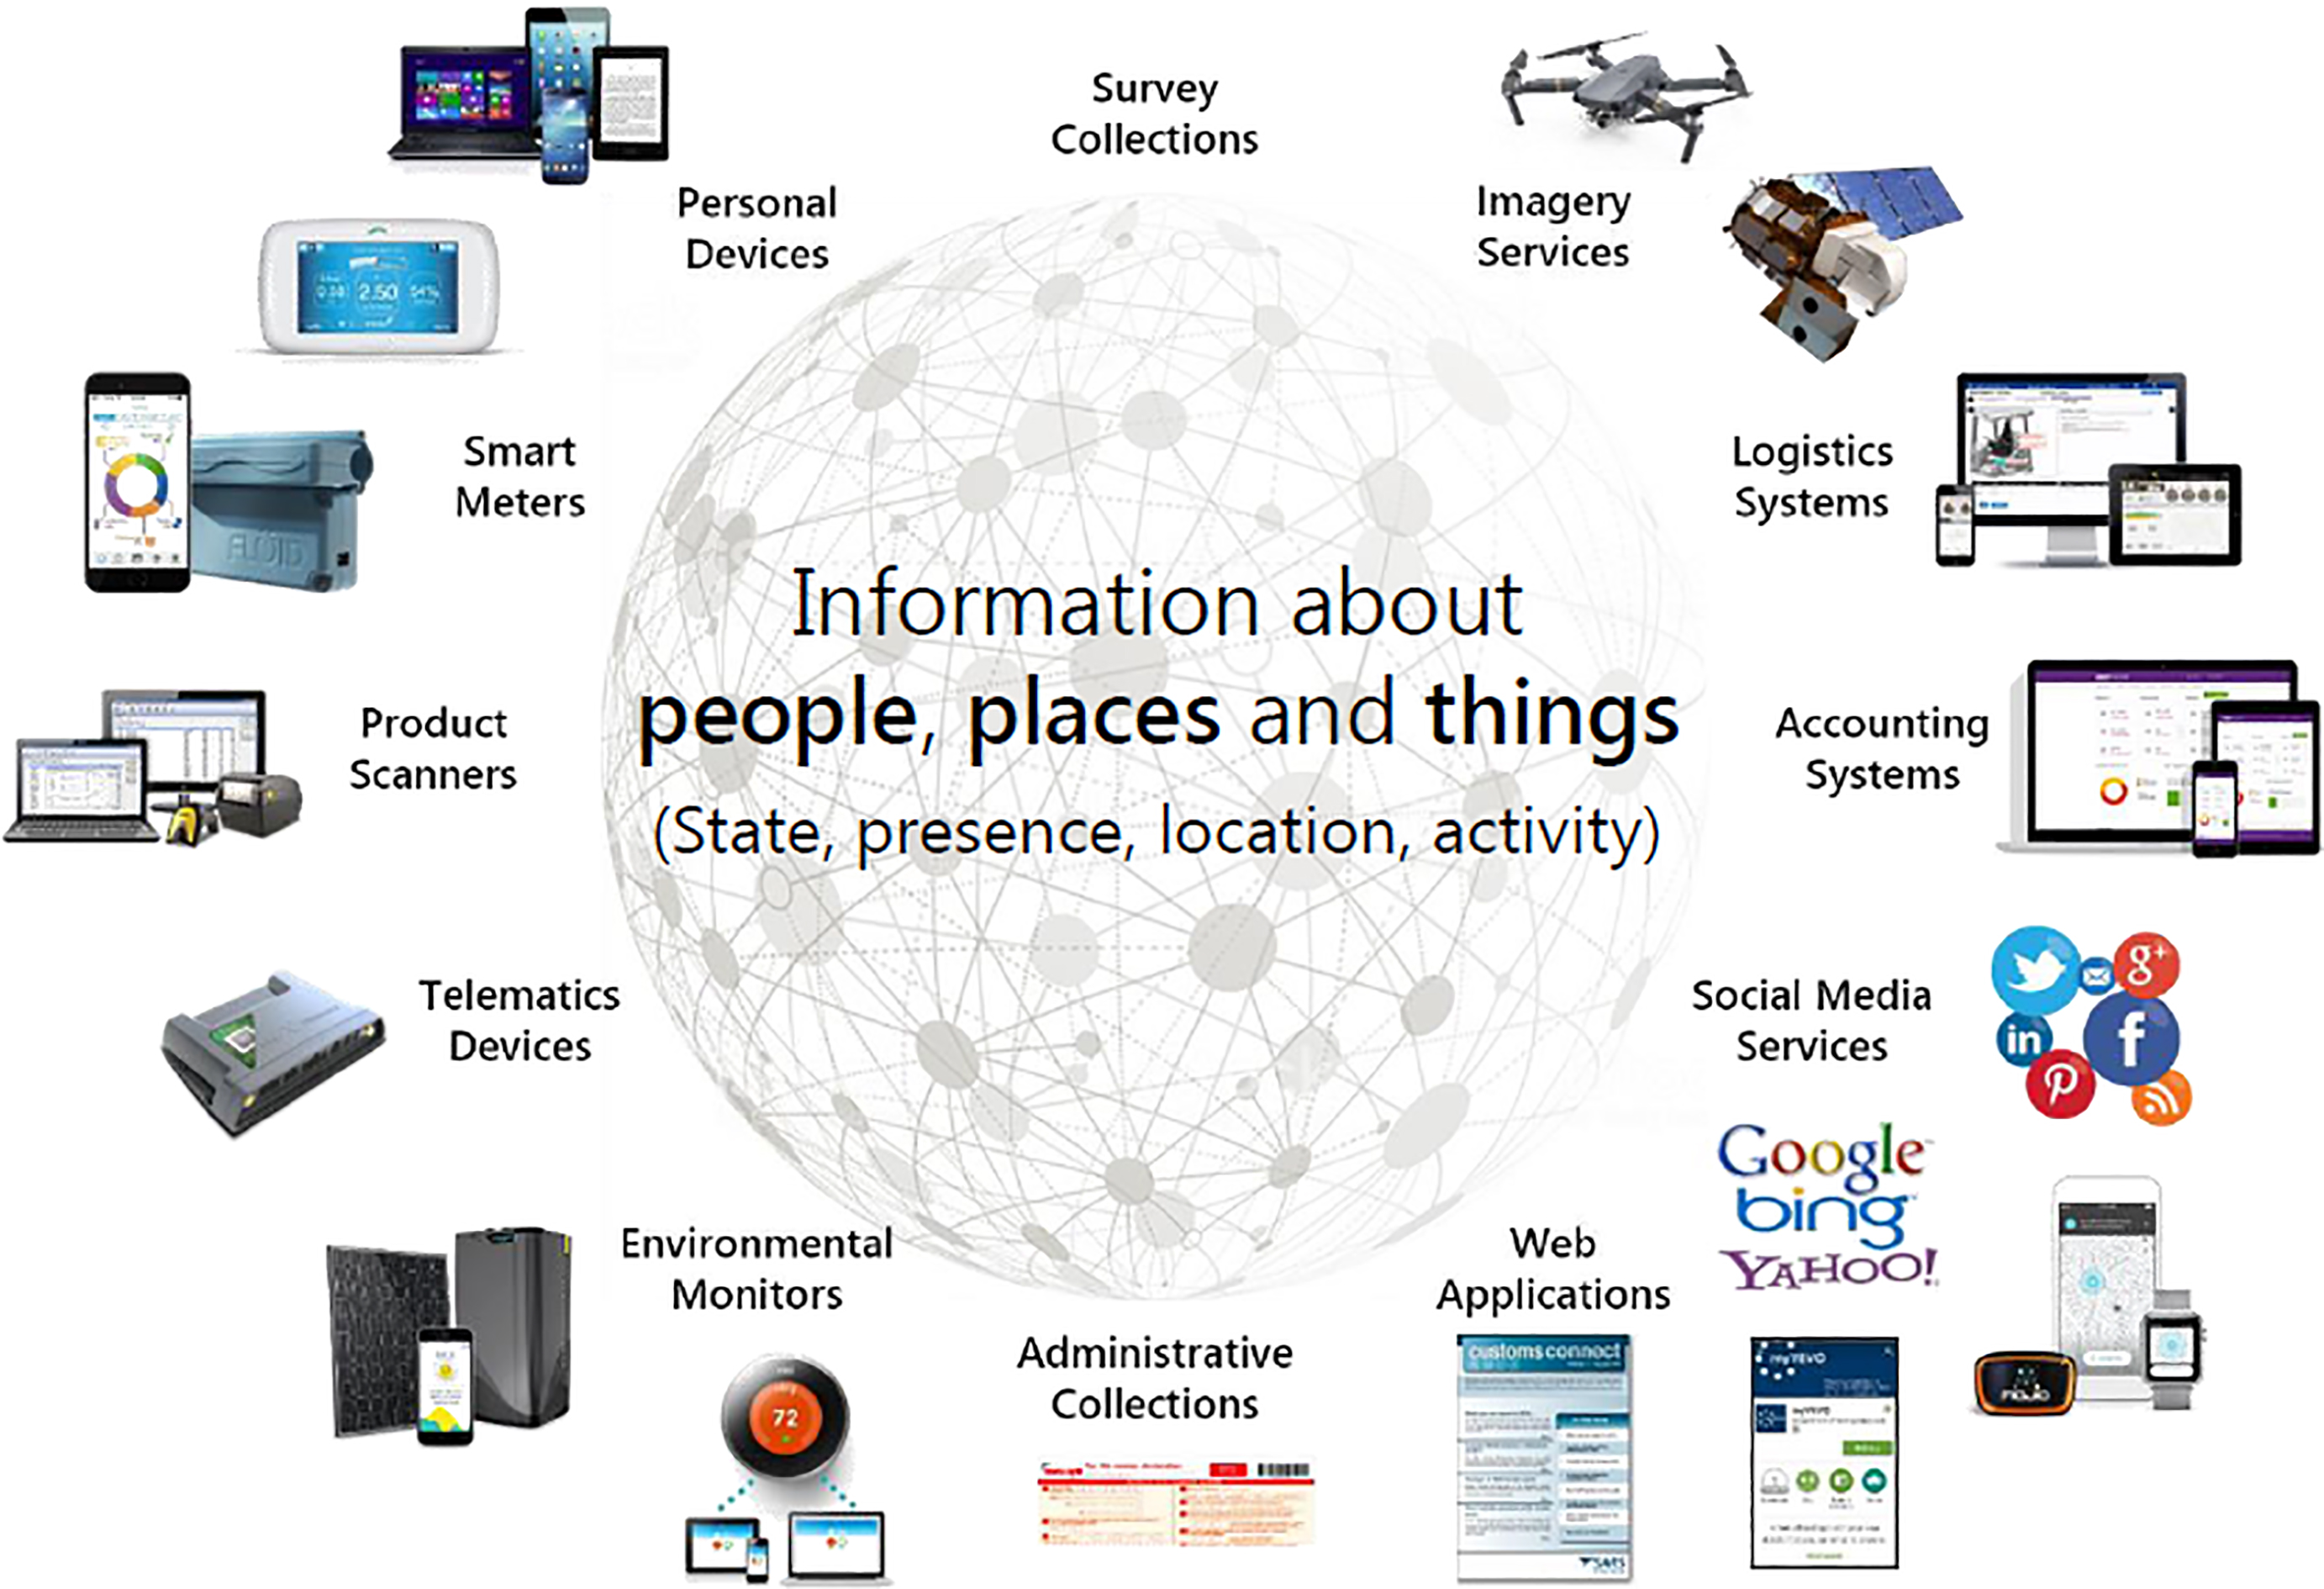
A phrase first coined by Kevin Ashton (2009) [3], the Internet of Things (IoT) is a system of interrelated computing devices, mechanical and digital machines, objects, animals or people that are provided with unique identifiers and the ability to transfer data over a network without requiring human-to-human or human-to-computer interaction [4].
A visual depiction of IoT data sources available currently for statistical purposes is given in Fig. 1 [5]. Collectively, the collection of these IoT sources may be described as big data. Given the nature of their work, official statisticians are particularly interested in counting people, businesses and things in their respective locations.
Whilst official statisticians have been utilizing census, survey and administrative sources for a long time, there are increasingly more recent examples in the use of IoT or big data sources from personal devices such as mobile phones in the study of population movement [6]; smart meters to study household electricity consumption [7]; product scanners for the Consumer Price Index (CPI) [8]; telematics devices in the study of road usage [9]; environmental scanners for agricultural statistics [10, 11]; and social media for sentiment analysis [12].
The opportunities and challenges for using these big data sources for official statistics have been discussed in [13, 14, 15]. As the data from these sources can be collected continually and at very granular levels, they provide an excellent opportunity for official statisticians to provide richer, more frequent and detailed statistics at small domain levels.
Recognising the importance of big data for official statistics, the United Nations Statistical Commission, the apex body for global statistical standards, concepts, methods and frameworks, has created a Global Working Group on Big Data for Official Statistics to investigate the benefits and challenges of big data. The Global Working Group is addressing issues pertaining to methodology, quality, technology, data access, legislation, privacy, management and finance.
The focus of this paper is to review the opportunities for harvesting the emerging IoT or big data sources and the conditions under which these data sources can be used for the production of official statistics. Readers interested in examples on integrating administrative data sets with census and surveys data are referred to the Statistics New Zealand’s Integrated Data Initiative, or the Australian Prime Minister and Cabinet Department’s Data Integration Partnership Agreement.
3.The five V’s of big data
Big data have been popularly characterized by five V’s in the ICT literature, namely, Volume, Velocity, Variety, Veracity and Vulnerability. In this Section, we will look at these characteristics from the official statistics’ perspective.
3.1Volume
Volume, which refers to amount of information available in big data, has been advocated as a plus for official statistics. It is, however, only a plus, if the quality of the information is sufficient to meet the high standard of official statistics. Size of a data set is of less interest to official statisticians than the insights that may be created from the data set. Survey statisticians are trained to extract value even from a relatively small sample from the target population.
Therefore, it is the value of the insights that may be created rather than the volume of the data set that matters to the official statistician (see also the discussion under Veracity below).
3.2Velocity
Velocity refers to the speed and frequency at which the data is generated. As compared to the relatively infrequent availability of census and survey data, high velocity big data is definitely very attractive for the production of more regular and frequent official statistics.
3.3Variety
Variety refers to the different types of data available which are broadly described as structured and unstructured data. Increasingly official statisticians have started to harness information from structured data of the newer data sources e.g. sensor data such as mobile phone data, telematics data, satellite imagery data, and unstructured data as well e.g. data from social media.
3.4Veracity
Veracity refers to the quality and accuracy of the big data, and consequently, the value of the insight that may be generated from the data set. With few exceptions, it is well known [12, 16, 17] that big data suffers from bias of coverage, self-selection, and in many cases, have definitions used in the data collections different from international standards (hereinafter referred to as measurement errors).
To some extent, users would have an idea on the quality of the data if there is transparency on the meta data and methodology underpinning their collection, processing and dissemination.
To harvest any data set subject to such biases or errors for the production of official statistics, a methodology is required for adjustment.
A brief review of the methods advocated in the literature to make inference using big data is given in [30]. In particular [18, 19], provide a design-based methodology which assumes that the population of interest comprises a big data stratum, and a non-big data stratum. As the former is fully observed, they use a random sample to estimate the non-big data stratum and show that substantial improvement in efficiency in estimation can be obtained by combing big data and survey data this way.
They have also shown that the methodology can be extended to handle measurement errors in the big data set, or the random sample, as well as non-response bias in the probability sample.
3.5Vulnerability
Vulnerability refers to the risk of exposure of the big data set to cyber security threats or disclosure of individual’s information. There is also the issue of whether it is ethical to use big data for the production of official statistics.
Where the big data set has been passed from the data custodian to a statistical office, it can be argued that the cyber security set up in a statistical office, would be equally good in protecting against security threats on big data as it is on traditional sources of census survey and administrative data.
Over the past 20 years, and consistent with Principle 6 of FPOS, statistical offices have developed statistics disclosure control (or confidentiality) methods to protect the disclosure risks and confidentiality of individual’s information. It can be argued that these methods would be equally effective to protect the confidentiality of statistical outputs from big data.
The ethnical challenges faced by the official statistician in using big data to produce official statistics are outlined in [19], namely,
• the boundary between public good and private good;
• privacy and confidentiality;
• transparency;
• equity of access; and
• informed use of information,
and it was concluded that the behavior of the official statisticians in the use of big data (similar to other data) should be guided by such values as professional integrity, rights of society vs rights of data custodians, and individuals.
4.Ten rules of big data engagement for official statistics
With the pressures faced by statistical organisations to improve the efficiency of statistical production processes, make savings in costs and staff resources, reduce the burden placed on respondents to statistical surveys, and to consider alternatives to the traditional survey approach as a way of gathering data, what are some practical steps a national statistical office (NSO) could take to make use of alternatives to the traditional survey approach as a way of gathering data?
In an invited talk delivered to the 62
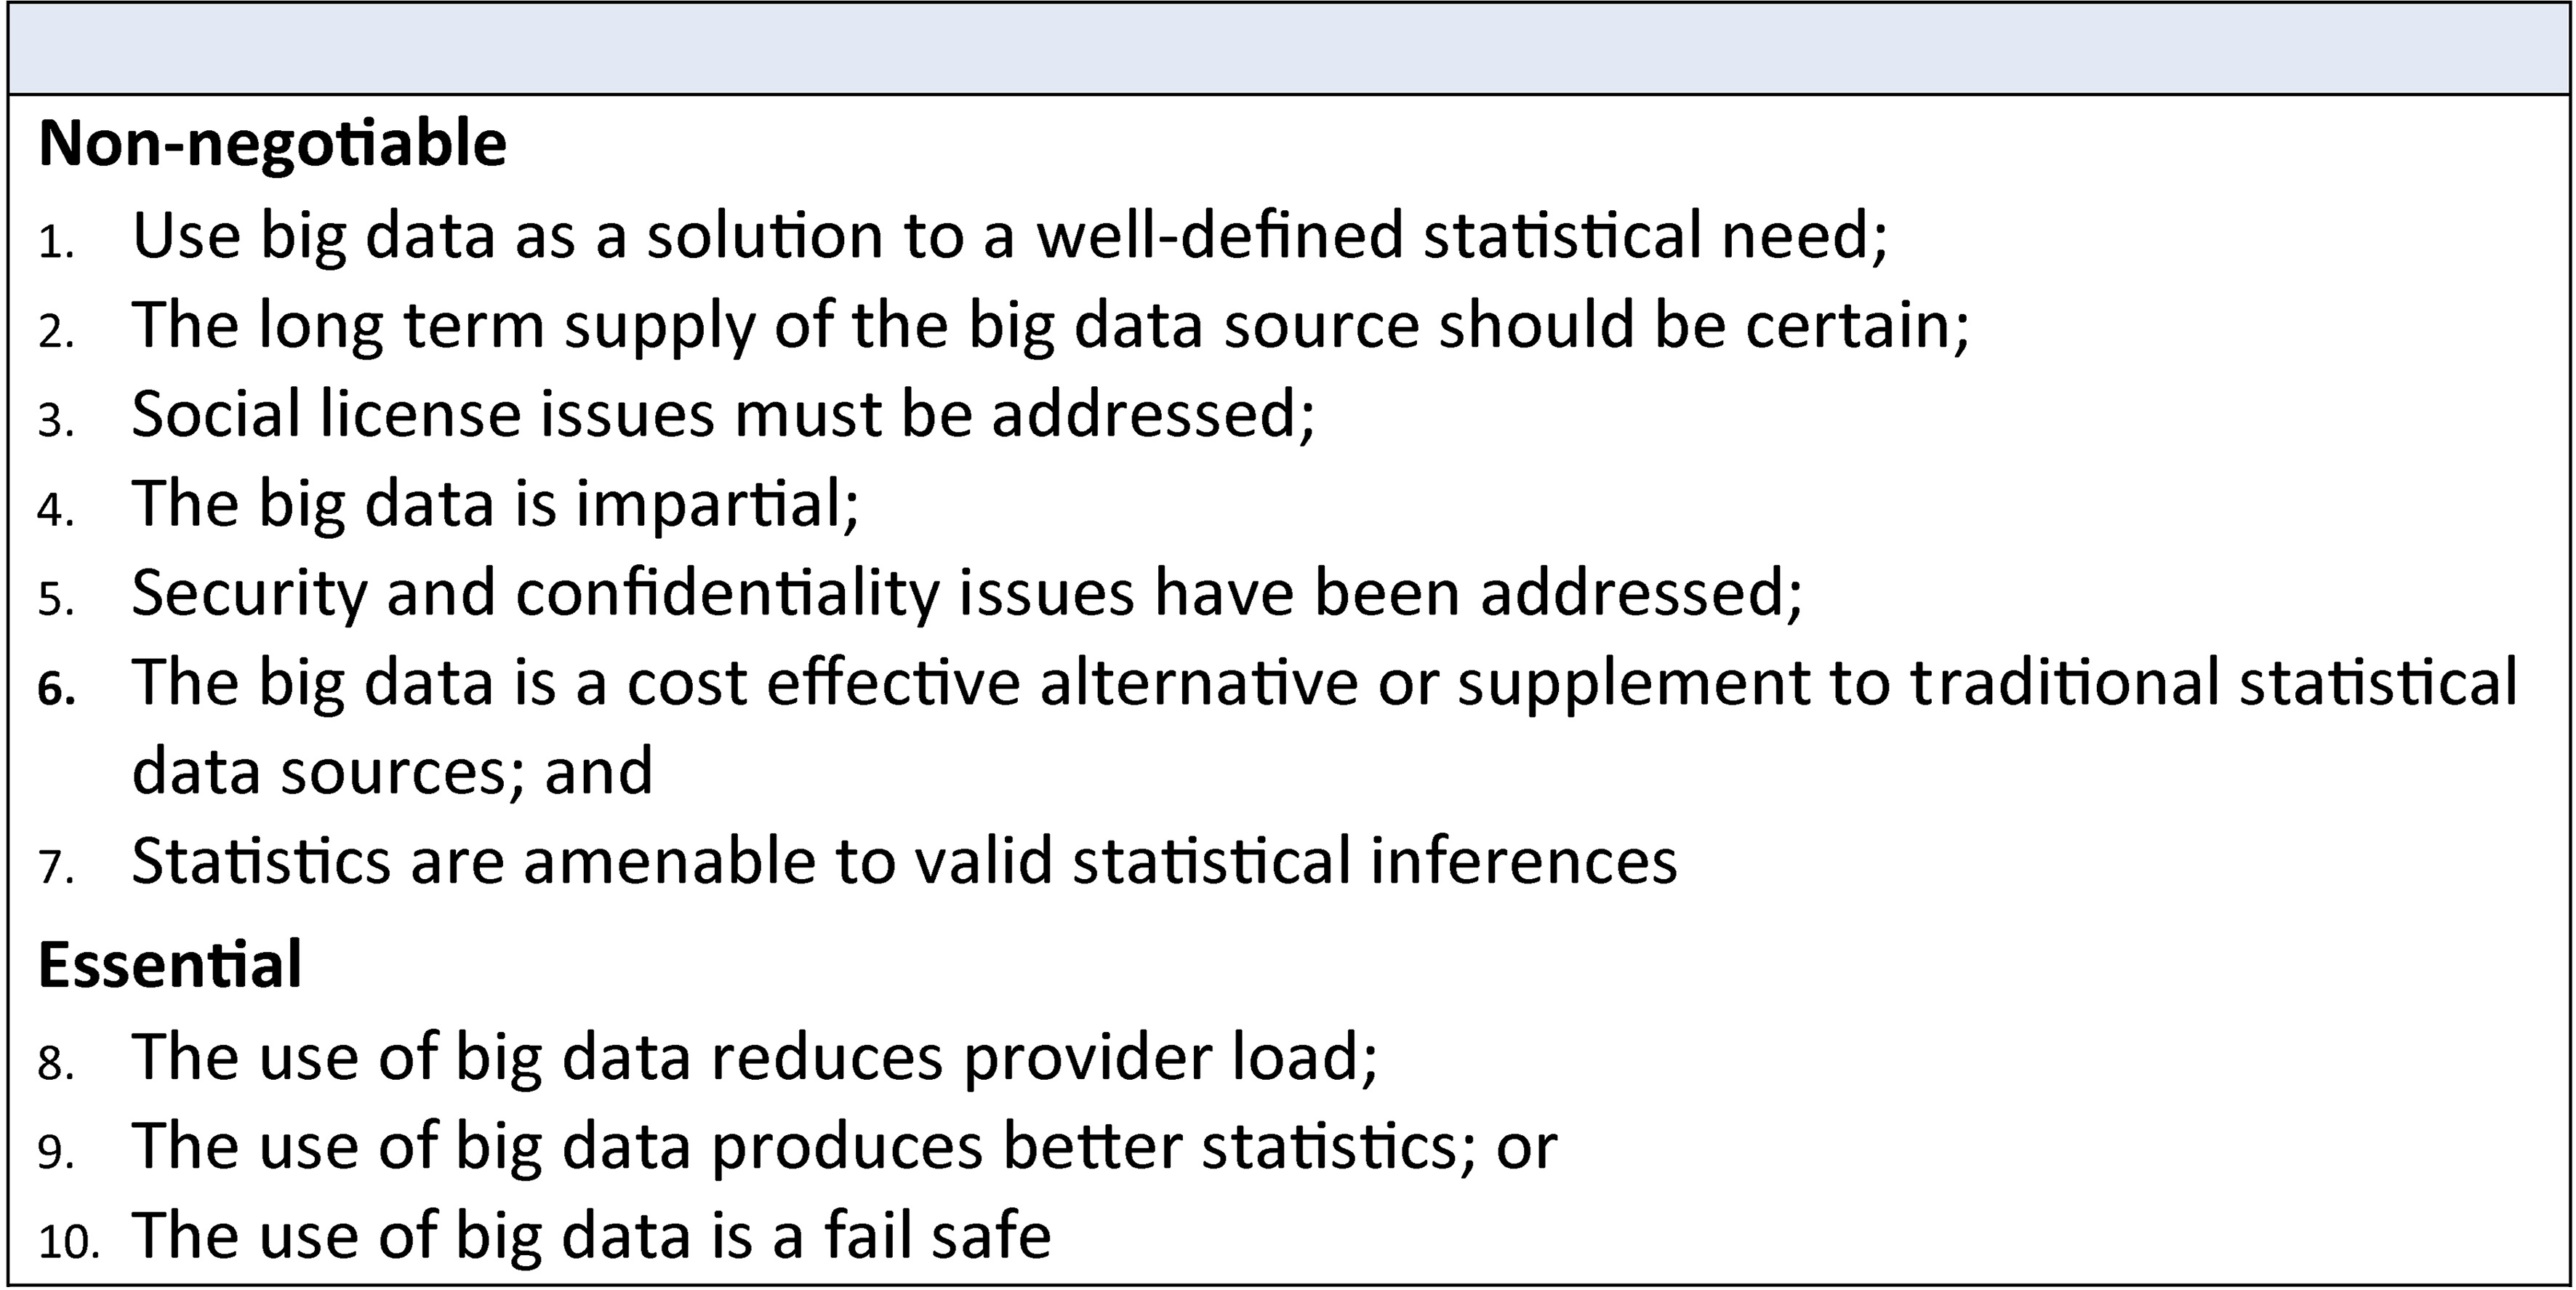
Building on these seven virtues, we propose 10 rules of big data engagement for official statistics. These are summarized in Fig. 3.
![The 7 virtues for big data [21].](https://content.iospress.com:443/media/sji/2020/36-2/sji-36-2-sji190595/sji-36-sji190595-g002.jpg)
Figure 3.
When could big data be used for official statistics?
4.1First rule of engagement
The first rule of engagement has to be the big data is a solution to a well-defined statistical need.
Principle 1 of FPOS states official statistics must be of practical use. As a government agency, the mission of a NSO is to provide a public service and produce statistics that are relevant. NSO are open to scrutiny and must be able to demonstrate to the public the statistics are demand-driven and create public value.
An objective measure for this rule would be demonstrated need(s) for the provision of relevant official statistics and the public value to be created by the statistics.
4.2Second rule of engagement
The second rule of engagement is the long-term supply of the big data should be certain.
A key statistical need of users is to measure change and trends. Change and trends cannot be measured without repeated measurements over time. This requires long term supply of the data source used in the measurement, without which, there are huge risks in the future production of official statistics based on this data.
In addition, the statistical office needs to be certain that the processes used to generate the data remain constant over time, or as a minimum, changes to the processes are notified by the data custodians.
These require the NSO to develop an ongoing and strategic relationship with the data custodians, resulting in contractual agreements or memoranda of understanding between the NSO and data custodians to guarantee the long-term supply of the data, as well early notification to the NSO for any planned change to the collection, processing and dissemination process of the big data. This may include edge computing, where appropriate – see the fifth rule below.
4.3Third rule of engagement
The third rule of engagement is that social license issues must be addressed.
Social license in this instance is the acceptance of the community and other stakeholders for the NSO to use the big data source, either singly or in combination with other data sources, for the production of official statistics.
Obtaining the social license is arguably a pre-requisite for the data custodian or provider to agree providing their information to the statistical office, and for the office to be confident that there will be no disrepute to the office in using the big data.
Privacy by design, public consultation, transparency, and ethics committees are some of the mechanisms which can be used to address social license issues.The outcomes of these mechanisms can be used to make judgements on societal acceptance of using the big data source for the production of official statistics. See also the fifth rule of engagement.
4.4Fourth rule of engagement
The fourth rule of engagement is big data has to be impartial.
Impartiality, like social license, is crucial in maintaining the trust by users on the integrity of the products and services offered by the NSO. Trust is the “currency” of a NSO and must be vigorously defended. Trust can be lost quickly but will take a long time to rebuild.
To build and retain trust in official statistics, Principle 2 of FPOS states that decisions on statistical matters be based on strictly professional considerations, including scientific principles and professional ethics. This will go a long way to demonstrating the impartiality of big data.
Transparency in the meta data and the methods used in the collection, processing and dissemination of big data will also demonstrate the impartiality of the data.
An objective measure for this rule would be for outcome-independent processes used in the collection, processing and dissemination of the big data by the data custodian i.e. the data custodian uses processes that are not designed to support or otherwise deliver certain pre-determined outcomes.
4.5Fifth rule of engagement
The fifth rule is to address the security and confidentiality issues of big data. These issues have also been briefly discussed under Vulnerability of the five V’s of big data above.
Security includes physical and IT security. The big data or digital information must be protected against physical or cyber security threats.
The business process for big data can be quite different to that of data directly collected by a NSO. By this we note that big data, due to it volume, may not be stored within the confines of the statistical agency, but remain in the confines and premises of the data custodian. Where this is the case, the responsibility for ensuring the security of the data lies with the data custodian. Edge computing, i.e. doing the number crunching in the data custodian’s premise, is a tool to use for obtaining access to data for official statistics production when that data is not stored within the confines of the statistical agency.
The authority of NSOs to collect data is generally enshrined in statistics legislation. While provided with the power to collect data, the legislation also puts an obligation on the statistics office to keep the information provided by providers confidential. The secrecy provision is a critical part of an agency’s response to social license. Ensuring the confidentiality of information from people, families, households and businesses in official statistics is paramount regardless of the source of the data.
Statistical offices with assistance from academia have, over the past 20 years, developed statistical disclosure control techniques to protect the confidentiality of individual’s information in aggregate and micro data. These techniques can be deployed to protect the confidentiality of data, be it big data, survey data, census data or administrative data.
Objective measures for this rule would be regular security assessment of the NSO’s IT environment and use of statistical disclosure control techniques in the release of official statistics, regardless of data source.
4.6Sixth rule of engagement
The six rule is to ensure that the resultant statistics compiled using big data are amenable to valid statistical inferences.
To do this, biases in the big data source must be addressed. This includes not just over-coverage or under-coverage bias of big data, but also measurement errors of the variables, including departure of the measured variables from international or national statistical standards.
In carrying out an experimental study into the use of machine learning techniques to analyse satellite imagery data for the prediction of crop classification statistics [11], we found that we needed to work with a multi-disciplinary team comprising domain experts, in this case, crop scientists to understand the science of crops and its relationship to reflectance spectroscopy, data scientist/statisticians and computer scientists. Given the subject matter knowledge required on the domain of study, we believe such teams are needed to harness other big data sources.
As well, measures of uncertainties of the resultant statistics have to be provided to assist the users to interpret the statistics.
NSOs are well experienced to address biases in a data sources. Addressing under-coverage errors in big data, however, is currently a hot topic in statistical research. These include propensity adjustment methods, modelling methods, and data integration (i.e. combining big data and survey data) methods. Detailed discussions of these methods are beyond the scope of this paper and the interested reader is referred to the relevant references [11, 18, 19, 20, 22, 23, 24, 25, 26, 27, 28, 29]. A brief review of selected methods advocated in the literature is provided in [30].
In addressing the sixth rule of engagement, it is important to keep in mind Principle 2 of FPOS which talks about the need for professional and scientific methods to be used.
An objective measure for this rule would be the ability to provide reliable adjustments for coverage bias and measurement errors in the big data used for compiling official statistics. Where models are used in these adjustments, the adequacy of the models would need to be assessed and details of the models being made transparent. In addition, to assist with inference, reliable estimates of mean squared errors have to be provided for users.
4.7Seventh rule of engagement
The seventh rule requires big data be a cost effective alternative or supplement to made traditional statistical data sources. Otherwise, there is little point is using it as an alternative.
Principle 5 of FPOS states that a data source should be chosen having regard to quality, timeliness, costs and burden on respondents. In this case, the rule of engagement is about cost-effectiveness, not necessarily cost only.
NSOs are experienced in understanding the quality, timeliness, cost and burden on respondent issues associated with traditional statistical data sources. These require the consideration of the data collection, processing and dissemination processes and costs, the benefits or otherwise of the new versus the old sources in official statistics production; if new statistical infrastructure, policies and practices, quality assurance framework are needed etc..
Contrary to popular thinking, processing and curating big data for the production of official statistics is not cost free. This is a highly relevant point in big data usage decisions and may not be widely appreciated by stakeholders and management. Refer to [14] for further information on such costs.
| Rule of engagement for transactions data | Comment |
|---|---|
| Use big data as a solution to a well-defined statistical need | Transactions data provide the ingredient to compile the CPI. |
| The long term supply of the big data should be certain | Long term supply can be assured through contractual agreements or memoranda of understanding between the NSO and the data custodians. |
| Social license issues must be addressed | Generally this is not an issue as the data do not contain information of the shoppers who bought the goods from retailers, and the data is aggregated by commodity. However, where it is found to be prudent to do so, the NSO may consult with the relevant stakeholders to address any misunderstanding and concerns. |
| The big data is impartial | This is satisfied as Transactions data only capture the revenue and quantities by commodity or commodity group, sold by the retailer, from which unit values can be calculated, and are used as representative prices. |
| Security and confidentiality issues have been addressed | Whilst transactions data are generally protected by the firewall of the NSO, adequate security arrangements have to be put in place for the secure transfer of the data from retailers to the NSO. Publication of the CPI using transaction data can use the same statistical disclosure control methods utilised for the CPI compiled using manually collected prices. |
| The big data is a cost effective alternative or supplement to traditional, statistical data sources | As transactions data are generally used to replace manually collected prices from retailers, they are an effective supplement to traditional data sources for compiling the CPI. Increasingly web scraping is used to supplement other prices. |
| Statistics are amenable to valid statistical inferences | As mentioned above, there is consensus amongst the international price statistics community that transactions data together with multilateral price indexes provide better CPI statistics. Also the multilateral methods have been found to be an appropriate algorithm to utilize the richness of transactions data to compile the CPI. |
| The use of big data reduces provider load | Generally, acquiring transactions data increases provider load, although it can be argued that the load is not considered to be huge. Personal visits to collect prices generally have no or minimal provider load, whereas the request for transactions data requires the production of files by IT departments, secure transmission of files, etc. |
| The use of big data produces better statistics | Transaction data provides better CPI through data custodians (a) using a census of products available in datasets; and (b) weighting products at the product and elementary level by expenditure share. The use of transactions data, and high frequency re-weighting, however, will introduce “chain drift” [36] in the production of price indexes. New methods are therefore needed to use transactions data, which led to the development of multilateral methods [8]. |
| The use of big data is a fail safe | Not applicable, given the earlier comment on the effectiveness of using transactions data and multilateral index methods to compile the CPI. |
A cost-benefit analysis of using the big data source as an alternative or supplement to traditional, statistical data sources is therefore needed under this engagement rule.
4.8Eighth rule of engagement
The eighth rule, the use of big data reduces provider load, is an attractive trait of big data as it can help address provider load issues.
Globally there is an alarmingly decrease in response rate to censuses and surveys. The use of big data instead of direct data collection will definitely reduce, if not eliminate, the provider load. This should be considered as a benefit in the recommended cost-benefit analysis above.
4.9Ninth rule of engagement
The ninth rule, the use of big data produce better statistics, is also an important consideration for using big data, in spite of its volume and velocity. As a minimum, it must produce equally good official statistics as those compiled from traditional data sources. Clearly if big data produces worse statistics than traditional data sources, it would be hard to justify using it.
| Rule of engagement for Earth Observations data | Comment |
|---|---|
| Use big data as a solution to a well-defined statistical need | EO data has many applications in many fields of official statistics. |
| The long term supply of the big data should be certain | Many EO data are provided free of charge, and are provided by government agencies. They come with different resolutions and frequencies. It is important to use the so called “analysis ready” data which are pre-packaged and pre-processed bundles of EO data products for statistical analysis. For a fuller discussion, refer to [37]. |
| Social license issues must be addressed | Care has to be exercised when publishing EO data on their own, or by combining EO data with other data which may provide otherwise not available information on farmers, for example, their produce and farming practices. This information is considered as personal information in privacy legislation. |
| The big data is impartial | EO data are physical or other observations of the globe using remote sensing technologies and are impartial. |
| Security and confidentiality issues have been addressed | Many EO data are open data and available to anyone interested in the data. It is advisable to apply statistical disclosure control techniques to official statistics sourced from EO data, particularly when combined with other data, to ensure that the confidentiality of individual data is not breached. |
| The big data is a cost effective alternative or supplement to traditional, statistical data sources | Whilst EO data are generally available to the NSO free of charge, there is a fairly substantial cost involved in creating representative “training” data sets to train an algorithm for prediction. There is not a lot of published information on the cost benefits of using EO data to supplement or replace traditional data sources. We encourage publication of use cases by NSOs so decision makers can be better informed of their choices. |
| Statistics are amenable to valid statistical inferences | There is a huge literature on the use of EO data for prediction and there is no question on the use of this data together with a well-trained algorithm for valid statistical inference. See [30, 37] for an overview discussion of the available algorithms. |
| The use of big data reduces provider load | This is a distinct advantage of EO data if they are used instead of direct collection by censuses or surveys. |
| The use of big data produces better statistics | With a well-trained algorithm, EO data can provide official statistics, including statistics at small geographical levels, more frequently than traditional sources. |
| The use of big data is a fail safe | A fail safe application would be the use of satellite imagery data as benchmarks to improve the efficiency of survey estimates as exemplified in [19]. |
Provided that the big data is amenable to valid statistical inference as stated in the seventh rule of engagement, big data will generally provide richer and more frequent statistics, not only at the national level, but also for small population groups and small domains. Again, this should be part of the cost-benefit analysis.
Quality frameworks would be useful to assess the quality of official statistics compiled using big data [31, 32].
4.10Tenth rule of engagement
The tenth rule says that there is little risk of using big data if it is a fail safe.
As an example to demonstrate a fail safe, consider the case of a statistics office using its own operational and meta data to predict the best time to visit a household for a Census or survey collection. Even if there is imperfection in the data set or in the prediction model, there will be no impact on the quality of the official statistics provided that a wrong prediction for the best time to call will be followed up by subsequent visits until contact is made.
A more technical fail safe will be to use big data as benchmarks, even with measurement errors, to improve the efficiency of estimates from random samples. An example of this fail safe application in official statistics is given in [19]. In this application, it was shown that the use of big data sources as benchmarks can substantially improve the efficiency of survey estimates of dairy cattle, beef cattle and wheat by many fold.
5.Use cases
In this section, we provide three use cases to illustrate the use of the 10 rules of big data engagement. These cases are transactions data, satellite imagery data and mobile phones data and they are chosen because they are currently most often discussed in the official statistics community.
| Rule of engagement for mobile phone data | Comment |
|---|---|
| Use big data as a solution to a well-defined statistical need | Mobile phone data have applications in many fields of official statistics, many of which e.g. intra-day population movements, are current gaps in official statistics. |
| The long term supply of the big data should be certain | This can be secured through contractual agreements with telecom service providers. |
| Social license issues must be addressed | CDRs which can depict the minute-to-minute whereabouts of the mobile phone user is highly sensitive and can be disclosive. It is prudent to carry out privacy impact assessment and undertake consultation with stakeholders. |
| The big data is impartial | As CDRs are generated and captured by technologies, there should be no concerns about their impartiality. |
| Security and confidentiality issues have been addressed | Security of the CDRs often remain in the premises of the telecom service providers, which would be protected by the security controls used by the service providers. Where this is the case, edge computing is normally used to create the relevant information required by the NSO. Statistical disclosure control methods will need to be applied, as appropriate, to outputs produced using CDRs. |
| The big data is a cost effective alternative or supplement to traditional, statistical data sources | Many the outputs that can be created using CDRs are not currently provided by NSOs. CDRs are very valuable in filling current data gaps in official statistics. |
| Statistics are amenable to valid statistical inferences | The two threshold challenges are barriers for the wide spread use of CDRs in official statistics. |
| The use of big data reduces provider load | Not applicable as CDRs are not generally used to replace or supplement existing data sources supplied by the population or businesses. |
| The use of big data produces better statistics | Yes if the two threshold challenges are adequately addressed. CDRs will fill current NSO data gaps. |
| The use of big data is a fail safe | This may be so if the methods outlined in [30] are used, even if the mobile phone service providers do not all want to share the data with the NSO. |
5.1Transactions data
Research over the past decade by NSOs has identified opportunities for using transactions data, also known as scanner data, in compiling the CPI. Accompanied with this, new methods, known as multilateral index methods, have been developed to compile the CPI using transactions data.
The consensus reached by the international price statistics community is that the multilateral index methods are the most effective way to exploit the full amount information available in the transactions data.
For a fuller discussion of these methods, refer to [33, 34, 35].
5.2Satellite imagery data
Also known as observations (EO) data, satellite imagery data can be used in many fields of official statistics e.g. agricultural statistics in estimating land cover and land use statistics; crop classification and crop yields [11, 37]; land accounts [38], sustainable development indicators [39], just to name a few.
5.3Mobile phone data
Mobile phones are one of the fastest growing technologies in the world with global penetration rates reaching 90%. Call Detailed Records (CDRs), are generated everytime phones are used and recorded by carriers at scale.
CDRs have the potential to generate insights in official statistics. They can be used to compile official tourism statistics, population statistics, migration statistics, commuting statistics, traffic flow statistics and employment statistics on border and seasonal workers [40].
There are, however, two threshold challenges in using CDRs for official statistics.
First, if there are more than one telecom service providers in a country, the NSO will need the cooperation of all providers to obtain CDRs for compiling official statistics, in order to provide insight on the mobile phone population rather than just the mobile phone service provider population, or a methodology to adjust for under-coverage where such cooperation cannot be obtained. Whilst the union of the CDRs across service providers may reflect the mobile phone population, it is not the same as the target population, in that there are over-coverage issues (users who have multiple smart devices) and under-coverage (segment of the population that do not have, or use, mobile phones). Where the interest is to compile official statistics for the population as a whole, another adjustment methodology to deal with these types of coverage issues would be needed. For further discussion of the coverage issues on fields of official statistics, refer to [40].
Second, the assignment of a “home location” for the mobile phone user. A home location is a pre-requisite for any analytical studies involving an origin and a destination. Many current methods attribute the home location to the cell tower, based on the calling and movement pattern of the user. These methods of assignment, however, are problematic. Not only they are not granular enough to show intra-cell tower movement of the population, the assignment criteria cannot be validated for efficacy, due to the lack of training (also called ground truth) data at the mobile phone user level. An empirical study on French CRAs showed the “discordance” rate between different home detection algorithms can be up to 40%, i.e. up to 40% of the home locations are different with different home detection algorithms. For further discussion on these issues, refer to [41].
6.Concluding remarks
In this paper, we have proposed seven non-negot-iable and three essential rules of engagement for NSOs to consider when making decisions on whether or not to adopt a new data source in the production of official statistics.
Applying the ten rules of engagement to three types of big data, we found that there are good cases for using scanner data and satellite imagery data in official statistics production. However, for mobile phone data, we argued that there are two threshold challenges to be addressed before mobile phone data will be widely used for official statistics.
These rules are, in our view, complementary to the seven virtues as outlined in [21]. Contrary to arguably some unrealistic expectations of the power of big data in producing statistics, the ten rules outlined in this paper aim to provide guidance for the official statistician to take a holistic assessment of the appropriateness in using a particular big data source in the production of official statistics.
It is hope that this paper will provide a catalyst for further research and debate on big data issues with an aim to developing a more refined set of rules to help the official statistician to make better decisions in using big data sources for producing official statistics.
Acknowledgments
We like to thank Marcel van Kints for his comments on an earlier version of this paper; Vince Galvin and Steve MacFeeley for discussions on early drafts of the 10 rules. However, the views expressed in this paper remain those of the authors and do not necessarily represent the views of the UN ESCAP nor the University of Wollongong.
References
[1] | UNECE. Using administrative data and secondary sources for official statistics. A Handbook of Principle and Practices. (2011) . |
[2] | Carson C. Fostering the fundamental principles of official statistics. Statistical Journal of the United Nations Economic Commission for Europe. (1998) ; 15: : 213-220. |
[3] | Ashton K. The Internet of Things. RFID Journal. Available at https//scholar.google.com.au/scholar_url?url=http://www.itrco.jp/libraries/RFIDjournal-That%2520Internet%2520of%2520Things%2520Thing.pdf&hl=en&sa=X&scisig=AAGBfm0M7K7404EKTaaAwBLTjpomthgdKA&nossl=1&oi=scholarr. Accessed 26 September 2019, (2009) . |
[4] | Wiki. Internet of Things. Available at https://en.wikipedia.org/wiki/Internet_of_things. Accessed 26 September 2019. |
[5] | Verbal communication from Ric Clarke. |
[6] | Deville P, Linard C, Martin S, Gilbert M, Stevens F, Gaughan A, Blondel V, Tatem A. Dynamic population mapping using mobile phone data. Proceedings of the National Academy of Sciences of the United States of America. (2014) ; 45: : 15888-1893. |
[7] | Rausser G, Strielkowski W. Streimikiene D. Smart meters and household electricity consumption: A case study in Ireland. Energy and Environment. (2017) ; 29: : 132-146. |
[8] | Ivancic L, Diewert W, Fox J. Scanner data, time aggregation and the construction of price indexes. Journal of Econometrics. (2011) ; 161: : 24-35. |
[9] | Husek N. Telematics data for official statistics: An experience with big data. Statistical Journal of the International Association for Official Statistics. (2018) ; 34: : 499-504. |
[10] | Carfagna E, Gallego F. Using remote sensing for agricultural statistics. International Statistical Review. (2006) ; 73: : 389-404. |
[11] | Tam S-M. A statistical framework for analyzing Big Data. The Survey Statistician. (2015) ; 72: : 36-51. |
[12] | Daas P, Puts M. Social media sentiment and consumer confidence. European Central Bank Statistical Paper Series. (2014) ; 5: : 1-29. |
[13] | Daas P, Puts M, Buelens B, van den Hurk P. Big data as a source for official statistics. Journal of Official Statistics. (2015) ; 31: : 249-262. |
[14] | Tam S-M, Clarke F. Big data, official statistics and some initiatives by the Australian Bureau of Statistics. International Statistical Review. (2015) ; 3: : 436-448. |
[15] | Macfeely S. Big data and official statistics. In Big Data Governance and Perspectives in Knowledge Management. IGI Global, (2018) . |
[16] | Couper M. Is the sky falling? Net technology, changing media and the future of surveys. Survey Research Methods. (2013) ; 7: : 145-156. |
[17] | Crawford K. The hidden biases in Big Data. Harvard Business Blog, (2013) . |
[18] | Kim J, Tam S-M. Data integration by combining big data and survey sample data for finite population inference. Submitted, (2019) . |
[19] | Tam S-M, Kim J, Ang L, Pham H. Mining the new oil for official statistics in Big Data Meets Survey Practice: A Collection of Innovative Methods, John Wiley and Sons, Hoboken, (2019) , in press. |
[20] | Tam S-M, Kim J. Data ethnics and selection bias: an official statistician’s perspective. Statistical Journal of the International Association of Official Statistics. (2018) ; 34: : 577-588. |
[21] | De Veaux R, College W. Seven deadly sins of big data. http//www.falltechnicalconference.org/wp-content/uploads/2017_Presentations/2A-1-De-Veaux-Seven-Deadly-Sins.pdf. Accessed 3 September 2019, (2017) . |
[22] | Chen Y, Li P, Wu C. Doubly robust inference with non-probability survey samples. Submitted, (2018) . |
[23] | Kim J, Wang Z, Zhu Z, Cruze N. Combining survey and non-survey big data for improved sub-area prediction using a multi-level model. Journal of Agricultural, Biological, and Environmental Statistics. (2018) ; 23: : 175-189. |
[24] | Yang S, Kim J. Integration of survey data and big observational data for finite population inference using mass imputation. Submitted, (2018) . |
[25] | Fuller W. Sampling Statistics. Hoboken, New Jersey: John Wiley & Sons, Inc, (2009) . |
[26] | Kim JK, Rao JNK. Combining data from two independent surveys: a model-assisted approach. Biometrika. (2012) ; 99: : 85-100. |
[27] | Meng X. Statistical paradises and paradoxes in big data (i): Law of large populations, big data paradox, and 2016 US presidential election. Annals of Applied Statistics. (2018) ; 12: : 685-726. |
[28] | Buelens B, Burger J, van den Brakel J. Comparing inference methods for non-probability samples. International Statistical Review. (2018) ; 86: : 322-343. |
[29] | Schonlau M, van Soest A, Kapteyn A. Selection bias in web surveys and the use of propensity scores. Sociological Methods and Research. (2009) ; 37: : 291-318. |
[30] | Tam S-M, Holmberg A. New data sources for official statistics – a game changer for official statisticians? The Survey Statistician. (2020) ; 81: : 21-35. |
[31] | Australian Bureau of Statistics. ABS data quality framework. 1520.0 – ABS Data Quality Framework, May (2009) . |
[32] | Brackstone G. Managing data quality in a statistical agency. Survey Methodology. (1999) ; 25: : 139-149. |
[33] | Australian Bureau of Statistics. Information paper: Making Greater Use of Transactions Data to compile the Consumer Price Index, Australia. Catalogue Number 6401.0.60.003. ABS, Canberra, (2016) . |
[34] | Australian Bureau of Statistics. Information Paper: An Implementation Plan to maximise the use of transactions data in the CPI. Catalogue Number 6401.0.60.004. ABS, Canberra, (2017) . |
[35] | Ivancic I, Diewert D, Fox K. Scanner data, time aggregation and the construction of price indexes. Journal of Econometrics. (2011) ; 161: : 24-35. |
[36] | Australian Bureau of Statistics. Consumer Price Index, September 2017. Catalogue Number 6401.0. ABS, Canberra, (2017) . |
[37] | Handbook on earth observations for official statistics. Report prepared by the Satellite Imagery and Geo-spatial Statistics Task Team of the United Nations Global Working Group on Big Data. New York. https://unstats.un.org/bigdata/taskteams/satellite/ Accessed 22 October 2019, (2017) . |
[38] | Tam S-M, Holloway J, Dunsmore R, Jakab M, Held A, Kerblat F, Ross J. Forcing close operation between EO scientists and official statisticians. In Part 2 of Satellite earth observations in support of the sustainable development goals. European Space Agency, Paris. http//ceos.org/home-2/eohb-sdgs/: Accessed 22 October 2019, (2018) . |
[39] | Committee on Earth Observation Satellites. In Part 1 of Satellite earth observations in support of the sustainable development goals. European Space Agency, Paris. http//ceos.org/home-2/eohb-sdgs/, Accessed 22 October 2019, (2018) . |
[40] | Handbook on the use of mobile phone data for official statistics. Report prepared by the Mobile Phone Task Team of the United Nations Global Working Group on Big Data. New York, (2017) . |
[41] | Vanhoof M, Reis F, Ploetz T, Smoreda Z. Assessing the quality of home detection from mobile phone data for official statistics. Journal of Official Statistics. (2018) ; 34: : 935-960. |


