
Evaluating economic and social convergences across European countries: Could Macroeconomic Imbalance Procedure indicators shed some light?
Abstract
Financial and economic crises that swept over the European Union in 2008 reshaped divergences across its member states. While the impact on the economic dimension has been thoroughly analysed, the same does not hold for the social dimensions. The assessment of employment and social conditions has assumed a more prominent role with the launch of dashboards for monitoring wellbeing both at national and international level. This debate has been partially mirrored in the Macroeconomic Imbalance Procedure, introduced with the aim of strengthening European Union economic governance, and based on a set of indicators potentially able to monitor both economic and social developments.
Using this set of indicators, we propose a multivariate analysis based on the comparison of 2007 and 2014 data to investigate possible increases in dissimilarities among European Union countries when looking at the same time at economic, employment and social indicators. We argue that the economic and financial crises have reinforced divergence across countries, with the presence of a core and a periphery subset related to Southern countries.
Doing so the novelty of our work is twofold: exploring a new source of data and testing it as a useful tool to investigate economic and social convergence in Europe.
1.Introduction
Financial and Economic crises that swept over the European Union in 2008 reshaped economic and social divergence across European Union countries, reinforcing the debate on how core and peripheral groups of countries in the European Union have evolved during the crises. Starting from the work of [1], the debate focused on the optimal classification of countries looking at the synchronisation degree of their business cycles ([2] for an updating). These analyses were mainly focusing on economic indicators with less attention to social dimensions.
In the last decade, driven by the work of the Stiglitz-Sen-Fitoussi Commission [3], several institutions have developed new systems to measure wellbeing with the aim to provide useful information on climate change, poverty, resource depletion, health and quality of life.
The Quality of life Report [4] gives a comprehensive picture of the measure of wellbeing for European Union countries. At global level, important initiatives worth to mention are the Human Development Index [5], the Happy Planet Index (HPI), and the OECD Better Life Index [6] while at national level the Canadian index of Wellbeing (CIW), the Italian Well-being [7] and the Gross national happiness index in Buthan could be considered.11 According to preliminary results of the project MAKSWELL (MAKing Sustainable development and WELLbeing framework work for policy analysis [8], funded by the European Commission, 19 of the 28 European Union countries22 are currently involved in a wellbeing framework (11 of them use the framework for policy analysis) while 27 European Union countries are involved in the development of indicators to measure progress towards SDGs targets (21 of them use these indicators for policy analysis).
Although all these initiatives share a common framework with similar aims, they are not fully integrated and it is generally difficult to compare and assess information at the different levels, from the local to the global one. As a consequence, the main international formulations, as for example the Human Development Index HDI [5], are based on a small set of indicators [9] even when the aim is to investigate the relationship between economic growth and subjective well-being [10, 11] or between economic growth, inequality and poverty [12].
In this context, the development of dashboards or scoreboards, as for SDGs, could represent a valid alternative. A scoreboard is a set of statistical indicators, possibly coupled with policy targets and/or thresholds aiming to give information on several aspects of a phenomenon without any synthesis. This approach has been adopted at European level for monitoring some European Union policies. For European Union countries a typical example of scoreboard is the Macro-economic Imbalance Procedure one [13], which is used in the context of the economic governance of countries at European level. The 2014 version of the MIP scoreboard included a set of eleven headline indicators, complemented by a set of auxiliary ones, intended to screen internal and external macroeconomic im-balances. In 2015, a subset of employment indicators were integrated in the scoreboard of the MIP for considering employment and social developments. The aim was to allow for a better understanding of the social consequences of imbalances, including during the correction of imbalances, and to help fine-tune the policy recommendations that fall under the scope of the MIP. The inclusion of these variables into the scoreboard shall not have legal implications nor change the focus of the MIP, which remains aimed at preventing the emergence of harmful macroeconomic imbalances and ensuring their correction.
The actual set of MIP indicators can then be considered as a comprehensive set of indicators related both to economic growth and to at least two important wellbeing dimensions, namely economic well-being and social welfare. Moreover the MIP ensures that the selected indicators are standardised across European Union countries, based on European Union legislation and with a well-established quality assurance framework. In spite of these important properties, MIP indicators have not yet been extensively analysed as a source for multivariate investigation on the relationship between economic growth and wellbeing.
The aim of this paper is to contribute to fill this gap by providing a multivariate analysis looking at the effects of the 2008 financial and economic crises on European Union countries, covering at the same time the evolution of macroeconomic aggregates and two important domains of wellbeing, namely economic wellbeing and social welfare. In particular, we would like to investigate if the consequences of the crises hit with the same intensity economic and social indicators, increasing or not divergence across countries.
Table 1
MIP scoreboard indicators (AMR 2018)
| Indicator | Unit | Code |
|---|---|---|
| Current account balance (% of GDP) | 3 year average | CA_3y_avg |
| Net international investment position | % of GDP | NIIP |
| Real effective exchange rate (42 trading partners, HICP defl.) | 3 years % change | REER_3y |
| Export market share (% of world exports) | 5 years % change | EMS_5y |
| Nominal unit labour cost index (2010 | 3 years % change | NULC_3y |
| House price index (2010 | 1 year % change | HPI_d_1y |
| Private sector credit flow, consolidated | % of GDP | PSCF |
| Private sector debt, consolidated | % of GDP | PSD |
| General government gross debt | % of GDP | GGD |
| Unemployment rate | 3 year average | UN_3y |
| Total financial sector liabilities, non-consolidated | 1 year % change | TFSL_NC |
| Activity rate (% of total population aged 15–64) | 3 years change in p.p. | AR_3y |
| Long-term unemployment rate (% of active pop. aged 15–74) | 3 years change in p.p. | LTUR_3y |
| Youth unemployment rate (% of active pop. aged 15–24) | 3 years change in p.p. | YUR_3y |
The analysis is developed using two cross-sections of MIP indicators: one referred to 2007, before the start of the financial and economic crises, and the other to 2014 when almost all European Union countries started to recover. For each year we provide a cluster analysis producing countries’ partitions [14, 15, 1] both for the core indicators, related to the traditional macroeconomic aggregates, and for the auxiliary variables related to economic wellbeing and social welfare. Cluster assessment has been performed through the silhouette plot ([16, 17] for an application) and results have been reinforced by means of a principal component analysis.
To our knowledge the contemporaneous analysis of economic and social dimensions by means of a simultaneous multivariate approach has not been yet fully investigated in the literature, with few exceptions [18, 20]. As a main result of our analysis we support the idea that divergence among European Union countries increased during the financial and economic crises.
This paper is organized as follows: Section 2 illu-strates the characteristics of the MIP indicators while in Section 3 we present an outline of the multivariate analysis that we have adopted as methodology. Section 4 presents the results of the application for 2007 and 2014, while Section 5 concludes.
2.Indicators: The Macroeconomic Imbalance Procedure
Looking at the literature analysing economic synchronisation, data are mainly related to filtered real output measures such as GDP (see for example [21]), trade and capital movements [22], business cycle measures and inflation [1]. Concerning the social dimension and, more generally, wellbeing, the comparison of the results across countries appears mainly based on specific frameworks, such as the sets of indicators used in the How’s life report of the OECD [23] or in the Quality of Life presented by Eurostat [4].
The analysis of the economic and social situation across European Union countries can then be consi-dered as rather dual, while the Macroeconomic Imba-lance Procedure indicators could represent, in our opinion, a unique source of data for a joint analysis.
The Macroeconomic Imbalance Procedure (MIP), which is part of the so called European semester, is a surveillance framework that has been introduced in Europe, after the economic crisis in 2008, with the objective to detect, prevent, and correct problematic economic trends, in the form of internal and external imbalances, falling competitiveness, real estate bubbles or economic crises [24]. The MIP covers a number of sequential steps, having the Alert Mechanism Report (AMR) and its Statistical Annex (SA) as a starting point, with the AMR being an initial screening device providing an economic reading of the MIP Scoreboard. The MIP scoreboard refers to a set of fourteen headline indicators intended to screen internal and external macroeconomic imbalances, covering a time span of ten years for the European Union Member States.
The MIP indicators cover external imbalances, competitiveness positions, internal imbalances and employment. They are elaborated using different statistical areas, including national accounts, balance of payments statistics, price statistics, the general government debt and labour market statistics (see Table 1). The MIP scoreboard indicators are coupled with indicative thresholds sometimes varying between euro area and non euro area countries.
Supplementing the MIP scoreboard indicators, a list of 28 auxiliary indicators provides additional information on aspects linked to the general macroeconomic situation, nominal and real convergence inside and outside the European Union and the euro area, detailed data on external liabilities, including foreign direct investment and net external debt, and social statistics (see Table 2).
Table 2
MIP auxiliary indicators (AMR 2018)
| Indicator | Unit | Code |
|---|---|---|
| Real GDP | 1 year % change | RGDP_1y |
| Gross fixed capital formation | % of GDP | GFCF |
| Gross domestic expenditure on R&D | % of GDP | GERD |
| Current plus capital account (Net lending-borrowing) | % of GDP | CKA |
| Net external debt | % of GDP | NED |
| Foreign direct investment in the economy – net inward flows | % of GDP | FDI_flow |
| Foreign direct investment in the economy – stocks | % of GDP | FDI_stk |
| Net trade balance of energy products | % of GDP | NBTEP |
| Real effective exchange rates – euro area trading partners | 3 years % change | REER_EA_3y |
| Export performance against advanced economies | 5 years % change | EMS_OECD |
| Terms of trade | 5 years % change | ToT_5y |
| Export market share – in volume | 1 year % change | EMS_1y |
| Labour productivity | 1 year % change | LP_1y |
| Nominal unit labour cost index (2010 | 10 years % change | NULC_10y |
| Unit labour cost performance relative to euro area | 10 years % change | ULC_EA_10y |
| House price index (2010 | 3 years % change | HPI_3y |
| Residential construction | % of GDP | RC |
| Private sector debt, non-consolidated | % of GDP | PSD_NCO |
| Financial sector leverage, non-consolidated | % debt to equity | FSL |
| Employment growth rate | 1 year % change | EMP_1y |
| Activity rate | % of total pop. 15–64 | AR |
| Long term unemployment rate | % of active pop. 15–74 | LTUR |
| Youth unemployment rate | % of active pop. aged 15–24 | YUR |
| Young people neither in employment nor in educ. and training | % of total pop. 15–24 | YPEET |
| People at risk of poverty or social exclusion | % of total pop. | PAPSE |
| People at risk of poverty after social transfers | % of total pop. | APR |
| Severely materially deprived people | % of total pop. | SMD |
| People living in households with very low work intensity | % of total pop. 0–59 | PLHVLWI |
The strengthening of the social dimension in the framework of the European Semester surveillance for European Union countries and in particular in the MIP procedure has been implemented in two phases. In 2013 a set of eight social indicators related to the activity rate, long-term unemployment, youth unemployment and poverty were added to the set of auxiliary indicators. The aim was to allow for a better understanding of the social dimension of risks implied by imbalances during economic adjustments and enhance the assessment of their social consequences.
In 2015, a second step has been the inclusion in the scoreboard indicators of three of the (before auxiliary) social indicators related to the labour market. As stated in [24], surveillance under MIP aims at fostering adjustment while addressing its social implications.33
The relationship between the MIP auxiliary indicators and wellbeing could be assessed using the preliminary results of the MAKSWELL project [8] that introduces a comparison of frameworks and variables used in national wellbeing schemes across European Union countries. Most European Union countries share a domain for economic wellbeing represented, among others, by the following indicators: People at risk of poverty, People living in absolute poverty, Severely materially deprived people, People living in households with very low work intensity. Focusing on the domain of labour and education, available information includes indicators on Employment rate, Unemployment, Youth unemployment rate, Young people neither in employment nor in education and training, and Long-term unemployment rate. All in all the MIP auxiliary indicators represent a sample of the common wellbeing indicators in the domains of economy, labour and education that could be explored together with the economic indicators required by the framework.
3.Methods: Multivariate analysis and silhouette
The main goal of this work is to evaluate economic and social convergence across European Union countries during the economic crisis using MIP indicators. In details we present a comparison across two cross-sections of data referring to 2007 and 2014.44
Looking at the two years we are interested in changes in the relationship across countries and, in particular, to assess if the situation evolved in the same direction for the economic and social dimensions. To address these points we started by using cluster analysis, a technique based on grouping countries according to MIP indicators, to understand if and how clusters have evolved in the two years.
Cluster analysis (see for example [14, 15]) is a multivariate method which aims to classify a sample of heterogeneous statistical units, in our case European Union countries, on the basis of a set of measured variables, the MIP indicators, in a limited number of meaningful groups, each of which is internally homogeneous in terms of some form of similarity among its members. In order to perform cluster analysis, we need to define measures of distance, or similarity, among objects.
Many clustering methods have been developed and a large literature is available. According to [25], clustering methods can be classified into hierarchical and partitioning methods: hierarchical methods construct the clusters by recursively partitioning the units in either a top-down or bottom-up fashion; partitioning methods relocate units by moving them from one cluster to ano-ther, starting from an initial partitioning. Methods of the second kind require a pre-set number of clusters. To achieve global optimality in partitioned-based clustering, a relocation method iteratively relocates points among the already specified clusters. The homogeneity within the groups is maximized when the average distance of the reference object to all the other observations of the same cluster is minimized.
In this paper the cluster analysis is performed by the k-median algorithm. For this purpose, the program PAM (Partitioning Around Medoids [16]) within the package cluster of R software has been used. This algorithm is very similar to the well-known k-means algorithm, from which it differs mainly in clusters’ re-presentation. Each cluster is represented by the most centric object in the cluster, rather than by the implicit mean that may not belong to the cluster.
The quality of the cluster final solution can be evaluated through useful diagnostic tools like the silhouette plot [16]. The silhouette width associated to each country is a measure of both homogeneity within the cluster and separation from the other clusters. The lower the average distance to the other countries in the same group is, and the higher the average distance to all the countries in the nearest group, the better the classification of a single country is. In this case, the silhouette width takes a value close to 1. On the contrary, a value close to
In order to empower our analysis, and although cluster analysis has been used as unique methodology in another study on economic convergence [1], we complement results from the cluster analysis by a principal component analysis (PCA). PCA reorders the original multivariate data creating new variables, called principal components, that correspond to a linear combination of the original ones. The number of principal components is less than, or equal to, the number of original variables. Each principal component is estimated in a way to maximize the explained variance. A small number of principal components explains a large amount of the total variance of the original data. Variables and countries are then represented in the principal components framework improving the ability to interpret their similarity/dissimilarity.
The PCA representation complements the one provided by the cluster analysis and silhouette allowing for the interpretation of the movements of the indicators across time.
4.Results and discussion
Applying cluster analysis and the silhouette approach to MIP indicators,55 we investigate clusters’ evolution looking first at the set of scoreboard MIP indicators, referring mainly to classical macroeconomic aggregates, then to the set of MIP auxiliary indicators and, as a separate framework, looking at indicators related to the social dimension. This last subset of indicators, as we have illustrated in Section 2, could be considered as a proxy of wellbeing. To present the results we consider a fixed number of 5 clusters in each domain. This solution is not always the best for each domain but we checked the robustness of the results for different numbers of clusters (from 3 to 7) across the 2 years.
Moreover, to complement the cluster analysis and the silhouette approach, we performed also a principal component analysis. Comparing the results of the two methods into this comprehensive framework enabled a better interpretation of the movements of the countries and the indicators across the two selected years.
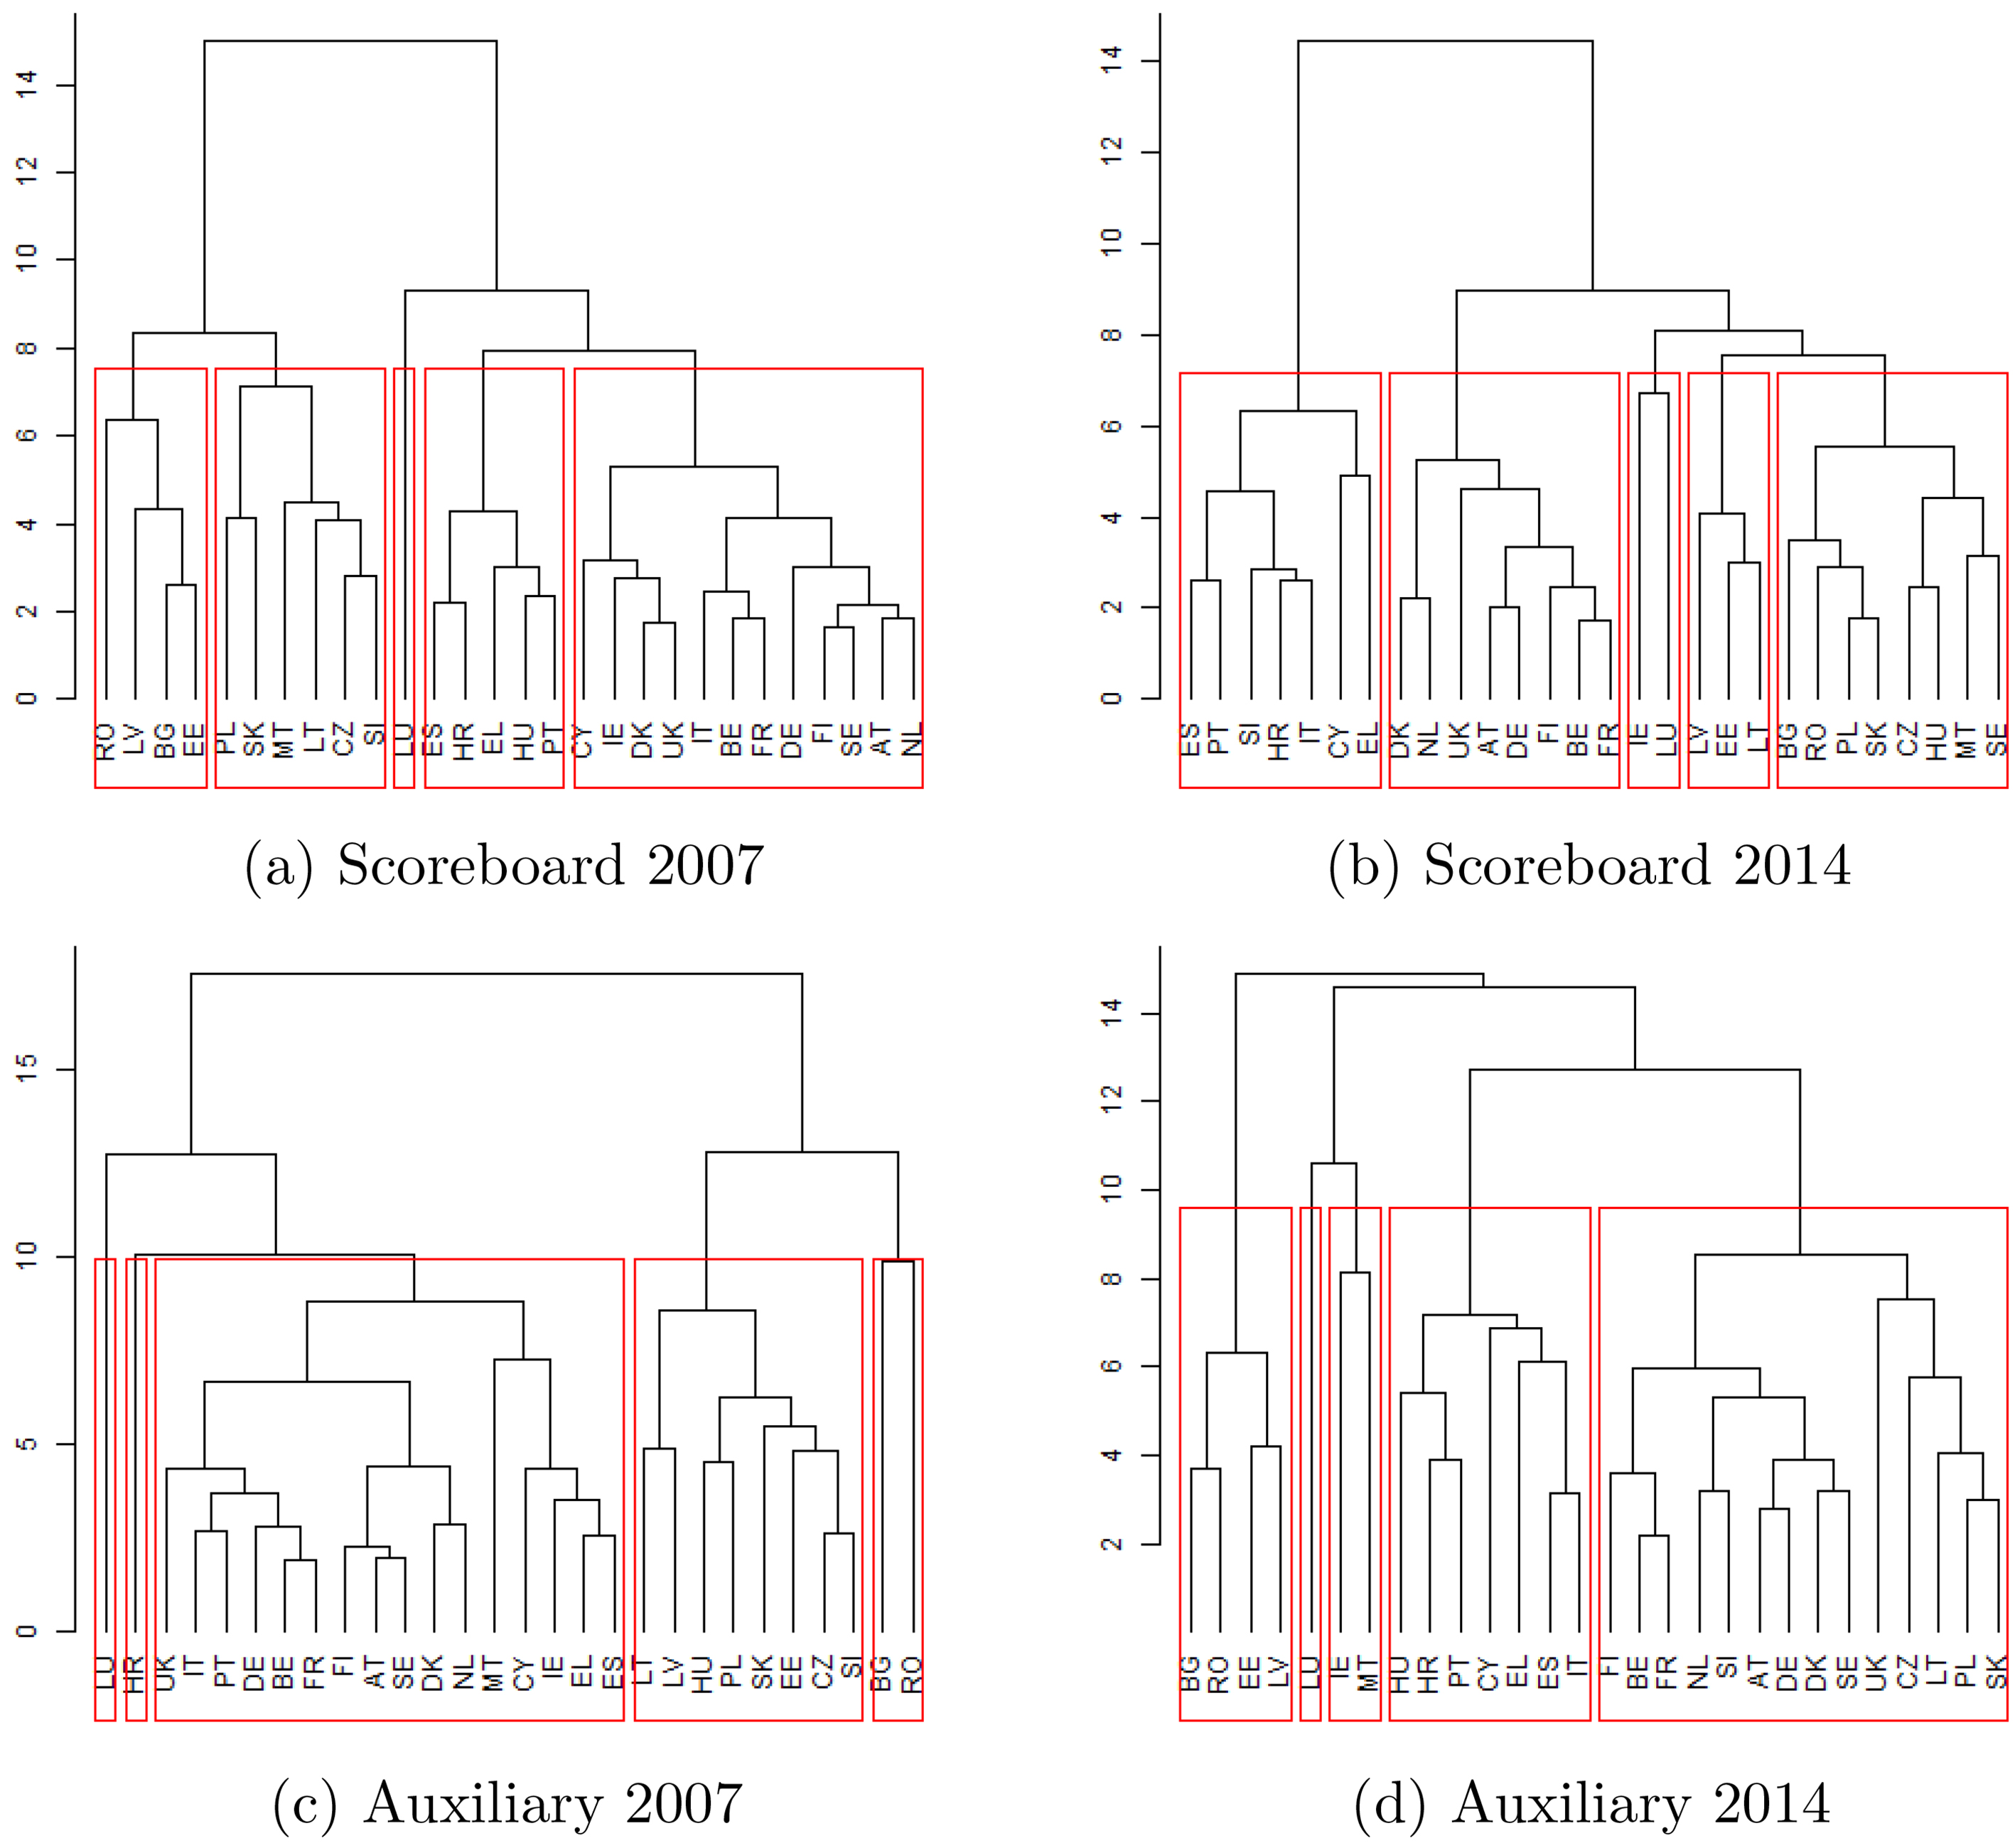
Figure 1.
Cluster analysis on scoreboard and auxiliary indicators 2007, 2014.
4.1Scoreboard and auxiliary indicators
Results show that improvements (deteriorations) are not evolving along the same lines for scoreboard and auxiliary indicators. When we look at scoreboard indicators, we can see that while in 2007 a big cluster consisting of twelve countries including Italy, France, Germany, United Kingdom and others (Fig. 1a) is observed, in 2014 countries are more spread out in clusters consisting of four to eight countries (Fig. 1b).66 For example in 2014 Cyprus and Italy changed cluster, moving in the one together with Spain, Portugal and Greece.77 Ireland changed cluster too, reinforcing the idea that movements in the clusters could be related to the intensity of the financial crisis. In line with the literature on core and peripheral countries, we can argue that the crisis has reinforced the economic polarisation between core countries and a southern periphery [1] with a third important cluster referring to the Eastern countries.
Table 3
Legend for EU countries abbreviations
| Abbreviation | Country |
|---|---|
| BE | Belgium |
| BG | Bulgaria |
| CZ | Czechia |
| DK | Denmark |
| DE | Germany |
| EE | Estonia |
| IE | Ireland |
| EL | Greece |
| ES | Spain |
| FR | France |
| HR | Croatia |
| IT | Italy |
| CY | Cyprus |
| LV | Latvia |
| LT | Lithuania |
| LU | Luxembourg |
| HU | Hungary |
| MT | Malta |
| NL | Netherlands |
| AT | Austria |
| PL | Poland |
| PT | Portugal |
| RO | Romania |
| SI | Slovenia |
| SK | Slovakia |
| FI | Finland |
| SE | Sweden |
| UK | United Kingdom |
Looking at the set of auxiliary indicators, which contains also indicators related to the social dimension, the presence of a predominant cluster is even more visible, with a cluster containing sixteen countries in 2007 (Fig. 1c). In 2014, we still observe a large cluster of fourteen countries but again Italy, Spain, Portugal, Cyprus and Greece moved away from the big cluster to a smaller one together with Croatia (Fig. 1d).
In almost all combinations of indicators, with the exception of the set of social indicators, we can see that Luxembourg stands in a cluster alone; this can be related to the particular characteristics of its economy: a very open economy with a very large export sector, mainly composed by services.
The quality of the cluster can be evaluated through useful diagnostic tools like the silhouette plot [16]. The silhouette width associated to each country is a measure of both homogeneity within the cluster and separation from the other clusters. The degree of dissimilarities has worsened both inside the 5 clusters and on average passing from 0.2 (2007) to 0.14 (2014, Fig. 2).
Figure 2.
Silhouette for scoreboard 2007, 2014.
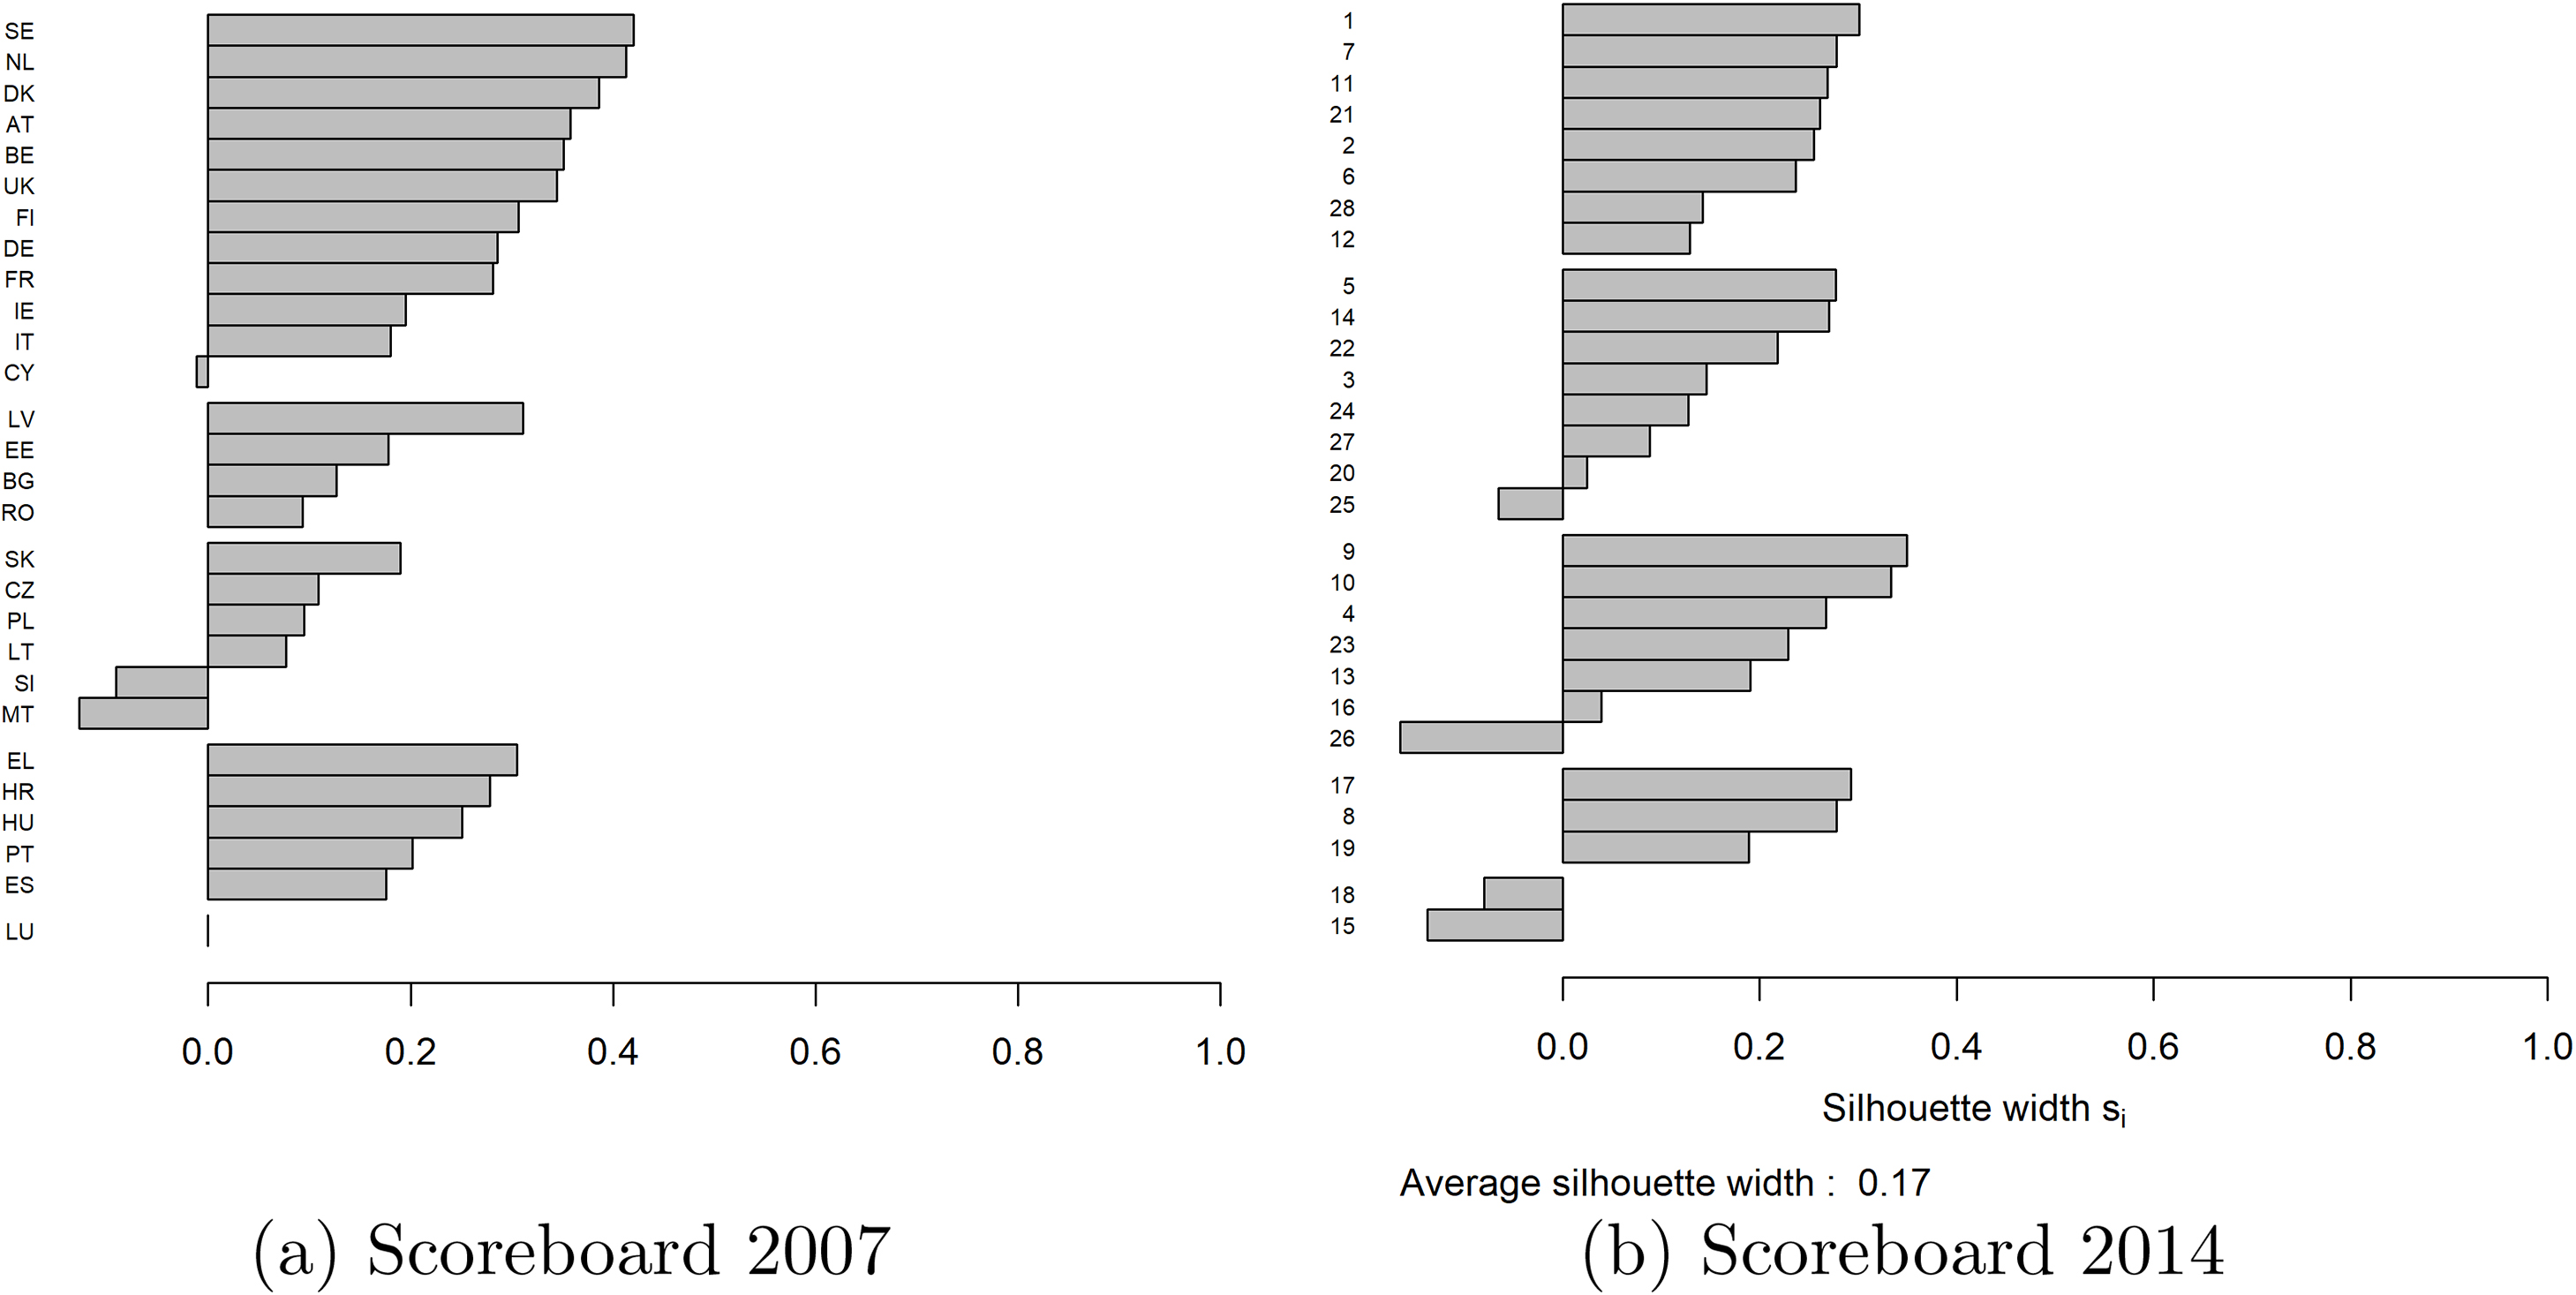
Overall, both cluster analysis and silhouette representation show an increase in the divergence between the countries and an increase in the degree of heterogeneity. In 2014 we find that Portugal, Spain and Greece are often in the same cluster, showing some similarities in the impact of the crises, often with Cyprus. The situation looked differently in 2007 when there was a higher degree of homogeneity among countries toward a better mean position.
4.2Auxiliary indicators and social/wellbeing indicators
When looking at the imbalances present in a country, we can focus our attention on those that stem either from all the auxiliary indicators or from the restricted set of social/wellbeing indicators. More in general, the divergence and the relative position of European Union countries across 2007 and 2014 seem to be higher, especially for social/wellbeing indicators.
We focused our attention on MIP indicators giving an overview of the social condition of households together with the indicators about the labour market. The selected indicators are: Unemployment Rate, Activity Rate, Long-term Unemployment Rate, Young Unemployment Rate, Young people neither in employment nor in education and training, People at risk of poverty or social exclusion, People at risk of poverty after social transfers, Severely materially deprived people, and People living in households with very low work intensity; we will call this set the social/wellbeing indicators, or social indicators in short.
Figure 3.
Silhouette for auxiliary 2007, 2014.
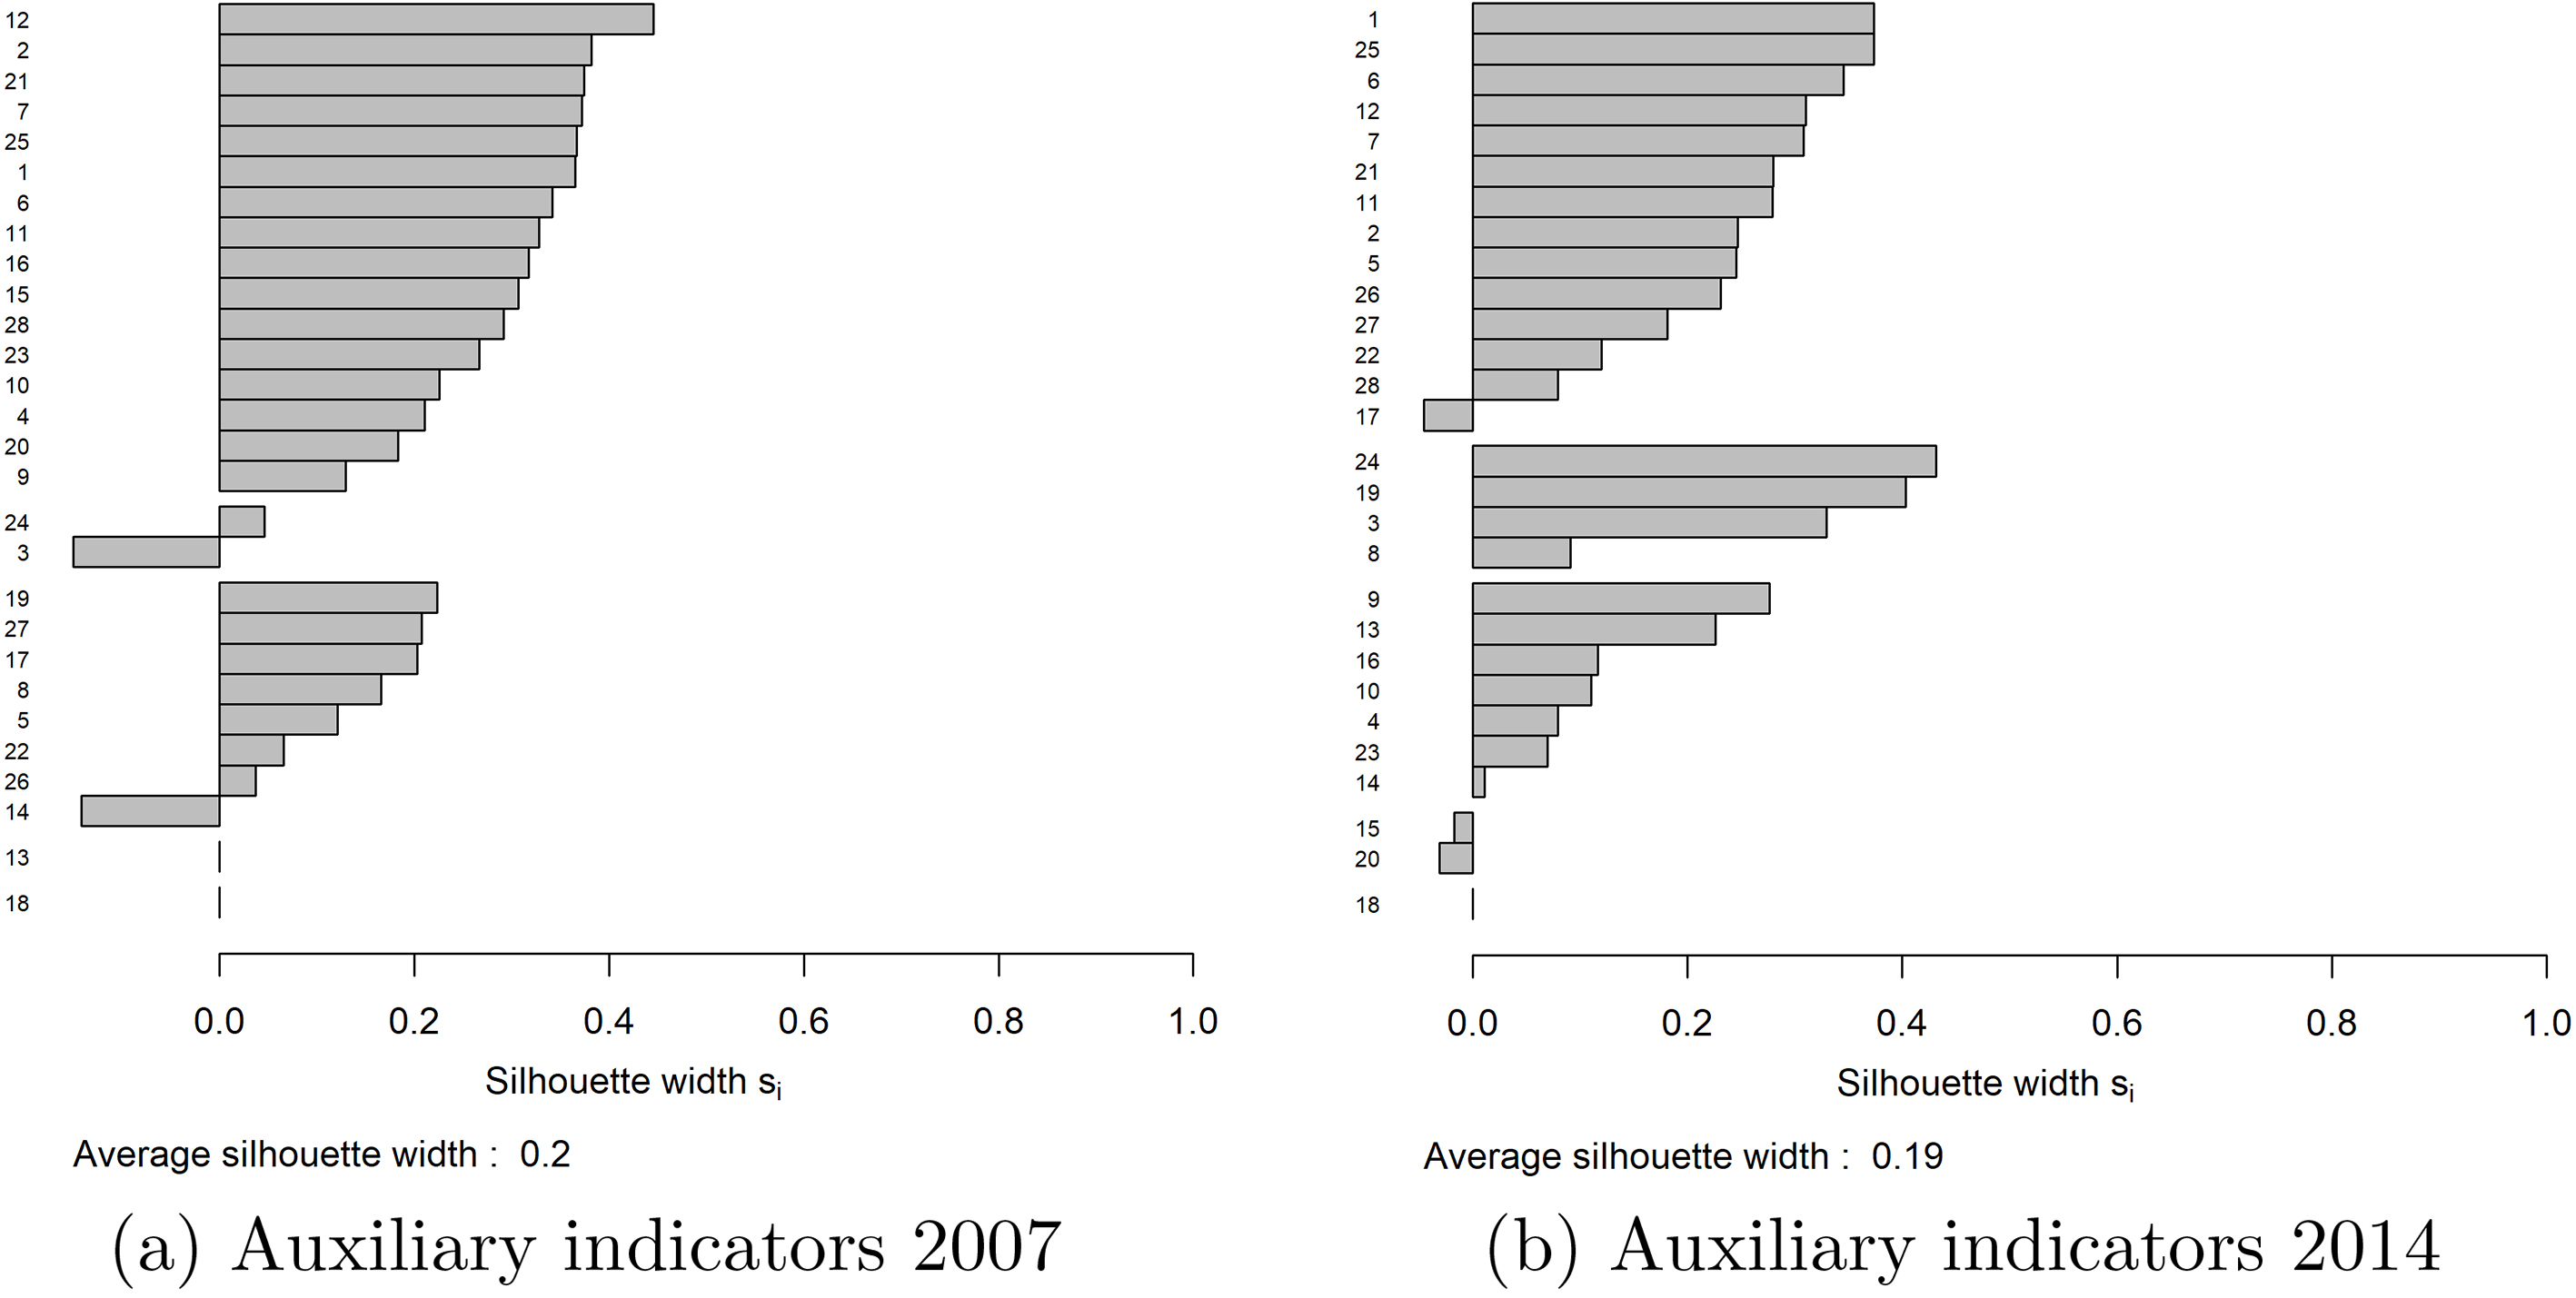
Figure 4.
Cluster analysis for social indicators 2007, 2014
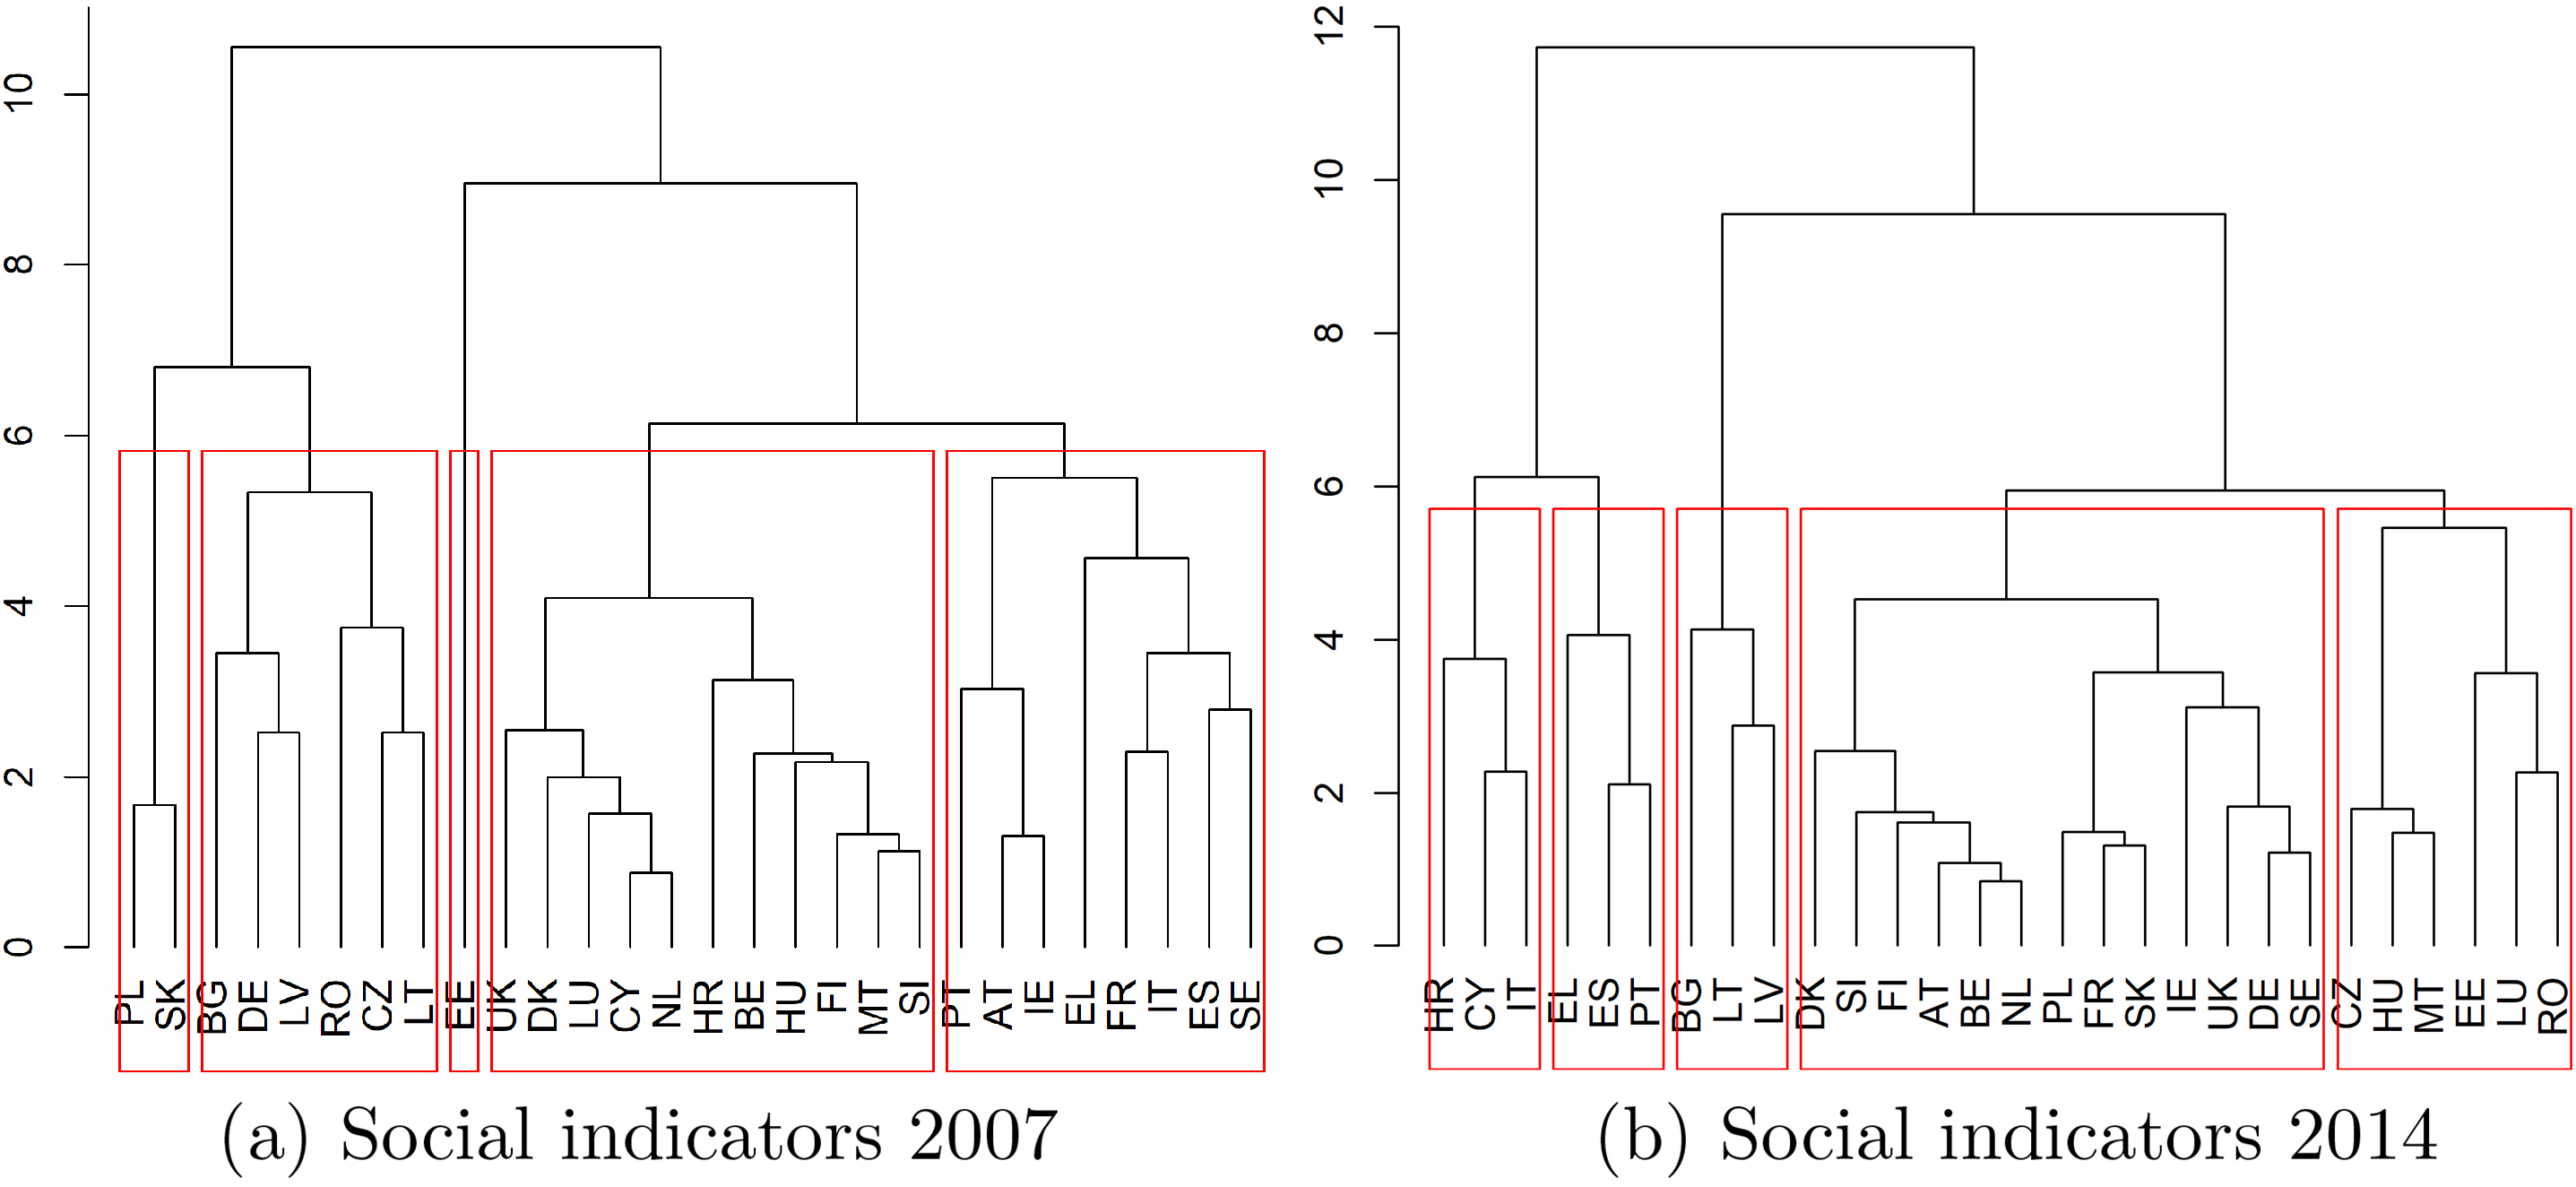
Considering the social/wellbeing indicators, the movements across countries between 2007 and 2014 have been rather important. Some countries seem to have improved their position (Poland and Slovakia for example), while others show a different evolution (Italy, Portugal, Spain). Germany moves in another cluster together with the main Northern countries. This result is mainly related to the improvements in the labour market (Fig. 5). Even for social indicators, the crisis has reinforced the divergence between a set of core countries, mainly northern ones and some better performing Eastern ones, and a peripheral set of Southern countries.
Finally, the analysis of the set of all available indicators confirms a deterioration of the degree of dissimilarities among countries, which is higher for the external indicators. The evidence shows that the increasing heterogeneity is associated with worse effects for the Southern countries (Table 4).
Figure 5.
Silhouette for social indicators 2007, 2014.
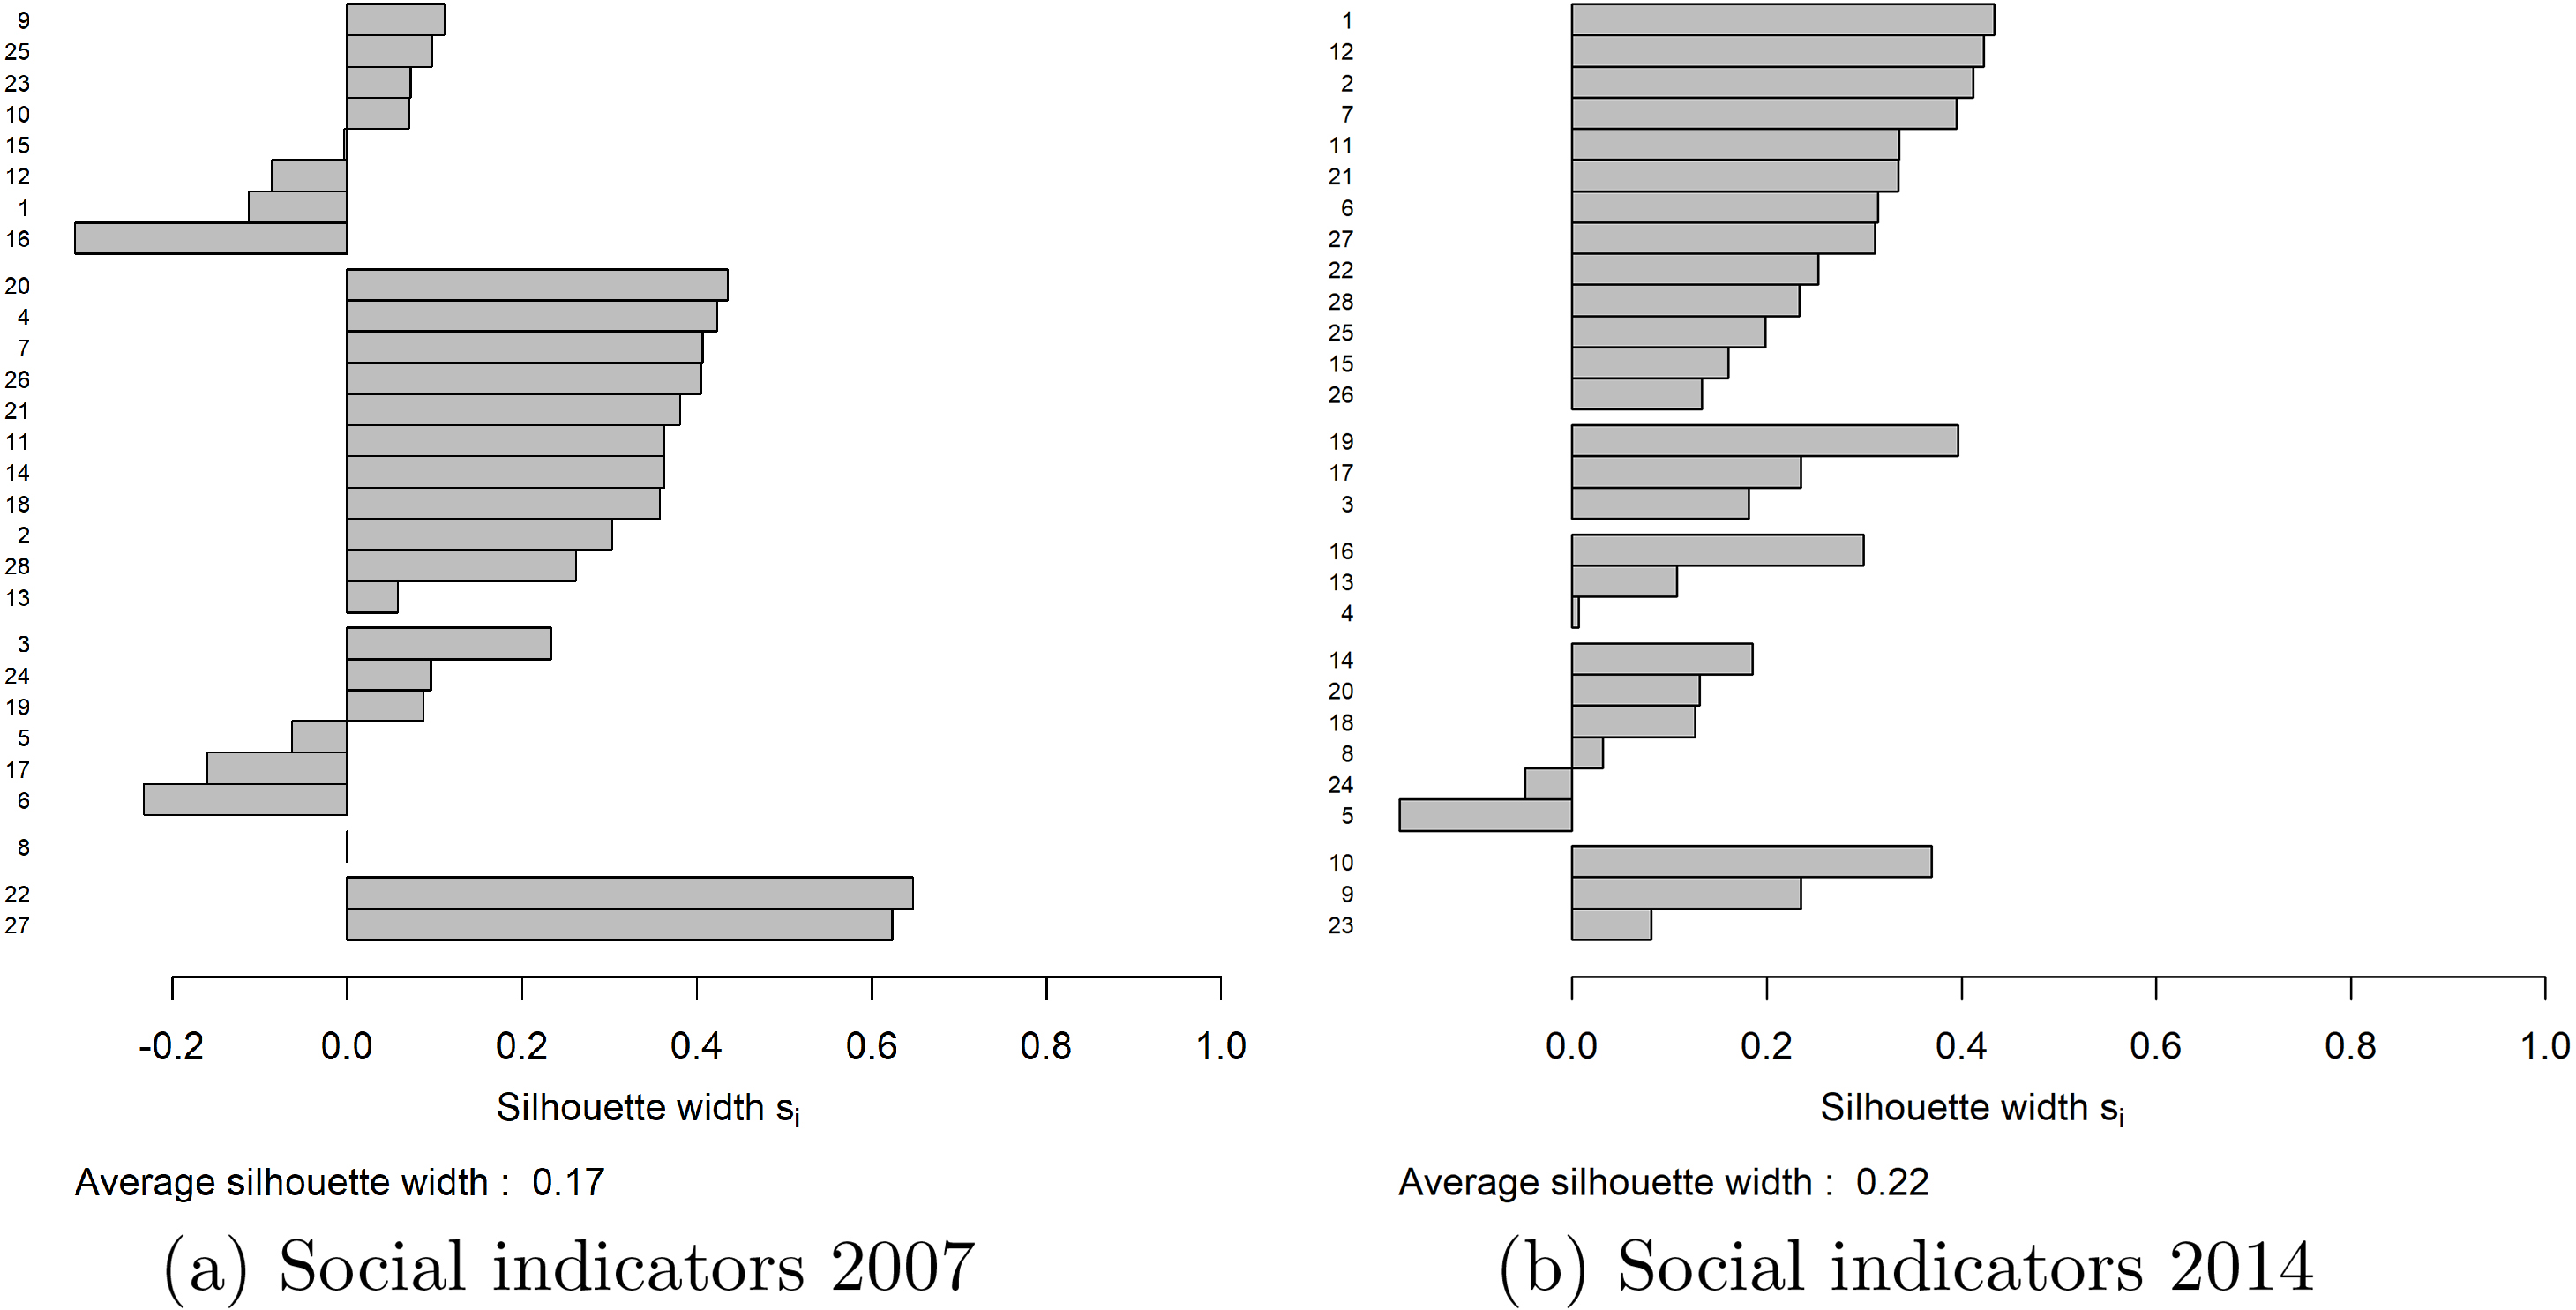
Figure 6.
Biplot of countries and variables on the two principal components. Core indicators 2007, 2014.
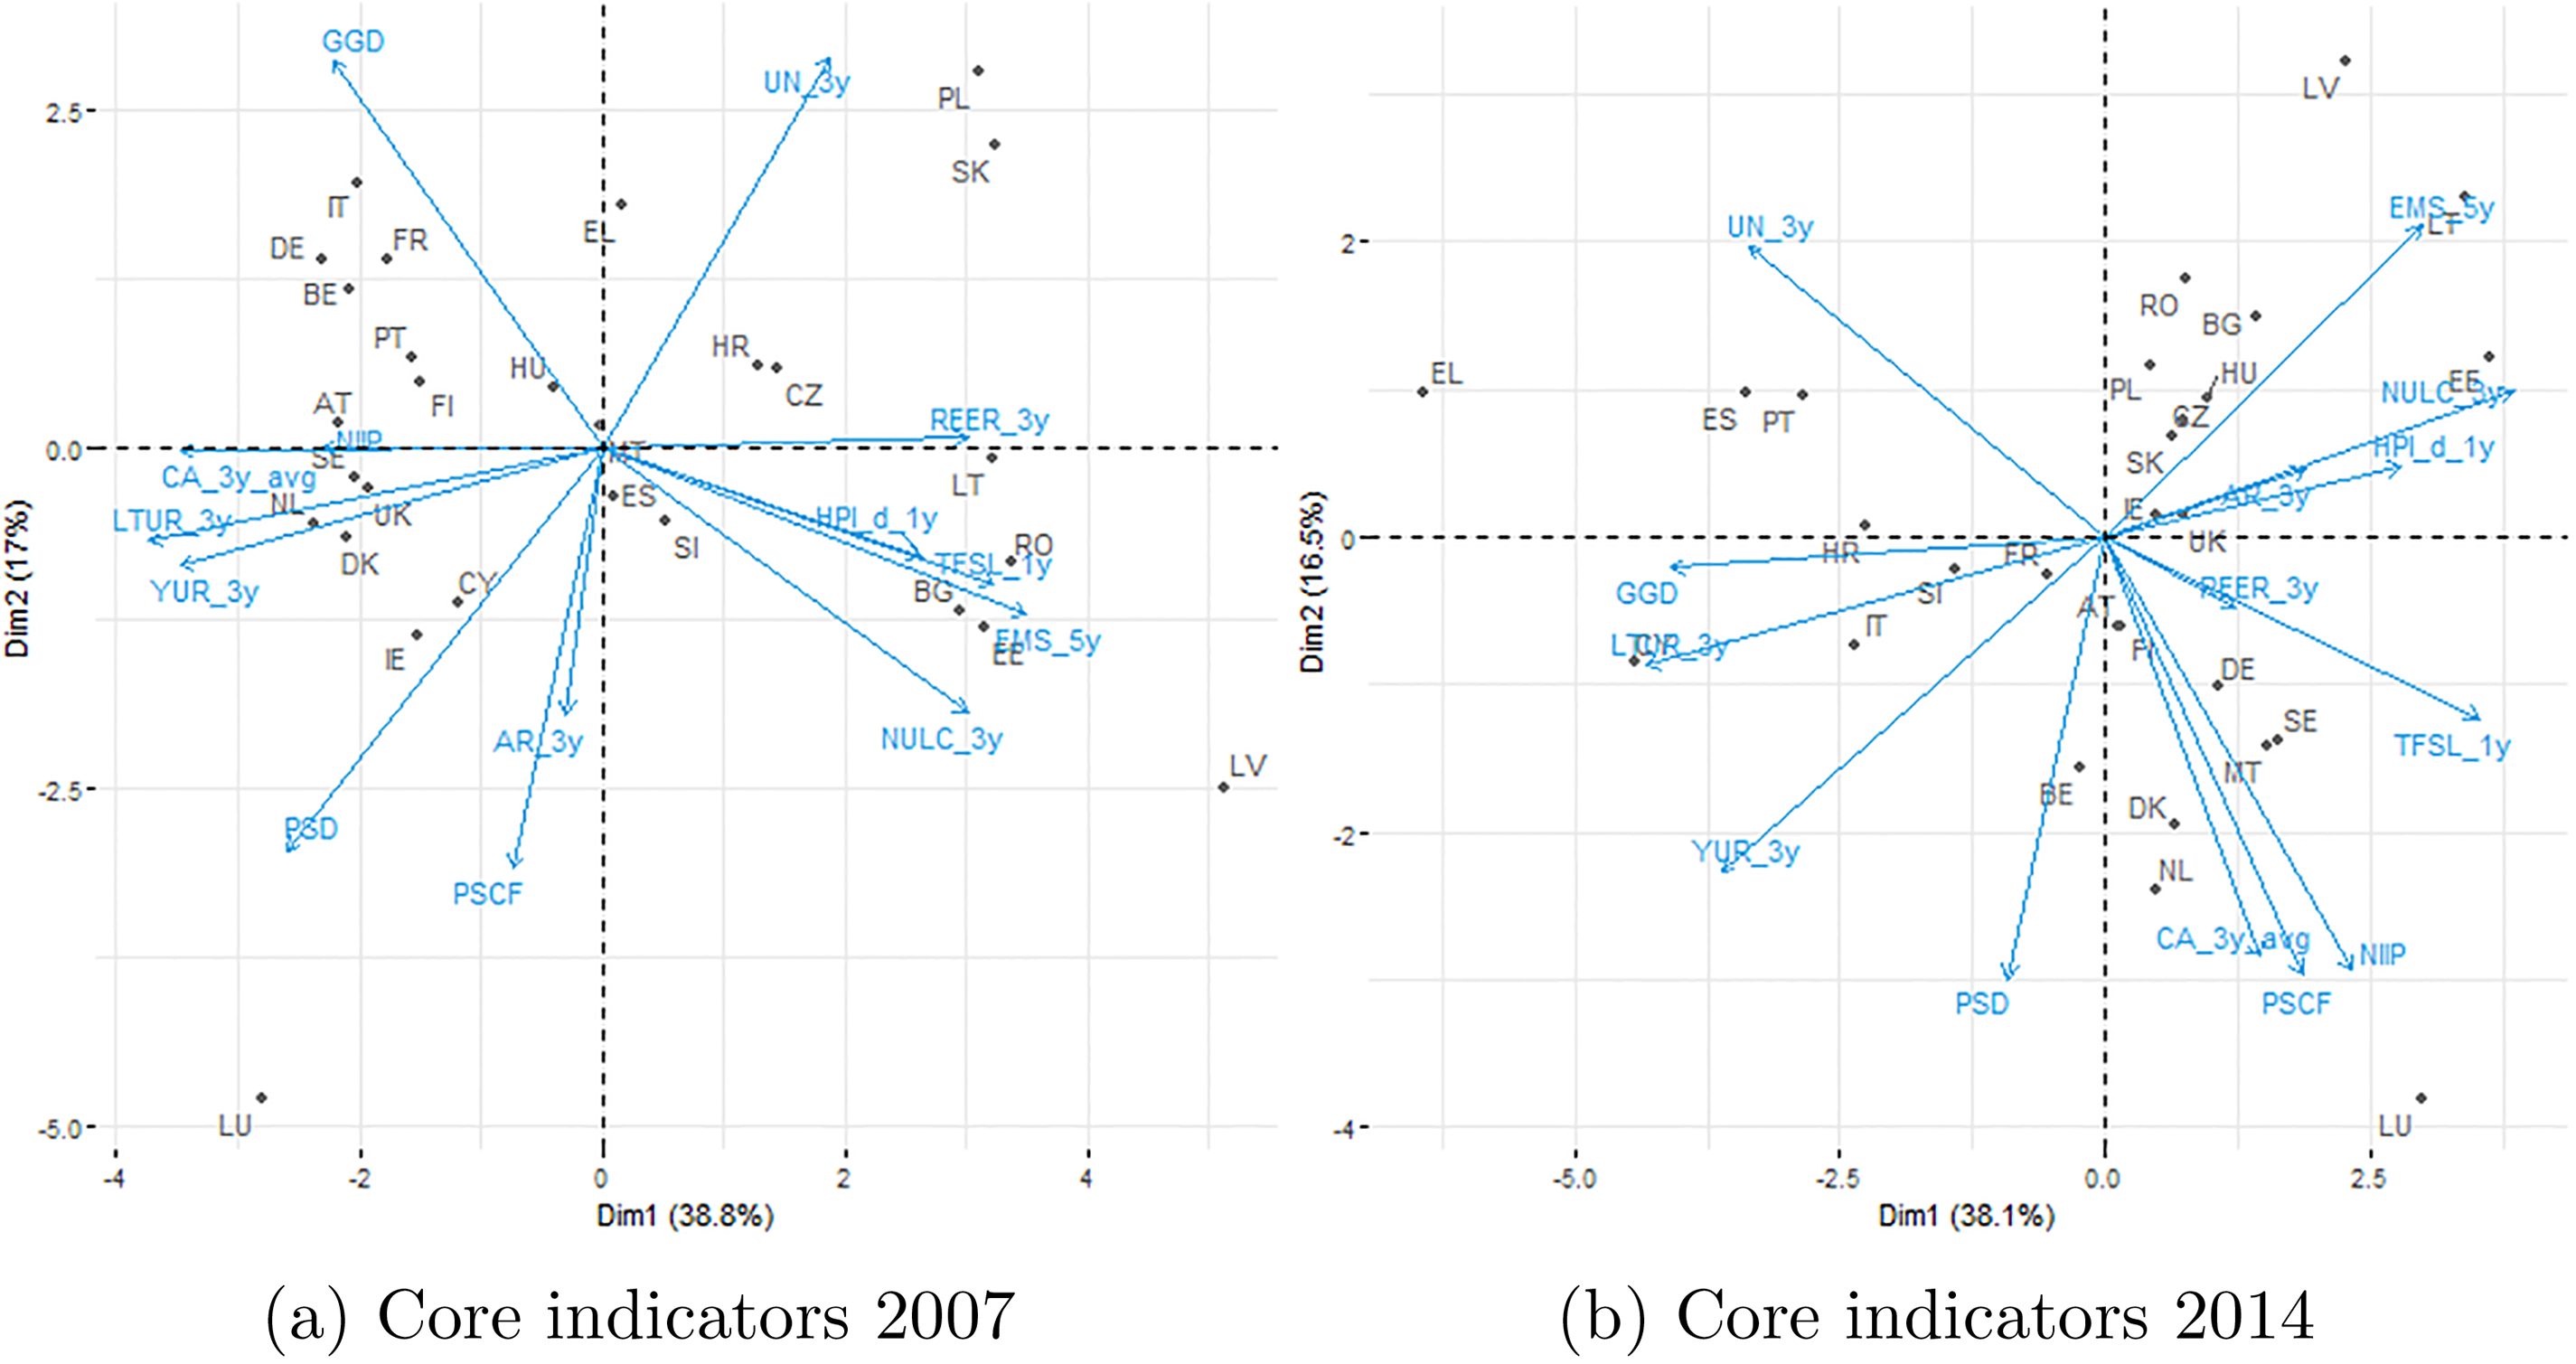
Table 4
Average silhouette width for MIP. Years 2007 - 2014
| 2007 | 2014 | |
|---|---|---|
| Scoreboard | 0.169 | 0.165 |
| Internal | 0.231 | 0.167 |
| External | 0.333 | 0.181 |
| Auxiliary | 0.198 | 0.177 |
| Social | 0.198 | 0.154 |
This comparison has been repeated for different numbers of clusters from 3 to 7. In all cases, the aver-age in 2014 is lower than in 2007 implying a higher value of dissimilarities.
4.3Results from the Principal component analysis: deterioration in social indicators
We performed PCA separately for core indicators and auxiliary ones, both for 2007 and 2014 data. We used a biplot to highlight the extent to which the countries differ in terms of indicators in the two years. Concerning the core indicators, the allocation of the countries in 2007 (Fig. 6a) for the first axis, that accounts for 38.8% of the total variance, is mainly driven either by indicators linked to competitiveness, real effective exchange rate (REER), export market share (EMS_5y), nominal unit labor cost index (NULC_3y) or by the financial situation, financial sector leverage (FSL). Good performance of these indicators in term of rates of change characterized mainly the Eastern countries.
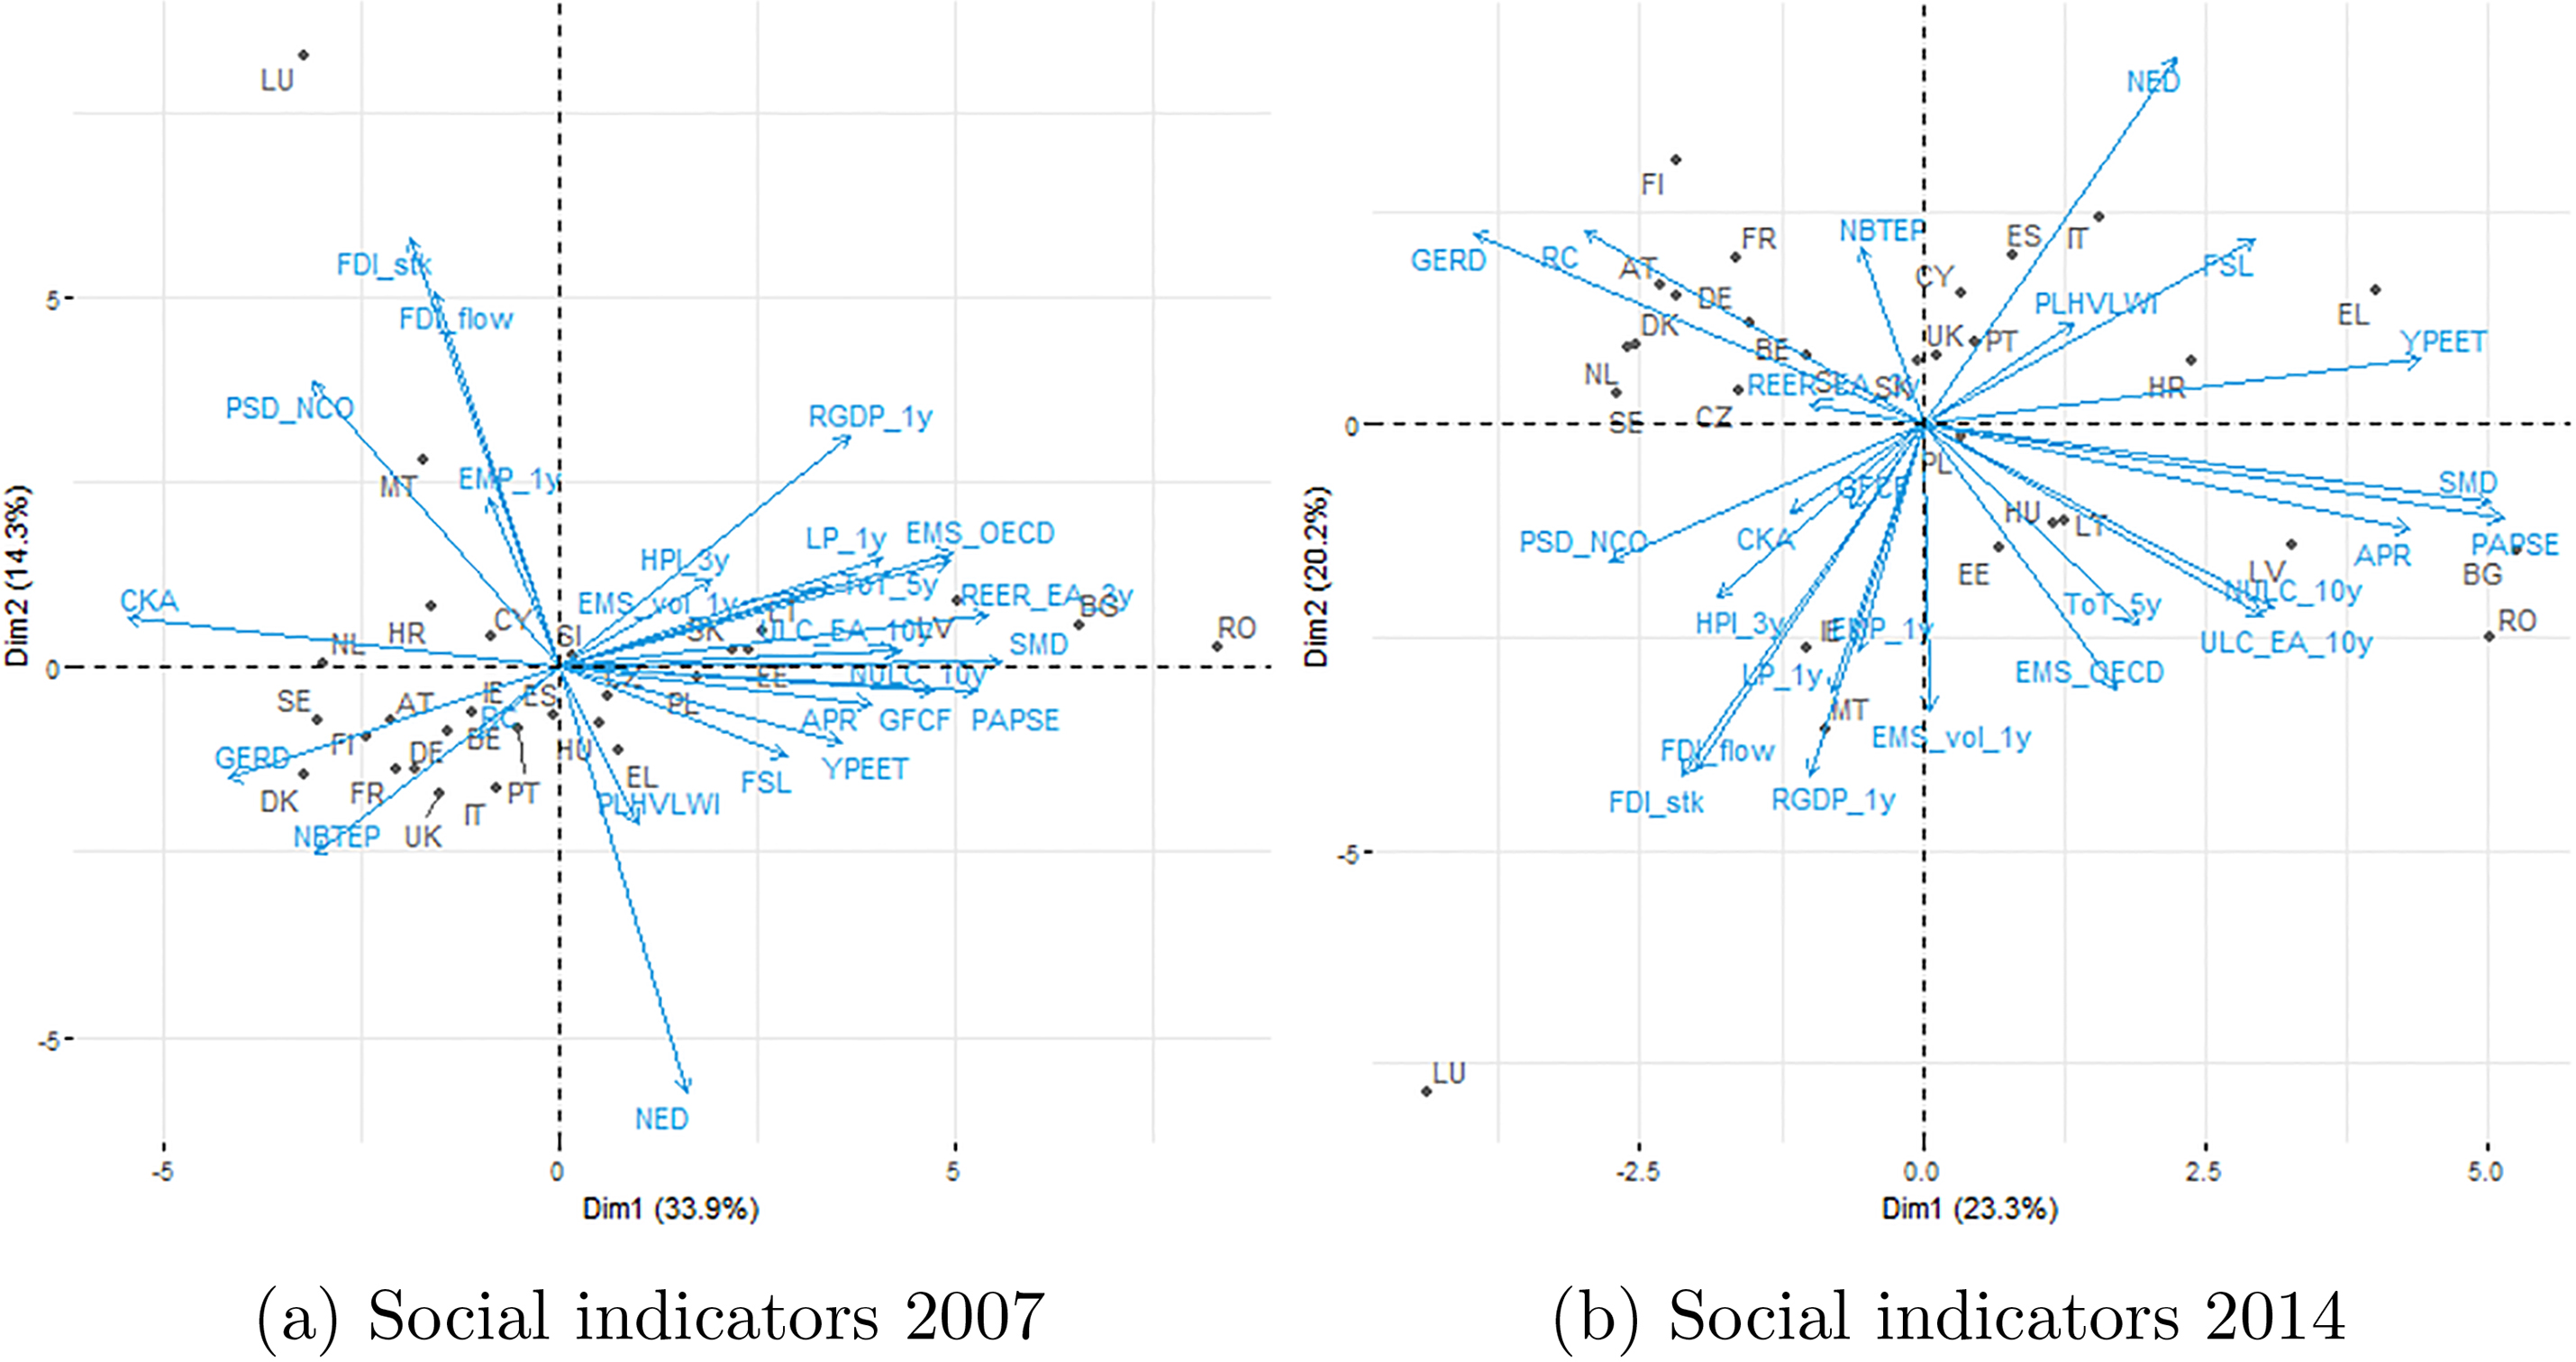
Figure 7.
Biplot of countries and variables on the two principal components. Auxiliary indicators 2007, 2014
In 2014 scoreboard indicators showed a negative evolution that is evident on the first axis. The labour market conditions, unemployment rate (three year average, UN_3y), long term unemployment rate (three year change in percentage points, LTUR_3y) and youth unemployment rate (three year change in percentage points, YUR_3y) are all on the negative part of the biplot (Fig. 6b). The negative evolution of these indicators was associated to a deterioration of the General government gross debt (GGD) position. Italy, Spain, Portugal, Greece and Cyprus were the main countries associated to the worsening of the labour market conditions. As an example of these movements, the unemployment rate in Italy moved from 6.1% (2007) to 12.7% (2014).
Observing the performance of auxiliary indicators across the years, the change in the landscape across countries is confirmed. In 2007, the first axis, that explained 33.9% of the total variance was characterized by a dynamic environment, mainly for the Eastern countries, where high level of poverty, people at risk of social exclusion (PAPSE), severely materially deprived people (SMD), were associated to dynamic economic condition, gross fixed capital formation (GFCF) and competitiveness (REER, Fig. 7a).
In 2014, when the first axis explained only 23.3% of the total variance (Fig. 7b), country with high level of growth were characterized by high level of gross domestic expenditures on R&D confirming the more driven intangible economic phase of the last years [26]. At the same time some countries worsened their position in terms of net external debt and financial sector leverage. For example in Italy the net external debt went up from 0.0% to 58.7%, showing a deterioration of the external position.
5.Conclusions
The financial and economic crises that swept over Europe in 2008 triggered a strong impulse to define and implement new frameworks for strengthening economic governance across countries in order to guarantee macroeconomic stability.
Using the set of MIP indicators, which includes also some employment and social indicators, we have analysed the effects of the economic and financial crises among European Union countries. In particular, we have looked at the data for the European Union countries in 2007 and 2014 to compare, by means of cluster analysis, the relative position of countries in the two years.
Despite the effort made in the coordination of Euro-pean policies, we have found that as a consequence of the economic crisis dissimilarities increased. This result holds with respect to different subsets of MIP indicators including the subset of social indicators, related to wellbeing. In particular, in 2014 the subset of social indicators showed the lowest degree of homogeneity across European Union countries.
The analysed development has introduced and reinforced the differences between a set of core countries and some peripheral ones, mainly Southern ones. This result, in accordance with other studies for the economic dimension, sheds light also on the wellbeing evolution, suggesting that cohesion deteriorated for the social dimension too.
Two dimensions seem to emerge as important for policies aiming to reinforce European cohesion. First, labour market conditions remain difficult in some countries and the risk of poverty needs to be tackled. At the same time, the emerging relationship amid intangible assets and growth requires specific policies for research and development. These observations have been confirmed by a principal component analysis.
Finally, we have shown that MIP indicators can be considered as a useful source to investigate well-being across countries, contributing to the analysis of the economic and social dimensions in an integrated framework. We plan to explore further the MIP indicators to investigate their cyclical correlation by means either of a synthetic measure of the co-evolution of time series, or with a panel data approach.
Notes
1 In this regard it is important to remember the introduction, in 2015, of the seventeen Sustainable Development Goals (SDGs) and their related 169 targets.
2 This paper refers to data until 2014, when the EU was composed of 28 Member States.
3 In fact, the adjustment process following the unwinding of imbalances is often associated with labour market distress and worsening social conditions linked to increased joblessness, inactivity, stagnating incomes.
4 As mentioned in the previous section, MIP indicators can be defined as averages or growths on several years of base statistics.
5 MIP indicators were downloaded from Eurostat database on 25
6 It is important to remember that the allocation of the countries on the X-axis does not reflects their importance but only their relative position.
7 See Table 3 for abbreviations.
Acknowledgments
We would like to thank researchers from DG ECFIN and Eurostat, and in particular John Verrinder, who provided insight and expertise that improved the paper. We also thank Roberto Iannaccone for his tips on R and Monica Iatan for reading a draft of the manuscript. We would also like to thank the Editor and the reviewers for their precious insights. The views expressed in this paper are those of the authors and do not reflect the position of the authors’ organisations. Finally the remaining errors are entirely of our responsibility.
References
[1] | Artis MJ, Zhang W. Core and Periphery in EMU: A Cluster Analysis. Economic Issues. (2001) ; 6: : 39-59. |
[2] | Campos N, Macchiarelli C. Symmetry and Convergence in Monetary Unions. LEQS Discussion Paper No. 131/2018 March 2018. (2018) . |
[3] | Stiglitz J, Sen A, Fitoussi JP, et al. The measurement of economic performance and social progress revisited. Reflections and overview Commission on the Measurement of Economic Performance and Social Progress, Paris, (2009) . |
[4] | Eurostat. Quality of life indicators. Eurostat; (2018) , https//ec.europa.eu/eurostat/statistics-explained/index.php?title=Quality_of_life_indicators. |
[5] | UNDP. The Human Development Report 2010 ‘The Real Wealth of Nations: Pathways to Human Development’. UNDP, (2010) , http//hdr.undp.org/en/content/human-development-report-2010. |
[6] | OECD. Better Life Index. OECD, (2017) , http//www.oecdbetterlifeindex.org/. |
[7] | Istat. Rapporto Bes: Il benessere equo e sostenibile in Italia. Istat, (2017) , http//www.istat.it/it/archivio/207259. |
[8] | Bacchini F, Calza MG, Gandolfo M, Sorvillo MP, Tinto A. MAKSWELL: An EU Project on MAKing Sustainable Development and WELL-Being Frameworks Work for Policy Analysis. Paper presented at ISQOLS 2018, (2018) . |
[9] | Neri L, D’Agostino A, Regoli A, Pulselli FM, Coscieme L. Evaluating dynamics of national economies through cluster analysis within the input-state-output sustainability framework. Ecological Indicators. (2017) ; 72: : 77-90. |
[10] | Stevenson B, Wolfers J. Economic growth and subjective well-being: reassessing the Easterlin paradox. National Bureau of Economic Research, (2008) . |
[11] | Bartolini S, Sarracino F. Happy for how long? How social capital and economic growth relate to happiness over time. Ecological Economics. (2014) ; 108: : 242-256. |
[12] | Michálek A, Vỳbošt’ok J. Economic Growth, Inequality and Poverty in the EU. Social Indicators Research. (2018) , pp. 1-20. |
[13] | Ruggeri Cannata R, Buono D, Biscosi F. The Macroeconomic Imbalance Procedure and the scoreboard: ensuring data coverage. Eurona, Working Paper. (2015) ; (2): 97-118. |
[14] | Everitt BS, Landau S, Leese M, Stahl D. Cluster analysis: Wiley series in probability and statistics. Wiley Chichester, (2011) . |
[15] | Everitt B, Hothorn T. An introduction to applied multivariate analysis with R. Springer Science & Business Media, (2011) . |
[16] | Rousseeuw PJ, Kaufman L. Finding groups in data. Series in Probability & MathematicalStatistics. (1990) , pp. 111-112. |
[17] | Pulselli FM, Coscieme L, Neri L, Regoli A, Sutton PC, Lemmi A, et al. The world economy in a cube: A more rational structural representation of sustainability. Global Environmental Change. (2015) ; 35: : 41-51. |
[18] | Karanikolos M, Mladovsky P, Cylus J, Thomson S, Basu S, Stuckler D, et al. Financial crisis, austerity, and health in Europe. The Lancet. (2013) ; 381: (9874): 1323-1331. |
[19] | Navarro V, Muntaner C. The financial and economic crises and their impact on health and social well-being. Routledge, (2016) . |
[20] | Bernini C, Cracolici MF, Nijkamp P. Micro and Macro Resilience Measures of an Economic Crisis. Networks and Spatial Economics. (2019) , pp. 1-25. |
[21] | Mathy GP, Meissner CM. Business cycle co-movement: evidence from the great depression. Journal of Monetary Economics. (2011) ; 58: (4): 362-372. |
[22] | Caporale GM, De Santis R, Girardi A. Trade intensity and output synchronisation: On the endogeneity properties of EMU. Journal of Financial Stability. (2015) ; 16: : 154-163. |
[23] | OECD. How’s Life? 2017; 2017. Available from: https//www.oecd-ilibrary.org/content/publication/how_life-2017-en. |
[24] | European Economy. The Macroeconomic Imbalance Procedure – Rationale, Process, Application: A Compendium. Institutional Paper. (2016) ; (039). |
[25] | Fraley C, Raftery AE. How many clusters? Which clustering method? Answers via model-based cluster analysis. The Computer Journal. (1998) ; 41: (8): 578-588. |
[26] | Bacchini F, Baldazzi B, De Carli R, Di Biagio L, Savioli M, Sorvillo MP, et al. The Italian framework to measure Well-being: Towards the 20. Version. Growinpro working papers n. 21, (2019) . |


