
How low response among Latino immigrants will lead to differential undercount if the United States’ 2020 census includes a question on sensitive citizenship
Abstract
The article presents a model developed to estimate the undercount stemming from lowered response among sub-populations of 1
The model is referred to as a “cascade” model because it examines successive causes of undercount in the course of non-response follow-up (NRFU), partial household omission in “complex” households, and omission of low-visibility housing units from the U.S. Census Bureau’s Master Address File (MAF). The analysis also examines the likelihood of enumeration errors from the U.S. Census Bureau’s proposed reliance on administrative records for enumerating non-responding housing units.
The model incorporates data from an 8-county survey of Latino immigrants regarding their willingness to participate in Census 2020 if it includes a question on citizenship. It shows that systematic differences in the size of responding and non-responding households will undermine reliability of hot-deck imputation.
The conclusion is that adoption of inadequately-tested “modernized” census procedures exacerbates differential undercount of immigrant populations and contributes significantly to geographic disparities in the census count and erodes the reliability demographic profile of areas with higher-than-average concentrations of immigrants.
1.Introduction
The U.S. Census Bureau has been consistently optimistic about the viability of streamlined census procedures introduced as part of “modernizing” and “re-engineering” Census 2020.
However, serious data quality problems are likely to emerge in 2020 from adopting these methodological approaches which have been driven primarily by cost-containment efforts – especially if the 2020 decennial census includes a sensitive question asking respondents to report the citizenship status of everyone living at the place where they live. Review of the consequences of adopting these “modernized” census implementation methodologies to compensate for low and uneven response rates in any nation where economic, political, and racial/ethnic disparities persist should lead less-developed countries and organizations such as UNESCO’s Institute of Statistics to resist the temptation of following this pathway toward statistical improvement.
In order to assess the impact of adding a citizenship question to Census 2020 on immigrant census response rates in a region of California where there is dense settlement of Mexican-origin immigrants, the San Joaquin Valley Census Research Project (SJVCRP) conducted a survey in September-October, 2018 to examine Hispanic (and other) immigrants’ willingness to self-respond, to respond to enumerator visits, and to requests for proxy interviews seeking information on their neighbors – in a census without the citizenship question or in one that included it.
Using findings from this survey research and Census Bureau descriptions of planned data-gathering and analytic procedures, I have developed a “cascade model” framework to project how differential patterns of census response resulting from a census that includes the sensitive question on citizenship will give rise to differential undercount and distort the reported demographic profile of regions such as the San Joaquin Valley.
Drawing on findings from this large survey of Latino immigrants, I analyze the consequences of adopting these newly “modernized” procedures for Census 2020 enumeration in the large San Joaquin Valley of California, a region where there is a high concentration of immigrants, coupled with stark sociopolitical and economic disparities. The analysis shows that adoption of many of the U.S. Census Bureau’s re-engineered methodological procedures, while promising cost savings, are likely to degrade data quality unacceptably if, as the San Joaquin Valley survey research indicates, the added citizenship question, gives rise to high, but uneven, levels of non-response in a region.
The new Census 2020 procedures for the United States, while probably satisfactory for enumerating easier-to-count populations and communities with a census questionnaire containing only the nine basic questions included in the traditional “simple” census, can be expected to have serious limitations when utilized in immigrant-dense neighborhoods and communities in a census that includes a question on citizenship. Chronic operational problems in census enumeration procedures will inevitably be exacerbated in areas such as the San Joaquin Valley by inclusion of a census question asking respondents about their own citizenship status and the status of everyone living at the same place. It will differentially suppress both willingness to respond and accuracy of responses among sub-populations.
The Cascade Model analysis presented here addresses a central methodological question underlying the ongoing legal controversy about efforts to add the citizenship question that has been considered by the U.S. Supreme Court in April, 2019. That question is whether “modernized” approaches to non-response follow-up (NRFU) and new statistical procedures can successfully compensate for problems of widespread unwillingness to respond to a statistical data collection initiative widely perceived as unwarranted or dangerous by non-citizens, their families, and social networks. In the international context of statistical policy, this relates to underlying issues as to what sorts of central government survey designs are viable and justifiable.
2.Structure of the Cascade Model
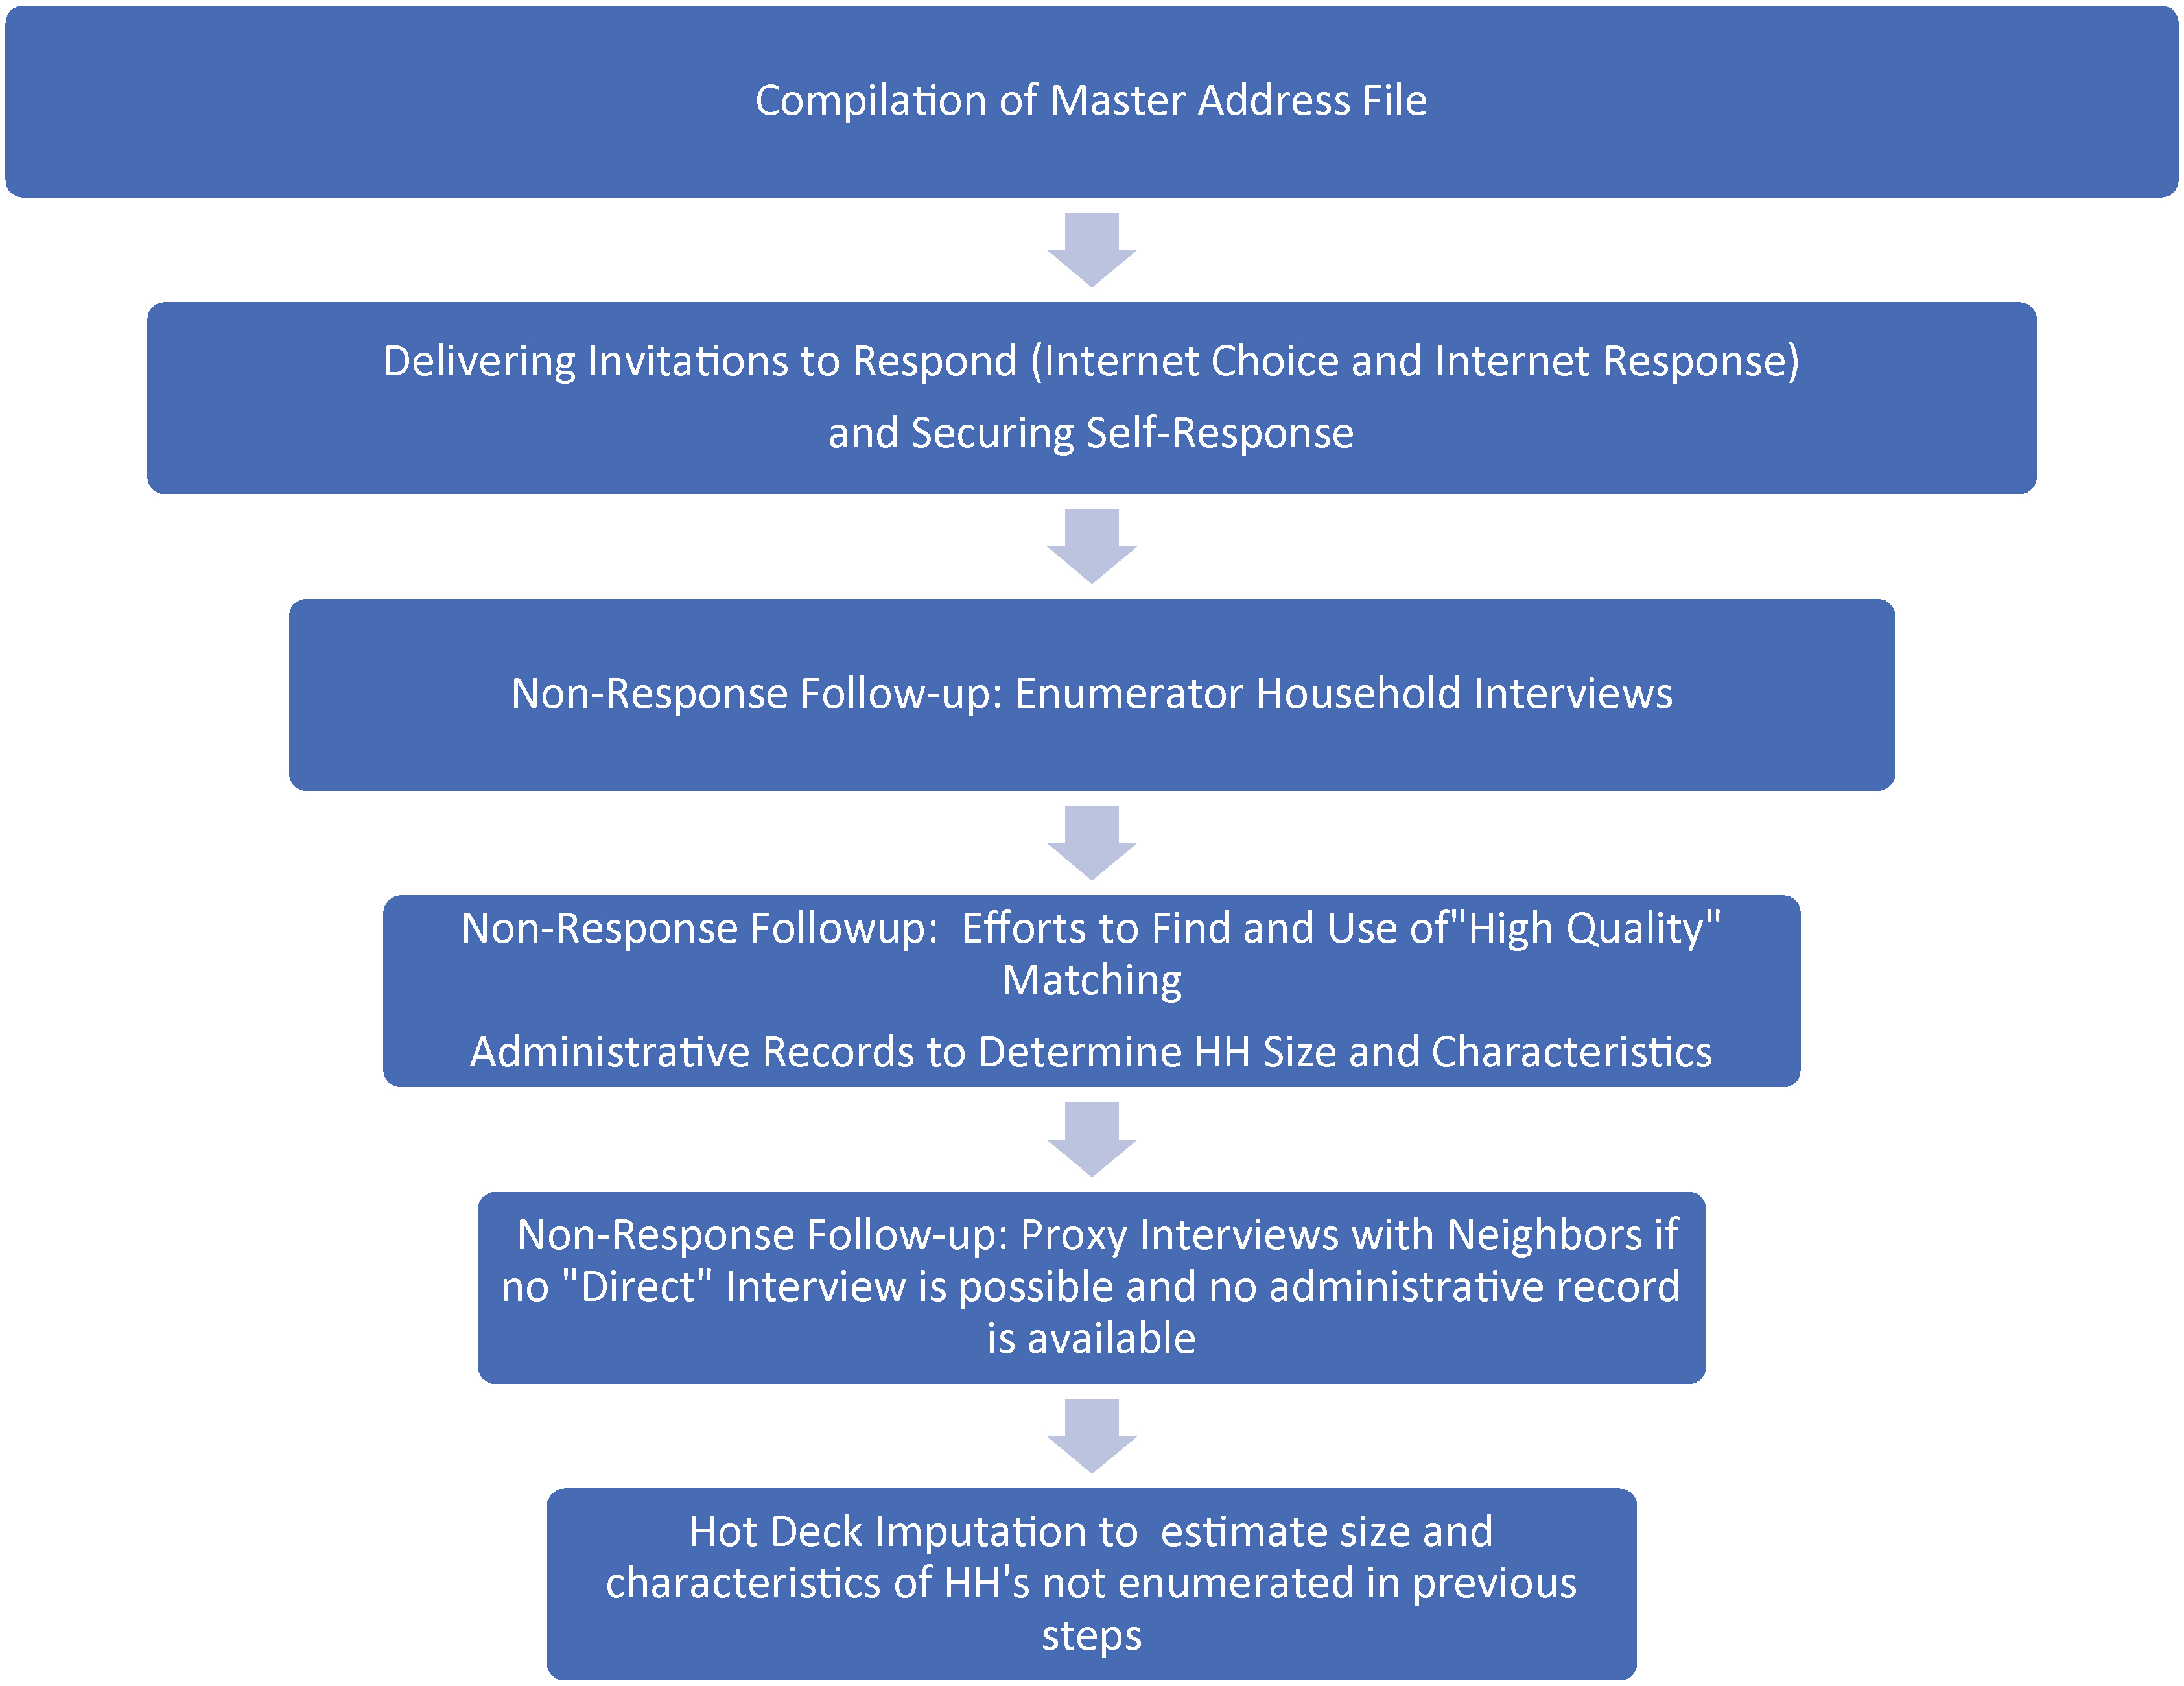
The analysis of how differential non-response is transformed into differential census undercount is referred to as a “cascade” model because the level of success and failure at each stage in decennial census operational procedures, determines the parameters for census operations at the next stage.
Level of self-response, for example, determines, extent of reliance on enumerator efforts to secure information from the households that fail to self-respond during NRFU. Enumerator success in this endeavor subsequently determines the extent of reliance on administrative records and the availability of these records determines the extent of reliance on proxy interviews for information on households. Finally, cumulative success in securing data from households in each of these efforts to compensate for lowered levels of self-response, determines the need for reliance on count and whole-person imputation.
The accuracy of the “census count” (as well as the census-based demographic profile of the population) depends on the level of reliance on each data-collection or analytic operation since some of these data-collection and analytic procedures (e.g. proxy interviews, reference to administrative records) are more error-prone than others.
Despite the valiant but compromised efforts by the Census Bureau to generate accurate census tabulations in the face of greatly elevated and uneven non-response, the attrition in data quality at each step in the census process will very likely result in flawed tabulations of both the size and demographic characteristics of the region’s population.
The “cascade” of census stages in decennial census collection/imputation are visualized in the Cascade Model of undercount of the San Joaquin Valley Hispanic 1
Figure 1.
The Cascade Model of diminishing data quality in successive census operations.
The Cascade Model incorporates empirical data collected in the SJVCRP survey of Hispanic 1
This type of analysis underscores a crucial consideration – that any government survey process involves interactions between often-conflicting systems for visualizing and exchanging information – that of the official institution conducting the survey embedded in the methodology it has chosen to use for data collection and analysis, and the real-world sociocultural system(s) of the respondent population. These systems include language, conceptualization of “household”, literacy, digital literacy, together with the sociological and “structural” context of the communities where a household lives (e.g. size and configuration of immigrant social networks in a community, residence patterns, housing arrangements, patterns of work, postal service, Internet access, interactions with agencies which generate administrative records contemplated for use in imputing household characteristics).
3.SJVCRP study population, survey sample, and why findings are relevant internationally
California’s San Joaquin Valley is a unique region within a highly-developed country, making analysis of factors affecting census accuracy in this particular sub-state region internationally relevant. Although California has large, highly-developed urban centers, it also has extensive agricultural areas. The San Joaquin Valley is the largest of these labor-intensive agricultural areas that have drawn Mexican immigrants northward for almost a century. It has a 2017 population of about 4.2 million persons – more than the population of major urban municipalities such as the City of Los Angeles, Houston, or Chicago [1].
The reason analysis of census operations in this societal context is relevant is that the San Joaquin Valley region has a very high proportion of immigrants (21.7% foreign-born vs. 13.7% for the United States overall), because there is high-level of ethnic/racial diversity, economic inequality, and sociopolitical tension between immigrants and the federal government. These factors play an important role in determining census response rates initially, given the sensitivity of the citizenship question for immigrants, and subsequently in determining the viability of standardized data collection and imputation procedures that have serious limitations in this distinctive sociopolitical context.
The analysis focuses on 1
Based on expert estimates of numbers of undocumented immigrants by region of origin, prepared by the Center for Migration Studies of New York using ACS data, I estimate that about 8.5% of the region’s entire adult population is made up of undocumented Mexican or Salvadoran immigrants, while about 5.3% are legal residents and 6.2% are naturalized Citizens [2]. Based on Census Bureau analysis, I estimate that about 14.5% of the region’s adult population are sons or daughters of foreign-born Mexican or Central American parents [3].
The cascade model of undercount draws on San Joaquin Valley Census Research Project (SJVCRP) survey data collected in face-to-face interviews with 418 first- and second-generation Latino immigrants during September-October, 2018 [4]. The survey data suggest there may be unprecedented low levels of census response among Hispanic immigrants in Census 2020 stemming from inclusion of the question about citizenship status (which is generally understood as being an inquiry about immigration status). Lowered, and uneven, levels of response within immigrant social networks would initiate a cascade of Census Bureau procedures to compensate for non-response that, unfortunately, have limitations that cannot be easily overcome in these sorts of communities. The Cascade Model then estimates the level of differential census undercount for four groups: undocumented, legally resident, naturalized 1
Because the survey data show differential levels of response within the Hispanic immigrant population as well as in comparison to non-immigrant non-Hispanics, there is reason to be concerned that the resulting bias in census-derived demographic profile of the population will make tabulations of race/ethnic and age characteristics of the entire region unreliable.
Although some coefficients in the cascade model cannot be definitively specified – because the U.S. Census Bureau’s operational procedures may evolve further and the societal context in which the decennial census is embedded may further evolve in the months before Census 2020 takes place (e.g. due to shifts in immigration policy and enforcement), the model does provide a framework for identifying particularly problematic operations and procedures and provides a systematically-derived estimate of resulting differential undercount in Census 2020.
A major uncertainty in projecting patterns of census response in 2020, of course, relates to whether the Supreme Court decision (expected in June, 2019) forces the U.S. Department of Commerce to abandon its plan to include the question on citizenship. However, even if the citizenship question is removed, it is possible that there may be lingering concerns among immigrants about the confidentiality of census responses and suspicion that census response is risky [5].
4.How robust are the planned Census 2020 NRFU procedures in the San Joaquin Valley?
A central concern is that the reliability of the Census Bureau’s planned data collection strategies has not yet been assessed or tested in the distinctive societal context of immigrant communites using the newly-modified survey instrument that now will probably include a highly-sensitive question about citizenship. The 2018 End-to-End Test did not include a questionnaire with the citizenship question.
The U.S. Census Bureau will be conducting research on the impact of the citizenship question on census self-response during the summer of 2019 and reporting preliminary findings about six months before Census 2020 operations begin. But the analysis may well be too late to change Census Bureau staffing level, operational guidelines, and data collection methodology for NRFU [6]. Moreover the Census Bureau’s 2019 study, while well-designed, will only examine self-response and will not generate insights about households’ responsiveness to enumerator contacts during non-response followup or responsiveness to requests for proxy interviews. These are serious limitations – because in a scenario where there is a high level of non-response as is the case in the San Joaquin Valley, the NRFU phase of data collection is likely to account for about half of all data collected.
5.Understanding the dynamics of census undercount in the San Joaquin Valley region
The “cascade model” of undercount described here draws on earlier researchers’ powerful insights that patterns of differential undercount do not stem from certain populations being intrinsically “hard to count” but, rather, from the interactions between the census system of enumeration and the population being enumerated.
Two lines of research have been particularly fruitful in improving researchers’ understanding of the dynamics of undercount – a multi-stranded research initiative in the Los Angeles basin as part of the 1986 Test of Adjustment Related Operations (TARO) and a subsequent national initiative as part of the 1990 Decennial Census – the ethnographic alternative enumeration research conducted by the Census Bureau’s Center for Survey Research.
Based on the Los Angeles research, a sound theoretical framework to understand the causes of census undercount, not simply correlations, emerged. The powerful insight stemming from this research is that undercount results from conflict between the census system processes for enumeration/data collection and perspectives on and patterns of information-sharing at play in the social universe in which potential survey respondents live.
Within this over-arching theoretical framework, the Census Bureau’s ethnographic research program then made important contributions to understanding undercount in a range of specific local conditions. It analyzed how different interactions between the socioeconomic and cultural context of potential census respondents’ lives and census operations gave rise to differential undercount of low-income minority and immigrant families. The program meticulously documented undercount in 31 distinct ethnic groups in different communities across the U.S. [7]. Related ethnographic research conducted by Diego Vigil in connection with the 1986 TARO in the Los Angeles basin and by Phillipe Bourgois in New York documented specifically how distrust in government among immigrants constrained census response even at that point in time – decades before the current national debate on immigration policy began to make daily news headlines [8, 9].
The Cascade Model-based estimates of differential undercount among sub-populations of Hispanic immigrants to the United States are driven by the distinctive conditions observed in the SJVCR survey of the specific sociologically distinct ethnic/racial sub-population of Mexican and Central American immigrants. Although the analysis relates specifically to the San Joaquin Valley context, the over-arching framework provides a useful tool for better understanding the dynamics through which differential non-response is transformed into differential undercount for any low-response population or socially-defined group in any community where relevant empirical data can be secured.
During the non-response follow-up (NRFU) process, the Census Bureau works hard to implement a methodological strategy designed to compensate for household non-response. Nonetheless, census data quality is eroded in communities when there are high levels of non-response among some sub-populations despite the Census Bureau’s best efforts to secure complete enumeration. This is because, when confronted with high levels of household non-response, the Census Bureau is forced to rely on additional operational and statistical procedures – recourse to administrative records, proxy interviews, and, finally, imputation, to generate published tabulations of census data. Each of these efforts, while partially compensating for non-response, also introduces errors into the eventual tabulations of census data that provide the official basis for apportionment and for allocation of federal funding.
The specific ways in which the Census Bureau’s system of data collection and analysis leads to differential undercount stem in part from the characteristics of the population being enumerated but, also, from the “structural” characteristics of a geographic area – housing patterns and living arrangements, as well as local socioeconomic context [10, 11, 12]. For better or worse, the population and housing characteristics of the San Joaquin Valley make it a “natural laboratory” for exploring the extent to which adding a sensitive question such as the citizenship question to the decennial census affects census accuracy in a geographic area with concentrated immigrant settlement.
6.Cascade model coefficients derived from the SJVCRP survey
The SJVCRP survey provides data showing Hispanic immigrants’ willingness to self-respond to Census 2020 if it includes a citizenship question, willingness to respond to an enumerator visit, and willingness to respond to an enumerator’s request for a proxy interview to provide information about their neighbors [4].
Because the SJVCRP survey data include information on respondents’ legal and citizenship status (made possible by reliance on interviewers who are immigrants themselves conducting face-to-face interviews in immigrant-friendly social contexts) it was possible to determine willingness to respond among immigrants by immigration and citizenship status, as well as educational attainment, English-language ability, age, and neighborhood characteristics (represented by the Census Bureau’s LRS indicator and percent non-citizens in a tract).
6.1Willingness to self-respond to a census that includes the citizenship question
The SJVCRP survey shows that only 27% of the foreign-born undocumented immigrants, 64% of the legal residents, and 78% of the naturalized would be willing to respond to the census if the citizenship question were to be included. An unexpected finding was that adding the citizenship question would have a significant impact on the 2
6.2Willingness to participate in a proxy interview to provide information on neighbors
The survey also provides dramatic evidence that there is widespread aversion to providing information about one’s neighbors. Even when queried about willingness to respond to a “simple” census asking only the nine questions that had been asked in 2010, only 17% of all respondents were willing to provide an enumerator with information about the neighbors; when asked about willingness to provide the information if the census included the citizenship question, only 11% were willing to do so. SJVCR survey respondents’ comments made it clear that the citizenship question would catalyze pre-existing concerns about the propriety and practical consequences of sharing personal information about one’s neighbors.
6.3Predicted differential in size of responding and non-responding households
The SJVCRP survey also secured information on household size for all respondents in order to determine whether there were systematic differences in the size of the households willing to respond and those not willing to respond to a census that included the citizenship question. The survey also secured data on housing arrangements to determine the prevalence of “complex” living situations – both “complex households” (as defined by OMB/Census Bureau residence rules – multiple social units living under the same roof) and “complex compounds”, addresses/properties with a single postal address but additional, often-concealed, housing units.
6.4“Structural” causes of undercount – getting an invitation to respond and ability to respond
The SJVCRP survey also secured information on respondents’ mail delivery arrangements (own mailbox, PO box, shared mailbox, or no postal address), internet access (via cellphone, via computer or laptop, or both), English-language ability, educational attainment as a proxy for literacy, and age. These are all factors that can pose barriers to census response but they were not included in the cascade model because their quantitative impact on potential respondents’ ability to respond could not be estimated.
Details of census support operations will also make a difference. For example, earlier research conducted in the San Joaquin Valley region in connection with Census 2010 had shown that about 75% of linguistically-isolated households had received bilingual forms which greatly facilitated response but that 25% had not [13]. It is likely that, in 2020, as in 2010, almost all the households in census tracts where more than 20% of the households are believed to be linguistically isolated (based on ACS data) will successfully receive bilingual invitations to self-respond but in the census tracts with fewer linguistically-isolated households even those who speak no English or are very limited in English will not receive bilingual invitations to participate or Spanish-English forms. Deployment of easily-accessible questionnaire assistance centers (QAC’s) in such tracts might ameliorate this problem but it is unclear if there will be funding for this, although there were discussions during the spring of 2019 to reinstate this type of support which had been helpful in 2010.
Similarly, without final plans in place for Census Bureau designation of TEA’s for Update-Leave (which is probably helpful in increasing enumeration of hidden housing units without mail delivery) for delivery of Internet First vs. Internet Choice materials, these other structural barriers to census participation can only be noted as additional barriers to self-response.
7.How variations in response rate and “structural” causes of undercount will be transformed into eventual differential undercount in Census 2020
The ways in which differential non-response erodes census accuracy are dynamic and vary in relation to specific population being enumerated, survey design, and community context. But there is no doubt that when any survey – decennial census included – encounters high levels of non-response, accuracy is degraded because the process now relies less on “data” collected, actual empirical data, and more on statistical processes utilized to adjust for lack of data or inaccurate information supplied by reluctant respondents.
Higher levels of non-response in reaction to inclusion of a sensitive survey question result in incremental errors and uneven levels of non-response among different groups. This, in turn, consistently results in differential undercount of “hard to count” sub-populations. However, willingness to respond is not the only cause of undercount. Eventual differential undercount stems from the way in which census operations play out in different neighborhoods, with distinct housing patterns, ethnicities, NRFU workload and staffing (an important reason why extensive questionnaire testing in diverse sociocultural contexts and geographic areas is important).
Factors in the “cascade” of census operations the Cascade Model identifies as determinants of the eventual accuracy of the census count for a neighborhood, community, county, or state include the following:
• Success/failure in MAF-building, i.e. completeness of the Census Bureau’s address list due to omissions of housing units leading to total HH omissions due to non-receipt of an invitation to respond and housing units not being included in the NRFU workload.
• Success/failure in securing self-response (via return mail or online).
• Success/failure in securing an in-person NRFU interview with a non-responding HH.
• Success/failure in securing a “high quality” administrative record match for HH’s that did not self-respond or respond to an enumerator.
• Success/failure in securing a proxy interview if a non-responding neighbor’s HH is unavailable for an interview or refuses and no apparently “high quality” matching administrative record can be secured.
• Bias in reported HH size and characteristics stemming from systematic under-reporting in complex HH’s, especially those that include undocumented members (partial HH undercount).
• Bias in imputed HH size and characteristics of households “enumerated” by reference to administrative records due to available administrative records omitting some HH members (resulting in partial HH undercount) due to being out of date, and/or as a result of unreliable matching algorithms in communities with high rates of residential mobility.
• Bias in HH size and characteristics stemming from recourse to hot-deck imputation for non-responding HH size due to systematic differences in HH size between donor HH’s and non-responding HH’s.
The Cascade Model indicates that, at each stage, there is erosion in data quality despite Census Bureau efforts to secure information from respondents and from inaccuracies in the surrogate sources of information it utilizes in lieu of household census responses.
8.Structure of the Cascade Model of census undercount in the San Joaquin Valley
The model, first, gives attention to the Census Bureau’s limitations in generating a complete address list that includes low-visibility unconventional or hidden housing units (the “bad MAF” problem). It does not include an estimate of possible erroneous deletions of occupied housing units that are incorrectly believed to be vacant (due either to errors in administrative records, misreporting by proxy sources of information about housing unit vacancy, or enumerator judgement).
The model also gives special attention to the extreme reluctance observed in the San Joaquin Valley Census Research survey to proxy interviews used by the Census Bureau to secure information on non-responding households. As well as being difficult to secure, it is crucial to understand that proxy interviews are error-prone because they are, at best, estimates by neighbors – some accurate, but some inaccurate – of the number and characteristics of neighboring households. The SJVCRP survey shows that less than half believe they know enough about their neighbors to provide accurate responses.
Another important cause of undercount is due to the serious problems with “enumerations” based on securing an apparently matching administrative record that that the Census Bureau envisions using to determine the characteristics of a household that has not self-responded, and has not been contacted. The difficulty is that availability of “high-quality” administrative records is known to vary by household characteristics and consequently, inevitably contributes to differential undercount. Characterizations of household size and demographic profile based on reference to administrative records are, of course, not actually enumerations and are an element of Census 2020 operations that has not been adequately tested.
Even when an apparently matching administrative record is found for an immigrant household, it is suspect as a source of information about household size and composition because it may be out of date and is very unlikely to include peripheral household members who are not part of the primary core family living in the housing unit. Given this consideration, it is worrisome that the U.S. Census Bureau’s Operational Plan is now to seek an apparently matching administrative record even before enumerators go on to seek proxy interviews – although it is known that proxy interviews often result in unreliable data.
When a household has not self-responded and when an apparently high-quality administrative matching cannot be found, then enumerators are asked to seek a proxy interview with a nearby household to determine the size and characteristics of the non-responding household.
Finally, at the end of the cascade of Census Bureau efforts to secure information on non-responding households, there is the last-ditch attempt to use hot-deck imputation to determine the characteristics of households that have not responded, for which there is no information from a proxy interview, and where no matching administrative record can be found.
This final stage in the decennial census process is particularly problematic in the San Joaquin Valley and probably in other communities with dense concentrations of immigrants where low rates of self-response and challenges encountered in implementing NRFU leave a significant proportion of housing units to be “enumerated” via hot-deck imputation.
The ubiquitous problem in use of hot-deck imputation in the San Joaquin Valley is that the non-responding Latino households are systematically larger than those that do respond. Therefore, when a nearby responding household is considered to be the “donor” for imputing the size and characteristics of a non-responding household, each imputation will contribute to systematic differential undercount.
Given survey findings San Joaquin Valley Census Research Project, the Cascade Model generates an estimate of an 12% differential undercount of Mexican and Central American immigrants in the region. This is a conservative projection. The model does not, for example, attempt to estimate the additional negative impact that constrained access to the Internet and low digital literacy, coupled with print literacy, might have on self-response rates although there is little doubt that socioeconomic disparities pose barriers to census response of some who are motivated to participate.11
9.An in-depth look at the cascade of semi-successful efforts in the NRFU process meant to compensate for households’ failure to self-respond
The success of NRFU depends on many factors – some which can be predicted more reliably than others. Key challenges are discussed below.
9.1Receiving an enumerator visit during NRFU if the housing unit is not in the MAF?
An important consideration, in addition to a householder’s willingness to self-respond, is their having an opportunity to self-respond or respond to an enumerator during the course of NRFU. About one out of seven of the SJVCRP Hispanic survey respondents who were in the U.S. in 2010 believed they had never received a census form in 2010 and had not been contacted by an enumerator. Their recollection may be imperfect or another person in the household may have responded, or their household may have been “enumerated” via proxy interview, but surely this suggests that there is reason to be concerned about thoroughness of NRFU due to errors in the MAF.
More than one-quarter (28%) of the SJVCRP Latino immigrant survey respondents do not have a standard mailing address. About half of these households without standard home mail delivery (13% of all) use a PO box to receive mail; another 12% rely on a shared mailbox and 3% only get mail at a friend or relative’s address if at all. This will take a toll on opportunity to respond because, depending on delineating of Update-Leave enumeration areas, the viability of non-ID response (NID), and availability of Spanish-English bilingual invitation and forms in census tracts with relatively low concentrations of linguistically-isolated Spanish speaking households, even relatively motivated potential respondents may encounter too many barriers to follow through.
9.2Operational/logistics shortcomings in implementing NRFU in areas with unexpectedly high non-response rates?
Operational disruptions in NRFU, a probable consequence of overly-optimistic Census Bureau projections of 2020 self-response rates, would, inevitably, make the actual undercount higher than the cascade model currently projects. Improving current projections of expected NRFU workload to take into account additional factors beyond the guidance provided by the LRS indicator might be required, for example.
Salvo and Lobo argue, for example, that an unmanageable NRFU workload in parts of New York City resulted in many occupied housing units being incorrectly classified as vacant – just to get them removed from an enumerator’s work assignment [14]. Enumerators are also able to remove a housing unit from their workload if it is deemed “unsafe” – an understandable provision but worrisome as an option for an individual enumerator without the requisite communication/social skills – to reduce their workload. A December, 2018 GAO report, for example, also points to Census Bureau research showing that rushed enumeration where there is a higher-than-expected nonresponse follow-up (NRFU) workload contributes to enumeration errors [15].
Shortfalls in deployment of linguistically and culturally competent enumerators in language-minority areas would also compromise NRFU success in securing responses from some households. We know, from research on 2010 Census coverage in hard-to-count tracts in agricultural areas of California, for example, that enumerators’ ability to establish rapport with non-responding households (likely to be similar to those in our survey who responded that “maybe” they’d answer the census) will affect completion both of NRFU “direct” interviews with reluctant households and proxy interviews with neighbors.
The U.S. Census Bureau’s split-panel summer, 2019, test of a census without or with the citizenship question may generate a revised estimate of levels of non-response by winter, 2019 – but at that point it is unclear whether adequate funding could be made available to support higher levels of NRFU workload than is currently estimated.
9.2.1Impact of the logistics challenges involved in enumerator contacts with households of “working poor”?
Another uncertainty is that it is not known exactly how many NRFU enumerator visits may fail to yield an interview simply because the enumerator visit took place when there was no household respondent at home. The current operational plan is that enumerators will be required to make 3 attempts to contact a non-responding household; after 3 unsuccessful contact attempts, three efforts will be made to conduct a proxy interview.
9.2.2Limitations of reliance on administrative records to “enumerate” households in NRFU?
One of the most worrisome potential problems connected to Census Bureau operational plans for Census 2020 implementation in the San Joaquin Valley is the viability of using administrative records to “enumerate” non-responding households in areas with concentrations of immigrants, particularly in those mature migration networks where there are relatively more recent arrivals of unauthorized migrants.
The entire Census Bureau proposition of relying on administrative records to impute household size (and characteristics) of non-responding households is a novel and untested one introduced only after efforts were made to add the citizenship question.22 This new “modernized” component of non-response followup is inadvertently ethnocentric due to its disregard for variations in availability and accuracy of administrative records for more socioeconomically marginal households, particularly those headed by immigrants without legal status who are ineligible for many social programs and working without employment authorization. The limitations of administrative records are, obviously, an important consideration in less-developed countries where such socioeconomic disparities are pronounced but, in actuality, is a consideration in the United States in communities such as those in the San Joaquin Valley have existed for decades and are, in recent years, increasing [16].33
Moreover, even if there is some sort of match between a household and an administrative record for the address in some cases, apparently matched records, especially those for “complex” households, will systematically omit some of the actual household members – because they’re out of date or underlying information is inaccurate.
9.2.3Variations in reliability of hot-deck imputation?
SJVCRP survey findings show that non-responding Latino immigrant households are, on the average, significantly larger than those that respond. This threatens the reliability of hot-deck imputation as a procedure for determining the size and characteristics of the non-responding households.
An important characteristic of the San Joaquin Valley region is that there are also uncertainties regarding use of hot-deck imputation stemming from economic diversity in areas where high-income and middle-class households and low-income immigrant households are mixed together geographically. Consequently, there are serious questions about the composition of the pool of households used as “donors” for imputing the characteristics of non-responding households for which administrative records are not available. Hot-deck imputation where the donor household is a similar Latino immigrant household is flawed but cases where the donor household is a nearby non-Latino household are even more problematic.
10.Details on components of the Cascade Model and threats to census data quality
Below are details on key components of the Cascade Model used to estimate how non-response translates into undercount. The model predicts Census Bureau success rate at each step in the census process and estimates the percent of actual population enumerated at each stage. As the analysis moves through each stage in the process, it provides an estimate of cumulative enumeration – after self-response, after response to enumerator NRFU visits, after “enumeration” via proxy interview, and “enumeration” via reference to administrative records.
It is then assumed that the size and characteristics of the remainder of non-responding household that have not been enumerated in any of these operations will need to be imputed.
Historically, the Census Bureau has not had to rely extensively on imputation. But there are many reasons to believe the situation will be different in Census 2020, at least in communities of Hispanic and other immigrants similar to those studied by the SJVCRP due to low levels of self-response among these populations and the challenges encountered in implementing planned NRFU procedures. There are also reasons to believe that some of the standard census procedures such as reminder letters and postcards will be minimally effective in the sociopolitical context of a census that includes the citizenship question – since non-response does not result from “forgetting” but is actually deliberate.
Having determined the proportion of households in each sub-population where size and household characteristics will have to be imputed, the Cascade Model then examines undercount that stems from errors in hot deck imputations of the size and characteristics of the remaining residue of households that have not been enumerated.
10.1Before enumeration begins – housing units omitted from the Census Bureau’s address list
It is generally agreed that the sampling frame for the decennial census always omits some low-visibility unconventional and/or hidden housing units. Although there are limited data on the pervasiveness of this problem, we have recently documented the prevalence of missing housing units in several major California counties and communities [17]. This research generated relevant empirical data on the completeness of the Census Bureau’s address list (MAF-Master Address File) in the San Joaquin Valley. Community-based address canvassing linked to LUCA was conducted in Stockton and in Fresno in areas where unconventional and/or hidden housing units were prevalent. MAF quality varied from census tract to census tract in the community-based canvassing but prevalence of hidden housing units averaged 4.8% in the canvassed areas of the San Joaquin Valley.
The San Joaquin Valley cascade model projects that for U.S-born citizens, naturalized citizens, and legal residents 3% of the population live in unconventional and/or hidden housing and that, for undocumented immigrants, 5% of households live in this type of low-visibility housing. Therefore, the San Joaquin Valley cascade model begins with the assumption that, as a result of incomplete address canvassing at the first stage in the census process, only 95% to 97% of the Latino immigrant study population live in housing units included in the Census Bureau’s Master Address File (MAF) and can be enumerated.
A few hidden housing units not in the MAF may be identified in U/L (Update-Leave) areas of the San Joaquin Valley but, nonetheless, the assumption of 3%–5% total household omissions due to low-visibility occupied housing units not being on the Census Bureau’s address list appears to be well-founded. If there were to be higher-than-expected designation of TEA’s (type of enumeration areas) for U/L (update-leave), it would ameliorate the impact of this particular cause of undercount – but current plans and budget constraints make this unlikely since the current operational plan is for less than 5% of all U.S. areas to be enumerated using this methodology and virtually none using U/E (update enumerate) [18].
Conceivably innovative and aggressive messaging campaigns to urge households living in hidden housing units and those without their own mailbox to proactively respond via the online non-ID processing option (essentially, an online “Be Counted” option) or by phone might have a positive impact but this only would have real promise if there were also facilities to assist these households in submitting an online response and messaging campaigns designed to specifically promote proactive response efforts by households that did not receive an invitation or form. The 2018 Census Bureau End-to-End Test in Providence, RI, tested self-response kiosks at post offices to facilitate online response but the results were not encouraging. “High-touch” assistance is required but ultimate level of such support is uncertain and geographic variations in availability and quality of support provided are inevitable.
It is not clear to what extent online non-ID processing (NID) might contribute to inclusion of households living in the hidden housing units and those without their own mail delivery – but what is clear is that there are many barriers in the way – a problem given inadequate motivation for the marginally-housed households to take proactive steps to be counted in the context of a census perceived as being unfriendly to immigrants, lack of Internet access. There are currently efforts in Congress and discussions between Census Bureau management and stakeholders about the need for additional funding for physical local questionnaire assistance centers (QAC’s) in hard-to-count areas (a feature of Census 2010 operations abandoned in initial plans for 2020) but it is not clear, at this point, whether this component will be funded and, if so, the density and accessibility of QAC’s.
10.2Before NRFU begins: Level of self-response as a key determinant of NRFU workload
Self-response in the analysis of SJVCRP survey data was estimated based on respondents’ “general” willingness to respond – based on their answers about either answering the census themselves if it were to include a citizenship question or willingness respond to an enumerator.
However, the U.S. Census Bureau’s analysis in its CBAMS (Census Barriers, Attitudes, and Motivators) research shows there is a 10% gap between expressed willingness to respond and eventual response – based on comparison of 2008 CBAMS survey reported intentions and actual Census 2010 responses [19].
The extent to which willingness to participate in the census is translated into actual self-response can, in principle, be positively affected by media messaging and on-the-ground outreach to promote participation, reminder postcards or negatively by changes in the overall sociopolitical environment.
The Census Bureau is optimistic that these campaigns will have a substantial positive impact. However, analysis of qualitative details of SJVCRP survey respondents’ comments about their attitudes regarding response to a census with a citizenship question gives rise to doubts about the efficacy of planned messaging campaigns. Survey respondents consistently explained that their uncertainty about the confidentiality of how household information provided in response to the census might be used stemmed from overall distrust in the federal government trustworthiness – making it hard to imagine that government-sponsored messaging would have a major impact [5].
At the same time analysis of the SJVCRP respondents’ comments, provide a bit of hope that some who said they would not be willing to respond might overcome their reluctance to participate in a census that asks about citizenship by responding but skipping the question and/or deciding not to include a sub-set of household members in their response for the household. In these cases, potential non-responses may be transformed into inaccurate responses. But it also deserves note that some of those who said they would be willing to respond also expressed reservations and might be nudged toward non-response.
Given these countervailing considerations, the Cascade Model optimistically assumes that eventual Census 2020 self-response rates will be their expressed willingness to respond minus 5% (half the CBAMS observed 10% fall-off between expressed willingness and eventual response behavior based on comparison of their survey sample’s 2008 answers and actual census response in the 2010 decennial census).
To be sure, comparability is an issue because CBAMS was a mail survey and the SJVCRP survey was an in-person interview; also, willingness to respond was measured differently in CBAMS than in the SJVCRP (as CBAMS respondents were tabulated as willing if they said they were “extremely” or “very” likely to respond to the census “if it were held today….”) while the SJVCRP respondents were only asked about their general willingness to respond. So CBAMS-SJVCRP comparability is not straightforward. Despite the difference in how the question was posed and analyzed in CBAMS vs. the SJVCRP survey, these differences actually suggest the SJVCRP drop-off from expressed willingness to eventual response might be even higher than was observed in the CBAMS sample. Consequently, it seems that the Cascade Model assumed drop-off from intent to respond to actual responsiveness is very conservative.
Expressed willingness to respond to a census that includes a citizenship question varied among sub-groups of Latino 1
These projected rates of self-response are not inconsistent with those observed in the 2016 Los Angeles and Houston test censuses or the 2018 End-to-End Test (where there was an overall 43% self-response rate for Hispanics overall). But, in fact, the test results are probably optimistic given the fact that both of these tests took place before the decision to add the citizenship question to the census was announced. and region-specific “structural” barriers to response in the San Joaquin Valley are probably more severe than in Providence, RI. It will be important to learn the results of the Census Bureau’s planned Summer, 2019, split-panel research to update expectations regarding patterns of self-response, particularly in census tracts with high concentrations of non-citizens [20].
10.3NRFU Step 1: Reliance on administrative records to identify occupied vs. vacant housing units
Census Bureau research from Census 2010 shows that, nationally, the NRFU workload lacked 4% of all actual housing units (based on results of Vacancy Deletion Checks) [21]. This potential problem was flagged in the 2018 End-to-End Test and current plans are to require at least one visit by an enumerator to determine whether a housing unit is occupied.
However, even this reasonable approach may be problematic in San Joaquin Valley immigrant communities in Census 2020 – because there are major fluctuations in seasonal occupancy and widespread sub-standard housing conditions. Enumerator determinations as to whether a housing unit is occupied or not will not always be easy.
10.4NRFU Step 2: “Direct” interview completion (interview with a non-responding household, excluding proxy interviews)
The Cascade Model assumes that respondents’ willingness to respond to an enumerator who comes to interview a non-responding household is their “general” willingness to respond expressed in analysis of willingness to self-respond or respond to an enumerator visit. However, in actuality, the rate of success in securing “direct” interviews rests not only on a household’s willingness to respond to the enumerator but, also, the basic logistic challenge faced by enumerators in making contact and in finding an adult householder willing and able to respond at home.
The Government Accountability Office (GAO) report on the 2016 Census Tests conducted in Harris Co, TX and Los Angeles Co., CA mention a NRFU interview completion rate of 70% (Harris County) to 80% (Los Angeles County) [22]. However, the definition of “NRFU interview completion” included both direct enumerator interviews with non-responding households and proxy interviews (which made up 25% of all NRFU interview completion in 2010) [23]. Therefore, the cascade model estimate can be compared to the test census results by recognizing that the “direct interview” rate in Harris County was about 52.5% and in Los Angeles County about 60%. A still more worrisome recent report from GAO is that in the Providence, Rhode Island, End-to-End 2018 Test, there was a 33% non-interview rate in the overall NRFU workload [24].
10.4.1Consequences of truncation of enumerator return visits?
The Census Bureau’s decision to truncate the number of enumerator return visits seeking a direct interview may be particularly problematic in Hispanic immigrant neighborhoods in 2020. The Census Bureau’s 2010 NRFU Contact Strategy experiment showed that, nationally, from 39.1% to 41.1% of all non-responding households had been successfully interviewed after one NRFU contact attempt – as is planned for 2020 [25]. It is also important to note in the tabulation of results from the experiment that reliance on proxy interviews was very high in return visits by enumerators (about half of enumerations during the 2
Although the basic plan for return visits by enumerators is to conduct three return visits if an initial visit and attempts to secure a matching administrative record for a non-responding household fail, the Census Bureau’s basic NRFU plan vis-à-vis number of visits to non-responding households apparently may also involve reliance on an unspecified “business model” to determine the cost-effectiveness of return visits by enumerators. A NRFU algorithm for authorized number of enumerator-return visits to a non-responding household based on cost-effectiveness is worrisome because it might predict that return visits were less cost-effective in neighborhoods such as those San Joaquin Valley immigrants live in, where willingness to respond is lower and where making contact is more challenging because low-income family members work longer hours.
In many cases, a household may be visited only once before an attempt is made to enumerate it by recourse to administrative records or, if that fails, via a proxy interview. Even in cases where more than one visit may have been made to a household that is, in fact, willing to respond, a NRFU interview may still not be completed because the business model required the enumerator to give up too soon and because the alternative strategies for securing data from the household (e.g. a reminder postcard left at the door) may be ineffective.
The Census Bureau argues that its enumerator deployment software will optimize enumerator visits to make it as likely as possible for the enumerator to find an adult at home. However, it is very unlikely that the standard optimization model will do well in the San Joaquin Valley Latino immigrant community where work hours are often long and where weekend work is common. It deserves note also that the 2018 End-to-End Tests showed that unaccountably there were fewer enumerator visits scheduled for Saturdays, the day when actual chance of contacting a household respondent was highest.
10.4.2Consequences of limited availability of waivers to hire non-citizens as enumerators?
Another area of uncertainty vis-à-vis enumerator success in securing household interviews relates to the Census Bureau’s ability to hire enough linguistically-competent/culturally-competent enumerators to successfully persuade undecided households to respond. Current management priorities in the Census Bureau are focused on hiring enough enumerators to get the job done and there is less attention to reliably assessing enumerators’ ability to persuade reluctant households that have failed to self-respond to go ahead and consent to an interview with the enumerator.
The SJVCRP survey findings suggest that refusals of enumerators’ interview requests in NRFU may turn out to be higher in 2020 than ever before based not only on apprehension about the consequences of providing information in the course of a census that includes the CQ, but also on survey respondents’ frequent comments that they have learned not to open the door to strangers – due to concerns about a variety of commercial scams and guidance from immigration legal advisors regarding ICE visits.
The clear-cut cases where survey respondents said they would not self-respond but would respond to an enumerator visit were ones where illiterate or low-literate householders presumed an enumerator might “help” them fill out the census form.
10.5NRFU Step 3: Using administrative records to determine household size and composition
Perhaps the greatest challenge is the Census Bureau’s ability to compensate for dramatically increased levels of non-response due to the citizenship question by relying on administrative records to secure information on non-responding households. There are many questions regarding the overall viability of such record-matching and using such records to “enumerate” non-responding households. But, most immediately, households headed by an immigrant who lacks legal status, are widely recognized to be living “in the shadows”, are ineligible for most federal program benefits, and are unlikely to be well-represented in the administrative datasets that have been considered as sources for data on non-responding housing units/ households.
10.5.1Extent to which the census bureau will attempt to use administrative records?
The Census Bureau’s Federal Register Notice regarding its proposed Census 2020 operations states that administrative records will be used to, “enumerate households that did not self-respond and we were unable to contact after six mailings and one in-person field visit” [26]. Consequently, in the neighborhood/community context in the San Joaquin Valley where Latino immigrant households are concentrated, if there is a very low initial response rate and enumerator contacts are difficult due to many adults in households working long hours, there will probably be very heavy reliance on administrative records for “enumeration”.
The Department of Commerce has said in various public statements that the Census Bureau will be able to secure “high quality” administrative records to provide information on non-responding households. However, Census Bureau research over the decade has focused on a specific and justifiable (though possibly flawed) use of administrative records – to identify and eliminate from the NRFU workload housing units that are not occupied, not on use of administrative records as a source of information on household characteristics.
It is only recently that the idea of using administrative records to impute characteristics of entire households was adopted (Wall Street Journal April 3, 2018 story by Paul Overberg and Janet Adamy, “Trump Administration Plans to Check Your Answer On Citizenship Question”). Although there had been some preliminary exploratory research, this element of the Census Bureau’s planning was only introduced after publication of its 2017 Operational Plan where administrative records were to be used to identify vacant housing units. It was not part of the 2018 Census End-to-End Test and is, therefore, almost completely untested.
Although the Wall Street Journal article focuses on Secretary Ross’s announcement that the Census Bureau would refer to administrative records to check the correctness of answers provided by respondents regarding citizenship status, it is obvious that such an endeavor presumes the possibility of record-matching to secure comprehensive household data from administrative records. The U.S. Census Bureau’s Scientific Director, John Abowd, is quoted in the article, referring to Secretary Ross’s statement that Social Security applications would be used for this purpose, as saying that “the Bureau would have to create a statistical model but hadn’t begun to figure out how”.
10.5.2Availability of high quality matching administrative records for Hispanic immigrant households?
The Census Bureau’s own research shows that even in best case scenarios there will be limited availability of administrative records for the kinds of households most prevalent in San Joaquin Valley immigrant communities – because those who are least likely to respond are also those for whom there is least likely to be an administrative record match [27].
Census Bureau researcher Rhenuka Bhaskar and her colleagues explain that matching a household to an administrative record requires a Personal Identification Key (PIK). Bhaskar’s research on administrative records shows that there are much lower levels of PIKs for foreign-born households than US-born populations. Characteristics associated with lacking a PIK include: Number of persons in household, living in a tract where more than 45% of the population is foreign-born, Hispanic race/ethnicity, not being a U.S. citizen, limited English or no English, and being a recent immigrant (
It should also be remembered that Bhaskar’s excellent analysis is based on examination of availability of matching records for households that are ACS respondents. It is more likely that “high quality” matching administrative records are available for the immigrant households that do respond to the ACS than for those that do not – so the ACS-based estimate of availability is probably high.
Optimism about the availability of IRS records for undocumented immigrants is unfounded. The Institute of Taxation and Economic Policy has estimated that about half of all undocumented workers in the U.S. file income tax returns [28]. It is likely that still fewer of the undocumented workers in the San Joaquin Valley – many of whom are farmworkers – are likely to actually file income taxes and, thereby, generate an administrative record with the IRS. IRS records will, therefore, be incomplete. So will Social Security Administration (SSA) records [30]. Immigrant workers who have only been employed in a sector of the underground economy will lack a SSA record. Parents may have never applied for an SSN for foreign-born children who lack legal status. Foreign-born non-working spouses may never have applied for an SSN.
10.5.3Securing “high quality” by matching administrative records with households or housing units?
Bhaskar’s analysis of the availability of administrative records to be used in determining the household size and characteristics examines the Census Bureau’s ability to match an administrative record to a household that has responded to the ACS, not a housing unit. It is difficult to understand how a match could easily be made at all between a non-responding household and an administrative record-based simply on housing unit information.
In the context of NRFU, the Census Bureau must secure a matching administrative record for a non-responding housing unit. Since the Census Bureau’s plan is to rely on an administrative record when there is no response from a household, nothing is known about the household characteristics. All that is available is a non-responding housing unit address.
Similarly, it is entirely unclear how the Census Bureau might propose to assess the quality of an apparent administrative record match based simply on an address. Serious discrepancies can be expected in neighborhoods where low-income renter households move often. Especially in the low-income neighborhoods in the San Joaquin Valley where families may often be forced to move due to cash flow crises stemming from seasonal unemployment, the year-old SSA or IRS record for a household may often not match up with the household currently living at an address.
10.5.4Reliability of apparently high-quality matching administrative records if available?
Presumably, attempts might be made to secure SSA or IRS records to match the address of a non-responding housing unit to an income tax filer or individual in the SSA Numident database if there is a corresponding address on file. But in many cases, especially for undocumented immigrants, the Latino immigrant sub-population most likely to fail to self-respond, respond to an enumerator, or be enumerated via proxy interview, apparently matching Social Security Administration or IRS records will include invalid matches. Moreover, even if a bona fide match is found such records may be out-of-date so that, consequently, newly-born children will be disproportionately omitted.
Moreover, in cases where matching records are available it is unwise to assume that the administrative record will include everyone actually living in a housing unit where the householder has failed to self-respond to the census. The culturally-misguided assumption that all or most immigrant households are reliably profiled in any administrative record system, including the SSA Numident database the Census Bureau envisions using, or IRS records or USCIS records, is a serious source of potential undercount (since administrative records are unlikely to show more people living at an address than actually live there but will often show fewer).
Use of “borrowed” SSN’s is also prevalent in agriculture, a major sector for Hispanic immigrant employment in the San Joaquin Valley. It is common in the agricultural employment sector (and in other immigrant-dominated segments of the labor market) for unauthorized new arrivals to secure a falsified “green card” (often referred to as a mica) or to work using one borrowed from a friend or relative or purchasing one.
Although employer reports of employees’ earnings might be considered a promising dataset and might be available for many immigrants, they provide limited and unreliable information about household size (as defined by the Census Bureau OMB residence rules to refer to everyone living under the same roof – irrespective of economic/social relationships). Here too, attempting to match a housing unit address to a non-responding household will be problematic in areas where there is a good deal of residential mobility. This is a case where reliance on administrative records as a “solution” to non-response would be almost certain to seriously degrade data quality. It is perhaps fortunate that legal barriers would be likely to impede efforts to utilize state records in such an endeavor.
10.5.5The cascade model’s conservatively projected level of Census Bureau success in relying on administrative records for “enumeration”
The cascade model very optimistically assumes that matching administrative records are available and accurate for 80% of the U.S.-born non-responding householders, 70% of the naturalized citizen non-responding householders, 60% of the legal resident non-responding householders, and 30% of the undocumented non-responding householders. However, as discussed above, the Census Bureau’s actual ability to match administrative records to housing units is not likely to actually achieve even this level of success. The SJVCRP survey data show that many of the complex households and unconventional hidden housing units at an address are occupied by undocumented immigrants, making it very unlikely that the landlords or property managers’ administrative records will be available and/or somehow include these economically and socially distinct households as the Census Bureau appears to believe.
The latest Census Bureau estimate is that only about 5% of U.S. households would be enumerated via use of administrative records [30]. This assumption seems optimistic with respect to San Joaquin Valley Hispanic immigrants because levels of self-response and response to enumerators are so low.
Even if administrative records are more readily available for the Hispanic 1
10.6NRFU Step 4: Efforts to secure proxy interview response rate
The Census Bureau’s final Census 2020 Operational Plan is for enumerators to make three attempts to secure proxy interviews from neighboring households if a household has not self-responded, has not responded to an enumerator’s effort to contact them, and if there is no administrative record that can be used to determine the size and characteristics of the household living in the non-responding housing unit.
Proxy interviews are an important component of NRFU. The 2017 GAO report suggests they made up 25% of “enumerations” in the 2016 census tests in Los Angeles and Houston. The 2010 NRFU contact strategy experiment showed that 30% of NRFU interviews after the third contact attempt were proxy interviews. The 2018 End-to-End Test showed that they accounted for 27% of NRFU interviews [24].
The San Joaquin Valley Census Research Project data show that only 11% of the survey respondents would be willing to provide information on neighbors to an enumerator and that more than one-quarter of those who said they would provide information would only provide “some” information on their neighbors – not necessarily all that was asked for. It should also be noted that the SJVCRP survey respondents very often stated that information about neighbors’ households was “private” and that they would risk conflict with neighbors if it became known they had provided information to “outsiders” from an official government agency such as the Census Bureau.
Survey responses also show that, in many cases, even if respondents had been willing to provide information about the neighbors, their knowledge about the size and composition of neighboring households was often limited or non-existent and that it depended about the specific household they might be questioned about. One of the problems in relying on proxy interviews in this context is that households’ knowledge about their neighbors varies so dramatically in relation to residential patterns and social relationships among neighbors in ethnically-diverse neighborhoods.
It is also worthwhile to note that the Census Bureau’s discussion of its procedures for securing proxy interviews is extraordinarily ill-suited to the San Joaquin Valley, apparently being based on assumptions about urban neighborhoods (e.g. enumerators requesting information from local real-estate agents or landlords) [31]. However, Joseph Salvo, New York City’s Demographic Unit Director, for the city’s Planning Department, a leading census expert, recently explained that this sort of effort is not well-suited to urban neighborhoods either.
10.7Enumeration errors in the course of NRFU: Partial household omission in complex households that do self-respond or respond to an enumerator visit
The prevalence of complex households, where non-family members are commonly excluded from census responses by householders means there will be a substantial partial household undercount due to omission of “extra” household members within the complex households that do respond to the census. The rentors providing housing accommodations to non-family members are, typically, quite reluctant to respond to a census that includes the citizenship question; only one quarter (27%) say they are willing to answer. Those who are willing to respond are very likely to not include the “extra” people at their address on the household roster because they are not considered household members.
A problem here is that the OMB/Census Bureau “residence rules” continue to be indifferent to the ways in which cultural concepts of “household” in immigrant communities differs from the official definition. Census form instruction ask respondents to be sure they have remembered to include everyone living in a housing unit (referred to by the Census Bureau as “household”) on their census form. In fact, the prevailing concept of household is that it consists of a core family/budget unit. Other family units living under the same roof are typically distinguished as not being household members. As might be expected, the complex households are large – averaging 5.2 persons; in these households, on the average about 2.9 persons are “extra”, i.e. not core family members
The SJVCR survey provides an estimate of the prevalence of complex housing arrangements in San Joaquin Valley Latino immigrant communities where a householder is willing to respond to a census with the citizenship question – but there remain uncertainties about the extent of partial undercount in these places – since it is not clear whether, in some cases, how many of the “extra” persons living at the place might be included on the primary household’s census response – even though generally they are not.
Analysis of the SJVCRP survey data suggests that there will be variations in partial household undercount relating to social relationships among different family/budget units and individuals – e.g. those sharing housing who are, however, unrelated vs. those who are renting living space. There will also be some overlap between hidden housing units and complex households due to the fact that the landlords who rent out marginal housing who are, for example, farm labor contractors in some cases, vigorously discourage their tenants from answering the census (in some cases as much due to fear of building code or planning department enforcement as worries about immigration enforcement).
The current model assumes that only 20% of the non-family “extra” members in undocumented complex households are included on householders’ census rosters and that the remaining 80% are omitted. In households of legal residents, naturalized citizens, and U.S.-born immigrants it is assumed that only 60% will be left off the household roster.
10.8Statistical efforts after NRFU in-field data collection is complete: Enumeration errors from hot-deck imputation of the size and characteristics of non-enumerated households
An important cause of differential undercount is the unreliability of hot-deck imputation used to determine the characteristics of households that have not self-responded, have not been successfully interviewed by an enumerator, for which there is no “high quality” matching administrative record, and for which a proxy interview could not be completed. In such cases, hot-deck imputation is the last resort for generating the “census count” (actually, estimates for the purpose of tabulation, not “actual enumerations”).
Household size and characteristics of non- responding households are imputed from the characteristics of nearby households that have responded – the “donor pool”. If these households are similar in size, imputations will, at least, provide an acceptable estimate of the census population count. However, if they are systematically different in size, the hot deck imputation process will lead to a systematic undercount of the population residing in non-responding households. Imputation of household demographic characteristics (e.g. number and age of children in the household) will be still more problematic. The problem in this sort of imputation is that the Latino immigrant households that do respond to the census are generally smaller than those that fail to respond as well as the fact that the average San Joaquin Valley non-immigrant household is much smaller than the non-responding Latino households.
One factor contributing to this pattern is that, within the foreign-born Mexican-origin population, the households of naturalized citizens who are the sub- population most willing to respond to the census are substantially older than those of undocumented immigrants, old enough that most of their children have already left home. Among SJVCRP respondents, the naturalized citizens were, on the average, 52 years old while undocumented immigrants were, on the average, 39 years old.
The error introduced through hot-deck imputation will also depend on whether a nearby responding Latino household is chosen as the donor household or whether a non-Latino household is chosen. The San Joaquin Valley Census Research survey shows that the average household size for the non-responding Latino immigrant households is 4.6 persons. This contrasts sharply with overall average household size in the San Joaquin Valley region of 3.19 persons [1]. The relative size of the non-responding and the responding Latino households varies by legal and citizenship status.
10.8.1Estimating the impact of hot deck imputation from relying on responding Latino immigrant households as the source for imputing size and characteristics of non-responding Latino immigrant households
The Cascade Model incorporates estimates of errors introduced by hot deck imputation where a responding Latino immigrant household is the donor for imputing the characteristics of a non-responding household by comparing the average household size of those willing to respond to Census 2020 with the citizenship question and those unwilling to respond based on analysis from the San Joaquin Valley Census Research survey.
Table 1
Coefficients used in the cascade model of undercount for San Joaquin Valley latino 1
| Sources of enumeration errors | 1 | 2 | |||||||
| Census | Undoc. | Legal | Natz. | U.S.-born | |||||
| phase | status | status | citizen | citizen | |||||
| Average size – responding HH’s | Hot-Deck imputation | 4 | .12 | 4 | .11 | 4 | 4 | .57 | |
| Average size – non-responding HH’s | 4 | .55 | 4 | .18 | 3 | .44 | 5 | .35 | |
| # persons loss per HH imputed via hot-deck imputation w/responding | .43 | .07 | .56 | .78 | |||||
| Latino HH as donor | |||||||||
| % population loss per HH – hot-deck imputation w/responding Latino | .5% | .7% | .3% | | .6% | ||||
| HH as donor (PPH/HH size) | |||||||||
| # persons loss per HH – hot-deck imputation using average SJV HH | .42 | .13 | .87 | .16 | |||||
| (3.19 PPH) as donor | |||||||||
| % population loss per HH – hot-deck imputation using average SJV | .9% | 7% | .3% | .4% | |||||
| HH size (PPH/HH size) | |||||||||
| Estimated % loss in HH size due to error in size for HH’s enumerated | Admin records | % | .9% | .6% | .0% | ||||
| via administrative records assuming a loss of 1.5 PPH in | |||||||||
| undocumented HHs and 1 PPH in others. | |||||||||
| Average HH size – responding complex HH | Under-reporting | 5 | .14 | 5 | .35 | 5 | .2 | 5 | .14 |
| Estimated extra persons – responding complex HH | 1 | .2 | 1 | 1 | 1 | ||||
| Est. % loss in HH size in complex HH that do report. Assumes under- | .7% | .5% | .7% | .8% | |||||
| reporting of 80% for UNDOC, 40% for legal residents NATZ and | |||||||||
| USCIT. Av. 1.2 extra persons in UNDOC responding HH’s and 1 | |||||||||
| extra person in LPR, NATZ, USCIT HH’s | |||||||||
The Latino US-born 2
The naturalized citizen headed household not willing to respond are 0.56 persons smaller than those that are willing to respond.
The households of legal residents not willing to respond are 0.07 persons larger than the responsive ones.
Finally, the households headed by an undocumented immigrant not willing to respond are 0.43 persons larger than the responsive ones.
10.8.2Estimating the impact of hot deck imputation from relying on average San Joaquin Valley households for imputing the size and characteristics of non-responding Latino immigrant households
Density of immigrant settlement in the San Joaquin Valley is high – but varies geographically. Due to the fact that communities in the region have a long history of Mexico-U.S. migration, there are low-income neighborhoods with dense settlement of immigrants but, at the same time, immigrant settlement is also dispersed. About one-third of the SJVCRP survey respondents live in census tracts with 27% or more non-citizens, another one-third in census tracts with 20%–27% non-citizens, and the remaining third in census tracts with 20% or less non-citizens.
The cascade model assumes that the donor households for hot-deck imputation will be drawn from areas with a 50/50 mix of Hispanic immigrant and other average-sized households. In the 50% of the cases where a household that is not a Hispanic immigrant one is used as the donor household for imputing the size of the non-responding Latino household the size differential will be greater. The model uses the average San Joaquin Valley household size as the estimated household size for donor households in this case: 3.19 persons per household. In contrast, the mean household size for non-responding households in the Latino survey population is 4.6 persons. Therefore, the size differential in these imputations where an “average” household is the “donor” for imputing non-responding household size is about 1.4 persons per household.
11.Putting it all together: Cascade Model coefficients and components
Below, I provide details on the elements in the Cascade Model that provide the basis for the Cascade Model estimate of the specific undercount rates for the overall San Joaquin Valley immigrant population and sub-populations (defined on the basis of legal and citizenship status) within this population.
Table 2
Modelled cascade of census operations/outcomes for SJV Latino immigrants
| Components in cascade (weighting to adjust each sub-population | Undoc. | Legal | Natz. | U.S.-born | All 1 |
| sample size to proportion in population of 1 | status | status | citizen | citizen | 2 |
| Latino immigrants in region | Wt | Wt | Wt | Wt | (weighted |
| Universe | 100% | 100% | 100% | 100% | 100% |
| HU’s in sampling frame available to enumerate | 95% | 97% | 97% | 97% | 96.5% |
| Projected SJVCR self-response rate (willingness minus 5%) | 22% | 59% | 73% | 44% | 46.1% |
| Enumerated via self-response (% in frame X response rate) | 20.9% | 57.2% | 70.8% | 42.7% | 44.6% |
| Remaining to enumerate | 74.1% | 39.8% | 26.2% | 54.3% | 51.9% |
| SJVCR enumerator HH interview completion rate | 22% | 59% | 73% | 44% | 46.1% |
| Enumerated via direct interview (HH’s not enumerated by | 16.3% | 23.5% | 19.1% | 23.9% | 21.1% |
| self-response X enumerator response rate) | |||||
| Remaining to enumerate | 57.8% | 16.3% | 7.1% | 30.4% | 30.8% |
| Success in securing matching administrative record | 30% | 60% | 70% | 80% | 62.8% |
| “Enumerated” via Admin records (% available matching records X | 17.3% | 9.8% | 4.9% | 24.3% | 16.9% |
| HH’s not enumerated via self-response or direct interview or | |||||
| proxy interview) | |||||
| Remaining to enumerate | 40.5% | 6.5% | 2.1% | 6.1% | 13.9% |
| SJVCR projected proxy interview completion rate | 11% | 11% | 11% | 11% | 11% |
| Enumerated via proxy Interview (HH’s not enumerated by either | 4.5% | 0.7% | 0.2% | 0.7% | 1.5% |
| self-response or direct enumerator interview) | |||||
| Remaining to enumerate | 36.0% | 5.8% | 1.9% | 5.4% | 12.4% |
| “Enumerated” via hot-deck imputation (remainder of HH’s not | 36.0% | 5.8% | 1.9% | 5.4% | 12.4% |
| enumerated in earlier stages of NRFU) | |||||
| Complex HH’s willing to answer despite CQ. % of complex HH’s | 5% | 15% | 7% | 11% | 9.6% |
| willing to answer as % of each legal/citizenship status group | |||||
| Undercount from reliance on out-of-date or inaccurate | 5.7% | 3.5% | 2.2% | 6.8% | 5.2% |
| administrative record (Estimated loss of 1 person/HH X % of | |||||
| HH’s enumerated via admin record) | |||||
| Undercount from bias in hot-deck imputation Assuming 50% of | 7.08% | 0.74% | 0.09% | 1.49% | 2.5% |
| donor HH’s are Latino while 50% of donor HH’s are “average | |||||
| size” SJV HH’s) | |||||
| Undercount from under-reporting in responding complex HH’s | 0.9% | 1.2% | 0.5% | 0.9% | 0.9% |
| (Loss/responding HH) X (% of responding HH’s) Assuming | |||||
| 80% not reported in responding undocumented HH’s), 40% in | |||||
| legal resident, naturalized, and US-born citizen HHs | |||||
| Undercount resulting from housing units omitted from MAF | 5% | 3% | 3% | 3% | 3.5% |
| Cumulative undercount (Sum from all causes of undercount) | 18.7% | 8.4% | 5.6% | 12.2% | 12.0% |
Table 1 shows coefficients used in constructing the Cascade Model-derived from SJVCRP Latino survey data, from review of the likely efficacy of imputation based on administrative records, and from under-reporting in complex households that do respond to the census.
These coefficients are then used to estimate the errors that arise at each stage in the census process and which give rise to undercount at each stage in the course of decennial census data collection and/or imputation.
Table 2 shows the structure of the model. The estimated data collection success rate is shown for each stage in census enumeration (self-response, enumerator direct interview, proxy interview) and imputation (via reliance on administrative records or hot-deck imputation). Success at each stage then determines the remainder of the universe to be enumerated using the next procedure and, eventually estimated using a fallback option. The table then shows the extent to which each component is estimated to contribute to overall undercount for the designated sub-population: undocumented and legally-resident immigrants, naturalized citizens and U.S.-born 2
11.1Weighting of survey sample sub-populations to estimate aggregate Latino immigrant undercount and regional population undercount
The SJVCRP survey, by design, oversampled undocumented immigrants – a sub-population presumed to be impacted by addition of the citizenship question but whose willingness to respond had not been studied explicitly. Also by design, the survey under-sampled 2
12.Practical consequences when differential non-response is transformed into differential undercount
The quest for a fair and accurate national census requires not only national estimates of differential undercount but, robust analyses of undercount in smaller geographic areas, most obviously at the level of the political jurisdictions where compromised census accuracy has the greatest impact on equity – counties, sub-state regions and municipalities where differential undercount is higher than in other areas. The Cascade Model’s projection that the level of Hispanic immigrant undercount in the San Joaquin Valley region might be around 12% if the citizenship question is added to Census 2020 is very serious.
This level of undercount would lead to omission of about 4.1% of the region’s entire population, about 190,000 Hispanic residents of the region. These omissions would, of course, also affect the overall demographic profile of the Hispanic population, skew the racial/ethnic profile of the region, result in a loss of about $280 million per year in census-driven federal funding, and compromise efforts by California’s Citizens Redistricting Commission to draw racially equitable districts.
The cascade model’s projection of the likely magnitude of differential undercount within Latino immigrant communities, even if refinements are required, underscores the need to use ethnographic research, augmented “triple enumeration” survey research similar to that used in the 1986 TARO Causes of Undercount Survey and demographic analysis (DA) in addition to dual-system estimation (DSE) to provide a reliable estimate of differential undercount if Census 2020 includes the citizenship question.
13.Conclusions
The Cascade Model presents a likely scenario regarding differential undercount of sub-populations within the overall Latino 1
These insights provide guidance for strategic efforts to improve census data quality. Because they take into consideration “structural” and operational causes of undercount they can be used to optimize planning – e.g. underscoring the value of Summer, 2019 in-field address canvassing (to improve the MAF), suggesting the need for expanded U/L (update-leave) operations (to improve mail delivery of census invitations, forms, and NRFU), and to enhance the potential of messaging about census data confidentiality directed specifically to landlords.
There remain uncertainties regarding eventual undercount stemming from unknown factors relating to Census Bureau implementation of census operations in the region such as adequacy of NRFU funding, ability to hire linguistically competent enumerators, density and effectiveness of questionnaire assistance centers to assist in NID processing. There are also uncertainties as to whether the CBAMS-based estimate of the relationship between expressed willingness to respond to a citizenship question and eventual response (either self-response or response to an enumerator contact) will turn out to be correct. Moreover, the SJVCRP analysis of survey respondents’ perspectives on response to a census with a citizenship question suggest that responsiveness will not be affected by Census Bureau messaging as much as by overall federal government stance toward immigrants.
Analytically, there also remain some uncertainties as to the exact proportions of 1
The current refinement of the initial Cascade Model prototype developed in the SJVCRP also has included examination of two alternative scenarios to rapidly explore the sensitivity of the Cascade Model to key coefficients. One scenario assesses projected differential undercount assuming a level of self-response and response to enumerator interviews that is 15% higher than the SJVCRP survey findings indicate for undocumented respondents, 10% higher for legal non-citizens, unchanged for naturalized citizens (whose response rate is already relatively high) and a 15% higher response rate for the 2
It is interesting to note that the SJVCRP survey-based estimate of differential undercount of Latino immigrants in the San Joaquin Valley, as well as the two alternative scenarios, are consistent with analyses of the relationship between mail return rate and differential undercount observed in the decennial censuses conducted in 1990, 2000, and 2010. Analyses of published reports of historical mail return rates and differential undercount (as measured via dual-system estimation) in these censuses show that the ratio of mail return/differential undercount for Hispanic, Asian, and Black populations varied from one census to another but that lowered self-response was consistently translated into differential undercount.
The initial problem identified in the SJVCRP survey findings – serious and variable decrease in self-response, enumerator response, and proxy interview response among sub-populations of Latino immigrants resulting from reluctance to participate in a survey with a highly sensitive question cannot be sidestepped by recourse to procedures such as matching administrative records and hot-deck imputation in order to compensate for non-response. The Cascade Model’s articulation of the dynamics of differential undercount in an ethnically, socioeconomically, and socio-politically diverse region such as the San Joaquin Valley shows there are a number of lessons to be learned for future census planning – in the United States and in other countries. “Modernization” that fails to adequately assess the implications of sociological diversity in 21
Furthermore, in the United States, low levels of self-response exacerbated by inclusion of a citizenship question generally viewed as part of a multi-stranded government program targeting immigrants will almost inevitably lead to differential undercount not only between racial/ethnic groups but, also, within a large racial/ethnic group – Hispanics – where responsiveness and opportunities to respond are linked to legal status as well as English-language ability, living arrangements, and neighborhood context.
The SJVCRP survey data also strongly suggest that U.S. Census Bureau reassurances making reference to difficult-to-understand data disclosure avoidance procedures and/or Title 13 protection of confidentiality will have limited effectiveness in decreasing the prevailing perception in the Latino immigrant community that census participation is risky and that responses may have negative consequences. Census questionnaire fields requiring respondents to provide household members’ names, together with information on citizenship, are seen as being an indication that supposedly confidential household information might be used by immigration authorities and a constantly-recurring theme is the idea that if the purpose of a decennial census is to count the population, why are there so many queries about “personal” information – to householders and (in proxy interviews) to their neighbors.
There are tremendous statistical risks inherent in adding a sensitive question related to the legal and citizenship status of foreign-born residents to the decennial census. This makes such a decision and the subsequent assurance that there can be adequate methodological compensation for low and uneven census participation irresponsible.
An important implication for countries throughout the world is that at least some of the challenges encountered in census-taking in culturally and socioeconomically diverse communities with concentrations of immigrant households can and should be foreseen. Migration is ubiquitous globally and, particularly in recent decades, newly-arriving immigrants in many countries lack socioeconomic and/or sociopolitical inequity. In these countries, as is shown with the data from the survey of California’s San Joaquin Valley Mexican and Central American immigrants, real and/or perceived lack of equity and consequences of providing information to the government will suppress cooperation with standard data collection procedures.
Notes
1 More than one-third (37%) of the SJVCRP respondents have only an elementary school education and speak little or no English.
2 Census Bureau research on use of administrative records has focused primarily on using such records to reduce NRFU workload (and cost) by identifying vacant housing units that do not need to be enumerated.
3 This 2012 analysis also reports that the overall level of poverty in the region was almost 150% of the national average (20.4% in the region vs. 14.2% nationally). Moreover, 25.6% of immigrant households fell below federal poverty levels.
Acknowledgments
The author would like to thank J. Gregory Robinson for his insights and sharing of analytic expertise which have been particularly valuable in my efforts to develop the cascade model described in this paper. The contributions made by my colleagues in the San Joaquin Valley Census Research Project have also been crucial – Richard Mines, the primary data analyst for the study and Cindy Quezada, who led the in-field survey research team, working on an extraordinarily challenging schedule. My thanks go out to the survey interviewers who travelled throughout the San Joaquin Valley to interview immigrants throughout the region.
References
[1] | Selected Social Characteristics in the United States. 2013–2017 American Community Survey 5-Year Estimates (DP-02). Available from: https://factfinder.census.gov/faces/tableservices/jsf/pages/productview.xhtml?pid=ACS_17_5YR_DP02&src=pt. |
[2] | Warren R, Warren JR. Unauthorized immigration to the United States: annual estimates and components of change, by state, 1990–2010. International Migration Review. (2013) ; 47: (2). |
[3] | Trevelyan E, Gambino C, Gryn T, Larsen L, Acosta Y, Grieco E, et al. Characteristics of the U.S. population by generational status: 2013. Current population survey reports, Washington, DC: US Census Bureau, (2016) . 37. Report no.: 23-214. Available from: https://www.census.gov/libary/publications/2016/demo/p23-214.html. |
[4] | Kissam E, Mines R, Quezada C, Intili J, Wadsworth G. San Joaquin Valley Latino immigrants: implications of survey findings for Census 2020. San Joaquin Valley Census Research Project. Sacramento, CA: (2019) . Available from: https://www.shfcenter.org/San-Joaquin-Valley-Census-Research-Project. |
[5] | Wadsworth G, Kissam E, Quezada C, Intili J. Troubled reflections: Latino immigrants thinking about Census 2020. Census Research Project. Sacramento, CA: (2019) . Available from: https://www.shfcenter.org/San-Joaquin-Valley-Census-Research-Project. |
[6] | Velkoff V. Presentation on 2019 census test. Program Management Review Meeting, U.S. Census Bureau. Washington, DC: (2019) . Available from: https://www2.census.gov/programs-surveys/decennial/2020/program-management/pmr-materials/02-01-2019/pmr-2020-slides-2019-02-01.pdf. |
[7] | De La Puente M. Using ethnography to explain why people are missed or erroneously included by the Census: the evidence from small area ethnographic studies. Center for Survey Methods Research, U.S. Census Bureau. Washington, D.C. (1993) . Available from: https://www.census.gov/srd/papers/pdf/mdp9501.pdf. |
[8] | Vigil JD. Affidavit submitted in City of New York et al. v. United States Department of Commerce et al. New York, NY: (1988) . October 22. |
[9] | Bourgois P. Hypotheses and analysis of concealment in the underground economy: the economic and idealogical dynamics of the census undercount. Research Institute for the Study of Man, Final Report for Joint Statistical Agreement 88–24. Washington, DC: (1990) . Available from: https://www.census.gov/srd/papers/pdf/ex90-06.pdf. |
[10] | Fein DJ, West KK. The sources of census undercount: findings from the 1986 Los Angeles test census. Survey Methodology, (1988) December. |
[11] | Fein DJ. The social sources of census omission: racial and ethnic differences in omission rates in recent censuses, Ph.D. dissertation, Princeton University. Princeton, NJ: (1989) . |
[12] | West K, Fein DJ. Census undercount: an historical and contemporary sociological issue. Sociological Inquiry. (1990) . 60: (2). |
[13] | Kissam E. Census enumeration of immigrant communities in rural California: dramatic improvement, but challenges remain. Conference on hard-to-count populations. American Statistical Association, (2012) . |
[14] | Salvo J, Arun PL. Misclassifying New York’s hidden units as vacant in 2010: lessons gleaned for the 2020 Census, Population Research Policy Review. (2013) . |
[15] | Government Accountability Office. 2020 Census: Additional steps needed to finalize readiness for peak operations, Washington, DC (2018) . December. Report no.: 19-140. |
[16] | Joint Center for Political and Economic Studies. Place Matters For Health in the San Joaquin Valley: Ensuring Opportunities for Good Health For All. Washington, DC: (2012) . March. Available from: http://www.fresnostate.edu/chhs/cvhpi/documents/cvhpi-jointcenter-sanjoaquin.pdf. |
[17] | Kissam E, Quezada C, Intili J. Community-based canvassing to improve the Census Bureau’s master address file: California’s experience in LUCA 2018. Statistical J of the International Association of Official Statistics. (2018) . 35(Dec.). |
[18] | U.S. Census Bureau, Census 2020 operational plan. Washington, DC: (2018) . December 31. Available from: https://www.census.gov/programs-surveys/decennial-census/2020-census/planning-management/planning-docs/operational-plan.html. |
[19] | McGeeney K, Kriz B, Mullenax S, Kail L, Walejko G, Vines M, et al. 2020 Census barriers, attitudes and motivators study survey report. U.S. Census Bureau. Washington, DC. January 24, (2019) (v2.0). |
[20] | Federal Register Notice. Request for comments on American Community Survey methods panel tests, 2019 Census Test. February 25, (2019) . 84(37). OMB Control Number: 0607–0936. |
[21] | Mule T. 2010 Census coverage measurement estimation report: summary of estimates of coverage for persons in the United States. Census coverage measurement memorandum series #2010-G-01, May 22, (2012) . Available from: https://www.census.gov/coverage_measurement/pdfs/g01.pdf. |
[22] | Goldenkoff R. Progress report on preparations for Census 2020. Government Accountability Office. Washington, DC. November 16, (2016) . Report no.: 17-238T, |
[23] | Government Accountability Office. 2020 Census: additional actions could strengthen field data collection efforts. Washington, DC. January, (2017) . Report no.: 17-191. |
[24] | Government Accountability Office. Additional steps needed to finalize readiness for peak operations. Washington, DC: (2018) . December. Report no.: 19-140. Available from: https://www.gao.gov/assets/700/695898.pdf. |
[25] | Compton E, Bentley M. 2010 Census contact strategy non-response follow-up (NRFU) experiment. Decennial Census Division, U.S. Census Bureau. Washington, DC: (2012) . February. Final Report. 2010 Census Planning Memoranda Series. Report no.: 174 |
[26] | Federal Register, June 8, (2018) . 83 (111). page 26643. |
[27] | Bhaskar R, Fernandez L, Porter S. Assimilation and coverage of the foreign-born population in administrative records. Statistical J of the IAOS. (2018) . 34: (2). 191–201. Available from: https://content.iospress.com/download/statistica-journal-of-the-iaos/sji170386?id=statistical-journal-of-the-iaos%2Fsji170386. |
[28] | Gee L, Gardner M, Wiehe M. Undocumented immigrants’ state and local tax contributions, Institute on Taxation and Economic Policy. Washington, DC: February, (2016) . |
[29] | National Academies of Sciences, Engineering, and Medicine (2019) . Improving the American Community Survey: Proceedings of a Workshop. Washington, DC: The National Academies Press. https://doi.org/10.17226/25387. |
[30] | U.S. Census Bureau. Submission for OMB clearance for the 2020 Census – request for comments, December 28, (2018) . Available from: https://www.federalregister.gov/documents/2018/12/28/2018-28164/submission-for-omb-review-comment-request. |
[31] | U.S. Census Bureau. Proposed information collection: comment request; 2020 Census. (2018) . June. Ref. no.: 2018-12365. Available from: https://www.federalregister.gov/documents/2018/06/08/2018-12365/proposed-information-collection-comment-request-2020-census. |


