
Reconciling conflicting cross-border data sources for updating national accounts: The cross-entropy econometrics approach
Abstract
The aim of the article is to introduce an efficient approach of combining data from various sources and to compare the results with traditional techniques used in official statistics. We used the power law-related Kullback-Leibler information divergence method, known to generalize Shannon entropy, to solve nonlinear, ill-posed inverse problems through the Bayesian philosophy.
The proposed model is based on data from the most important cross-border point between Poland and Germany. Compared with traditional statistics techniques, this method produced a higher level output significance in the case of Polish balance of payments (BoP) estimation. Because of the universal character of this procedure, it can improve national accounts estimation, especially for small countries, more sensitive to cross-border processes.
1.Introduction
Worldwide, we can observe intensification of both socioeconomic integration and disintegration pro- cesses. In the case of Europe, this is due, on the one hand, to the expansion of the Schengen area, the Three Seas Initiative, and increased Euro-regional activity, and, on the other hand, to the long-term political and economic destabilization in the eastern countries of Europe and the vast scale of migrants, mainly from Asia and Africa.
To a great extent, these phenomena relate to border areas. Despite local, regional, and national development factors, spatial units located near the border are under strong influence from foreign spatial units. The asymmetry of socioeconomic potential triggers specific interaction. This differentiates these border areas from their regional specificity, making them distinct objects of surveys. These arguments have inspired some researchers to suggest cross-border (trans-border) economics as a new scientific sub-discipline [7]. Cross-border processes are not only of regional significance, but in geographically smaller countries they also have strategic political and macroeconomic importance [18]. Official statistics systems operating in many countries do not sufficiently take into account the specificities of cross-border areas.
Table 1
Selected characteristics of surveys
| Characteristics | Survey type | Sample design | Data collection | Countries | |
|---|---|---|---|---|---|
| Selected surveys | Frame | Sample selection | techniques | ||
| techniques | |||||
| Household survey | Sample survey | Yes | Simple random | CATI, CAPI, | Ireland, Italy, Portugal, Poland, Bulgaria, Czech |
| Sampling with | CAWI, PAPI | Republic, Romania, Slovakia, Netherlands, | |||
| stratification | Cyprus, Finland, Switzerland, Germany, Croatia, | ||||
| Luxembourg, Slovenia, Austria, Spain, Latvia, | |||||
| Czech Republic, Estonia, Portugal | |||||
| EU’s external border | Sample survey | No | Systematic sampling | PAPI | Poland |
| Vicinity of the border | Sample survey | No | Purposive | CAPI, PAPI | Bulgaria, Lithuania, Latvia, Hungary, Poland, |
| (EU’s internal borders) | Slovenia, France | ||||
| Border traffic survey | Sample survey | No | Simple random | PAPI | Poland |
| Sampling | |||||
| Register | – | – | – | France, Spain, Lithuania, Norway, Poland | |
Source: Own.
There is an urgent need to build a unified information infrastructure for these areas. The prerequisite for the creation of this infrastructure is primarily the inventory of information resources and the creation of a methodology for combining various extra-statistical sources of data (e.g. web scraping, data from road sensors, mobile telephony, credit cards) with sample surveys and Big Data (BD) for the development of experimental results. Due to their ergodic character, most existing statistical research methods cannot accurately reflect the complexity of non-linear phenomena; therefore, a new approach should be sought.
This paper presents an experiment concerning the reconciliation of figures from two different data sources using the non-extensive cross-entropy econometrics (NCEE) technique and the influence of the experiment results on the Polish BoP. Data sources, presented in Section 4, include high frequency data (BD) concerning the traffic on the Polish-German border and low frequency weighted data from the survey of vehicles by country. The crossings of the Polish-German border represent about 50% of the whole number of crossings in Poland. The NCEE method allows for combining various conflicting data sources plausibly governed by different distribution laws (BD, sample surveys, administrative registers, etc.). Through the entropy filter, the combining procedure delivers the hidden statistical, detailed information concerning cross-border movement processes. Because of the fact that level of expenditure of residents and foreigners in BoP is estimated based on the traffic volume, the applied methodology has changed the scale of national accounts estimation.
In order to allow the reader to understand the context of the proposed statistical approach, Section 2 presents a short review of survey systems on cross-border related trips through different EU countries. Section 3 introduces the NCEE, that is a power law (PL) generalized Kullback-Leibler statistical information measure under the maximum entropy principle [15]. Section 4 synthetizes the model outputs and presents one possible impact on national accounts. The last Section provides concluding remarks.
2.A short review of systems for surveys on cross-border related trips in European Union countries
Before presenting advantages of the NCEE as a coherent multi-module statistical approach, we present below a brief overview of the existing surveys conducted in many countries, in households and at borders, as well as in the vicinity of the borders.
Surveys at border crossing points are conducted using various interview techniques with tourists entering and/or departing by road, rail, air, and sea. Surveys are conducted with different frequency: monthly (e.g., Bulgaria), quarterly (Lithuania, Latvia, Hungary) or even every few years (e.g., Slovenia). To estimate border traffic, data from sensors at road crossings (e.g., Spain, Lithuania, Norway), data from toll stations, and data from seaports, airports, and international railway carriers (Spain) are used. Countries that border countries outside the Schengen area also receive data about the number of people crossing borders from border guards or police (e.g., Spain, Romania, Hungary). There exists an array of approaches applied across different EU countries to capture the movement of people who cross borders. Table 1 summarizes these types of surveys and statistical techniques.
In some European countries such as France, Spain, Germany, or Great Britain, special attention is paid to the creation of a multi-module system for surveys on trips as a response to the huge scale of migration.
Table 2
Polish-German cross-border traffic statistical configuration
| Bus | Truck | Car to 15 persons | Others | Total (from statistical survey) | |
|---|---|---|---|---|---|
| Country#1 | a | a | a | a |
|
| Country#2 | a | a | a | a |
|
| … | … | … | … | … | … |
| Country# (K-1) | a | a | a | a |
|
| Country# (K) |
| a | a | a |
|
| Total (from road detector) |
|
|
|
|
Source: own.
3.NCEE as an approach to solving nonlinear ill-posed inverse problems (NIIP)
In this section we briefly present the essence of the non-extensive cross-entropy econometrics (NCEE) technique. For more details concerning this approach, see, e.g., [2, 3]. The approach will be applied to solve a NIIP related to density of vehicles – per category and origin – crossing the Polish-German border points. Before presenting the model outputs, let us comment on two key concepts presented in this section: NIIP and NCEE.
3.1Cross-border traffic as NIIP
Technically, we deal with an ill-posed inverse problem [21] when the number of observed data points is lower than the number of unknown mapping noisy points11 to be estimated. Using simplified words, a direct problem is one for which we know the causes (parameters, unknowns), and we are asked to compute the effects (data, observation), having in mind that the same causes lead to the same effects. In the case of an inverse problem, we are given the effect and asked to reconstitute the true random cause [14] among different possible ones, suggesting that the problem may be undetermined. When there is no uniqueness or stability of solutions due to, for example, a noisy observed effect, we are dealing with an ill-posed inverse problem. Among the areas where inverse problems elicited substantial interest in the past [19] are medical imaging, radar and underwater acoustics (determining the shape of an obstacle), petroleum engineering. The ubiquity of ill-posed inverse problems in real life goes beyond the natural sciences and includes manmade systems, the complexity of which may explain, for example, the lack of consensus in phenomena in the social sciences.22 Nonetheless, explicit ill-posed inverse problem application in the social sciences is much more recent.
For almost a century, mathematical and statistical tools devoted to the generalized ill-posed inverse problem recovery system have been proposed in diverse fields of science aimed at, among other things, model parameter recovery. Besides the well-known Tikhonov regularization theory [21], the Gibbs-Shannon-Jaynes [13] maximum (minimum) entropy principle and its recent extensions [22, 2] remain the most used techniques for solving this class of problem.
Let us now consider the case of the Polish-German cross-border traffic case and propose an explicit model. While the German road sensors produce high frequency data (BD) on the traffic by type of vehicle, Poland statistics provides quarterly, low frequency weighted survey series on vehicles by country of origin without specifying the type of vehicle. Obviously, both types of data may represent different data generating systems. Then, combining them could lead to statistical inconsistencies, and overcoming this usually requires additional, simplifying hypotheses. Suggesting that data produced by road sensors display BD characteristics deserves a clarification. In fact, as noted in, e.g. Sivarajah [20], the lack of a clear definition of BD may impact the analytical technique to be applied to produce the information sought. In spite of recent progress, the concept of BD remains evasive (e.g., [11]) since its characterization as data volume is relative and varies due to underlying factors, such as the type of data and time involved. In this paper, we follow Laney [17] and consider that Volume, Variety, and Velocity (or the Three V’s) are the three basic dimensions of the challenges in data management. As such, we consider the first data source described above as a BD source while we do not consider the second source of quarterly data from survey techniques a BD source. For reasons of space, the table containing the original values has not been fully presented in this article.33 Tables 2 and 3 represent its prototype and mimic the same structure. Not reported numerical values in Table 2 constitute priors in the model presented below. Comparing the two above sources of data, the totals of vehicles from the survey sampling for the first quarter are available for each country (25 countries plus others) in the last column (
We notice a significant difference between column and row totals with
Among very large joint probabilistic configurations related to matrix
3.2NCEE: The canonical model-based estimator
Through this section, we present and comment on just the main blocks of the NCEE model so as to enable readers to interpret the outputs shown in the next section. NCEE generalises the traditional Shannon-Kullback-Leibler-Jaynes-Golan (Shannon, July & October 1948) [16, 15, 13] based cross-entropy econometrics to PL-related non-ergodic systems, thus suggesting nonlinear complex phenomena. What is important to underscore is that certain types of series keep displaying PL even when aggregated at low frequency (e.g., year scale). Final distribution will result from two independent forces in action: PL and Gaussian C-Limit Theorem (Gabaix, Winter, 2016). Readers interested in more details about the NCEE empirical implementation for similar purposes are referred to, e.g. Bwanakare [4] or Eurostat [10]. The model is formulated as follows:
(1)
s.t.:
(2)
(3)
(4)
(5)
(6)
(7)
where:
Above,
where symbols in this relation are presented in Table 2. In other terms, by dividing the above particular
When any unknown parameter values are not all constrained between 0 and 1, this suggests the necessity for reparametrization. As a general case, let us suppose that such parameters are
where
The minimum cross-entropy principle is a strong hypothesis. Moreover, NCEE can be cast, like Shannon-based cross-entropy (e.g., [13]), into the Bayesian efficient information processing rule. Thus, though priors may be relatively weak, the maximum entropy principle will quickly tend to lead the system towards the global optimum, thereby generating posteriors closer to the optimal solution [13].
Since we are dealing with cross-entropy model formulation, given the prior information (explained through
The cross-entropy principle represents a certain form of the generalization of maximum entropymaximum entropy. The above q-generalized Kullback-Leibler Eq. (3.2) has the same basic information measure properties as the standard Kullback-Leibler entropy and can be used for the same purpose [22]. In empirical applications, the value of the q-Tsallis should vary inside an interval from unity to 5/3, which corresponds to cases of finite variance for phenomena dwelling within the Gaussian basin of attraction. The higher the q-Tsallis parameter value, the more complex the system with respect to Gaussian distribution. In particular, when the q-Tsallis parameter converges to unity, outputs derived from NCEE and the Gaussian-related Shannon entropy also converge. Hence, NCEE generalizes traditional Shannon entropy. This explains the choice of NCEE for solving the problem presented in this paper.
As far as the model statistical inference is concerned, information properties and the above formulation of NCEE show that the model inference information indexes should fulfil the basic Fisher-Rao-Cramer information index properties, among them, continuity, symmetry, maximum, and additivity.
4.Model outputs and macroeconomic impact
4.1Data sources
The data sources are three sample surveys and road sensors (BD). Data concerning border traffic and the expenditure of residents and non-residents (foreigners) at the Polish-German border and in its vicinity are from the following sample surveys: (a) survey of border traffic; (b) survey questionnaire of trips and expenditure of foreigners in the vicinity of the border; (c) survey of residents in households.
Data concerning border traffic at the Polish-German border are from the sample survey of border traffic. The border traffic survey covers persons and vehicles crossing the Polish border with the countries of the European Union at selected road border crossings. The number of vehicles crossing the border, the country of vehicle registration, and the number of persons travelling in these vehicles are registered. It is conducted on a sample of about 1.14% of the total number of vehicles crossing the borders.
An additional source of data comes from road sensors which are managed by the German Federal Highway Research Institute (Bundesanstalt für Straßenwesen). Data contain hourly information on type and number of road, test dates, traffic direction, and vehicle type. The automatic measurement is carried out using accurate measuring devices installed on motorways and federal roads, which record data throughout the year with an overall accuracy of more than 99%.
Another important data source is a sample survey of trips and expenditure of foreigners in the vicinity of the border. Due to the lack of the survey frame, this survey is conducted on an “elusive” population.44 This is a questionnaire survey conducted in the vicinity of selected border crossings using the direct interview method. Individuals are surveyed by means of a systematic sampling. The survey is conducted on 7 selected days. It is conducted on a sample of about 0.1% of the total number of foreigners coming to Poland in a given quarter. The survey covers expenditure incurred by non-residents on the purchase of goods and services, purpose and duration of stay, frequency of crossing the border, etc.
Data concerning trips and expenditure of residents come from the sample household survey. This survey covers expenditure incurred by residents on the purchase of goods and services, purpose and duration of stay, frequency of crossing the border, etc. Households for the survey are selected at random from a census sampling frame by two-step sampling with stratification on the first step (strata were defined by sub-regions and size classes of towns). It is conducted on a sample of about 0.14% of the total number of households in Poland. The questionnaire survey is carried out in quarter periods. The results are used by the Polish National Bank for the BoP, as well as by Poland Statistics and the Ministry of Sport and Tourism for tourism statistics.
On the basis of the sample survey of border traffic (movement of vehicles and persons) the volume of border traffic of residents and non-residents is estimated in quarterly periods at the Polish-German border. Then, weights are determined for particular border crossings, proportionally to the volume of traffic at each of them. In the next step the sample survey of trips and expenditure of foreigners is used. Each questionnaire of this survey is given its own weight, depending on the border crossing in the vicinity of which it was collected. In this way, a generalised number of trips of foreigners arriving to Poland and expenditure they incurred are obtained.
Data concerning border traffic at the Polish-German border are from the following surveys: sample survey of border traffic and data from road sensors, which record data throughout the year with an overall accuracy of more than 99%.
4.2Outputs and comments
The outputs reported in Table 3 of such an inverse ill-posed problem have been computed using the GAMS code (General Algebraic Modelling System). Thanks to the model (Eqs (3.2)–(7)), we estimated unknown posterior quantities
Table 3
Post cross-entropy disaggregated outputs about the Polish-German cross-border traffic
| Bus | Truck | Car_to15 pers | Other cars | Total (from statistical survey) | |
|---|---|---|---|---|---|
| Austria | 2 | 127 | 222 | 5 | 356 |
| Belgium | 3 | 165 | 289 | 6 | 462 |
| Belarus | 1 | 89 | 156 | 3 | 249 |
| Croatia | 0 | 13 | 22 | 0 | 36 |
| Denmark | 0 | 25 | 44 | 1 | 71 |
| Estonia | 0 | 25 | 44 | 1 | 71 |
| France | 8 | 506 | 890 | 19 | 1,423 |
| Spain | 2 | 127 | 222 | 5 | 356 |
| Lithuania | 34 | 2,227 | 3,914 | 85 | 6,260 |
| Latvia | 4 | 240 | 423 | 9 | 676 |
| Netherlands | 22 | 1,468 | 2,580 | 56 | 4,126 |
| Germany | 467 | 30,463 | 53,528 | 1,157 | 85,615 |
| Poland | 2,389 | 155,922 | 273,980 | 5,921 | 438,212 |
| Portugal | 0 | 25 | 44 | 1 | 71 |
| Czech Republic | 27 | 1,747 | 3,069 | 66 | 4,909 |
| Russia | 6 | 380 | 667 | 14 | 1,067 |
| Romania | 1 | 38 | 67 | 1 | 107 |
| Slovakia | 14 | 924 | 1,623 | 35 | 2,597 |
| Switzerland | 4 | 266 | 467 | 10 | 747 |
| Sweden | 0 | 25 | 44 | 1 | 71 |
| Turkey | 0 | 25 | 44 | 1 | 71 |
| Ukraine | 13 | 873 | 1,534 | 33 | 2,454 |
| Hungary | 1 | 63 | 111 | 2 | 178 |
| United Kingdom | 10 | 645 | 1,134 | 25 | 1,814 |
| Italy | 2 | 139 | 245 | 5 | 391 |
| Others | 1,128 | 73,633 | 129,384 | 2,796 | 206,941 |
| Total (from roaddetector) | 4,140 | 270,180 | 474,750 | 10,260 |
Source: own.
In his work [5], the author proposed a non-negative information index
4.3Impact on the balance of payments
The BoP on the current account, which covers, among other things, transactions in services, includes items related to expenses of non-residents during a visit to a given country and residents of that country during a visit abroad. Note that revenue from non-residents’ trips accounts for 10.7% of revenues on the current account as a whole in 28 European Union countries.
The Polish-German border is the main European transport corridor between west and east with the largest traffic in Poland. We choose for the analysis the border crossing in Jędrzychowice, one of the 27 border crossings with Germany, where border traffic constitutes approximately 20% of border traffic for the entire Polish-German border.
Table 4
Crossings at the Jędrzychowice border point in the first quarter of 2015
| Total | Poles | Foreigners | |
|---|---|---|---|
| Sample surveys | 1,523,390 | 934,708 | 588,682 |
| Combined sources (sample | 2,221,627 | 1,395,255 | 826,372 |
| surveys and BD) | |||
| Difference in % | 145.8 | 149.3 | 140.4 |
Source: own.
Figure 1.
Assessment of expenditure of Poles and foreigners crossing the Polish-German border based on combined sources in Q1 2015.
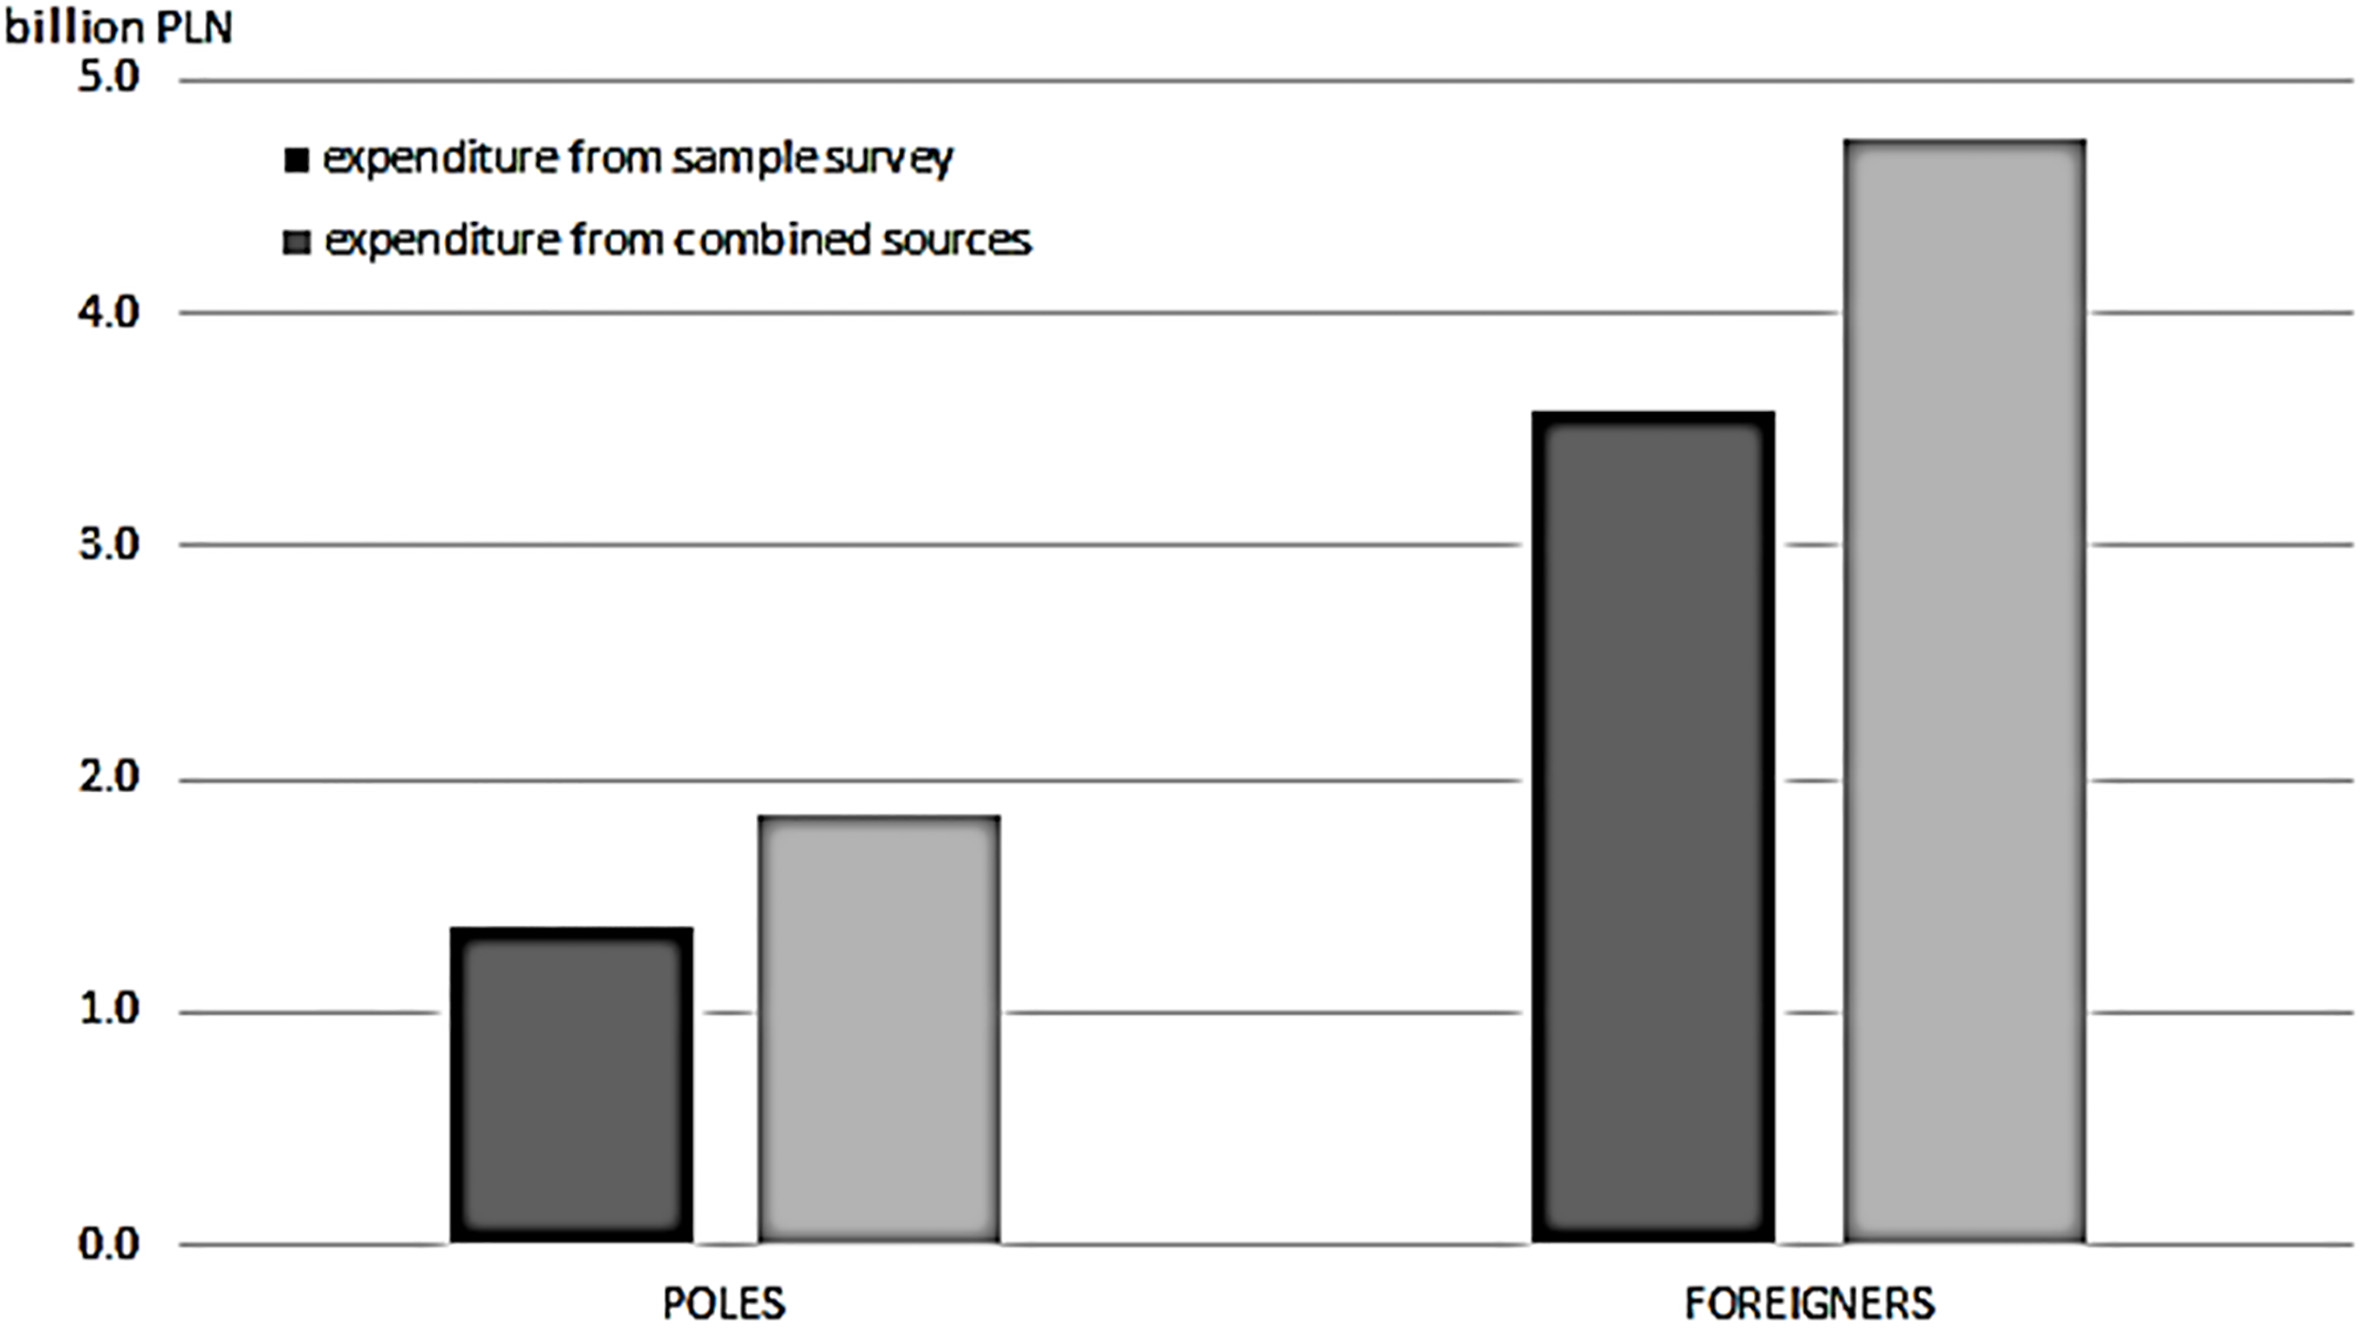
Figure 1 shows the difference between expenditure of Poles and foreigners at the Polish-German border based exclusively on the sample surveys and on combined information sources (sample surveys plus data from road sensors).
For further analysis, a correction regarding the scale of crossings at the Jędrzychowice point for both Poles (an increase of 49.3%) and foreigners (an increase of 40.4%) was adopted and applied in appropriate proportions to the change of border traffic at the whole Polish-German border. This type of calculation could be made because the structure of vehicle crossing at the Polish-German border is similar at key crossing points.
Next, let us briefly describe how the above crossing volumes are related to expenditures by foreigners and by Poles. In the case of foreigner expenditures, the sample survey of trips and expenditure of foreigners is used. Each questionnaire of this survey is given its own weight, depending on the border crossing in the vicinity of which it was collected. In this way, a generalised number of trips of foreigners crossing the Polish-German borders and expenditures they incurred are obtained (PLN 502/foreigner).
In the case of residents, the number of trips and the volume of expenditure are estimated on the basis of the sample survey of residents in households and the sample survey of border traffic. The sample survey of residents in households uses a questionnaire, which contains information about the name of the border crossing, among other things. Based on this information, the questionnaire is assigned an appropriate weight, which is calculated based on the sample survey of border traffic. Therefore, the average expenditure of residents for a given border crossing is calculated on the basis of collected household questionnaires. In this way, the total number of trips made by residents going abroad and the expenditure they incurred in connection with these trips are obtained (PLN 304/resident).
Thus, taking into account the updated outputs summarised in Table 2 or in Table 4, we observe a difference of almost 35% in the case of expenses made by Poles. This difference is almost 33% in the case of foreigners. It is worth noting that the balance of expenses made by foreigners and Poles crossing the Polish-German border constitutes nearly 50% of this balance for the whole country. Considering these facts, it should be assumed that a change in the research methodology has brought a difference in the estimation of the BoP in the first quarter of 2015 for the Polish-German border of about 31% while in the case of the whole country of over 14%.
5.Concluding remarks
The cross-entropy estimator presented here turned out to be very useful in this research in comparison with the standard approach based on the sample survey. The difference in the estimation of the BoP is around 14% in the case of all of Poland. We also cannot forget that due to seasonality, the scale of border crossings in the first quarter is slightly lower. Through Table 3, we recovered an initially unknown quantitative picture about the type of vehicle crossing at the Polish-German border from each of different EU countries. This allowed a precise calculation of the resident-foreigners expenditure balance. From the statistical point of view, it is worth noting that in this study NCEE does not require BD to dwell within the normal distribution attractor. Thus, this approach could be viewed as a valuable device of a coherent research system for cross-border areas. What is crucial is that this approach could significantly change the national account outputs in many countries, especially in small countries entirely under the influence of cross-border processes.
Notes
1 In the present study, these points represent the traffic by country origin and type of vehicle.
2 e.g., this may be illustrated by the multiplicity of different schools of economic thought in explaining macroeconomic phenomena.
3 Nevertheless, this information can be provided to the interested reader upon demand.
4 L. Kish (1991), A taxonomy of elusive populations, Journal of Official Statistics, 7, 339–347.
References
[1] | Braaksmaa, B., Zeelenbergb, K., (2015) . Re-make/Re-model: Should big data change the modelling paradigm in official statistics. Statistical Journal of the IAOS. 31: : 193–202. |
[2] | Bwanakare, S., (2019) . Non-Extensive Entropy Econometrics for Low Frequency Series. National Accounts-Based Inverse Problems. De Gruyter, Open. https://www.degruyter.com/viewbooktoc/product/506062?rskey=YYLjEj&result=2. |
[3] | Bwanakare, S., (2016) . Non-Extensive Entropy Econometrics and CES production Models: Country Case Study. International Association of Official Statistics (IAOS). http://content.iospress.com/articles/statistical-journal-of-the-iaos/sji1021. 32 ed.: 709–713. |
[4] | Bwanakare, S., (2015) . Greenhouse emission forecast as an inverse stochastic problem: a cross-entropy econometrics approach. Acta Physica Polinica A. 3: : 13–20. |
[5] | Bwanakare, S., (2014) . Non-Extensive Entropy Econometrics: New Statistical Features of Constant Elasticity of Substitution-Related Models. Entropy. 16 ed.: 2713–2728. |
[6] | Cierpiał-Wolan, M., (2013) . Processes In Transborder Areas – Significant Impact On The Economic Growth. Proceedings 59th ISI World Statistics Congress. Hong Kong: ISI. 3073–3078. |
[7] | Cierpiał-Wolan, M., Lasek, D., Oleński, J., (2014) . Foundations of Transborder Economics and Statistics. Rzeszów: Euroregion Karpacki. |
[8] | Dragulescu, A., Yakovenko, V.M., (2001) . Exponential and power-law probability distributions of wealth and income in the UK and the USA. Physica A. 299 ed.: 213–221. |
[9] | Drozdz, S., Rak, A., Kwapien J., January (2007) . Nonextensive statistical features of the Polish stock market fluctuations? Physica A: Statistical Mechanics and its Applications. 374 ed.: 315–324. |
[10] | Eurostat, (2018) . WP7 team. E S S n e t B i g D a t a. |
[11] | Gandomi, A., Murtaza, H., (2015) . International Journal of Information Managegement. Elsevier. 137–144. |
[12] | Gibbs, J.W., (1902) . Elementary principles in statistical mechanics. New York: C. Scribner’s Sons. |
[13] | Golan, A., Judge, G., Miller, D., (1996) . Maximum Entropy Econometrics: Robust Estimation with Limited Data, Chichester, England: Wiley. |
[14] | Hadamard, J., (1902) . Sur les problèmes aux dérivées partielles et leur signification physique. Princeton University Bulletin. 49–52. |
[15] | Jaynes, E.T., (2002) . Probability Theory: The Logic of Science. Washington: G. Larry Bretthorst. |
[16] | Kullback, S., Leibler, R.A., (1951) . On information and sufficiency. Annals of Mathematical Statistics. 22: : 79–86. |
[17] | Laney, D., (2001) . 3D Data Management: Controling Data Volume, Velocity and Variety. https://blogs.gartner.com/doug-laney/files/2012/01/ad949-3D-Data-Management-Controlling-Data-Volume-Velocity-and-Variety.pdf. |
[18] | Oleński, J., (2017) . Role of official statistics in fragile countries, regions and branches of economy. Statistical Journal of the IAOS. 833–849. |
[19] | Roussel, G., (2011) . Problèmes inverses. Cote d’Opale, Calais, France Universite du Littoral. 11 Mai 2011. http://www-lisic.univ-littoral.fr/publis/1323539043.pdf. |
[20] | Sivarajah, U., et al., (2016) . Critical analysis of Big Data challenges and analytical methods. Journal of Business Research. |
[21] | Tikhonov, A.N., Arsenin, V., (1977) . Solutions of Ill-Posed Problems. NY: Wiley. |
[22] | Tsallis, C., (2009) . Introduction to Nonextensive Statistical Mechanics: Approaching a Complex World. Berlin: Springer. |


