
Automatically generated quality control tables and quality improvement programs1
Abstract
The Economic Directorate of the U.S. Census Bureau collects various economic data with a requirement to accurately capture and analyze our data to ensure programs identify and correct problems to save resources and ensure high quality. Effective quality control systems are the foundation for the success of data collection and must have well-defined program requirements and comply with Census Bureau quality standards. To meet these objectives, our primary goal is to build an automated quality control and quality assurance system that will identify and implement analytical methodologies which limit the introduction of error into analytical data. For data collection and data evaluation, a system is needed to ensure that all surveys conducted by the Economic Directorate produce results that are of the type and quality needed and expected for their intended use. In this paper, we discuss standard requirements for a set of automatically generated tables and applications that should be used to monitor various processes from planning through dissemination. In the remainder of the paper, we discuss the automated quality assurance checks that will be made in each survey phase to ensure that decisions will be supported by data of adequate quality and usability for their intended purpose, and further ensure that such data are authentic, appropriately documented, technically defensible, and statistically sound.
1.Introduction
In 2005, the Economic Directorate of the U.S. Census Bureau started a program to audit the Directorate’s economic surveys and censuses against the Census Bureau’s statistical quality standards. The Directorate conducts multiple surveys, including monthly and quarterly economic indicator surveys and annual benchmark surveys of manufacturing, retail, wholesale, services, and public sector. Quinquennially, the Directorate conducts an Economic Census of establishments and a Census of Governments (all state and local governments). When the Office of Management and Budget (OMB) issued its statistical quality standards in 2007, the Census Bureau revamped its statistical quality standards and the Economic Directorate audit program was revamped to ensure that its surveys and censuses met both Census and OMB quality standards. Each survey in the Directorate was audited every five years. After a survey was audited, it received a document outlining issues that needed to be addressed. The survey issued a plan for addressing the issues, and the auditor followed up every six months to assess progress on meeting the plan.
After 10 years, the Quality Audit Program was evaluated after most surveys had been audited twice. The evaluation noted some systematic audit failures across surveys that could not be resolved without an examination of and change of major data collection and processing systems. At the same time, an examination of a report of the Directorate’s erroneous disseminations in released data products revealed some systematic procedural shortfalls that crossed multiple surveys. New quality assurance and quality control methods were needed to address dissemination issues and the audit failures.
The survey literature for all surveys, both demographic and economic, has indicated a general decline in response rates. To address this decrease and to address escalating survey costs, the Economic Directorate developed strategic priorities to reduce respondent burden, unnecessary duplication in processing, unnecessary cleaning of the microdata, errors that caused reprocessing of the data, etc. It was clear that new quality monitoring procedures could help reduce cost and alleviate quality issues. It was decided that the quality audit program as it stood would be discontinued for awhile and new monitoring, evaluation, and quality assurance procedures would be recommended to meet the strategic priorities to reduce processing and collection costs and respondent burden. Procedures would be established that would help analysts more effectively monitor data collection, editing, and estimation.
Proper preparation of a final data product is critical in the production of official statistics. Errors in data dissemination can be very damaging to the reputation of the statistical agency. Care must be taken to ensure 1) that no confidential data are disclosed, 2) that no table errors exist (for example, details that don’t add to the totals), 3) that reports are statistically sound with statistically valid conclusions, 4) that all graphs, charts, and tables contain statements of all sources of the data and references or links to further information about the methodology and quality of the data, and 5) that released estimates meet the Census Bureau quality standards for unit response rates, total quantity response rates, and the acceptable level for the coefficient of variation. If these measures are not met, the estimates must be either suppressed or the agency must be transparent about the level of the quality of the estimate. Additionally, each released product must be transparent about the procedures and methodology used.
As much of the monitoring of the data quality as possible should be automated to ensure that it is easy to implement the monitoring and to ensure that all monitoring is documented.
2.Challenges
Automating as much of the quality assurance process as possible is important to ensure that it is not burdensome to analysts, to ensure that it is applied uniformly across all surveys, to ensure that it is actually implemented, and to ensure that the quality assurance is documented. For large complicated systems, it is sometimes difficult to make changes to an ongoing system. It often requires testing of multiple applications that are using the system. Such testing cannot disrupt ongoing processes and must be done at a time that is least disruptive for a survey using the process. Depending on the magnitude of the change, it may require dual processing for awhile, particularly, for monthly and quarterly surveys that cannot afford weeks, or even days, for testing and correction. Therefore, full implementation for all surveys using a complicated processing system can take years. Smaller systems may be able to implement such changes much more quickly.
For quality assurance processes that cannot be automated, training and possibly extensive monitoring are necessary to ensure that staff are implementing the new procedures properly. This means a change in culture and can often be difficult to achieve uniformly across all surveys or even across all staff working on a single survey. Retraining may be necessary, as well as evaluations of the new procedures to ensure that they were thoroughly understood and doable. If the new quality assurance processes are too burdensome, a reevaluation of the processes must be completed to understand the needed changes. These changes must be addressed to ensure that staff do not shortcut the system with their own solutions to “get around” the system. Staff should be involved in final resolutions so they will understand the problems that need to be corrected and so they can propose solutions that can actually be implemented. To the extent possible, staff should be included in the implementation of the initially recommended quality assurance processes to ward off implementation problems.
After the new quality assurance measures are implemented, a new auditing procedure will be necessary to ensure that the new quality assurance processes are properly administered and that regular monitoring is implemented. Likewise, an evaluation system that will ensure that the newly instituted procedures are actually performing as planned (correcting erroneous disseminations, reducing costs, etc.) must be agreed upon by the methodologists from the various surveys being audited.
Table 1
Summary of noncompliant cases and recommendations in the quality audit cycle
| OMB standard | Number of | Number of | Total number of |
|---|---|---|---|
| number | noncompliant | recommendation for improvement | noncompliant and recommendation combined |
| 1.1 | 0 | 4 | 4 |
| 1.2 | 4 | 10 | 14 |
| 1.3 | 6 | 10 | 16 |
| 1.4 | 3 | 7 | 10 |
| 2.1 | 2 | 4 | 6 |
| 2.2 | 1 | 3 | 4 |
| 2.3 | 0 | 4 | 4 |
| 3.1 | 2 | 3 | 5 |
| 3.2 | 8 | 5 | 13 |
| 3.3 | 1 | 2 | 3 |
| 3.4 | 0 | 1 | 1 |
| 3.5 | 2 | 7 | 10 |
| 4.1 | 2 | 4 | 6 |
| 5.1 | 2 | 4 | 6 |
| 5.2 | 0 | 1 | 1 |
| 6.1 | 1 | 2 | 3 |
| 7.1 | 1 | 7 | 8 |
| 7.2 | 0 | 1 | 1 |
| 7.3 | 2 | 8 | 10 |
| 7.4 | 0 | 0 | 0 |
| Total | 38 | 87 | 123 |
3.Current quality audit program and check-in unit response rates
As mentioned in Section 1, the Quality Audit Program was evaluated after most surveys had been audited twice. Overall, the findings from these 31 audited programs were positive. The audit team discovered that 87 percent of all Economic Directorate programs were found to be largely compliant with the Office of Management and Budget (OMB) standards. In addition, auditors found only 38 noncompliant issues across the twenty standards that we evaluated in the economic Directorate audits. This is not meant to say that the Economic Directorate’s program areas subjected to the Quality Audit Program were not without need for improvement. A program could provide evidence that they comply with an OMB methodological standard, but auditors routinely discovered practices and procedures that could be improved upon. Table 1 provides a brief summary of the results based on the first five-year quality audit program cycle.
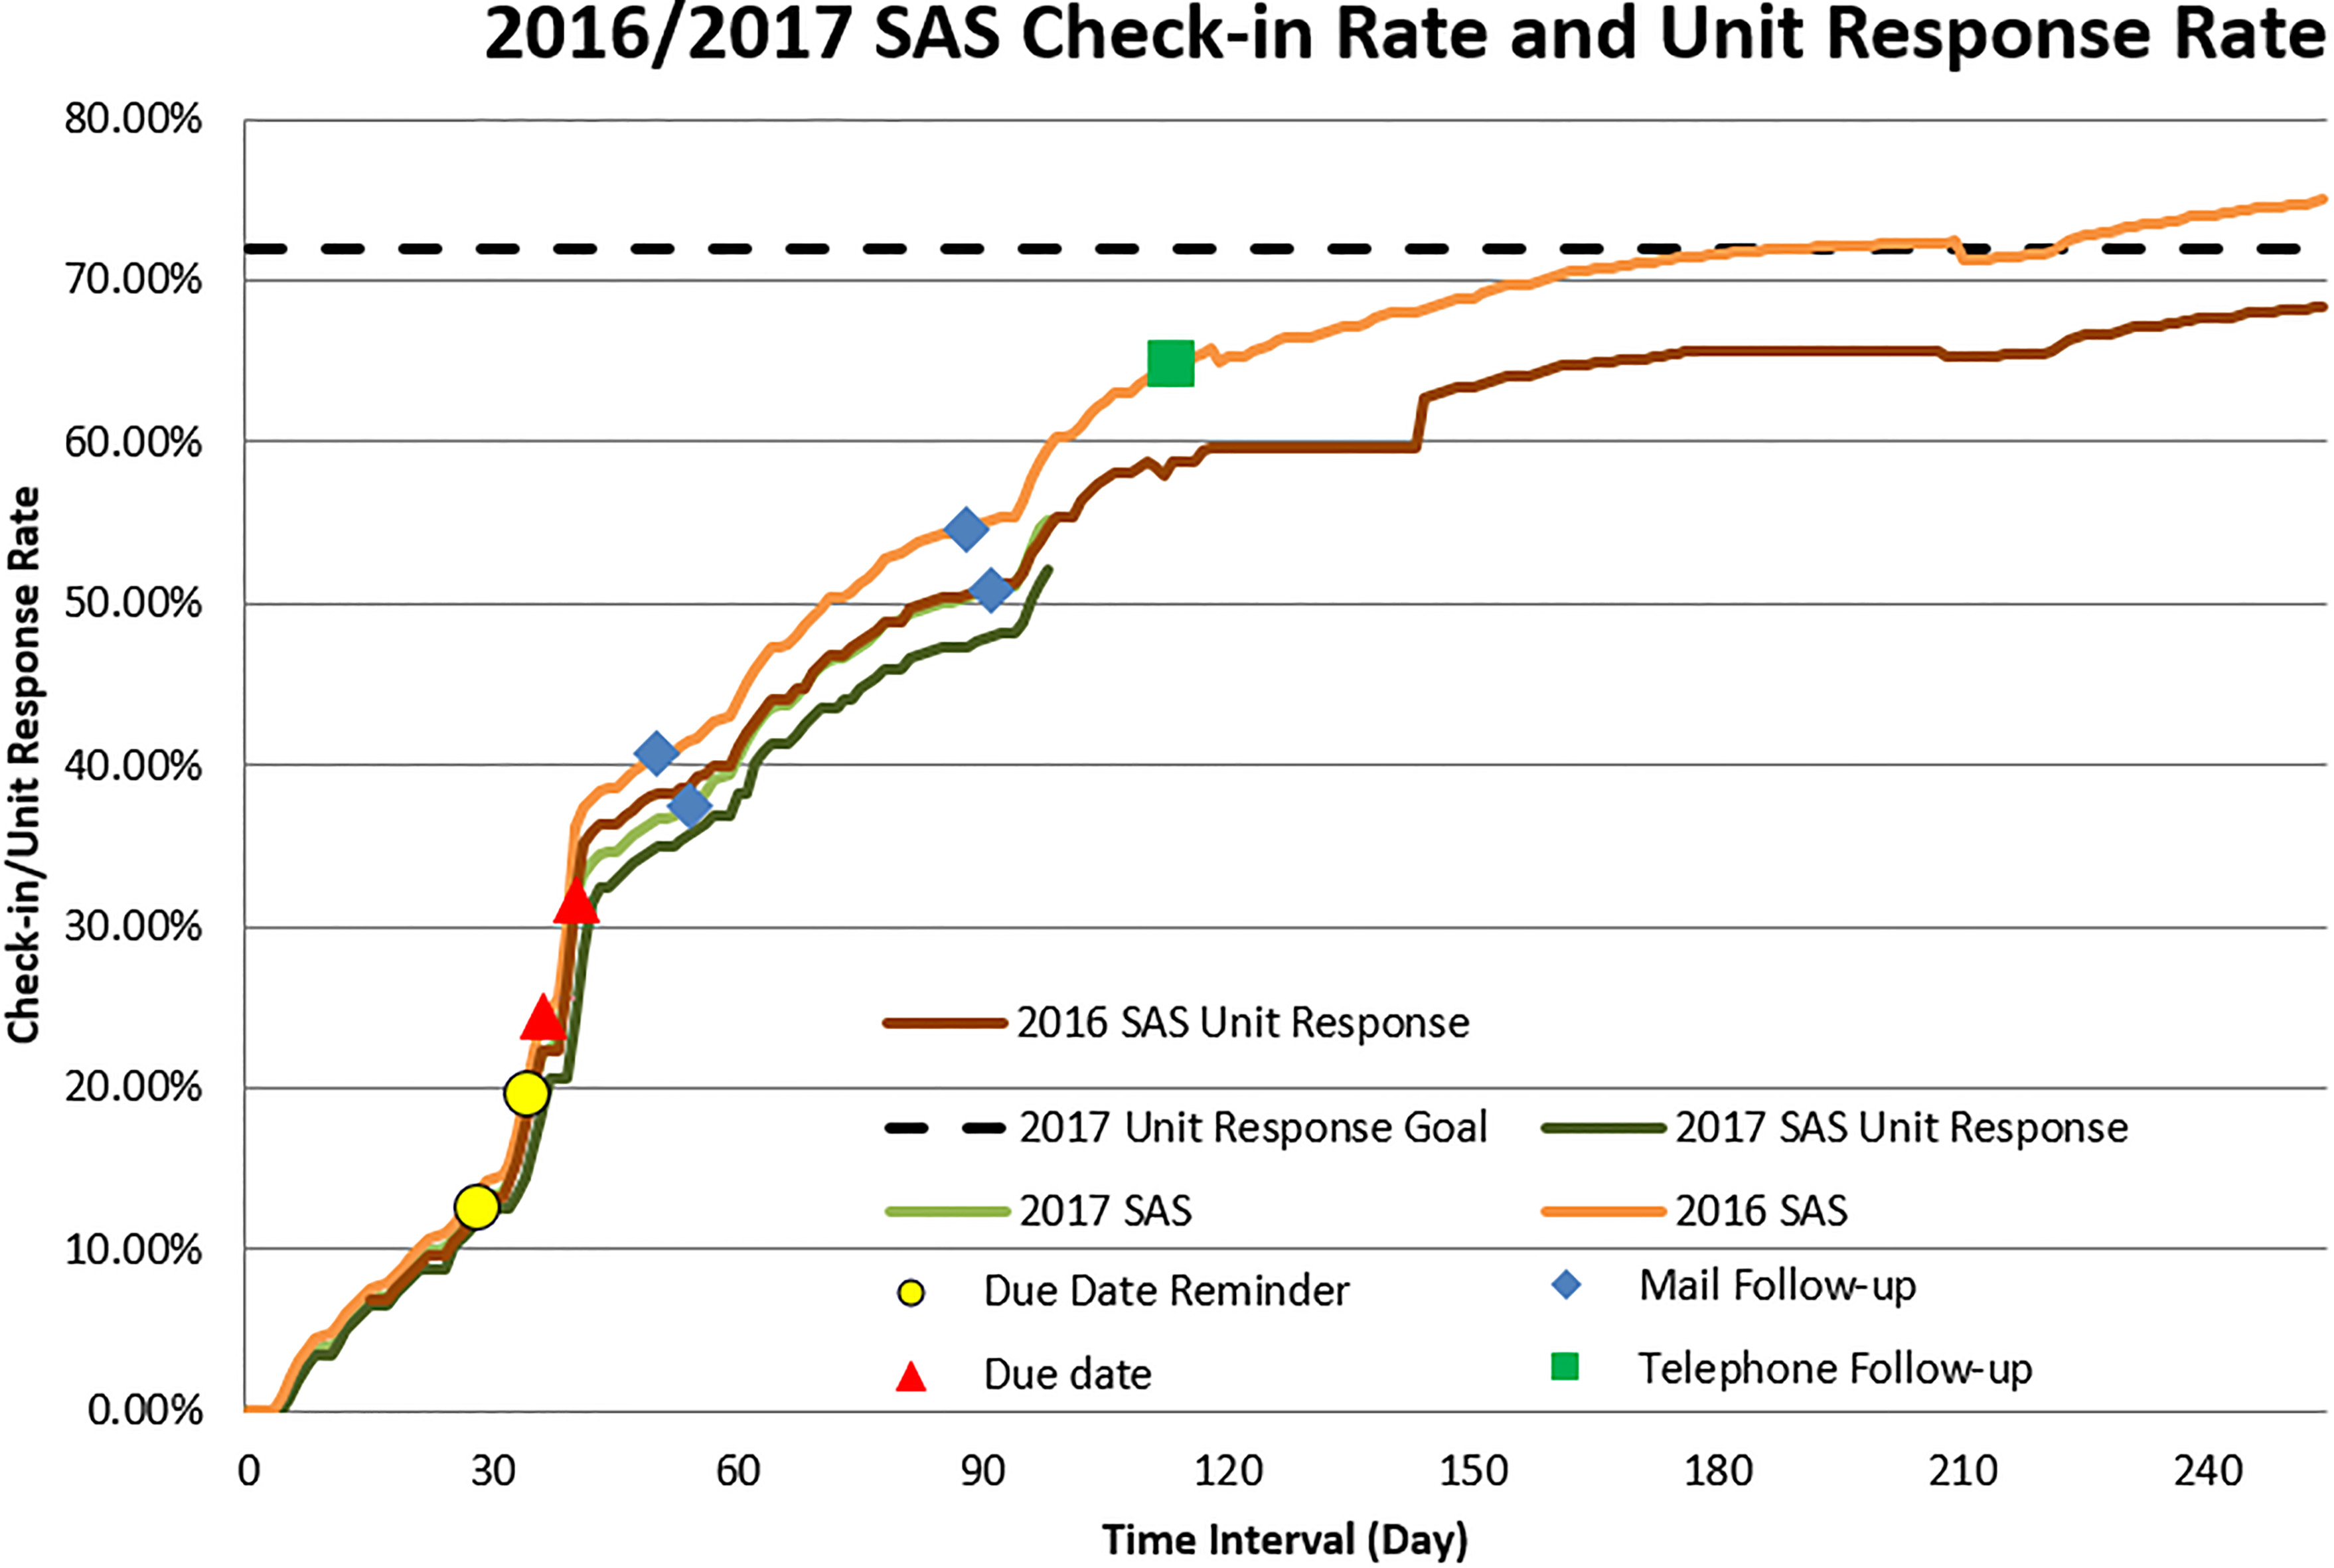
In addition, the Quality Audit Program found a high number of issues with OMB Standard 3.2 – Nonresponse Analysis and Response Rate Calculation. To alleviate this issue, we suggested program areas must monitor and evaluate the data collection activities and take corrective actions if problems are identified. For business surveys at the U.S. Census Bureau, we compute two categories of response rates, Unit Response Rates (URR) and Total Quantity Response Rates (TQRR) for each key variable. The general threshold for unit response rate is 80 percent, and 70 percent for the total quantity response rate. The URR is defined as the rate of the total unweighted number of responding units to the total number of sampled units eligible for tabulation. The TQRR measures the weighted proportion of key estimates reported by responding units and from equivalent quality data sources. In general, the Economic Directorate prefers the TQRR over the URR because of the skewness of the data. The reason for this is because the URR does not provide information on the quality of the response. To achieve the response rate goals, we must develop systems and procedures to monitor and evaluate all data collection activities. For instance, staff must monitor and evaluate activities such as, tracking unit response rates, progress in completing interviews, cost of data collection, taking corrective action when goals are not met, tracking return cases to ensure accounting of all cases and investigating missing cases, etc. Figure 1 gives an example of the 2016/2017 Services Annual Survey (SAS) check-in rate and unit response rate over the life cycle of the survey.
Figure 1.
Check-in response rate for services annual survey.
4.Goals and achievement of quality processing
Our ultimate goal is to assure data users that our released products are of the highest quality possible. We aim to establish a quality control checklist to ensure that quality statistics are being produced. In this section we introduce the application of quality control procedures into all aspects for the Survey Life Cycle as well as to increase efficiency of processes and the timeliness of data releases. This quality control procedure consists of a series of monitoring and review procedures to determine whether the U.S. Census Bureau’s quality standards are being met. If quality standards are not being met, corrective and preventive action will be taken to achieve and maintain conformance. We also introduce a general framework that allows us to not only understand each step required for successful data collection and analysis, but it also helps us to identify errors associated with different data sources. This general framework also provides a useful overview of the required phases and sub-processes for producing statistical outputs from any type of source. These checklists cover items for overall management of our monitoring processes. Figure 2 shows the place of quality assurance and quality control in the survey management cycle.
Figure 2.
Survey life cycle and survey implementation.
The goal in business surveys is to achieve maximum quality in data production for minimum cost. Unfortunately, neither the quality nor the cost is straightforward. To achieve this goal, we have conducted research and identified problem areas to help refine our future audit objectives, scope, and methodology.
In this section, we briefly discuss three phases of collecting and analyzing data. This includes before data collection, during collection, and after collection. Each of these components involve testing, evaluating, monitoring, and documenting. The initial step in the design of a survey involves planning and testing of the survey production process and everything that is needed to collect and process the data. This includes developing and testing the questionnaire and data collection instruments, verifying the survey design and settings, etc. The main challenge is how we can increase the likelihood of achieving quality data at low cost [1]. Nonetheless, all components of the survey need to be ready when data collection begins. To get all these activities completed, all activities need to be organized on a timetable and managed.
During the data collection stage, the survey components are implemented. It is required to monitor and control the data collection process and the quality of the survey results. Analysts are required to regularly check and report collection progress. At a minimum, check of response rates and paradata will be monitored during data collection. After the data collection phase is completed, all documentation needed to replicate and evaluate the data collection methods must be produced. This documentation includes survey plans, requirements, specifications, procedures for the data collection, test design and results, instructions to respondents about the data collection instruments, quality measures and evaluation results, the distribution of response outcomes, the use of quality control checks, etc.
During the processing of the data (editing, imputation, estimation and error estimation phases), monitoring of how edits are performing is needed. Check and evaluate if some edits are failing too often. Monitor manual editing to determine if appropriate changes to the data are being made and that over-editing of the data is minimized. Checks through the imputation phase will ensure that distributions are not inappropriately perturbed. This documentation of all procedures is an imperative for each survey aiming at high quality and will be served in the evaluation activities for future survey improvement. Each of these activities from planning and development through releasing information product needs to be performed in accordance with the Census Bureau’s quality standards.
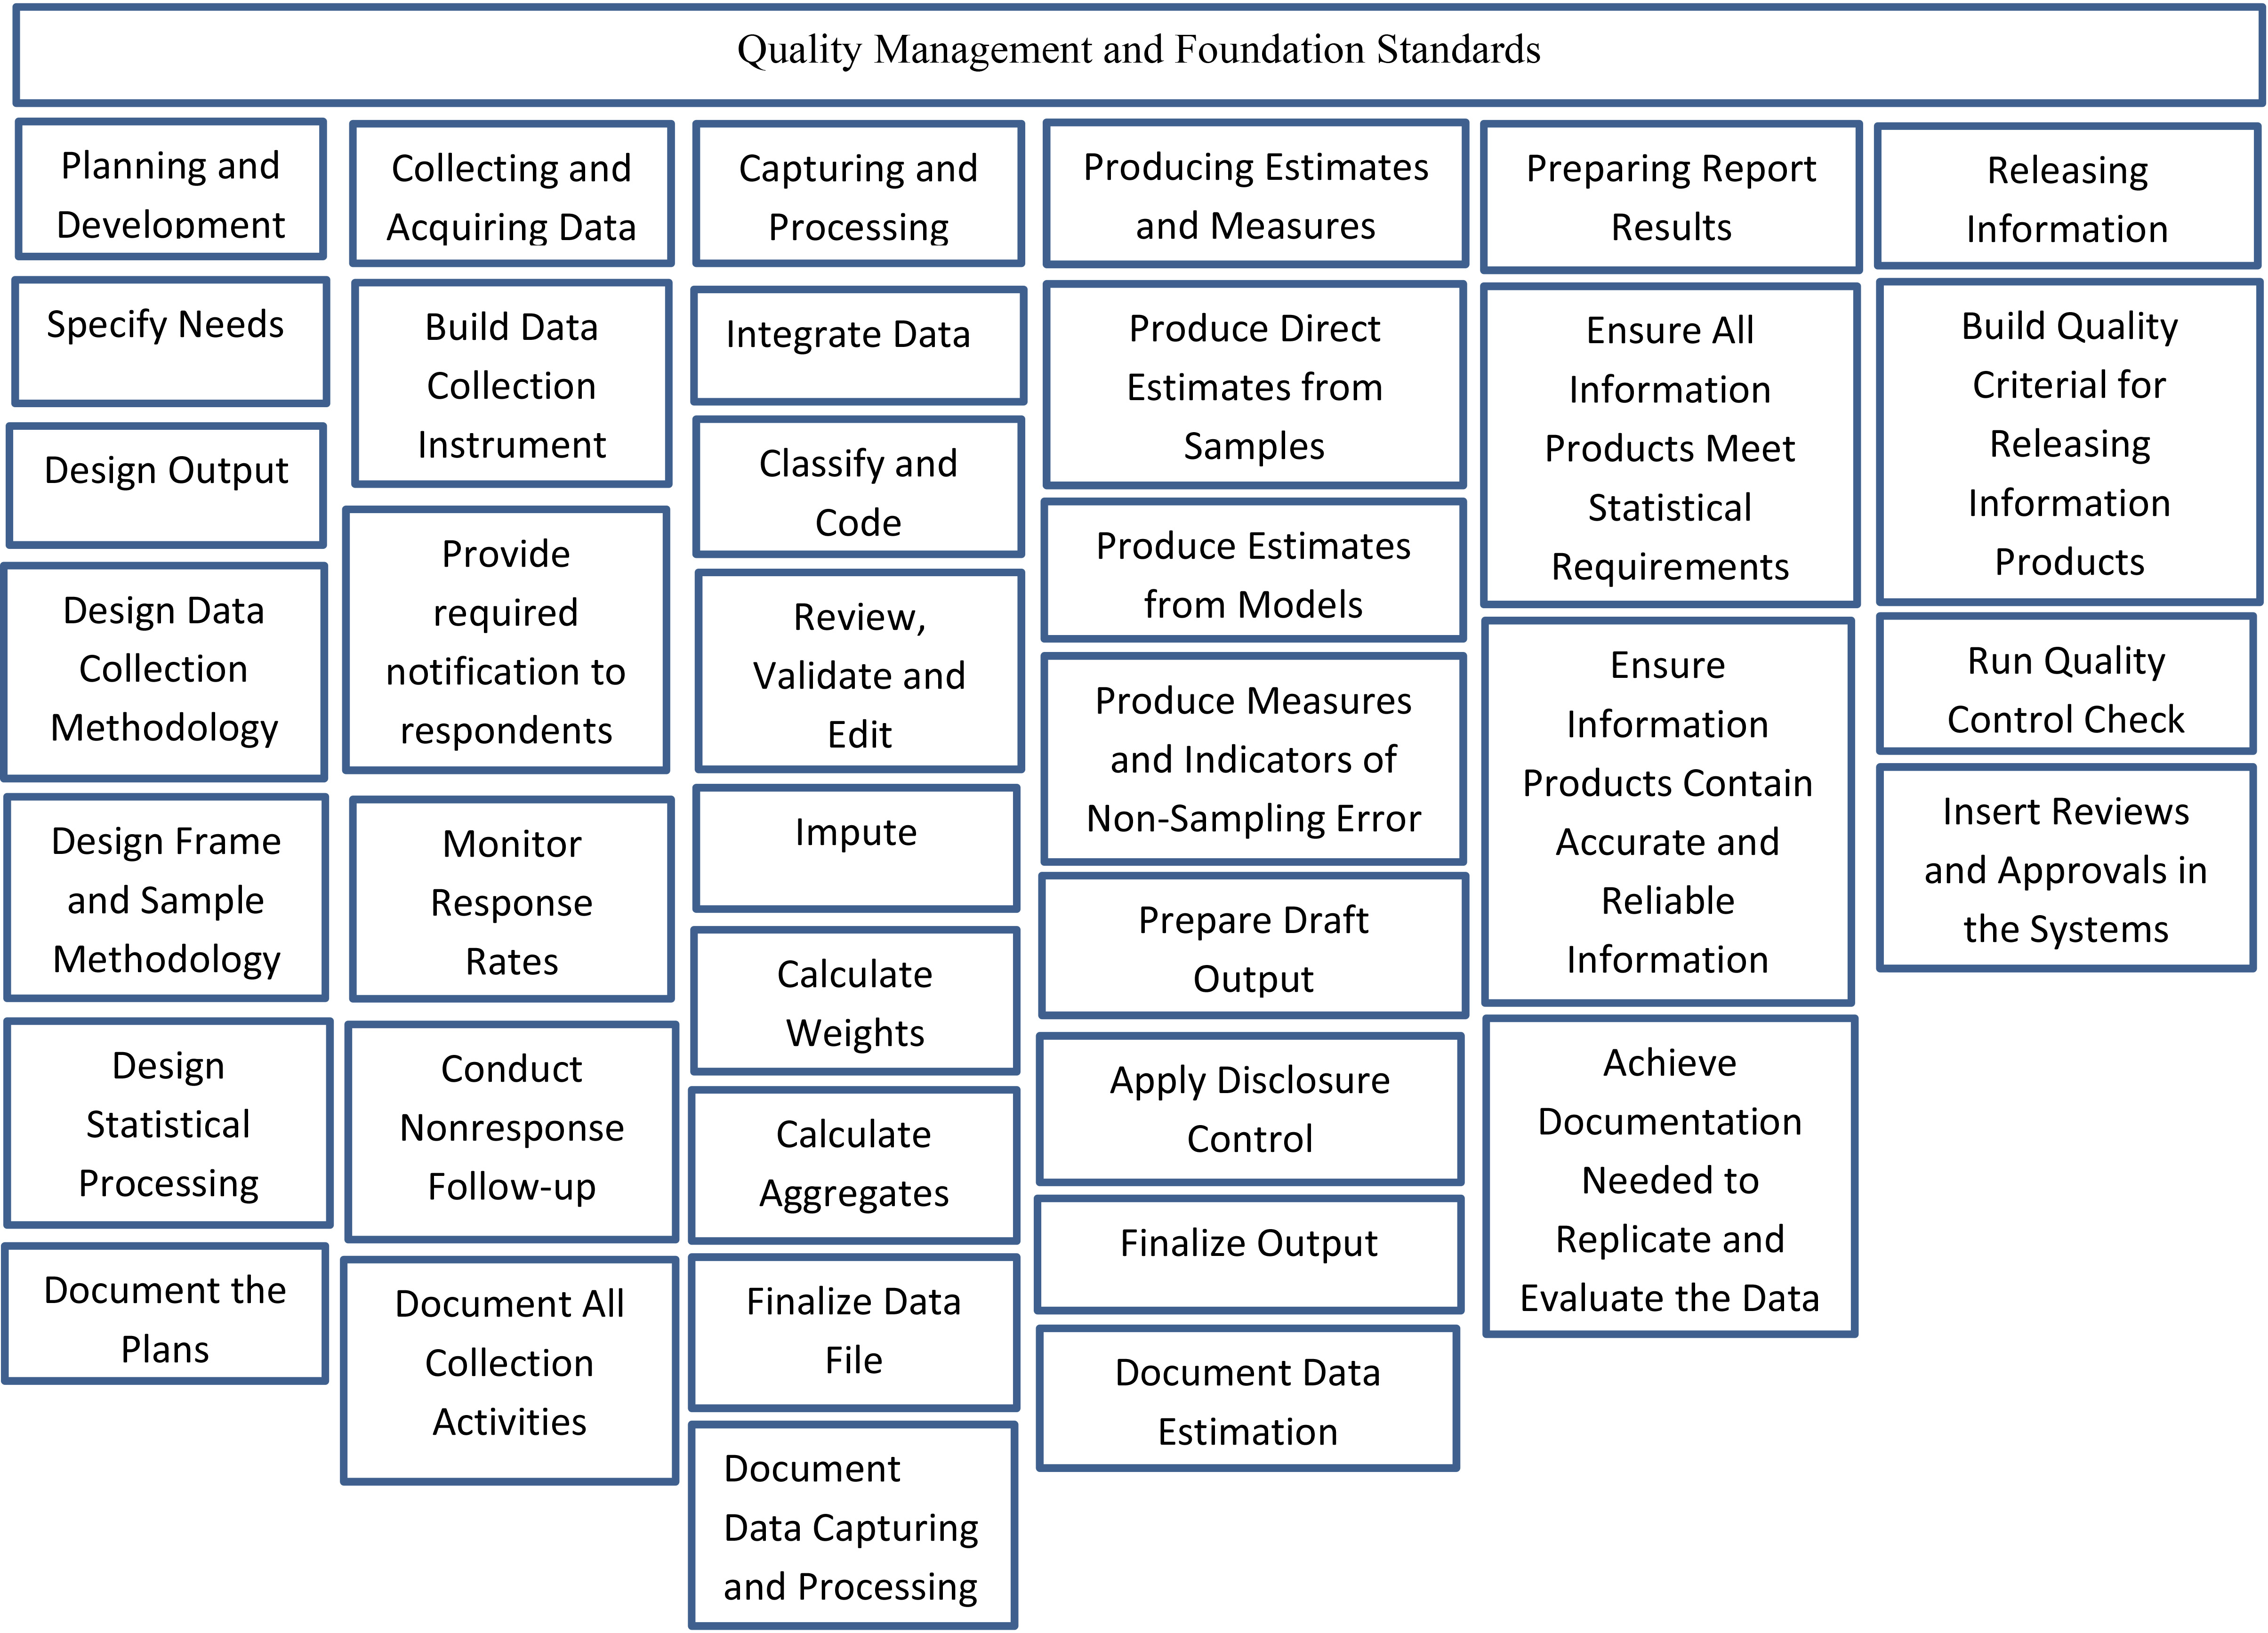
Figure 3 below provides best practices of quality framework from planning and testing through data dissemination.
Figure 3.
Best practices of quality framework from planning through dissemination.
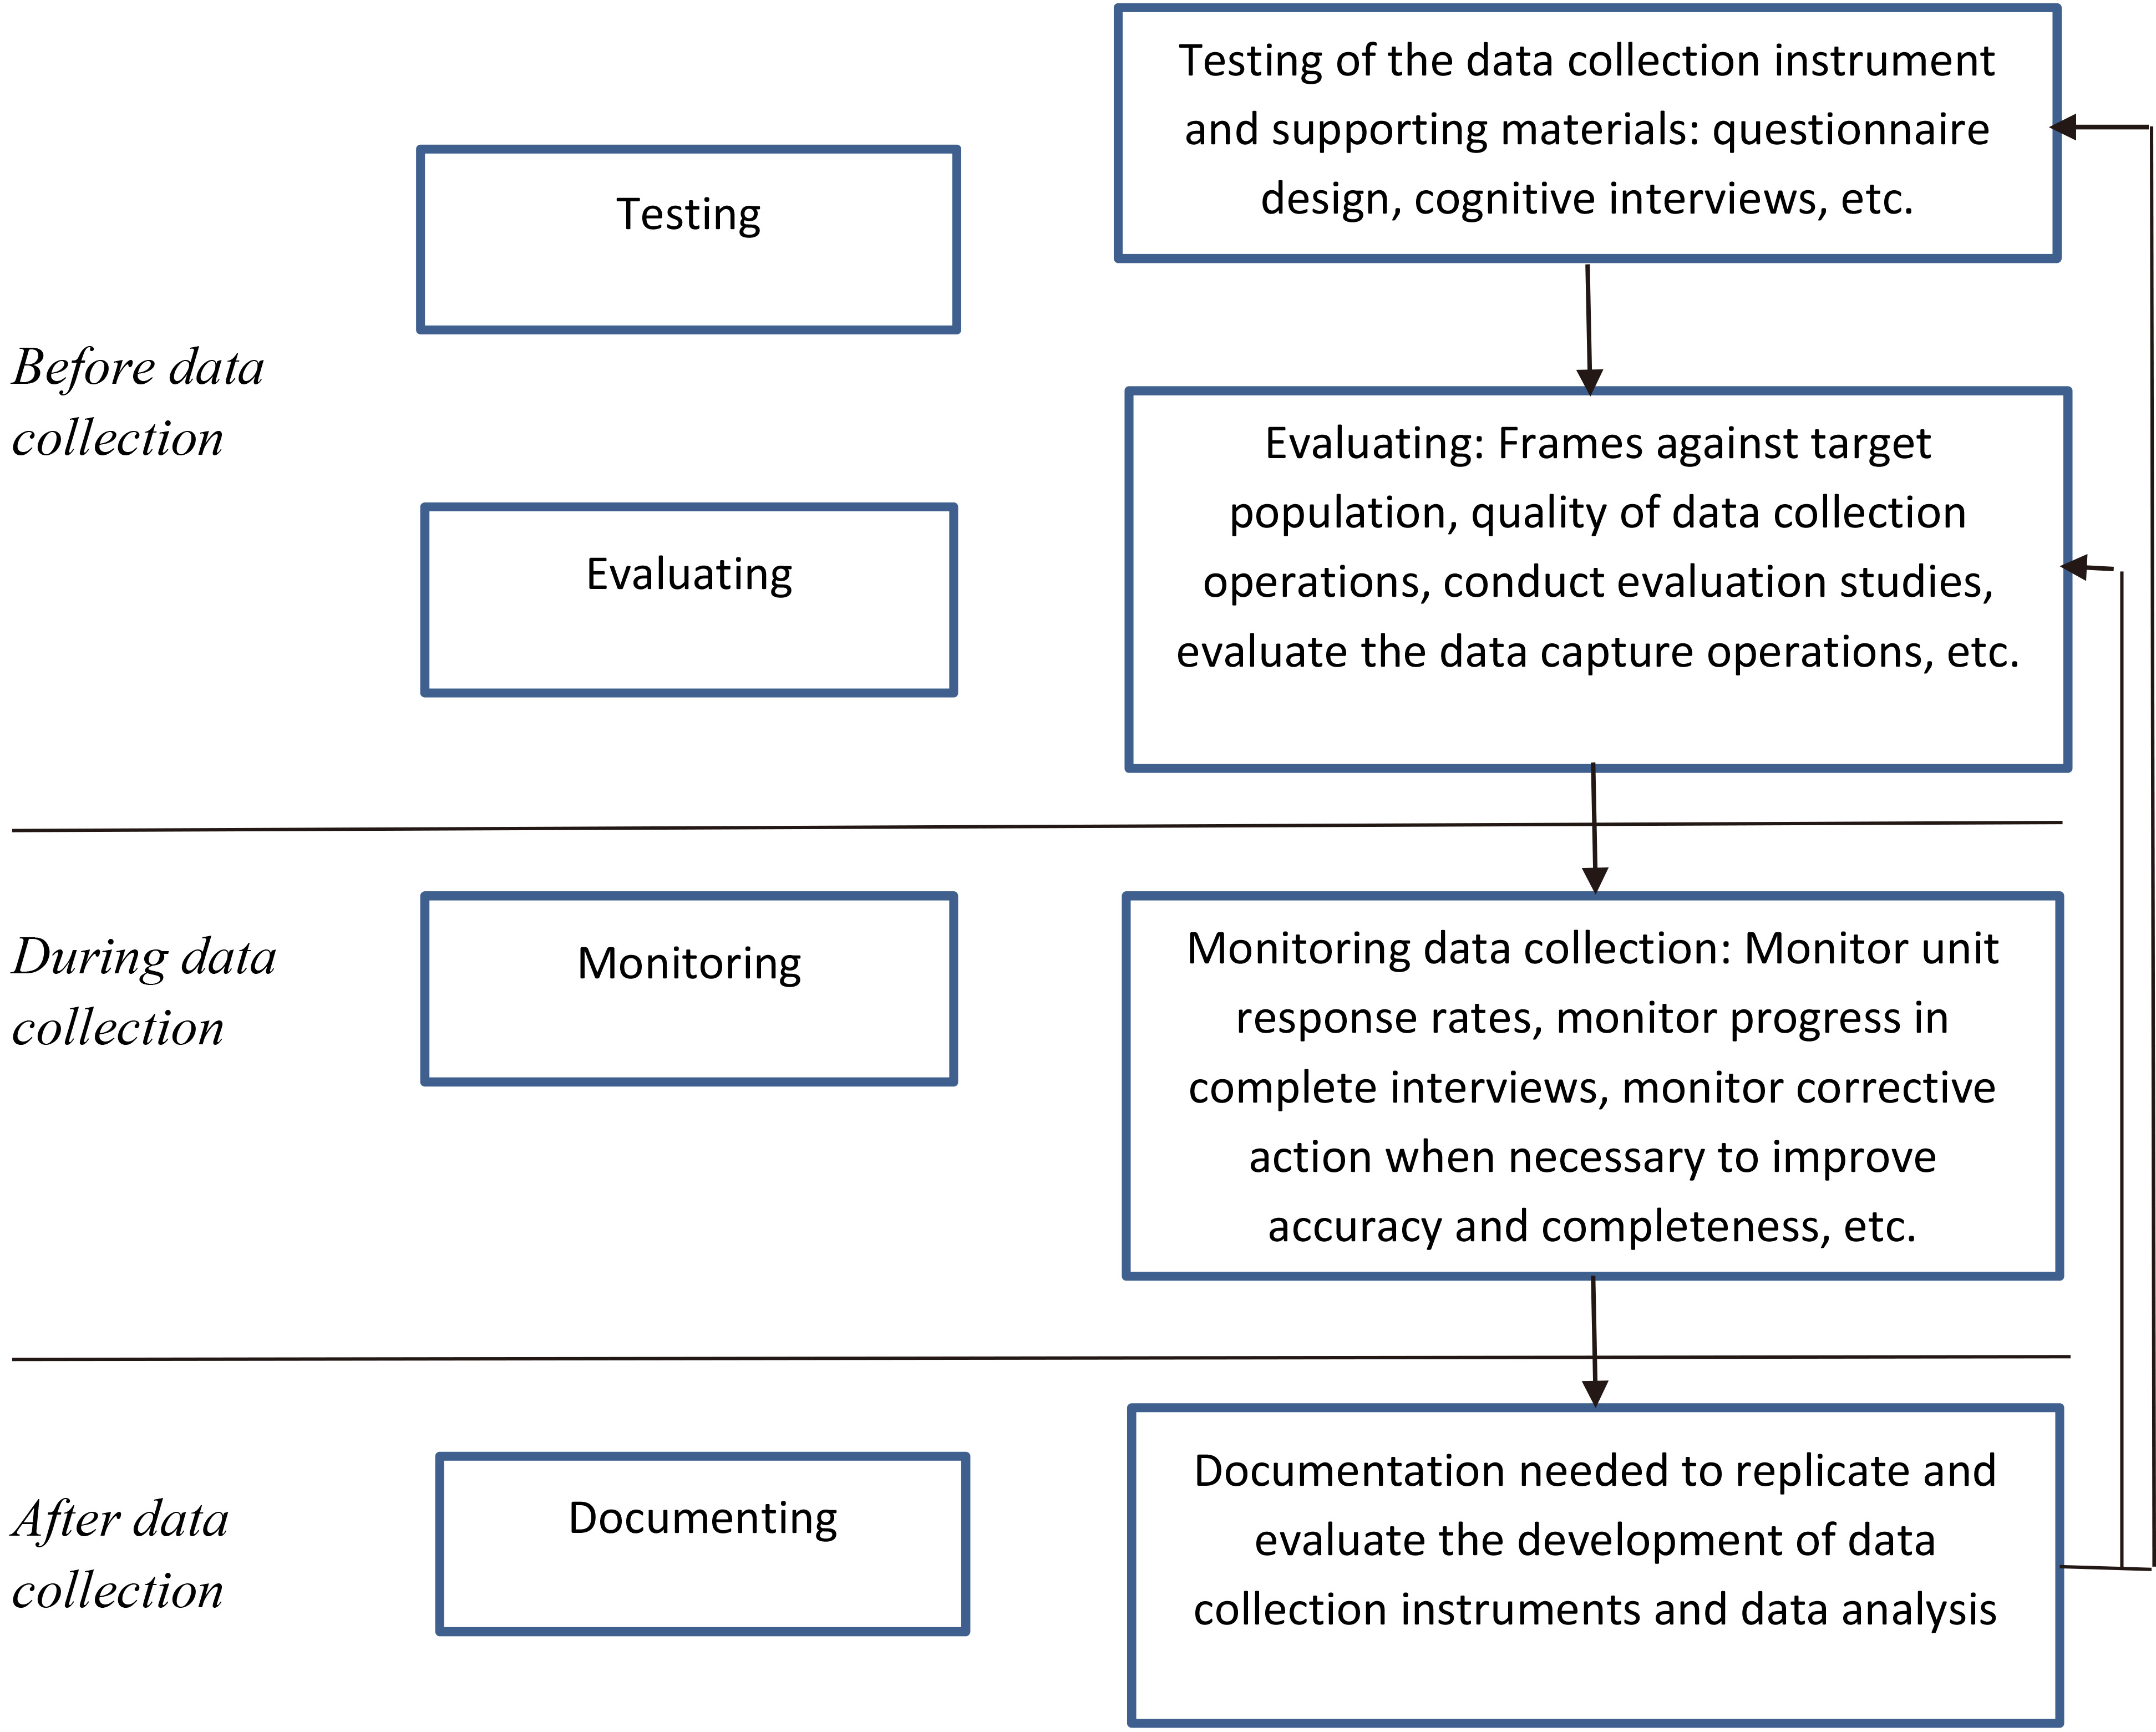
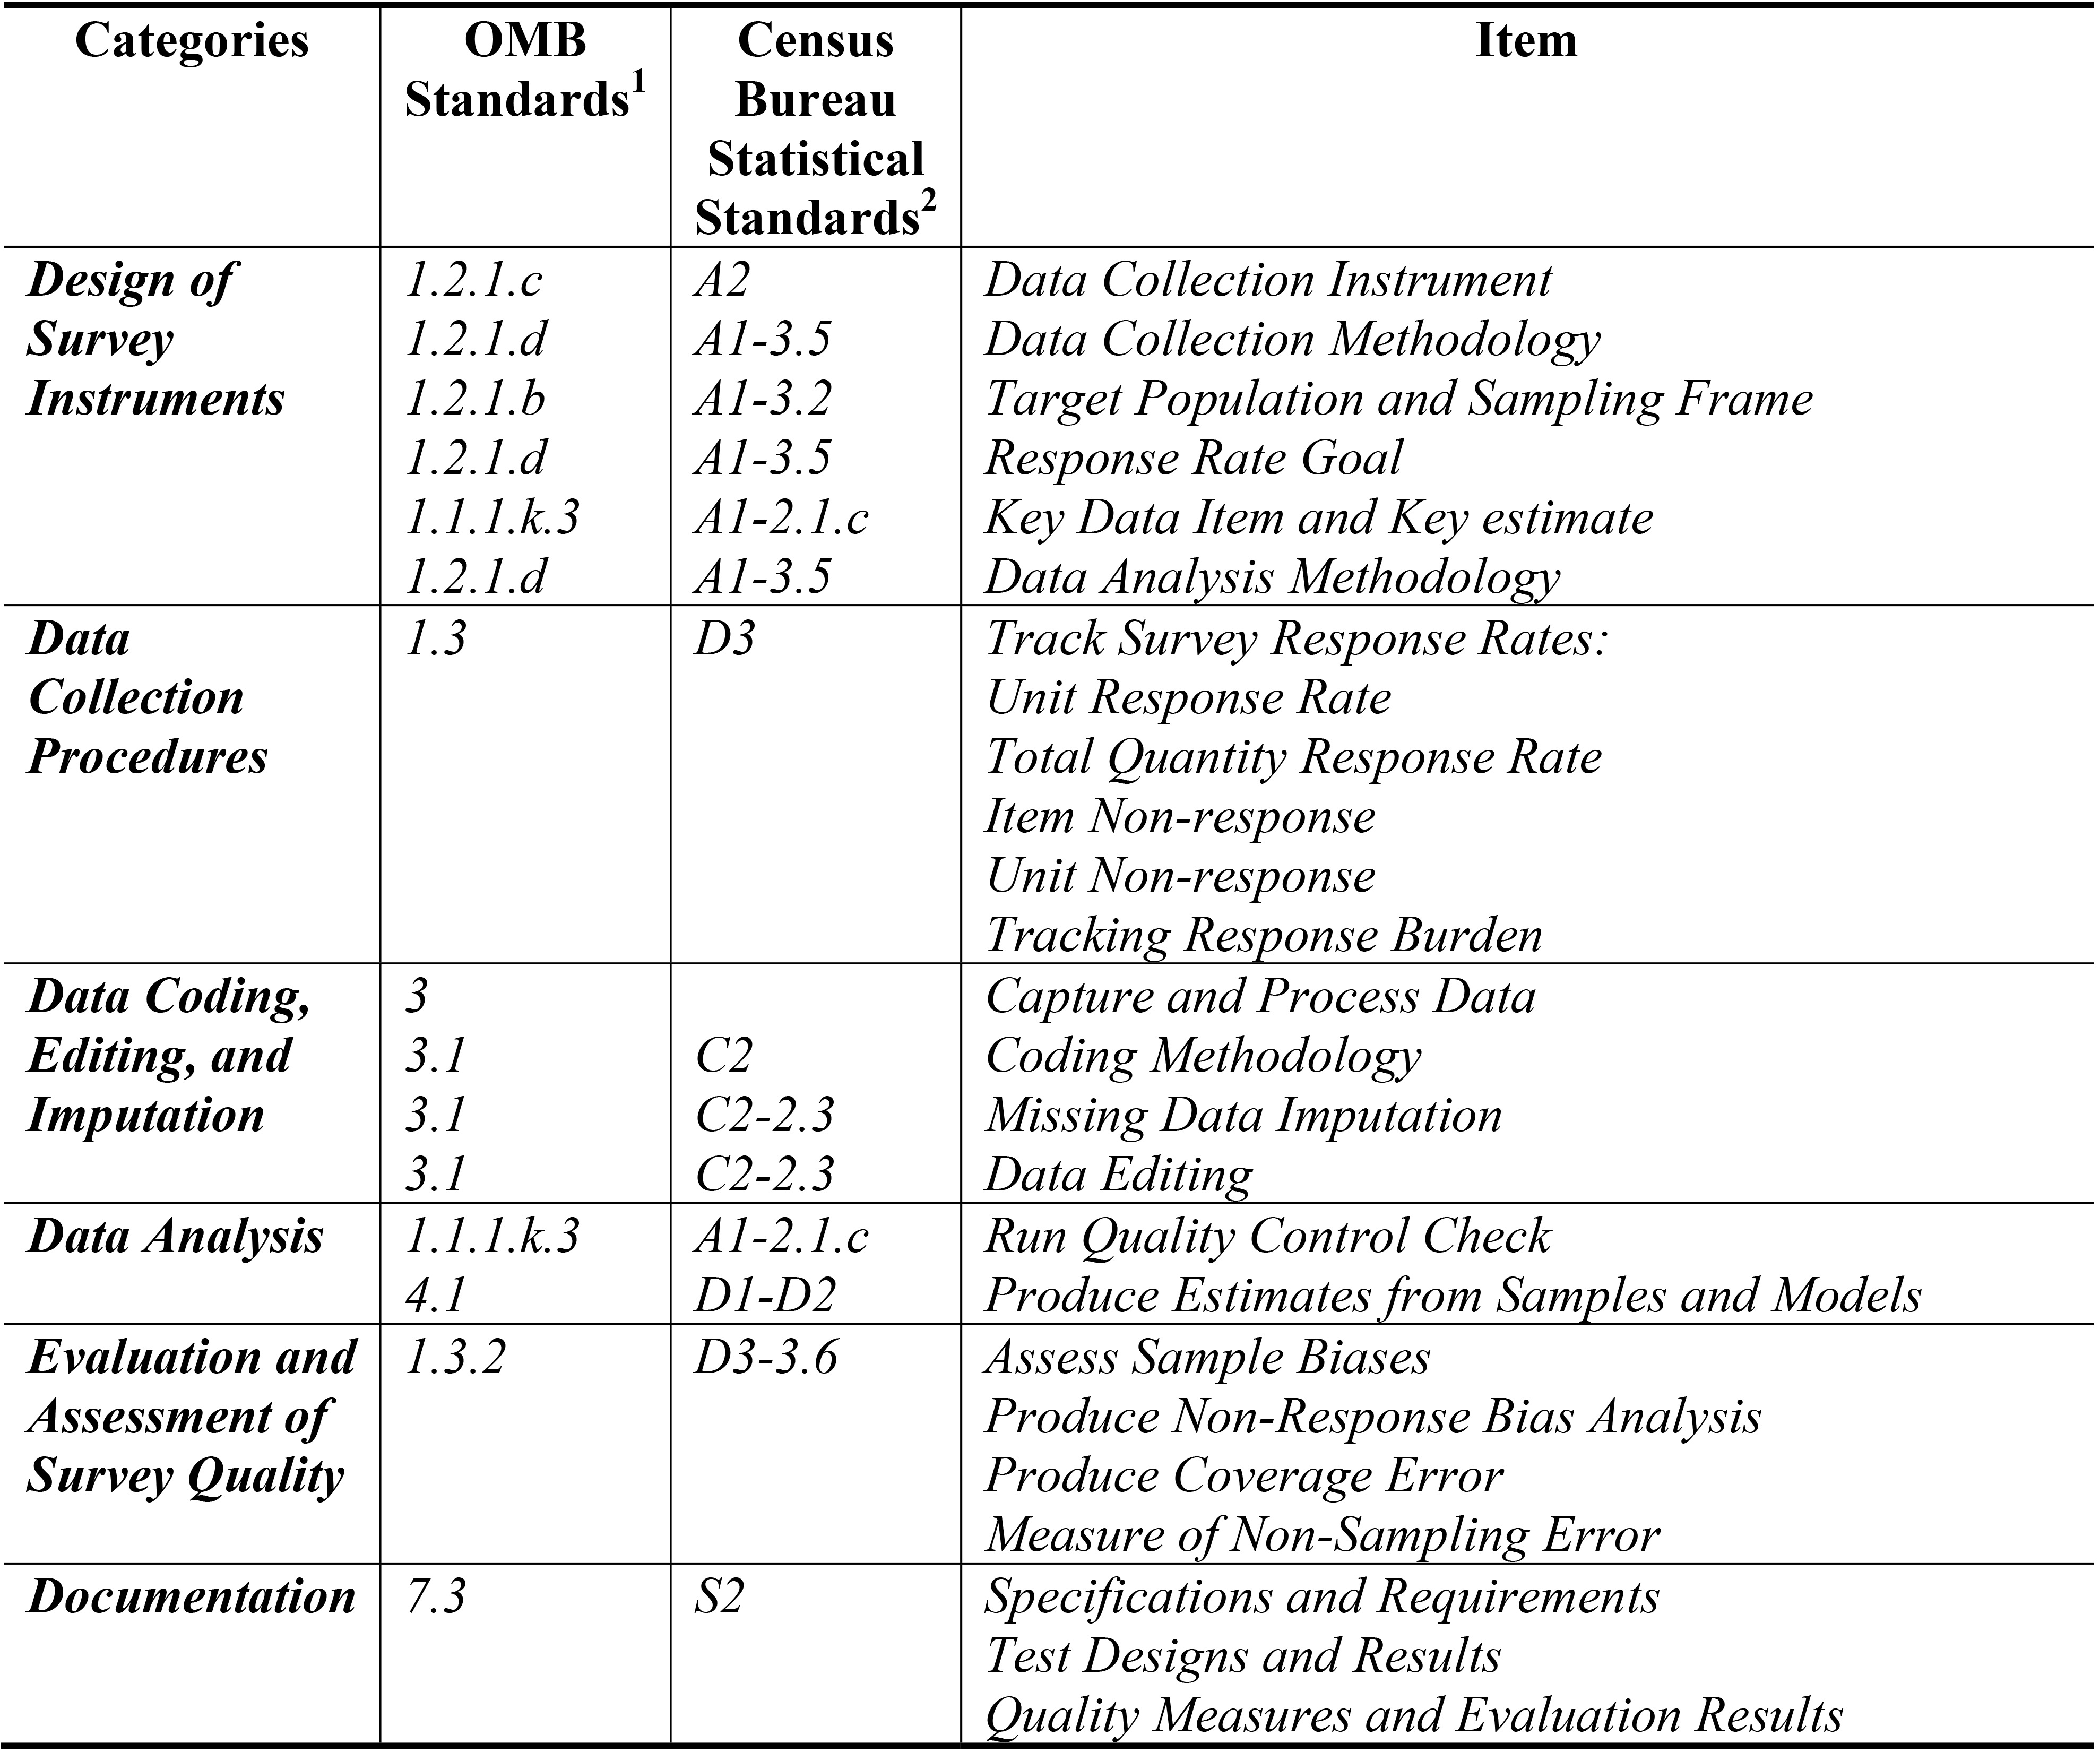
Figure 4.
Recommended standardized and guideline requirements. Source: OMB Standards
5.Procedures for improving quality and controlling costs
5.1Automatically generated tables for proposed quality enhancements
Based on the results of two cycles of quality audit evaluations, we strongly suggest to develop automated quality control tables that will be used on an ongoing basis by the survey analysts and the survey managers to monitor various processes throughout the survey life cycle. Relying on manual quality control can introduce bias and delay data dissemination. We focus exclusively on automated quality control procedures where all procedures are screened by automated algorithms to identify suspect data that are then flagged for further review in the next stage. These automated quality procedures are further motivated by the need to optimize staff effort for survey evaluation, which has direct budgetary implications in business surveys. To develop this automated quality control table, we reviewed all OMB standards to identify those that could be easily and accurately automated. Figure 4 lists the six proposed categories along with the corresponding OMB standards and the Census Bureau quality standards.
Figure 5.
Tableplot of Services Annual Survey Data through March 31, 2017 (Sort Variable
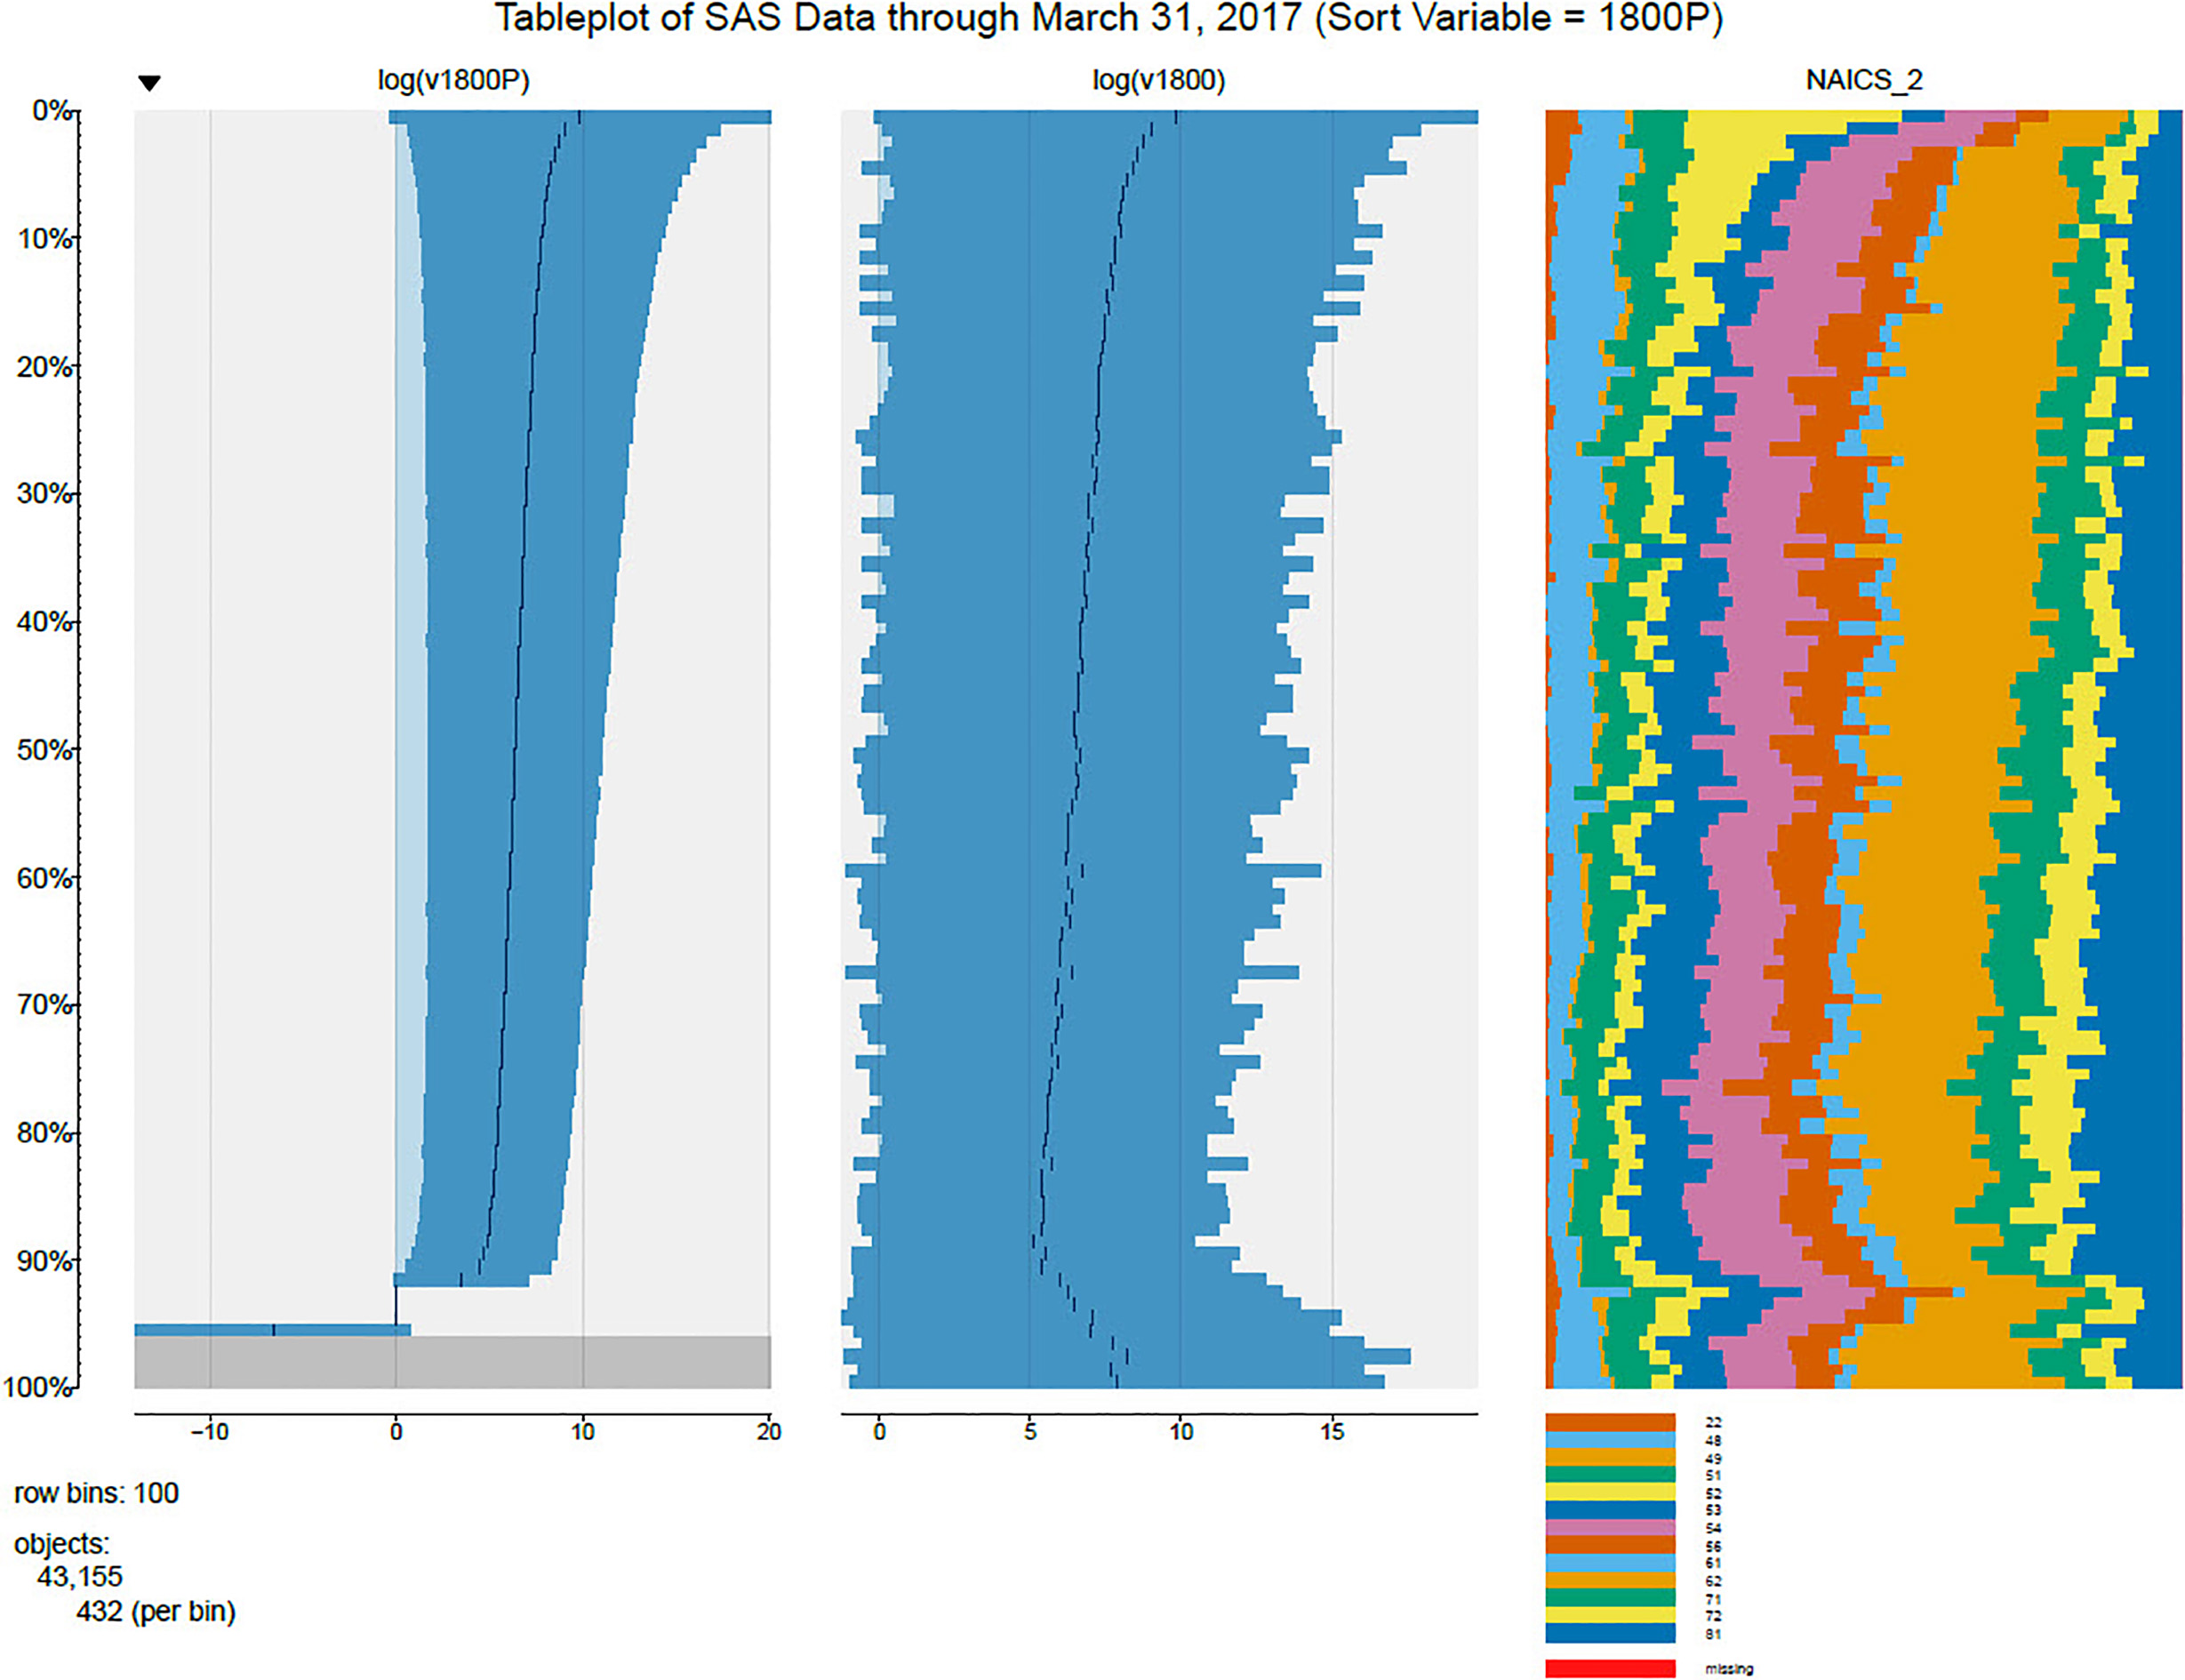
5.2Applying tableplots and big data methods
Part of the effort to build quality into all aspects of the Survey Life Cycle is to examine current survey editing to reduce biases during the edit process. Our goal is to build a more adaptive editing process using stopping points that indicate when it is time to switch resources from one industry classification to another or from one state to a different state. These criteria are 1) from one point to the next percent difference in the estimates is greater than 10 percent, 2) percent difference in the standard error is greater than 10 percent, and 3) the percent difference between the estimate and previous year’s final estimate is less than
We have completed the edit evaluation for a number of surveys in the Economic Directorate. Besides stopping points, another methodology we used in our research was tableplots to selectively edit large datasets. The purpose of looking at this methodology was to see if tableplots could be useful for editing large datasets. Figure 5 displays an example of a tableplot. For each key numerical variable, the distribution was broken into 100 even bins, so in the example 43,155 objects were sorted by prior year revenue into 100 bins of 432 objects. The bin means and standard deviations are plotted, whereas for each key categorical variable, the category frequencies within each bin are visualized. For variables positively correlated with the sort variable, one would expect the first bin to contain observations with some of the largest values and the last bin to contain observations with some of the smallest values. Therefore, one would expect to see a trend in the bin means, standard deviations, and category frequencies. A bin with an outlying mean, standard deviation, or category frequency could indicate the presence of an observation or observations that need to be edited. Figure 5 is a tableplot of revenue and 2-digit North American Industry Classification System (NAICS_2) with prior year revenue as the sort variable for the most recent Services Annual Survey 2016 data collected through June 30, 2017.
6.The future of the economic directorate’s quality program
A major initiative in building quality into our future systems and procedures will be to reduce the amount of unnecessary editing, which will save resources, increase timeliness, and possibly produce higher quality data through ensuring that true outliers are appropriately addressed and no or minimal to ensure that we are addressing edit reduction. Three surveys have been studied to date, with the most important next step being a study of methods to prioritize the editing of the Economic Census.
Equally important are the steps that must be taken to ensure quality is added to all Survey Life Cycle processes to reduce erroneous disseminations and ensure that all data products are Census Bureau and OMB standards compliant. This will be achieved by writing Economic Directorate policy guidelines on Survey Life Cycle planning and archiving of data, methodology, computer processing, and final products. All new data collection processes or processing steps will be tested and documented. Monitoring of all data collection processes (during web collection and nonresponse follow-up) through using web paradata and using key performance indicators will be added to system collections. Machine learning will be introduced to web collection instruments to assist respondents in correctly classifying write-ins, thus reducing respondent burden. Machine learning can also reduce the amount of editing in later processing.
Editing should be automated as much as possible to improve timeliness and ensure that all editing processes are repeatable. All editing processes should be evaluated as a regular part of the Survey Life Cycle. All imputation, estimation, and post estimation processing should be thoroughly documented. All new processes should be thoroughly tested with the testing
documented. For all processes in a survey, documentation should be reviewed for accuracy and archived. Checklists guiding each collection and processing step should be kept for use in future quality audits. At each step, a quick lessons learned or brief evaluation of the step should be made and archived for use to improve the next survey.
As a part of the dissemination process, the documentation for all processes should be collected into a common place for archiving. Processing guidelines, checklists, etc., will be archived for future use. All reports should be written to comply with the standards, and all supervisory, statistical, methodological, content, and policy reviews must be completed. A final check should ensure that all processing steps have been properly evaluated prior to close-out of the survey and beginning the next survey life cycle.
These new quality guidelines will be actually implemented by ensuring that the processes are built in to all new collection and processing systems.
References
[1] | Snijkers G, et al., ((2014) ). Designing and Conducting Business Surveys, Wiley. |
[2] | Burr I, ((1976) ). Statistical Quality Control Methods, Marcel Dekker. |
[3] | Koch A, et al., ((2009) ), Data Collection Quality Assurance in Cross-National Surveys. |
[4] | Nguyen J, Hogue C, ((2016) ). Assessing Quality Control: Evaluating the Quality Audit. |
[5] | Fowler J, Klement S, ((2012) ). Quality Audit Program 1 |
[6] | Office of Management and Budget Standards and Guidelines for Statistical Surveys. (September (2006) ). https://obamawhitehouse.archives.gov/sites/default/files/omb/inforeg/statpolicy/standards_stat_surveys.pdf. |
[7] | U.S. Census Bureau Statistical Quality Standards. (Revised July 2013). https://collab.ecm.census.gov/teamsites/quality/intranet/Pages/Quality%20Standards%20and%20Guidelines.aspx. |


