
Development of a complex approach for evaluation of statistical data
Abstract
The quality of statistical data is essential for effective decision-making. The problem of evaluating the quality of statistical data is not a new paradigm as rapid methodological changes and globalization complicate the generation of high quality statistical data in all areas. The problem is on selecting appropriate criteria to evaluate the quality of statistical data, not just related to the intention of statistical survey, but also to the beliefs held by both statisticians and respondents. As a result, there is a strong need to discuss this topic. In this paper author provides a multi-dimensional approach of measuring the quality of official statistical data and propose the system of indicators to determine statistical data quality. To some of the proposed data quality dimensions and indicators not much attention has been paid previously.
1.Introduction
Demand for high quality, reliable and timely statistics is growing today. Confidence in the quality of the statistical data is a matter for the statistical office to survive. Data quality results from the interaction between the analytical data attributes (e.g. bias, accuracy, and other characteristics that together contribute to data uncertainty) and the intended use of the data.
In author’s view, more detailed analysis of statistical data quality dimensions by its assessment indicators with subsequent analysis of the results make it possible to not only assess the general quality of data, but also reveal data quality shortcomings and failures, providing more focused data quality management.
Statistics characterizes not only everyday phenomena and processes, but also both economic and social phenomena in the country and in the world, and is the basis for decision-making. In several sectors of economy the development of evidence-based decision-making, policy and practice by developing cooperation between statistical data providers and users of statistical data is contributed [14]. Evidence-based policy has been defined as an approach that “helps officials make decisions on policies, programs and projects by putting the best available evidence in the center of information policy development and implementation” [6]. Promotion of Data Awareness (Data Awareness – data users’ understanding of the data important role in society, knowledge of the different data sources, understanding of what affects the quality of the data and knowledge of the conditions under which the data were collected [21]) increases an impact of statistical information on the final decision in any sphere [12].
In the scientific literature, there are several different definitions of data quality. While getting acquainted with available scientific literature and other authors’ research results on data quality, author can distinguish some aspects that make it difficult to define the term data quality. One of the reasons why there is no common approach on defining data quality is that data quality is related to the use of data and cannot be evaluated in isolation from the data user [3, 18]. Secondly, the use of the data is usually explained as a multidimensional concept, which consists of a set of quality attributes, called the data quality dimensions and defined by data users [19]. For example, Redman [16] considers that data are fit for use if they are accessible, accurate, timely, complete, consistent with other sources, relevant, comprehensive, ensure an appropriate level of detail, are easy to perceive and interpret. Author found that the term data quality is defined depending on what field or sector it is used.
Author found specific data quality dimensions in the scientific literature: breadth and depth [9]; instrumental utility [8]; openness and clarity [5]; integrity [10]; portability [1]; redundancy, context, conciseness [7], for which authors do not offer an unequivocal explanation.
Author found that the most frequently mentioned data quality dimensions in the scientific literature are accuracy, completeness, consistency and timeliness [15]. Despite these dimensions are the most frequently applicable, in the scientific literature are still topical discussions on interpretation and evaluation of these data quality dimensions.
Based on the analysis of literature, author has identified the following key gaps in data quality assessment.
• The term data quality in the scientific literature is explained extensively and in various ways, depending on a particular area or sector, it is used in, for example, in the health care industry data quality means that data fits data users’ needs [2], a timely and reliable data are essential for public health to ensure the basic functions of all levels of government [13]. In the scientific literature there is an opinion that the quality of data is associated with data use and cannot be evaluated in isolation from the data user. Author believes that this approach leads to ambiguous interpretation of data quality, in this case subjective factors are of high importance.
• If specific data quality requirements are met, is usually assessed in the context of data quality dimensions. Each data quality dimension represents a specific aspect of data quality [19].
• Various authors offer different terminology of data quality dimensions, which essentially mean the same thing, for example, appearance and informativeness [7]. Sandelowski links dimension applicability with the term generalization [17], whereas, Guba refers to dimensions fittingness or transferability, which can evaluate applicability [11].
• In the scientific literature relationships between completeness and consistency and between timeliness and accuracy are often discussed, but it lacks deeper analysis of causes and consequences of these relationships.
• A number of scientists offer classifications of data quality dimensions, which is up to date in a particular sector or area, for example, Christy classifies data quality dimensions that characterize data quality of internet portals, in four categories: intrinsic data quality, accessibility data quality, contextual data quality, representational data quality [4]. In literature author did not found classifications of data quality dimensions of statistical data.
• Almost no research results are available, which propose indicators for evaluation of data quality dimensions. Indicators for assessment of data quality dimensions must reflect the nature of the data and peculiarities of data; quality estimation differs for different types of data.
2.Indicators for assessment of statistical data quality dimensions
Author developed a two-tier system of indicators on data quality assessment, which includes 13 data quality dimensions: data completeness, representativity, objectivity, quality of methodology, coherence, accessibility, accuracy of estimates, actuality, interpretability, statistical disclosure control, optimal use of resources, utility, informativeness (see Table 1).
Table 1
Definitions and assessment indicators for data quality dimensions
| Data quality dimensions and definitions | Indicators for assessment of data quality dimensions |
|---|---|
| Data objectivity The ability of statistical data to reflect the actual situation and its independence from the data users’ interpretations or evaluations | 1. Data acquisition form (statistical observation or survey) 2. Data stability over time 3. Data changes freedom from external random events (e.g. political) 4. Different survey question understanding (by statisticians and by respondents), the question is asked ambiguously 5. Influence level of mentality (e.g. religion, culture, history, traditions) on the respondents’ answers 6. Impact level of public opinion on the respondents’ answers 7. Statistical data relevance to reality |
| Data completeness Data meets user needs | 1. All the data are collected that are needed to carry out the assessment of the dynamics of phenomena 2. All the data are collected that are needed to carry out the assessment of phenomena by objects (industry, enterprise size groups, types of innovations, etc.) 3. All the data are collected that are needed to carry out the assessment of phenomena by objects (regions, etc.) 4. Need for data interpolation |
| Data representativity Sample data generalization capabilities | 1. Selected sample technique follows the task of statistical survey 2. Sample size follows the statistical survey task 3. The specific sample survey results attributing to the entire population 4. The survey response rate 5. Number of incorrect answers obtained during the survey |
| Data accuracy The degree of data reflection to the real situation | 1. Regular evaluation and testing of output data, intermediate results and statistical results 2. Regular assessment and correction of errors that may occur in the statistical data collection and processing process (sampling errors and non-sampling errors), according to Eurostat standards 3. Regular analysis of data revisions to improve statistical processes. |
| Quality of methodology Scientific justification of methodology (including approbation of methodology), correct use of methodology and unification level of methodology | 1. Quality programs and quality assurance procedures are approved and running in the statistical office 2. Data collection and processing methodology is in compliance with EU and international benchmarks 3. Data collection and processing methodology is scientifically justified, regularly monitored and improved 4. Applied data correction and imputation methods, which are regularly reviewed, corrected and updated 5. Data audits in accordance with the operational experience and clearly understandable procedures 6. Questionnaires testing before launching the statistical survey 7. Statistical indicators calculation methodology is scientifically justified, regularly monitored and improved 8. Errors and shortcomings repair is carried out in accordance with certain standards 9. Data collection and treatment process can be adapted to the needs of data users and a rapidly changing environment 10. Operativity of implementation of new data collection and processing methodology and/or new indicators calculation methodology 11. Unification level of statistical data collection and processing methodology 12. Data adjustment in case of the research object changes (data correction, recalculation) 13. Complexity of statistical data collection and processing, calculation methodology of statistical indicators for statistician 14. Capability of resources (time, labor, finance, etc.) for data collection and processing 15. Complexity of statistical data collection and processing for data users 16. The proportion of complex indicators (e.g. GDP) |
| Coherence Logical links between different statistical surveys’ findings, the data from different sources are comparable | 1. The methodological consistency between the different statistical domains (indicators calculation methods, different definitions of the statistical unit etc.) 2. Data from different statistical surveys are harmonized 3. Statistical office cooperate with the administrative database maintainer on data quality assurance issues |
| Actuality Data collection and processing speed and frequency of renewal | 1. Regular monitoring of statistical data actuality and practical utility 2. Statistical data publishing date and time is previously established and notified 3. Statistical data is in compliance with needs of data users 4. Frequency of renewal of statistical data 5. Statistical data acquisition and data processing duration 6. The time period between the end of the reporting period and the publication of preliminary data 7. The time period between the end of the reporting period and the final publication of data 8. The level of data users’ satisfaction is regularly monitored and systematically taken into account |
|
Table 1, continued | |
|---|---|
| Data quality dimensions and definitions | Indicators for assessment of data quality dimensions |
| Data accessibility Simplicity of data availability to the users | 1. All data users’ categories have equal access to the data and statistical surveys’ questionnaires 2. Information on the methods and procedures used by the statistical office is publicly available to data users 3. Data dissemination is carried out in different ways: in print, files, CD-ROM, Internet databases etc. 4. Data users have access to information on the final statistical data quality level in compliance with the European statistical quality criteria |
| Data interpretability Statistical data collection and processing methodology is available to the data users in order to make the correct interpretation of data | 1. Statistical data collection and proceeding methodology is available to data users 2. Definitions, calculation methodology, classifications etc. on socio-economic, demographic indicators are available to data users 3. Interpretation of dynamic statistical indicators (e.g. growth rate, etc.) is available to data users |
| Data informativeness Data presentation form that will enable data users to capture data quickly and easily navigate the data range | 1. Data presentation form enables data users to perceive data and the right to navigate on the data range 2. Data visualization enables data users to make a graphical analysis of the data 3. Components of complex indicators are displayed schematically, which enable data users to understand the nature of the indicator 4. Regional data are displayed on maps |
| Data utility Data users’ demand for the data | 1. Data can be used for different purposes (for decision making, for research, for forecasting etc.) 2. Data can be used by different users’ categories (government, researchers, organizations, media etc.) 3. Data users’ demand for data |
| Statistical disclosure control Confidentiality of the information provided by respondents | 1. Ensuring of statistical confidentiality is stated in the law 2. Confidentiality policy is available to the public 3. Staff of the statistical office works in compliance with the instructions on the protection of statistical confidentiality during the process of production and dissemination of statistics 4. External users who use data for research purposes comply with strict confidentiality rules 5. Physical, technological and organizational measures are implemented in the statistical office to ensure the security of statistical databases |
| Optimal use of resources Efficient use of existing resources for data collection and processing | 1. Use of resources by the statistical office is monitored with internal and independent external measures 2. During data collection, processing and dissemination there is a maximum use of potential of productivity of information and communication technologies 3. Various measures are being taken to improve the potential of administrative data for statistical purposes and to avoid direct surveys 4. Statistical office promotes and implements standardized solutions that increase resource efficiency and productivity |
Source: prepared by author.
Data quality dimensions proposed by author are relevant throughout the data preparation process that includes several stage. The author proposes the following stages of statistical data preparations process: evaluation of the need for data; planning and development; data collection; data processing, data analysis; data dissemination, data archiving, evaluation the process of data collection (see Table 2).
Data quality dimensions proposed by author are essential during every stage of producing statistical data, ensuring systemic approach towards data quality assessment. Table 2 provides an insight into which dimensions are primarily significant during each statistical data preparation stage. It should be pointed out that this does not preclude the possibility that in some particular case (e.g., depending on the data collection methodology etc.) some dimensions and its indicators are not relevant to another stage.
Table 2
Essential data quality dimensions within data quality preparation stages
| Statistical data preparation stages | Data quality dimensions |
|---|---|
| 1. stage. Evaluation of the need for data | Optimal use of resources, data utility |
| 2. stage. Statistical data production process planning and development | Quality of methodology, coherence of methodology, optimal use of resources |
| 3. stage. Data collection | Quality of methodology, coherence of data and methodology, accuracy, representativity, objectivity, actuality, statistical disclosure control, optimal use of resources |
| 4. stage. Data processing | Quality of methodology, coherence of data and methodology, accuracy, representativity, actuality, statistical disclosure control, optimal use of resources |
| 5. stage. Data analysis | Quality of methodology, coherence of data and methodology, accuracy, actuality, optimal use of resources |
| 6. stage. Data dissemination | Accessibility, informativeness, interpretability, utility, completeness, actuality, statistical disclosure control, optimal use of resources |
| 7. stage. Data archiving | Quality of methodology, coherence of data and methodology, statistical disclosure control, optimal use of resources |
| 8. stage. Statistical data collection process evaluation | Optimal use of resources |
Source: prepared by author.
Author conducted an expert survey with the aim of obtaining an expert – a statistician and statistical data user rating for the characteristics characterizing statistical data quality. Eleven experts participated in the expert survey, both experts involved in the collection and compilation of statistical data, and experts main users of statistical data:
• Three experts representing the Central Statistical Bureau of Latvia and responsible for the statistical data collection;
• Dr. oec., Chief Economist representing the Latvian Central bank;
• Dr. math., Associate Professor, Head of the Department from the Daugavpils University (Latvia);
• Dr.sc.ing. Associate Professor from the Riga Technical University;
• Dr.sc.ing., Professor from the Latvian University of Agriculture;
• expert of the Education Center of Latvian Association of Certified Auditors;
• Dr. oec., Associate Professor of the University of Latvia;
• senior expert of the Ministry of Finance;
• Dr. med., professor of the Riga Stradins University.
The expert survey conducted using the online survey methodology. During the survey, the experts were informed about the purpose, context and subject of the study. Descriptive statistical methods, statistical analysis methods were mainly used for analyzing the results. Summarizing the results of the survey, the modal, median and variation intervals or amplitudes of experts’ estimates were calculated for each indicator.
The identified major deficiencies in data quality served as the basis for preparing recommendations for improving data quality theories and methodologies.
The analysis of the most important data quality dimensions to ensure the optimal level of quality. The collection and analysis of the experts’ survey results makes it possible to identify the most important data quality dimensions for assurance of the optimum level of data quality. The most important data quality dimensions in this context are the following: data objectivity, data completeness, data accuracy, representativity, data actuality, quality of methodology. The less important are: data informativeness, optimal use of resources, statistical disclosure control and data interpretability. Author summarized assessment of experts-statisticians and experts-data users on data quality dimensions for assurance of the optimum level of data quality.
In the view of experts-statistician the most important data quality dimensions to ensure data quality for scientific research are data completeness, representativity and objectivity, while in experts-data users view data completeness is the less important to ensure data quality. Both experts-statisticians and experts-data users believe that the three most important dimensions to ensure the optimal level of data quality for management decision-making are data objectivity, accuracy and data actuality. In turn, the next important data quality dimensions by experts-statisticians rating is quality of methodology, but by experts-data users ratings it is data representativity. Among experts-statisticians the most significant data quality dimension for ensuring data quality for analysis of an object development during the reference period is quality of methodology, but experts – data users evaluated this dimension as less important. The most essential data quality dimensions for modelling and forecasting research object by expertsstatisticians rankings are data utility and accessibility, but by experts-data users rankings these dimensions are less important. Summarizing experts-statisticians and experts-data users assessments, author found that data objectivity, data completeness, data representativity, data accuracy, quality of methodology and accessibility are the most important data quality dimensions for experts-statisticians. In experts-data users view quality of methodology and data accessibility are not so important data quality dimensions as in experts-statisticians view. For experts-data users the most important are the following dimensions: data objectivity, accuracy, representativity, actuality and data utility. After clarifying the important data quality dimensions to ensure the optimal quality level, it is required to assess some shortcomings of the data quality dimensions.
Analysis of shortcomings of data quality dimensions. After summarizing experts’ survey results, author found the most problematic data quality dimensions: data objectivity, completeness, representativity, accuracy, quality of methodology, coherence and data interpretability.
Scientific definitions and explanations should be streamlined and clarified, mainly for the following dimensions: data objectivity, quality of methodology, data coherence and interpretability. Assessment methodology should be developed for data completeness, accuracy, representativity, quality of methodology, coherence and interpretability. Both scientific definitions and assessment methodology should be developed for quality of methodology, coherence and interpretability.
For improvement of data definitions and assessment methodology the most essential data quality assessment indicators should be found out.
Table 3
The most important data quality dimensions assessment indicators within statistical data preparation stages
| Statistical data preparation stages | Data quality dimensions assessment indicators |
|---|---|
| Evaluation of the need for data | Various measures are being taken to improve the potential of administrative data for statistical purposes and to avoid direct surveys (optimal use of resources) |
| Statistical data production process planning and development | Questionnaires testing before launching the statistical survey (quality of methodology) Statistical office promotes and implements standardized solutions that increase resource efficiency and productivity (optimal use of resources) |
| Data collection | Selected sample technique follows the task of statistical survey (data representativity) Different survey question understanding (by statisticians and by respondents), the question is asked ambiguously (data objectivity) Data collection and processing methodology is scientifically justified, regularly monitored and improved (quality of methodology) |
| Data processing | The specific sample survey results attributing to the entire population (data representativity) Statistical indicators calculation methodology is scientifically justified, regularly monitored and improved (data accuracy) Data collection and processing methodology is scientifically justified, regularly monitored and improved (quality of methodology) |
| Data analysis | The methodological consistency between the different statistical domains (indicators calculation methods, different definitions of the statistical unit etc.) (data coherence) Quality programs and quality assurance procedures are approved and running in the statistical office (quality of methodology) Physical, technological and organizational measures are implemented in the statistical office to ensure the security of statistical databases (statistical disclosure control) |
| Data dissemination | Statistical data is in compliance with needs of data users (data actuality) All data users’ categories have equal access to the data and statistical surveys’ questionnaires (data accessibility) Statistical data collection and proceeding methodology is available to data users (data interpretability) Data presentation form enables data users to perceive data and the right to navigate on the data range (data informativeness) Data can be used for different purposes (for decision making, for research, for forecasting etc.) (data utility) Data can be used by different users’ categories (government, researchers, organizations, media etc.) (data utility) All the data are collected that are needed to carry out the assessment of the dynamics of phenomena (data completeness) All the data are collected that are needed to carry out the assessment of phenomena by objects (regions, etc.) (data completeness) |
Source: prepared by author.
Analysis of experts’ assessment of data quality indicators. Analysis of results of the experts’ survey carried out by author makes it possible to identify the key indicators for assessment of the data quality dimensions (see Table 3). The most important indicators for assessment of data objectivity: data acquisition form (statistical observation or survey); different survey question understanding (by statisticians and by respondents), the question is asked ambiguously; statistical data relevance to reality. The most important indicators for assessment of data completeness: all the data are collected that are needed to carry out the assessment of the dynamics of phenomena; all the data are collected that are needed to carry out the assessment of phenomena by objects (regions, etc.). The most important indicators for assessment of data representativity: selected sample technique follows the task of statistical survey; sample size follows the statistical survey task; the specific sample survey results attributing to the entire population.
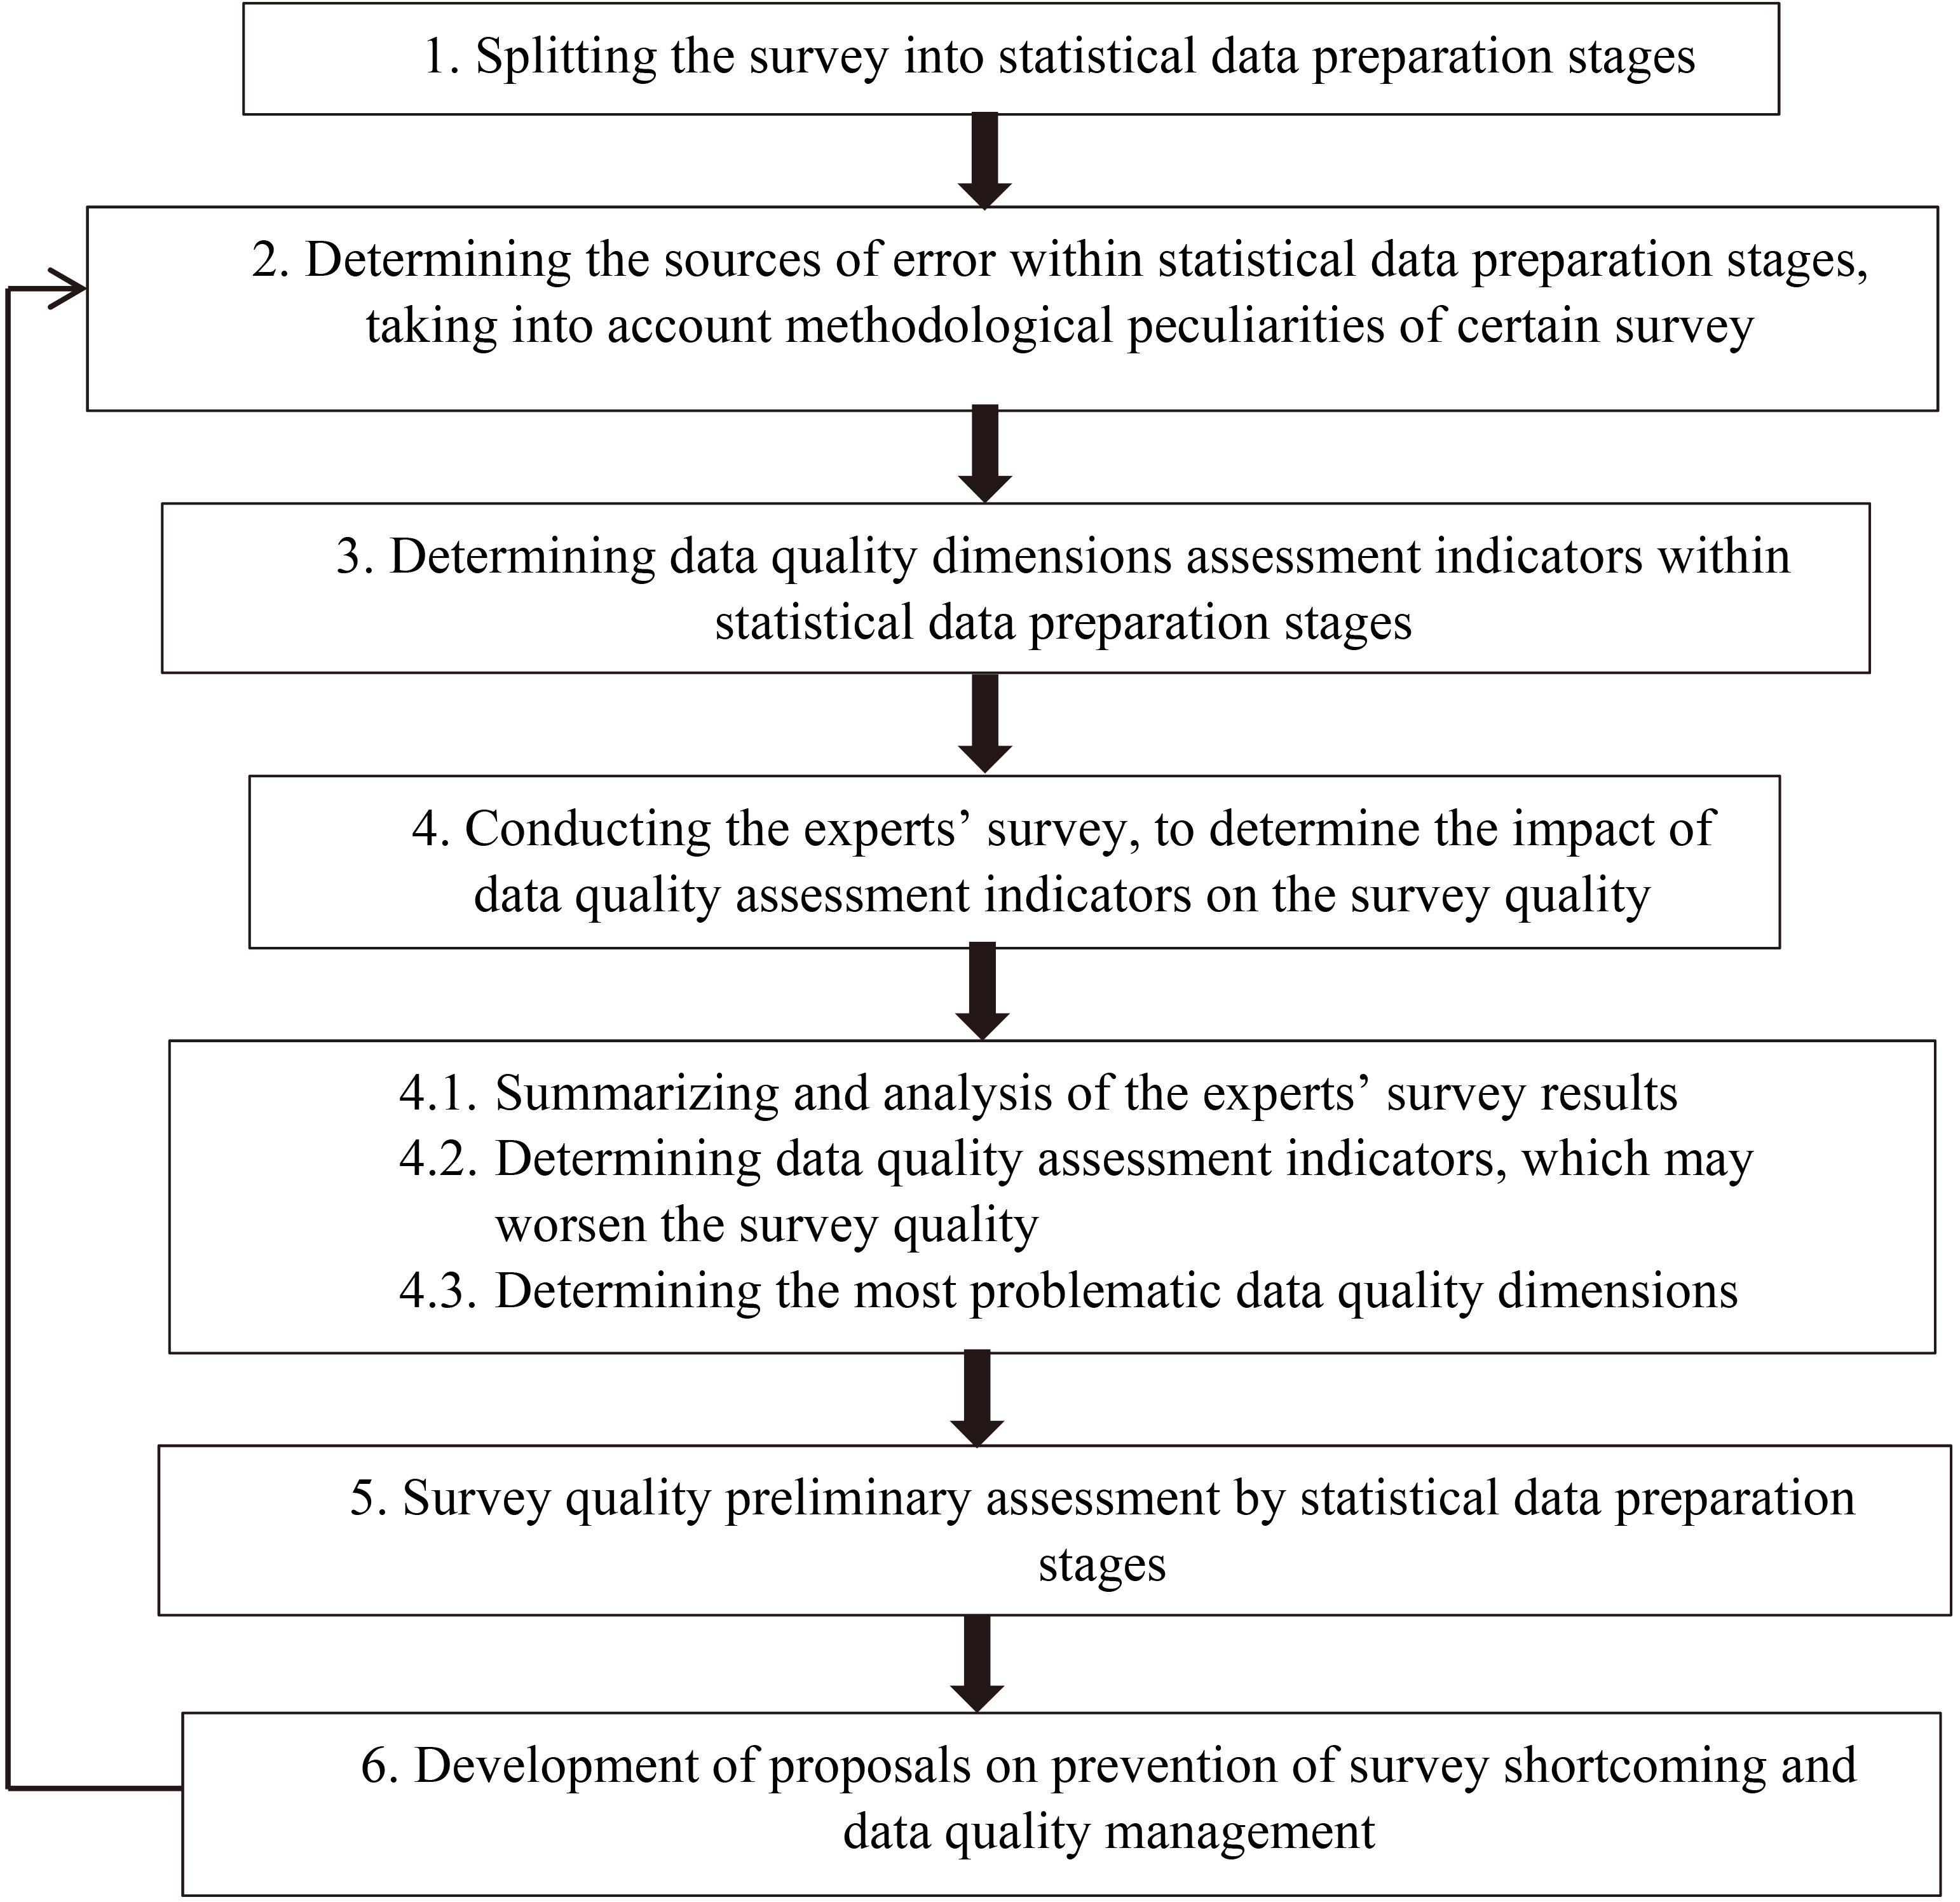
Figure 1.
Survey quality assessment methodology. Source: prepared by author.
The most important indicators for assessment of data accuracy: regular evaluation and testing of output data, intermediate results and statistical results; regular assessment and correction of errors that may occur in the statistical data collection and processing process (sampling errors and non-sampling errors); regular analysis of data revisions to improve statistical processes. The most important indicators for assessment of quality of methodology: data collection and processing methodology is scientifically justified, regularly monitored and improved; statistical indicators calculation methodology is scientifically justified, regularly monitored and improved; errors and shortcomings repair is carried out in accordance with certain standards. The most important indicators for assessment of data coherence: the methodological consistency between the different statistical domains (indicators calculation methods, different definitions of the statistical unit etc.); data from different statistical surveys are harmonized. The most important indicators for assessment of data actuality: statistical data is in compliance with needs of data users; frequency of renewal of statistical data; the time period between the end of the reporting period and the final publication of data; regular monitoring of statistical data actuality and practical utility. The most important indicators for assessment of data accessibility: information on the methods and procedures used by the statistical office is publicly available to data users; all data users’ categories have equal access to the data and statistical surveys’ questionnaires. The most important indicators for assessment of data interpretability: definitions, calculation methodology, classifications etc. on socio-economic, demographic indicators are available to data users; statistical data collection and proceeding methodology is available to data users. The most important indicators for assessment of data informativeness: data presentation form enables data users to perceive data and the right to navigate on the data range; data visualization enables data users to make a graphical analysis of the data. The most important indicators for assessment of data utility: data can be used for different purposes (for decision making, for research, for forecasting etc.); data can be used by different users’ categories (government, researchers, organizations, media etc.). The most important indicators for assessment of statistical disclosure control: external users who use data for research purposes comply with strict confidentiality rules; physical, technological and organizational measures are implemented in the statistical office to ensure the security of statistical databases. The most important indicators for assessment of optimal use of resources: statistical office promotes and implements standardized solutions that increase resource efficiency and productivity; during data collection, processing and dissemination there is a maximum use of potential of productivity of information and communication technologies.
Survey quality assessment methodology. Summarizing experts’ survey results on data quality dimensions, theoretical knowledge about data quality and methodological peculiarities of the survey on innovations in enterprises, author developed survey quality assessment methodology. Survey quality assessment algorithm, after which the final conclusions on the quality of the survey should be carried out author depicted at the Fig. 1. Based on the proposed survey quality assessment methodology, author found out several shortcomings of the survey on innovations in enterprises that is conducted by the Central Statistical Bureau of Latvia every second year.
During the first step, the process of preparation of statistical data on innovations is divided into several stages: planning and development; data collection; data processing, data analysis; data dissemination, data archiving.
The second step determines the sources of possible errors in each of the stages, taking into account the methodological characteristics of the survey. The author identified sources of potential errors in the context of the survey on innovations in enterprises. For example, the most significant potential source of error in the statistical data on innovation is the identification of the target population, the training of statisticians before the survey on innovation. Statisticians play an important role in the collection of qualitative data, as provide explanations to respondents about what is innovation in the context of the survey, to advise respondents how to distinguish between different types of innovations (product, process, organizational or marketing, etc.). The quality of the training of statisticians is essential to ensure data impartiality. During the data collection phase, sources of potential errors are lack of respondent answers, inaccessibility of respondents (contacts are not available), way of data collection (e.g. by mail, online, by telephone), questionnaire design (subject and matter of the question, degree of complexity, explanation comprehensibility, logical layout of questions, etc.). Shortcoming of the questionnaire design impairs the objectivity of the data. In the data dissemination phase, the main potential source of errors is the lack of precision in formulating indicators that adversely affect the interpretation of the data. So each type of indicator must be precise and understandable so that data users can interpret the data correctly. During the data processing, data verification and logical control can detect potential sources of errors. After determining the source of errors in each of the stages of the survey, author determined the importance of the sources of potential sources of error and selects the less and the most significant sources of errors.
During the third step, taking into account the most significant sources of errors, author determined the data quality dimensions and indicators essential at each stage of the survey.
During the fourth step, an expert survey conducted to determine the impact of data quality assessment indicators on the quality of the survey, then analysis of the results of expert surveys performed, selected data quality evaluation indicators that can negatively influence the quality of the survey and determined the most problematic dimensions of data quality.
Based on author’s developed Data quality dimensions assessment methodology, author carried out an experts’ survey on the quality of statistical data on innovations. While evaluating quality of statistics on innovations, experts identified indicators that may have negative impact on quality of statistics. Data quality dimensions, to which attention should be payed to improve the quality of statistics on innovations are the following – data objectivity, quality of methodology, data completeness and data representativity. Based on the experts’ survey results on the quality of statistics on innovations, author identified indicators, which may have negative impact on the quality of survey on innovations results. In experts’ view the following indicators may worsen innovation statistics data objectivity: data acquisition form (statistical observation or survey); different survey question understanding (statistician – respondent), the question is asked ambiguously; influence level of mentality (e.g. religion, culture, history, traditions) on the respondents’ answers; impact level of public opinion on the respondents’ answers. In experts’ view the following indicator may worsen innovation statistics data completeness: need for data interpolation. In experts’ view the following indicator may worsen innovation statistics data representativity: number of incorrect answers obtained during the survey. Quality of methodology may worsen by complexity of statistical data collection and processing, calculation methodology of statistical indicators for statistician; capability of resources (time, labor, finance, etc.) for data collection and processing; complexity of statistical data collection and processing for data users.
After identification of deficiencies of quality of statistics on innovations some further steps to improve the quality of survey on innovations should be performed and expert surveys might be repeated for assessment of effectiveness of quality improvement measures. Author believes that to achieve positive quality improvement tendency of statistics on innovations, cooperation between the Central Statistical Bureau and the main data users (public authorities, universities, high schools, associations, etc.) should be promoted.
Author’s developed statistical survey quality assessment methodology is recommended not only for assessment of the survey on innovations in enterprises, but also for quality assessment of another data (such as data on another industry or other another type of data). It should be noted that the methodology and the system of data quality indicators developed by author can be used as a basis for data quality assessment in each country and in each institution involved in data collection process (not only national statistical offices, but also non-governmental institutions, research centers, universities, national central bank, enterprises, government sector institutions etc.). Each institution can adapt the system proposed to its specific needs.
3.Conclusions
1. The scientific literature lacks the terminology to describe data quality dimensions and data quality concept which causes confusion and uncertainty in data quality assessment and reduces reliability of results of applied data quality evaluation methods.
2. The scientific literature does not offer a complex methodology for assessing data quality in general but proposes methodology for assessing the quality on individual dimension level.
3. In the view of experts, assessment methodology should be improved for data completeness, accuracy, representativity, quality of methodology, data coherence and data interpretability.
4. To ensure quality of statistical data on innovations, the following data quality dimensions should be improved – data objectivity, quality of methodology, data completeness and data representativity.
5. Summarizing experts-statisticians and experts-data users, author identified that data objectivity, data completeness, data representativity, data accuracy, quality of methodology and data accessibility are the most important data quality dimensions for experts-statisticians. Experts-data users do not consider quality of methodology and data accessibility to be as important dimensions as experts-statisticians do. In the view of experts-data users, the most important are the following dimensions: data objectivity, data completeness, data accuracy, data representativity, data actualityand data utility.
References
[1] | Caby, B.C., Pautke, R.W., Redman, T.C., (1995) , Strategies for improving data quality. Data Quality, 1: (1), 4-12. |
[2] | Canadian Institute for Health Information, (2009) , The CIHI Data Quality Framework, CIHI, Ottawa, Canada. |
[3] | Chrisman, N.R., (1991) , The Error Component in Spatial Data. In: Geographical Information Systems, Maguire, D.J., Goodchild, M.F., Rhind, D.W. (eds), Principals: Longman Scientific and Technical, Vol. 1: , pp. 165-174. |
[4] | Christy, S., Rajakumari, S.B. et al., (2010) , Quality data representation in web portal – A case study, Trendz in Information Sciences & Computing (TISC), IEEE, 230-232. |
[5] | Cohen, D.J., Crabtree, B.F., (2008) , Evaluative criteria for qualitative research in health care: Controversies and recommendations, Annals of Family Medicine, 6: (4), 331-339. |
[6] | Davies, H., Nutley, S., Smith, P. (Eds.), (2000) , What works? Evidence-based policy and practice in public services, UK, Bristol: Policy Press, 366 pages. |
[7] | Delone, W.H., McLean, E.R., (1992) , Information systems success: The quest for the dependent variable, Information Systems Research, 3: (1), 60-95. |
[8] | Eisner, E.W., (1991) , The enlightened eye: Qualitative inquiry and the enhancement of educational practice. New York: Macmillan Publishing Company, 264 pages. |
[9] | Flick, U., (1992) , Triangulation revisited: Strategy of validation or alternative? Journal for the Theory of Social Behaviour, 22: (2), 175-197. |
[10] | Garman, N., (1994) , Qualitative inquiry: Meaning and menace for educational researchers. In: Smyth, J.S. (ed.), Conference proceedings for the mini-conference: qualitative approaches in educational research, The Flinders University of South Australia, pp. 3-11. |
[11] | Guba, E.G., (1981) , Criteria for assessing the trustworthiness of naturalistic inquiries, Educational Resources Information Center Annual Review Paper, 29: , 75-91. |
[12] | Helenius, R., Mikkela, H., (2011) , Statistical literacy and awareness as strategic success factors of a national statistical office – the case of Statistics Finland, Statistical Journal of the IAOS, 27: , 137-144. |
[13] | Institute of Medicine, (2003) , The Future of the Public’s Health in the 21st Century. The National Academies Press; Washington, DC, USA, 536 pages. |
[14] | Nutley, S.M., Davies, H.T.O., (2000) , Making a reality of evidence-based practice: Some lessons from the diffusion of innovations, Public Money and Management, 20: (4), 35-42. |
[15] | O’Donoghue, J.M., O’Kane, T. et al., (2011) , Modified early warning scorecard: The role of data/information quality within the decision making process, Electronic Journal Information Systems Evaluation, 14: , 100-109. |
[16] | Redman, T.C., (2001) , Data quality: the field guide. Boston: Digital Press. |
[17] | Sandelowski, M., (1986) , The problem of rigor in qualitative research, Advances in Nursing Science, 8: , 27-37. |
[18] | Strong, D.M., Lee, Y.W., Wang, R.W., (1997) , Data quality in context, Communications of ACM, 40: (5), 103-110. |
[19] | Wang, R.Y., Strong, D.M., (1996) , Beyond accuracy: What data quality means to data consumers, Journal of Management Information Systems, 12: (4), 5-33. |
[20] | Wang, R.Y., Ziad, M., Lee, Y.W., (2001) , Data Quality. New York: Springer. |
[21] | Ylaranta, M., (2006) , Between two worlds – stakeholder management in a knowledge-intensive government organisation. Publications of the Turku School of Economics, Series A-7: 2006, 188 pages. |


