
Labour Market Areas for territorial policies: Tools for a European approach
Abstract
Labour Market Areas (LMAs) are regions built on the basis of commuting to work data so that the majority of the labour force lives and works within their boundaries. LMAs have long being recognised as relevant for assessing the effectiveness of local policy decisions. Eurostat encourages LMA development in the European Union. The idea is to share methods and tools towards the creation of a harmonised geography. As the LMA functional approach to territorial partitioning is getting more and more used for policy purposes, the demand for indicators is increasing. The paper illustrates the shared method, the recently publicly available software package LabourMarketAreas developed at Istat for LMA design. The paper also presents examples of indicators at LMA level built from register data. Finally the small area estimation method implemented by Istat to release employment and unemployment rates at this geographical level is sketched.
1.Introduction
Since the Barca report [1] the European Union (EU) has recognised the essential need for place-based policies and Europe 2020 strategy is reinforcing the territorial dimension in official statistics. Several types of territorial units with their corresponding data are present in the EU, see [2], the choice of geographies to obtain meaningful indicators is of paramount importance. In the European Cohesion Policy context geographies need to reflect the inherent structure of the social and economic reality. Eurostat claims [3] that functional regions based on commuting to work data have the potential to play a main role in the evaluation and monitoring of policies at European and national scale.
LMAs are functional regions initially studied by Smart in the seventies [4]. Their main characteristic is self-containment: most of the resident population works within their boundaries. They stem from the aggregation of elementary geographical units (municipalities, census output areas, etc.) on the basis of their level of spatial interaction measured by commuting to work flows.
The seminal paper for the delineation of Travel-To-Work-Areas [5] allowed the design of the first TTWA geography in Great Britain and Italy in the ’80s (see the work done by Istat, the Italian National Institute of Statistics [6]) followed by several national applications, see [7] for a review. Other methodologies have been developed ranging from hierarchical algorithms [8, 9] to stochastic optimisation [10], from network analysis [11] to spatial modelling [12].
On the basis of the report commissioned by Eurostat [13] the Task Force on the harmonisation of LMAs adopted principles and presented a proposal [14] shared by EU Member States (MSs). In 2015 grants have been awarded http://ec.europa.eu/eurostat/cros/content/labour-market-areas_en; Istat, by mean of the grant, “EU-TTWA method: improvements, documentation and sharing knowledge activities” (http://www.istat.it/en/archive/182743), developed and released the free and open source software LabourMarketAreas together with its documentation, see [15]. Guideline development, technical reporting, training and continuous cooperation with other MSs represent further core tasks of such grant. However, the effective use of this geography requires content i.e. the release of relevant structural and socio-economic indicators.
The aim of this paper is the description of the method, the presentation of the tools developed at Istat to build the LMA geography and the approaches used so far to compute indicators at this territorial level. Approaches heavily depend on the type of data source available; they range from simple estimators to complex model based one. Section 2 describes the contribution to EU-level harmonisation and comparability of the software tool. Section 3 briefly illustrates the implemented algorithm and the complete LMA delineation process as included in the R [16] package LabourMarketAreas. Then indicators developed at Istat are presented: Section 4.1 deals with business register indicators whereas Section 4.2 sketches the small area method to estimate employment and unemployment rate at LMA level. Conclusions and further developments are given in Section 5.
2.Harmonisation by free and open source tools
Istat has developed the R package LabourMarketAreas [15] to ease the production process of LMA delineation. The choice of developing free and open source software has several advantages, besides the obvious and important cost reduction. First of all, the audience in terms of users and developers should increase, thus initiating a virtual circle of innovation. This will hopefully lead, in the medium term, to a widespread increase in the level of knowledge, expertise and awareness in the field of functional areas, especially inside the European Statistical System (ESS). Secondly, users will have the possibility to test the implemented solutions, algorithms and methodologies in many different real situations and to perform their own sensitivity analyses. Consequently, a better decision-making process would be enhanced. The package LabourMarketAreas is copyrighted and distributed under the Free Software Foundations GNU General Public Licence, see www.gnu.org/licences/#GPL which gives the licensee a great amount of freedom in the area of further development. Thirdly, the development of a free and open source tool significantly improves the reproducibility of the underlying research or published/disseminated output and statistics. This is a crucial issue for the ESS as transparency against stakeholders and general public is one of its fundamental pillars. Fourthly, the use of a common tool to identify LMAs would enhance cross border analyses that are extremely relevant in specific European regions. Last but not least, the usage of shared methodology and software tool for LMA identification represents a major contribution to achieving harmonisation and comparability at EU level.
3.The R package LabourMarketAreas
The R package LabourMarketAreas implements the whole LMA delineation process. Its main feature is the aggregation process of the elementary territorial units for which commuting data is available, Section 3.1. Moreover, it includes tools for dealing with spatial contiguity of geographical areas. It also allows for LMA analysis through visualisation and their assessment via statistical quality indicators. All these facilities are described in Section 3.2.
3.1The implemented algorithm
In this section the rule based iterative agglomerative algorithm implemented in the package LabourMarketAreas is briefly presented; see [18] for its full description, it is based on the experience outlined in [17]. The algorithm in the package LabourMarketAreas belongs to the set of methodologies identified by [13] as the most suitable ones at European level. The input of the algorithm is the census/register based commuting matrix of flows surveyed at basic geographical units, called communities. Given such Origin-Destination trips to work, the algorithm creates a partition of the territory such that all areas satisfy the so called validity rule. Such rule depends on area size, the number of commuters living in the area, and on self-containment, the proportion of the commuters not crossing area borders. In particular, the validity rule sets a trade-off between area size and its level of self-containment. The rationale is the smaller the area the higher the self-containment to be considered adequate. Lower self-containment values are instead acceptable for larger areas. These cut-off levels are defined by users through four parameters: minSZ, tarSZ, minSC and tarSC. minSZ is the area acceptable minimum size whereas tarSZ is the size for an area to be considered large. minSC is the acceptable minimum level of self-containment for large areas whereas tarSC is the acceptable minimum level of self-containment for small areas. Values of self-containment range by definition from 0 to 1, however possible values for the minimum minSC lie between 0.6 and 0.7 and for the target, tarSC, between 0.7 and 0.85.
The algorithm starts by considering each community as an area that is checked against the validity rule. At each iteration, the furthest from validity rule area is dissolved into its constituent communities. Based on the strength of the link to other areas, as defined in [4], one selected community is attached to a new area. When this new agglomeration increases the validity value w.r.t. its previous level, the assignment is performed. Otherwise, the community is put into a reserve list to be assigned after convergence, see [18]. Convergence occurs when all areas satisfy the validity rule.
3.2LMA delineation process
The implemented process consists of four subsequent stages. Table 1 lists them and the corresponding tools in the package; the full documentation is present in the package description [15]. In the first stage, the user selects the parameters and applies the rule-based algorithm (Section 3.1). The main output consists of a territorial partition characterised by some core figures such as size of initial communities in terms of commuters living in; size of LMAs and number of commuters working there; flows between LMAs. Moreover, information regarding the path to the algorithm convergence is provided. Then, LMAs are named after the community having the maximum incoming flows. When community geographical coordinates are available in geospatial vector format, tools to deploy this information at LMA level are included in the package in order to visualise them.
Table 1
Stages of LMA production process and tools in LabourMarketAreas
| Stage | Action | Tool name |
|---|---|---|
| 1 | Identification of a partition by | findClusters |
| applying the rule-based algorithm | AssignLmaName | |
| CreateLMAShape | ||
| 2 | Quality assessment and compliance | StatReserveList |
| to core LMA defining principles | StatClusterData | |
| 3 | Validation of the spatial contiguity | FindIsolated |
| constraints (fine tuning) | FindContig | |
| FineTuning | ||
| 4 | Sensitivity analysis and | PlotLmaCommunity |
| visualisation | CompareLMAsStat |
Quality assessment (second stage) is performed by analysing statistical indicators provided by the package. Such statistics describe areas, flows and the entire partition; they allow testing the compliance of the solution to LMA principles. Examples of area level indicators include the level of self-containment, the number of attracting communities and commuters living in the area measuring, respectively, autonomy, relevance and homogeneity characteristics.
As the algorithm is based solely on commuting flows, some areas may include communities which are not spatially contiguous. Based on geospatial information the tools implemented in the R package allow complying with the contiguity principle (third stage). Table 1 lists the tools which identify non-contiguous areas and re-assign communities accordingly. This fine tuning procedure is based on both visualisation and strength of links between geographical entities.
Sensitivity analysis (fourth stage) can be performed by setting different groups of parameters in the algorithm. In this way the multivariate optimisation problem of finding the most appropriate partition can be addressed.
This package has been used by Istat to produce the Italian 2011 LMAs, see [19]. The commuting to work data stem from the 2011 Italian Population Census. Roughly 19 millions commuters (as defined by the census) create nearly 600 thousands commuting flows between the 8092 Italian municipalities. In terms of commuters living in such municipalities the smallest community has 4, the largest (Roma) has nearly 900 thousands. The self-containment was set equal to 0.75 (tarSC) and 0.6 (minSC) for size area of 1000 (minSZ) and 10000 (tarSZ). After fine tuning, the resulting partition comprises 611 LMAs; the package takes about two hours to reach convergence. These LMAs range from small size areas in mountainous regions to large ones in developed areas (e.g. the LMAs of Roma and Milano have well over one million commuters living in).
Other National Statistical Institutes (NSIs) have used the package to produce LMAs (e.g. Denmark) or are investigating its potentials, see [20] for example. In the ESS, each country determines, after sensitivity analysis, the combination of parameters better representing both the geography and the labour market.
4.Production of indicators at LMA level
The package creates the infrastructure. However, the continuous monitoring and assessment of policies are possible only through the dissemination of relevant socio-economic indicators at LMA level. Official statistics databases, administrative registers and survey data allow labour market evaluation. Moreover, the use of sound statistical methodologies guarantees the construction of relevant indicators satisfying the most accurate coherence and consistency criteria. Such indicators need to take into consideration the many facets of labour market. They should simultaneously quantify its dimensions (demand and supply side) and their matching. There is an enormous scientific literature on such measures; a review is out of the scope of this paper. Here the aim is providing concrete examples of statistical procedures based on registers and sample data. These kinds of data sources are the most used within ESS to derive statistics and disseminate information. The examples are taken from Istat Business Register Frame-SBS, Section 4.1, and the Labour Force Survey (LFS), Section 4.2.
4.1Register-based indicators
The statistical registers commonly used within ESS are exhaustive data sources. Frame-SBS, Istat statistical data warehouse at firm-level, is a business register yearly produced since 2011. Such register allows for computing key economic account variables, i.e. structural business statistics, at a very refined level of detail, thus facilitating the dissemination of better focused data. A recent Istat project further extended Frame-SBS register by developing additional indicators. The new indicators aim at measuring different socio-economic dimensions like labour input, performance, competitiveness, etc. Territorial characteristics have also received a special attention during the Frame-SBS extension project. The interaction between enterprises and the territory is measured mainly through their establishments. Both FRAME-SBS and establishment registers have the end of the year as reference date. They are derived using a mixture of administrative and survey data. By considering the local unit information which is registered at municipality (i.e. community) level, many indicators reflecting the delocalisation strategies of the enterprises may be derived using a bottom-up approach. Basic examples involve number of employees and/or local units and/or headquarters of enterprises by LMA.
Further indicators may be derived by mixing different economic or territorial dimensions with the number of employees. Entrepreneurship density,
Figure 1.
Combined index of
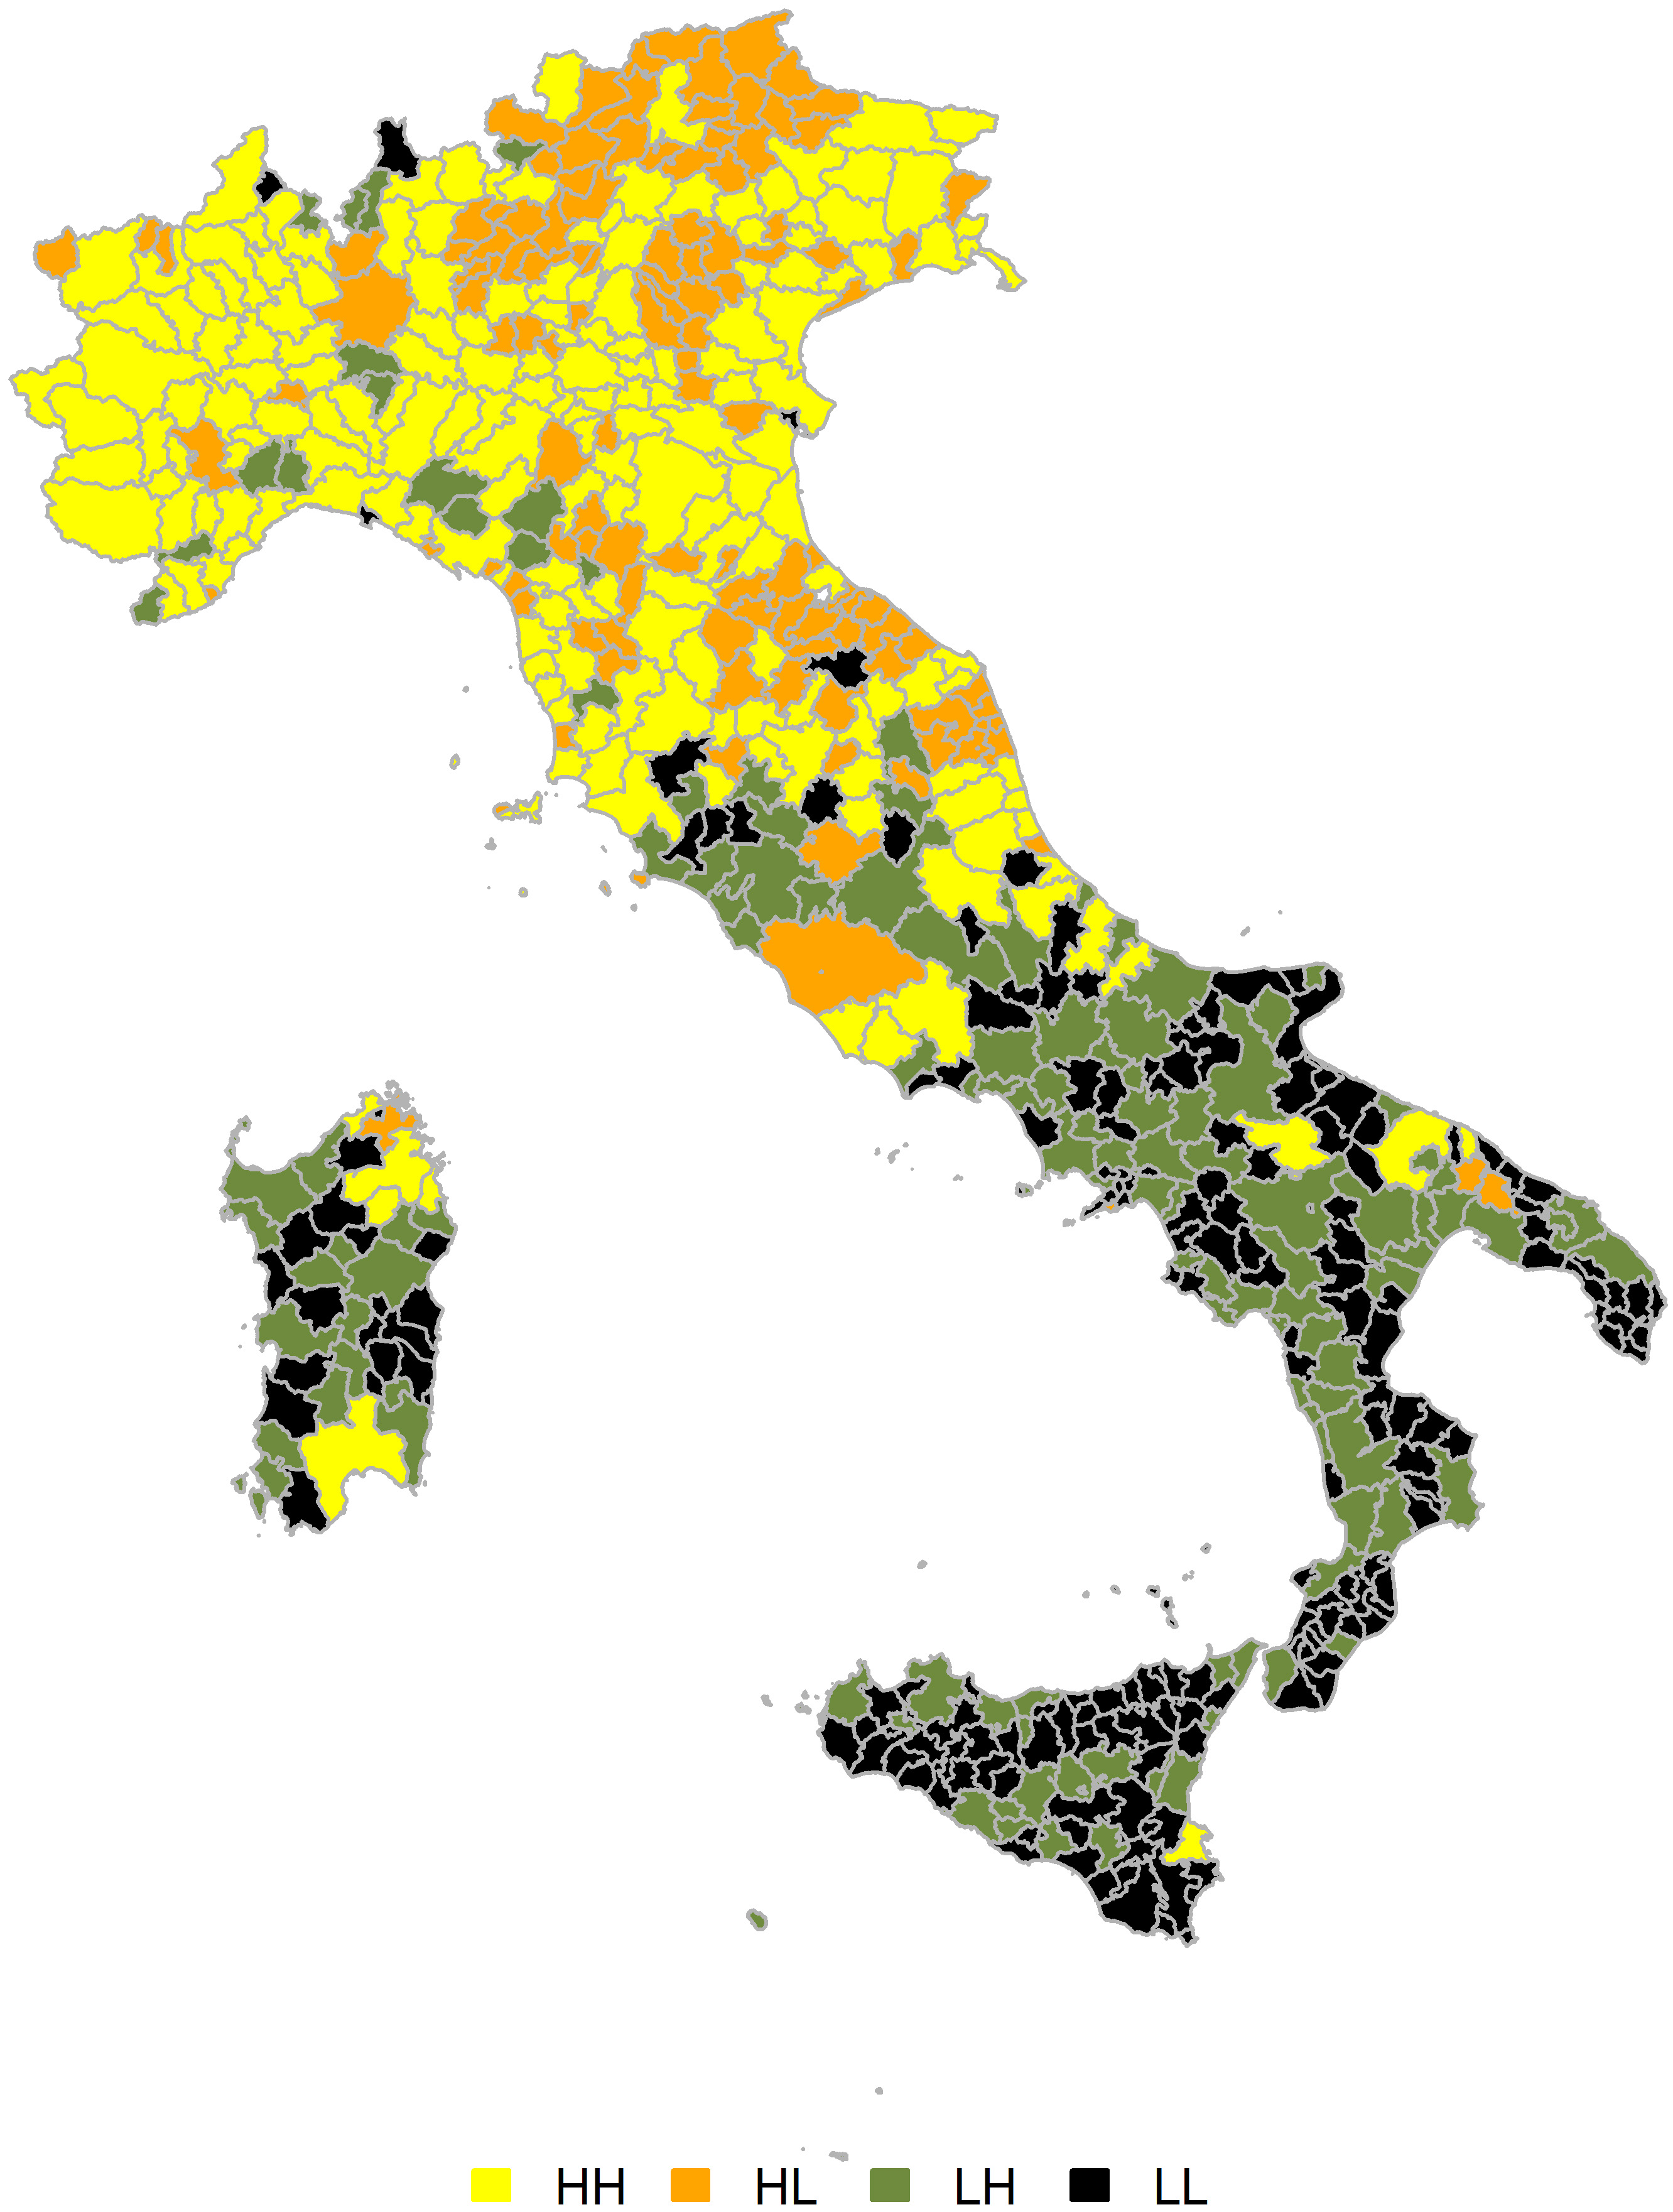
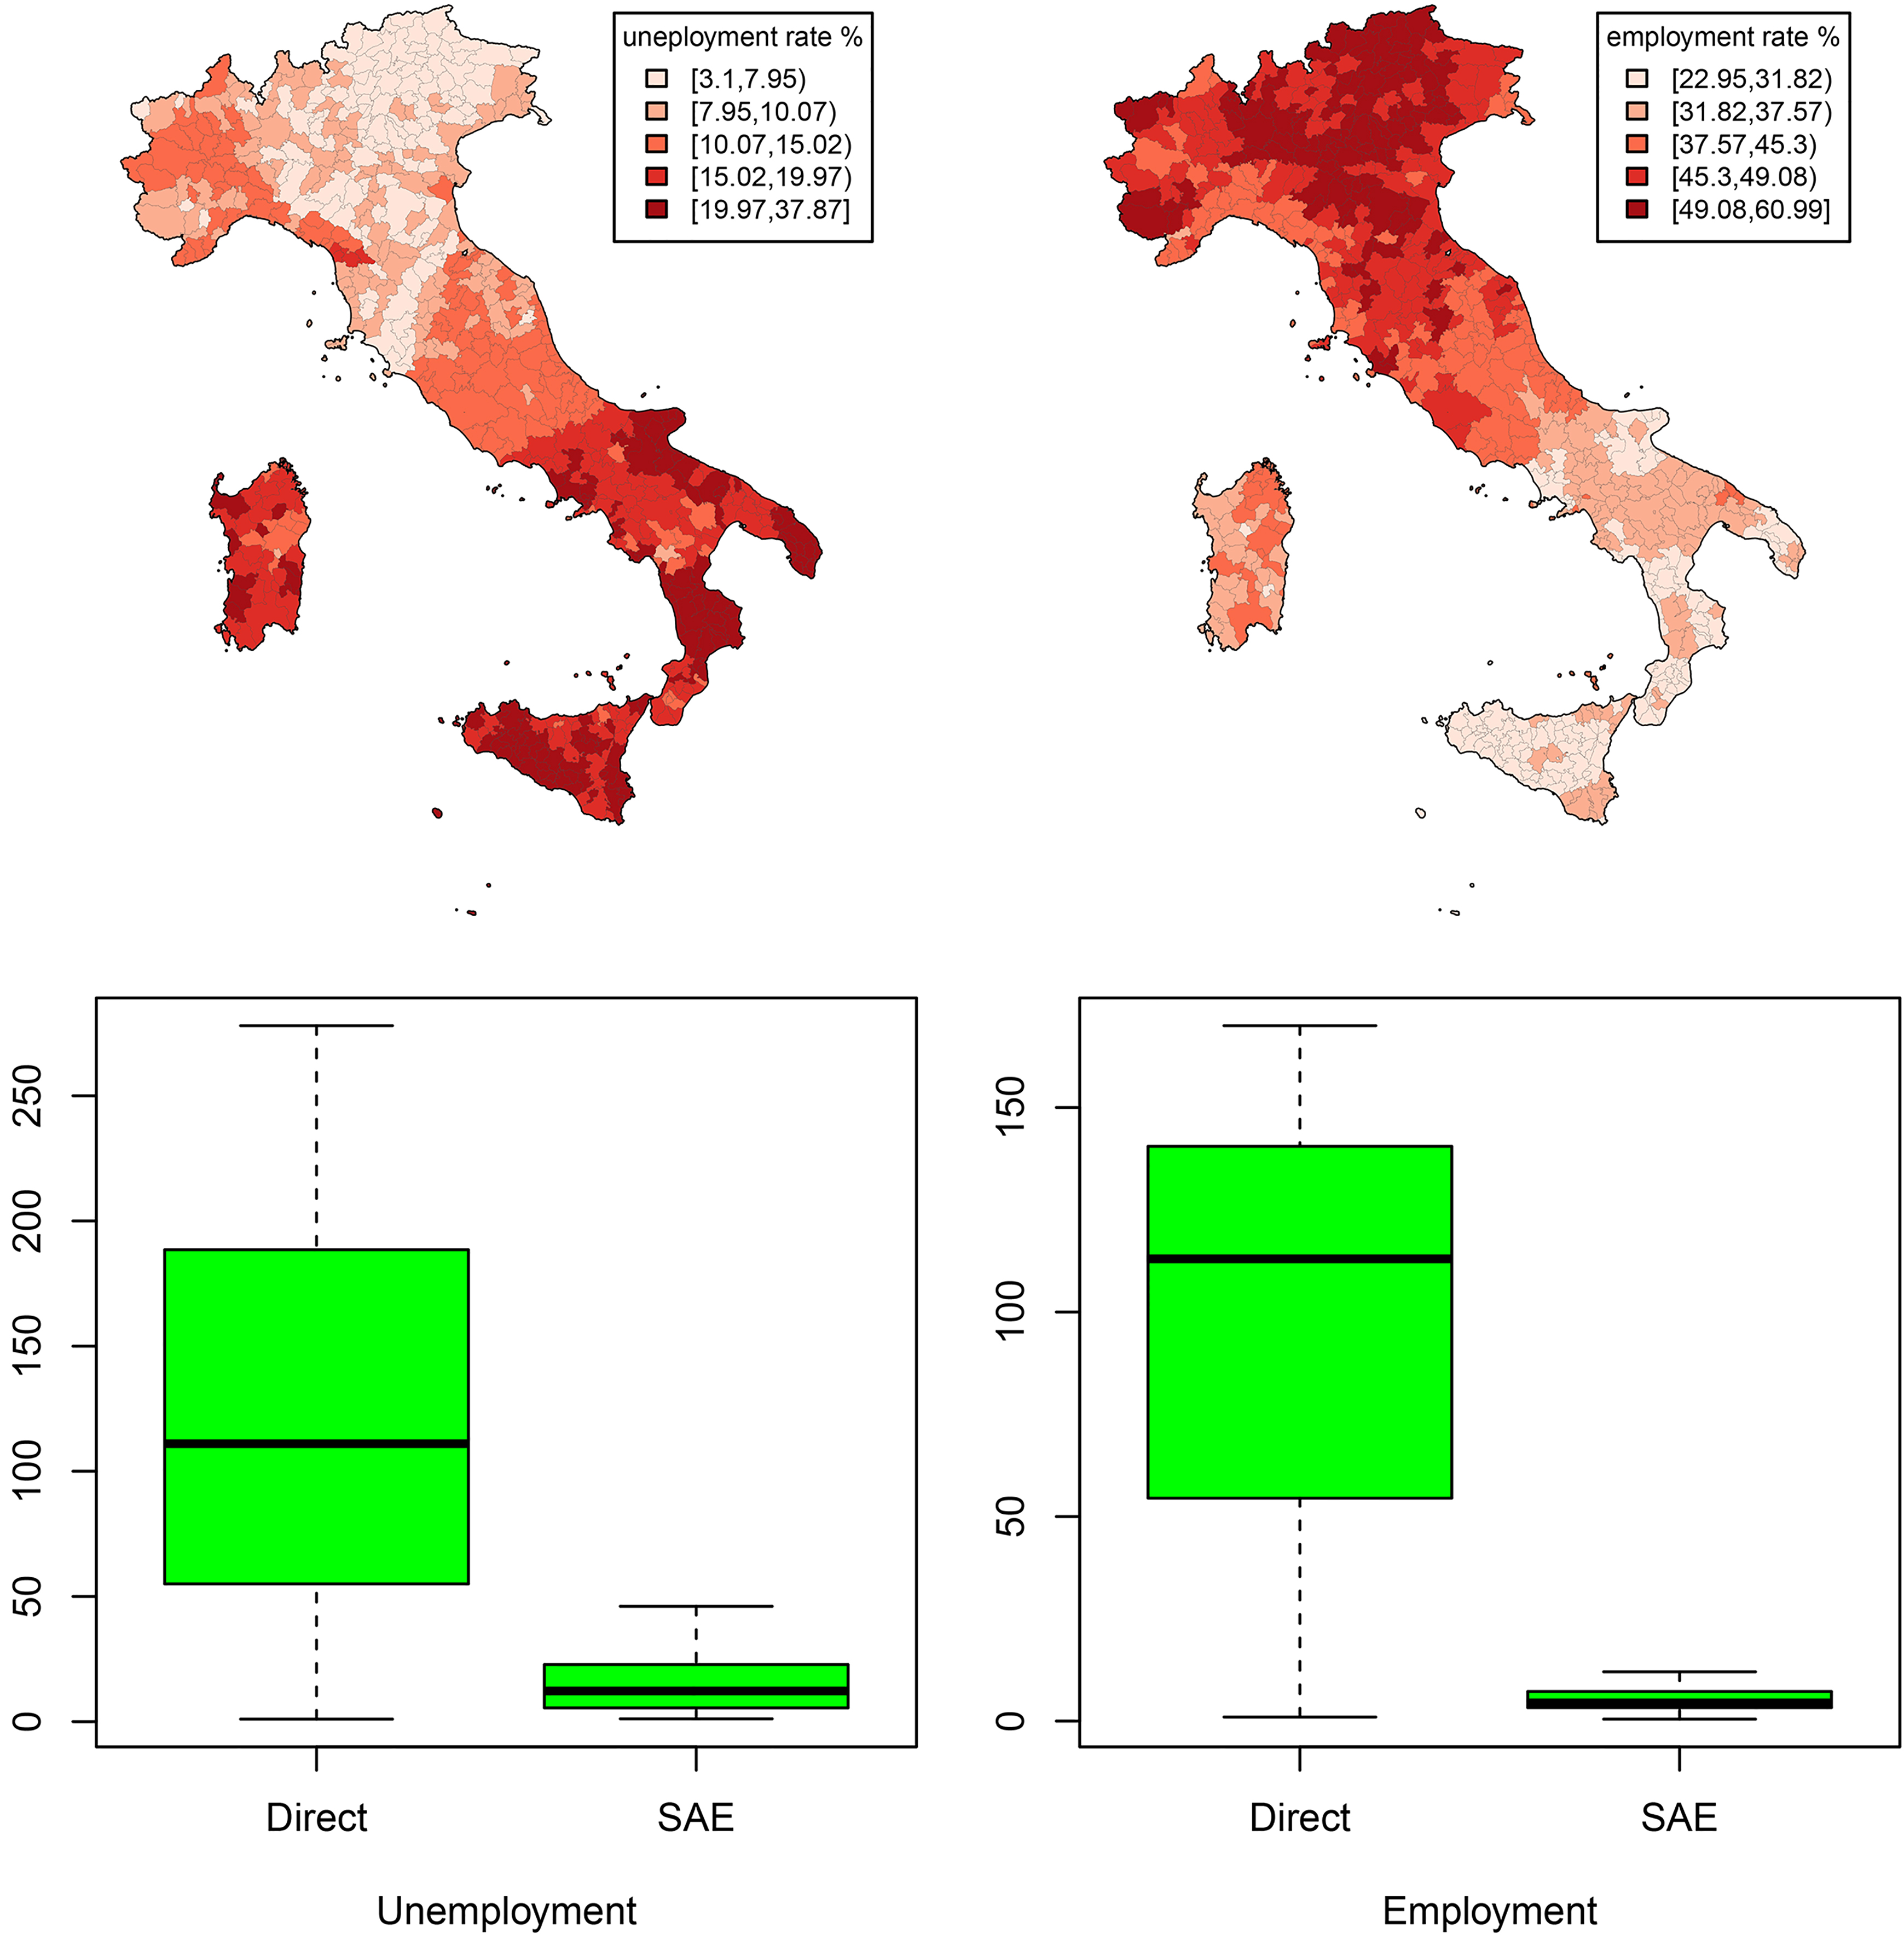
Figure 2.
ST-EBLUP estimates of unemployment and employment rate at LMA level in Italy and efficiency gain of the estimator over the direct one (year 2014).
More complex approaches may be envisaged when combining the LMAs and the principal economic activity information. For example, an analysis of homogeneous groups of LMAs was performed in [19]. The homogeneity was achieved by iteratively applying statistical techniques like correspondence and cluster analysis on number of employees by NACE Rev.2 group.
Finally, care needs to be taken for economic performance indicators at LMA level. In fact, key economic variables (as value-added at factor costs, turnover, etc.) are not registered at local unit level in Frame-SBS. Consequently, before applying any bottom-up procedure, a preliminary data treatment is necessary. Indeed, when using different territorial partitions (regions/LMAs) and different analysis units (firms/ local units) a critical issue to be faced by official statistics is consistency of disseminated indicators. Different economic theories, based on well-known working assumptions, may be applied to estimate economic indicators at establishment level in order to compute the LMA one. Istat is currently testing such hypotheses (e.g. based on weighting schemes, see [19]) to release these indicators yearly.
4.2Small-area estimation of Labour Force Survey figures
The most important large scale surveys carried out by NSIs are repeated surveys. They are intended to produce the estimates for several parameters, such as overall counts, means, ratios of the whole population, as well as for population sub-sets. Generally, sample sizes are not large enough to guarantee, for all the sub-populations/domains of interest, reliable direct estimates (i.e. based solely on sample information from the sub-population itself). In such cases small area estimation (SAE) methods can be applied to overcome the problem. These methods borrow strength from the information collected in other domains, resulting in increasing the effective sample size for each small area. In this section Istat method to compute small area annual estimates of labour status for all Italian LMAs based on LFS is briefly described.
The LFS is the main source of information on the Italian labour market and is aimed to produce official estimates of employment, unemployment and inactivity rates over different territorial domains. It is a quarterly two stage municipality/household survey with partial overlap of sampling units according to a precise rotation scheme. For each quarterly sample about 1350 municipalities and 200,000 individuals are involved. Direct estimates are disseminated monthly, quarterly and annually. Only annually reliable estimates can be produced for the Italian Provinces (NUTS 3). Regional (NUTS 2), macro-regional (NUTS 1) and national estimates are, instead, computed and disseminated quarterly. LMAs are unplanned domains cutting across provinces (NUTS 3) which are the LFS finest planned domains whose direct estimates are released annually. Only about 450 LMAs out of 611 are covered by the LFS.
Given the repeated nature of the LFS, an EBLUP estimator based on unit level mixed model borrowing strength both from other areas and from other survey cycles has been considered to compute the estimates at LMA level [21]. The resulting estimator allows to increase the efficiency of the results by exploiting the previous survey occasions data and by enabling for a within area variation. The random effects of the model are introduced to take into account the spatial autocorrelation among LMAs as well as the temporal trend of the target variables. The spatial trend is introduced assuming that between area correlation matrix depends on the distances among the areas [22]. In particular, the distance among the areas based on the traveling time between the centroids [23] is used to specify the correlation among LMAs. For the temporal random effects, an auto-regressive AR(1) process is considered in order to take into account the high value of time correlation coefficient, whose estimate is around 0.75. The use of the time information allows for relevant efficiency gains of the estimates. The SAE estimates of unemployment and employment rate for each LMA coupled with their efficiency gains w.r.t. direct estimates are presented in Fig. 2.
LMA yearly SAE estimates are obtained by averaging the quarter’s count estimates. However, the aggregation over a planned larger domain (e.g. NUTS 2) may differ from the regional direct estimates. In order to make them consistent a benchmarking procedure is applied to SAE estimates yearly released by Istat.
5.Conclusions and further development
In Italy the concrete implementation at national level of the LMA concept has increased over the years. The LMA paradigm has recently proved its fruitfulness in targeting disadvantaged areas and will be used for monitoring territories hit by economic crisis. Further developments in the design of LMA tools and products are foreseen. The package LabourMarketAreas (version 3.0) will be improved and a new R package for the production of SAE estimates is planned. A complete set of indicators at this level of geography will be released on a regular basis.
The flexibility of open source tools allowing for integration of methods favours harmonisation of approaches at EU level. The shared adoption of the LMA geography would enhance comparability at sub-regional level besides allowing for the creation of relevant cross country LMAs. The creation of tools, the exchange of knowledge and the current development at EU level of guidelines for LMA design will contribute to foster better inclusion of the functional territorial dimension in official statistics.
Acknowledgments
The work was partially supported by Eurostat Grant agreement No 08141.2015.001-2015.501 on EU-TTWA method: improvements, documentation and sharing knowledge activities. The authors thank the anonymous referee for valuable comments and suggestions.
References
[1] | Barca F. An agenda for a reformed cohesion policy. A place-based approach to meeting European Union challenges and expectations. Brussels: EU Commission for Regional Policy; (2009) . |
[2] | Braddy M, Van Halderen G. Progress on a statistical spatial framework to inform regional statistics. SJIAOS (2015) ; 31: (1): 99–101. |
[3] | Radermacher W. Functional areas: an alternative view on the European statistical geography. In: Istat. La nuova geografia dei sistemi locali; (2015) ; 11–14. Available from: http://www.istat.it/it/archivio/172444. |
[4] | Smart M. Labour market areas: uses and definitions. Progress in Planning (1974) ; 2: : 239–353. |
[5] | Coombes MG, Green AE, Openshow S. An efficient algorithm to generate official statistics report areas: the case of the 1984 Travel-to-Work Areas in Britain. The Journal of Operational Research Society (1986) ; 37: (10): 943–953. |
[6] | Istat, IRPET. I Mercati Locali del Lavoro. Milano: Franco Angeli; (1989) . |
[7] | Casado-Diaz JM, Coombes M. The Delineation of 21st Century Local Labour Market Areas: A Critical Review and a Research Agenda. Boletin de la Asociacion de Geografos Espanoles (2011) ; 57: : 7–32. |
[8] | Semecurbe F, Timoteo J. Package ttwa: Travel To Work Area. Vienna; (2013) . Available from: https://CRAN.R-project.org/package=ttwa. |
[9] | Insee, Dares, Datar. Atlas des zones d’emploi 2010. Paris: Insee; (2010) . |
[10] | Martínez Bernabeu L, Flórez Revuelta F, Casado Díaz JM. Grouping Genetic Operators for the Delineation of Functional Areas Based on Spatial Interaction. Expert Systems with Applications (2012) ; 39: (8): 6754–6766. |
[11] | Kropp P, Schwengler B. Three-step method for delineating functional labour market regions. Regional Studies (2016) ; 50: (3): 429–445. |
[12] | Chakraborty A, Beamonte MA, Gelfand AE, Alonso MP, Gargallo P, Salvador M. Spatial interaction models with individual level data for explaining labor flows and developing local labor markets. Computational Statistics and Data Analysis (2013) ; 58: : 307–392. |
[13] | Coombes M, Casado-Díaz JM, Martínez-Bernabeu L, Carausu F. Study on comparable labour market areas: final research report. 17 October (2012) . Eurostat – Framework contract no 6001. 2008.001–2009.065, Specific contract no 50405. 2010.004–2011.325. |
[14] | Eurostat. Task Force on Harmonised Labour Market Areas: Final Report. Luxembourg: Eurostat; (2015) . Available from: http://ec.europa.eu/eurostat/cros/system/files/TaskForceonLMAFinalReport.pdf. |
[15] | Ichim D, Franconi L, D’Aló M, van den Heuvel G. Package LabourMarketAreas v. 3.0: Identification, Tuning, Visualisation and Analysis of Labour Market Areas; (2017) . Available from: https://CRAN.R-project.org/package=LabourMarketAreas. |
[16] | R Development Core Team. R: A Language and Environment for Statistical Computing. R Foundation for Statistical Computing. Vienna; (2016) . |
[17] | Coombes M, Bond S. Travel-to-Work Areas: the 2007 review. Office for National Statistics, London; (2008) . |
[18] | Franconi L, D’Aló M, Ichim D. Istat implementation of the algorithm to develop Labour Market Areas, Technical Report. Roma: Istat; (2016) . Available from: http://www.istat.it/en/files/2016/03/Description-of-the-LabourMarketAreas-algorithm.pdf. |
[19] | Istat. La nuova geografia dei sistemi locali. Roma: Istat; (2015) . Available from: http://www.istat.it/it/files/2015/10/La-nuova-geografia-dei-sistemi-locali.pdf. |
[20] | Soares E, Figueiredo R, Vale F. Defining Labour Market Areas and its relevance from a statistical perspective: the Portuguese case. SJIAOS (2017) ; (2017) ; 33: (3): 615–625. |
[21] | D’Aló M, Falorsi S, Solari F. Space-time unit level EBLUP for large data sets. Journal of Official Statistics (2017) ; 33: (1): 61–77. |
[22] | Saei A, Chambers R. Small Area Estimation under Linear and Generalized Linear Mixed Models with Time and Area Effects, Methodology Working Paper M03/15. Southampton: United Kingdom; (2003) . |
[23] | D’Aló M, Di Consiglio L, Falorsi S, Ranalli MG, Solari F. Use of spatial information in small area models for unemployment rate estimation at sub-provincial areas in Italy. Journal of the Indian Society of Agricultural Statistics (2012) ; 6: (1): 43–53. |


