
Ontology of active and passive environmental exposure
Abstract
Exposure is a central concept of the health and behavioural sciences needed to study the influence of the environment on the health and behaviour of people within a spatial context. While an increasing number of studies measure different forms of exposure, including the influence of air quality, noise, and crime, the influence of land cover on physical activity, or of the urban environment on food intake, we lack a common conceptual model of environmental exposure that captures its main structure across all this variety. Against the background of such a model, it becomes possible not only to systematically compare different methodological approaches but also to better link and align the content of the vast amount of scientific publications on this topic in a systematic way. For example, an important methodical distinction is between studies that model exposure as an exclusive outcome of some activity versus ones where the environment acts as a direct independent cause (active vs. passive exposure). Here, we propose an information ontology design pattern that can be used to define exposure and to model its variants. It is built around causal relations between concepts including persons, activities, concentrations, exposures, environments and health risks. We formally define environmental stressors and variants of exposure using Description Logic (DL), which allows automatic inference from the RDF-encoded content of a paper. Furthermore, concepts can be linked with data models and modelling methods used in a study. To test the pattern, we translated competency questions into SPARQL queries and ran them over RDF-encoded content. Results show how study characteristics can be classified and summarized in a manner that reflects important methodical differences.
1.Introduction
The Exposome NL project studies the Exposome, i.e., the combination of the exposure to factors in the built, physico-chemical, food, and social environments over a person’s life.11 Researchers across the Netherlands from several institutions are researching the effects of the exposome on the human body. There are many different disciplines that cover the exposome, including the built environment, early life, obesogenic environment, policy, geospatial modelling, and the microbiome, to name a few. Indeed, this project, along with other studies in the field of epidemiology, has an increasing amount of work measuring some form of exposure to the environment to study its effects on a person’s behaviour and health [10]. Yet the increasing amount and variety of approaches make it very time-consuming for researchers to find and compare results across articles relevant to some analytic goal. For example, a health-related study on walking behaviour might target the effects of outdoor air pollution while walking, or measure the effects of green space on walking behaviour, or the effects of such behaviour on physical health. Which goal precisely was pursued is hard to tell from a distance. While some authors have emphasized the opportunities of a corresponding “spatial turn” in the health sciences [48,49], others see the increasing need to synthesize such evidence and systematically structure underlying models with the help of information ontologies [42]. This may allow systematic comparisons of the effects of interventions on behaviour and health, and thus support evidence-based theory building [24].
Information ontologies provide a way to make the shared conceptualizations underlying a particular kind of information explicit [20]. Information ontologies can encode domain-specific knowledge and are then called domain ontologies. In this study, we will refer to the latter simply as ontologies. Since conceptualizations can differ greatly even between research on the same topic, understanding them is crucial for validating and comparing research results. Over the past couple of decades, ontologies have become increasingly useful across medical and epidemiological sciences [15,46]. To make conceptualizations explicit, ontologies make use of formal logic, which not only helps unambiguously define ideas (contributing to theory development) but also makes definitions machine-readable and thus helps automatically classify results (contributing to comparison and information retrieval). Together with methods for extracting and annotating content in published texts, this methodology can be used to link various resources underlying exposure studies. However, an ontology for breaking down and organizing different exposure concepts is currently lacking (cf. Section 2).
Systematically distinguishing and aligning exposure measurements involves two major challenges. For one, there is the matter of designing the ontology [14,43] to capture the central differences in the way exposure is modelled and used in scientific studies, such that we can answer corresponding questions [16,21]. One important kind of question is causal. It asks whether the health exposure studied is largely under the subjects’ control or not. The former we call active exposure and applies, for instance, to the exposure to unhealthy food, whereas the latter is called passive, for example, when being exposed to air pollution [59]. In the former case, buying or eating food is an activity that causes an exposure that can potentially be controlled by the involved person, while in the latter case, such control is not possible (furthermore, there are different types of passive exposure, which will be further explained in Section 4.1.3). This distinction22 is relevant because it determines which model components are required. For passive exposure, tracking of people’s (mobility) behaviour and environmental stressor concentrations need to be modelled in detail, while for active exposure, behavioural choices of humans move into focus [59]. The distinction also has ethical and intervention/policy implications, because it determines to what extent a health impact due to exposure can be attributed to a person’s responsibility. However, it remains unclear how this distinction can be precisely defined and operationalized. In addition, to capture the type of exposure and the tools and data sets used, we also need to identify the involved types of activities and subjects, their involved risk and the underlying environments or “environmental stressors” and how they were modelled. The second challenge relates to knowledge extraction, namely how data for such an ontology can be extracted, and how this can be scaled up across many article documents. Manually annotating articles with ontology concepts is a time-consuming process which does not scale. Luckily, recent developments in Natural Language Processing (NLP), such as the development of pre-trained deep neural networks for language parsing [11] have vastly increased the chances of automating the detection of exposure concepts within article texts [1].
Since this latter challenge requires first addressing the former, we concentrate in this paper on the first step of ontology design: Which concepts are needed to define exposure in epidemiological and health geography studies, such that relevant methodical differences like the types of exposure, environmental stressors and activities can be distinguished, including the underlying tools and data sources used for modelling it? We develop an ontology pattern to compare exposure methodologies across different domains of exposure in order to prove the ontology’s generality and to highlight methodological differences in research papers. Our ultimate purpose is to help scientists compare, align, and understand research results from studies on health-related exposures that look similar on the surface but are actually not similar when delving deeper into the methods.
In Section 2, we discuss related work and requirements for such an ontology. In Section 3, we explain our design method, and in Section 4, we introduce the conceptual model, its (Web Ontology Language) OWL axiomatization and our reuse of existing vocabularies. Finally, in Section 5, we test and evaluate our ontology pattern over sample articles for these requirements.
2.Ontologies of exposure and competency questions
In this section, we review related work on exposure-related ontologies and tools and formulate requirements for ontology design in terms of competency questions.
2.1.Approaches to modelling health-related exposure and the environment
Information ontologies can be used to structure information in epidemiology and related fields [15]. Facts can be organized in terms of a so-called knowledge graph [13], which can be used to query, link or embed knowledge in various AI systems, (e.g., for deep learning-based Natural Language Processing (NLP) and information retrieval [40]). However, conceptualizations, as well as terminology, can differ greatly not only between different fields but also within a single field, such as biomedicine [55]. Designing large general-purpose domain ontologies, as was often done in the past, has therefore turned out to be difficult [30]. More recently, researchers have therefore turned to model aspects of a knowledge domain in terms of small, reusable design patterns for particular purposes [28] (e.g., based on the types of questions they can answer [16]). Patterns can then be linked to form larger ontologies for specific purposes. Our ontology focuses on systematically comparing methodological approaches with the aim to better link and align the content of the vast amount of scientific publications on exposure epidemiology.
The concepts underlying environmental exposure may serve as a pattern to link domains such as epidemiology, environmental science, geography and behavioural sciences. Yet, researchers have modelled exposure from different angles in the past. In the following, we review ontologies and their limitations in the fields of biomedicine, healthy living, and epidemiology, as well as on particular exposure-related health factors, such as food, physical activities, as well as human behaviour. We also discuss related knowledge-based tools. Finally, we discuss the only existing ontology that specifically focuses on exposure.
The Ontology for Biomedical Investigations (OBI ontology) [3] is an example of a large general domain ontology. In a multidisciplinary field posing challenges to terminology agreement, OBI suffers from corresponding problems. External ontologies reused in OBI are often subject to change with independent release policies, which can impact the scalability of changes to OBI [3]. For our purpose, the ontology is too general to address the specific problem of modelling exposure.
Various ontologies focus on medical health services, such as the one by [4]. The authors explore the possibility of using ontology to counsel patients on adopting a healthier lifestyle. Since the ontology focuses on the cognitive requirements of human interactions, it is less suitable for exposure assessments. Another example is the medical ontology by [67], which was designed to aid in making rapid, crucial decisions in healthcare. This ontology does not capture exposure concepts. Similarly, the ontology by [8] concerns the treatment and diagnosis of diabetes but does not include exposure as a concept.
[46] noted that many epidemiology-related ontologies have described concepts of specific sub-disciplines such as the Disease ontology [50], Vaccine Ontology [66], and Symptom Ontology [51]. In these ontologies, important epidemiological concepts are not yet covered, such as exposure ratio and attack rate [46]. The authors, therefore, created a general domain ontology called The Epidemiology Ontology (EPO) which covers some of these gaps [46]. The ontology also models exposure, but not in terms of a general environmental concept. Rather, it regards exposure as a process of transmission of infectious or other disease agents among persons.33
The Environment Ontology (ENVO) represents biomes, environmental features, and materials pertinent to genomic and microbiome-related investigations [7]. While first described in 2013, it was expanded and enhanced in 2016 after there was steady growth and demand to adjust it to support increasingly diverse applications [7]. ENVO was also aligned with the Open Biological and Biomedical Ontologies (OBO). The fact that ENVO was later improved to bridge multiple domains illustrates how an exposure ontology could likewise be expanded and diversified depending on demand. ENVO itself could be used to classify environments for exposure measurements.
Several ontologies focus on modelling the food environment. FoodOn is an ontology that covers basic raw food source ingredients, and process terms for packaging, cooking, and preservation. It also includes an upper-level product type scheme under which food products can be categorized. This ontology helps describe and organise food in detail and has been successful in standardizing database content for food-related agencies and health organizations [12]. The NAct ontology by [62] focuses on connecting data about activities and nutrition. While many nutrition models already exist, NAct takes a holistic approach by combining and personalizing nutritional and physical activity recommendations to support healthy living. The authors adopt rules that connect each subject’s implicit and explicit nutritional and well-being goals with the situational condition of the subject, as well as with standardized European nutritional and well-being directives [62]. Both ontologies may be useful to model aspects of a food environment but they lack notions of exposure.
ORBM+ [47] is an ontology that models human behaviour. The authors study how social relationships and personal factors contribute to macro-level behaviours, such as physical exercise. They developed the ontology using a knowledge-driven approach, followed by a data-driven validation and refinement approach. The key idea is that a representation of a concept will be learned by its own properties, the properties of its related concepts, and the representations of its sub-concepts [47]. This ontology is linked to a human behaviour deep learning prediction model to make the behaviour prediction explainable. By incorporating human behaviour determinants – self-motivation, implicit and explicit social influences, and environmental events, the model predicts the future activity levels of users more accurately than conventional methods [47]. However, the ontology does not model health-related exposures.
[41] addresses the general conceptual challenges of exposure science with the ExO ontology. The authors note that while exposure-related terms are widely used in exposure science, definitions and descriptions are often inconsistent. The ontology is used to translate findings in various environmental disciplines, including epidemiology, for exposure and risk assessment and decision making and for improving public health [41]. The authors base their ontology on the gene ontology project, an ontology that describes the functions of gene products from all organisms [9]. ExO is structured hierarchically to allow the representation of data and concepts at varying levels of detail [41]. [41] suggest that the essence of exposure science is the study of the co-occurrence of an environmental stressor and a receptor or a target. However, as we will explain later, reducing exposure to cases induced by stressors is too narrow, since not in all cases, stressors or targets that receive the impact of an environmental stressor are available. Also, ExO lacks formal definitions of exposure and related concepts that can be used to automate the classification of different types of exposures, such as passive and active exposure.
Several knowledge-based tools are also of relevance in this context. For example, MOMO, described as a microbiology analytics and clinical tool for analyzing and reporting pathogens and antimicrobial resistances [33], was designed in response to aiding in the assessment and surveillance of infection in hospitals. MOMO’s QuickScan function provides an overview of the data of an individual patient, can accommodate different kinds of data items such as PCR and microscopy results, and is updated daily. MOMO presents an efficient and powerful way to support an increasing body of knowledge in health and medicine and patients [33]. This study shows how technology alternatives to ontologies could be used for the same functionality.
Another alternative tool to ontologies is methodologies like the one developed by [35]. The researchers in this study recognized that in-depth analysis and extraction of knowledge have become more challenging in the era of big data. The aim of KNARM (Knowledge Acquisition and Representation Methodology) is to handle big data in the form of large amounts of textual information and translate it into axioms by using description logic [35]. The authors demonstrated the methodology’s functionality by implementing the Drug Target Ontology (DTO). Results showed that the methodology is capable of building useful, comprehensive consistent ontologies, and helps with acquiring and representing knowledge in a systematic, semi-automated way [35]. This approach and the findings of this study are comparable to ours, so we assume that populating our ontology can be done in a similar way in the future.
While all ontologies and tools discussed above touch on some aspects of exposure, including the behavioural component, different kinds of environmental stressors, as well as more general medical terms or risks, it is still unclear how concepts fit into each other when determining and measuring exposure. Furthermore, it also seems that even existing exposure ontologies such as ExO are not general enough and thus fail to capture important variants of exposure (e.g., the difference between active and passive exposures or environments that are not environmental stressors but that beneficially affect people). The ontology that we propose in this paper exactly addresses this gap by taking the different components underlying exposure measurement into focus.
2.2.Competency questions about constituents and types of exposure measurement
As our discussion illustrates, ontologies relevant to exposure range from understanding human behaviour and classifying physical activities and chemical substances to the kinds of nutrition and their effect on people’s health. At first look, these cases are hard to align with each other in one model. Secondly, there are significant differences between exposure measurements in terms of methods and data. Given this variety, the question is what an overarching model of exposure could look like, which can be reused across all these cases to answer fundamental questions about methodology.
To capture such requirements, we formulate competency questions [21]. Competency questions should include those types of questions that an ontological model of exposure should be able to answer across all applications. We focus on understanding the conceptual model used in an article, and how it serves to link the used methods and data sources. Below, the rationale for each question is explained.
Question 1.
What kinds of exposure are modelled in this article?
The variety of health-related exposures needs to be distinguished systematically and automatically. Identifying which type of exposure (e.g. passive or active) is used in a paper helps the reader determine if the article is of relevance. It also determines which environmental and individual aspects are relevant for modelling.
Question 2.
Which activities are involved in the exposure and who is exposed?
Activities cause exposure to the people involved in them. At the same time, different kinds of activities mediate exposure. For instance, walking to school may cause higher exposure to air pollution than driving to school for the same route. Children who need to walk 2 km to school will have a higher exposure to physical activity than children who only need to walk 800 meters to school. Additionally, the health conditions of people involved in an activity can also influence how they react to exposure. For instance, children may be more susceptible to
Question 3.
What are subjects exposed to?
Whenever we are exposed to an environment, we are exposed to some of its aspects in more direct or indirect ways. Accordingly, the exposure can be quantified in different ways, which determines the specific kind of exposure. Note, that what a person is exposed to is not necessarily that person’s environment. For example, a person’s exposure to unhealthy food is not directly caused by the environment but is rather a consequence of an eating activity that is influenced by some (eating or buying) decisions that take place in the environment.
Question 4.
What is the health risk of exposure?
This question identifies the potential health risk(s) an exposure may have for a person. For instance, the risk of children who live near busy roads developing asthma. Note that exposure can either decrease or increase risk and thus may have positive or negative associations.
Question 5.
Which environments influence the exposure and from which data sets were environmental measures derived?
Depending on whether the exposure promotes risk or not, the effect of the environment on health can be positive or negative. For instance, an environment with negative influence could be high-temperature fields, which are themselves caused by impervious surfaces, in what is called the heat island effect in a city [60]. An example of a positive environment would be a park in a city increasing a citizen’s recreational activity, which in turn reduces the risk of obesity. Environmental measures are often derived (e.g., mean temperatures or object densities in a neighbourhood around the home). This means the analytic methods involve a workflow that derives spatial and temporal measures from other environmental measurements. Therefore, if available, we are also interested in the workflows used for measuring these environments, including the data sources.
Question 6.
What are the environmental stressors?
An environmental stressor is an environment that negatively influences the health risk of a person via her exposure. For example, high temperatures and impervious surfaces can be environmental stressors for elderly people in a city.
3.Methodology
In this section, we explain our approach to developing and evaluating the ontology pattern. Figure 1 shows an overview of the development process, where numbers in brackets point to corresponding sections of this article.
3.1.Overview
Our design is roughly based on the steps in [14] with a particular focus on pattern development based on competency questions [16,21,43]. As an empirical basis for developing and evaluating the pattern, we selected six articles (knowledge acquisition) that covered diverse kinds of exposure and risk (Fig. 1) (see next subsection).
Ontology design methods [14] usually start with requirements and purposes. Following the idea of pattern development [16], these requirements were captured by competency questions [21] (Fig. 1, empirical basis). Focusing ontology design patterns around questions helps address basic design principles, such as clarity (questions can be understood without technicalities), extendibility (integration with other patterns), and minimizing ontological commitments (only those concepts needed for answering questions are formalized) [20].
We formalized the pattern in OWL 2.44 Based on the questions, we designed a preliminary pattern (Fig. 1, TBox)) [43] including classes and relations (OWL object properties) that capture the distinctions needed for answering the questions. The pattern describes the exposure theory (TBox). As far as possible, we thereby inherited classes from existing ontologies. The ontology design was done iteratively in several rounds revising the ontology based on the content of the articles (see dotted feedback arrows in Fig. 1).
Fig. 1.
Steps in building and evaluating the ontology pattern. Numbers refer to corresponding sections in this article. Ellipses denote processes, rectangles denote artefacts.
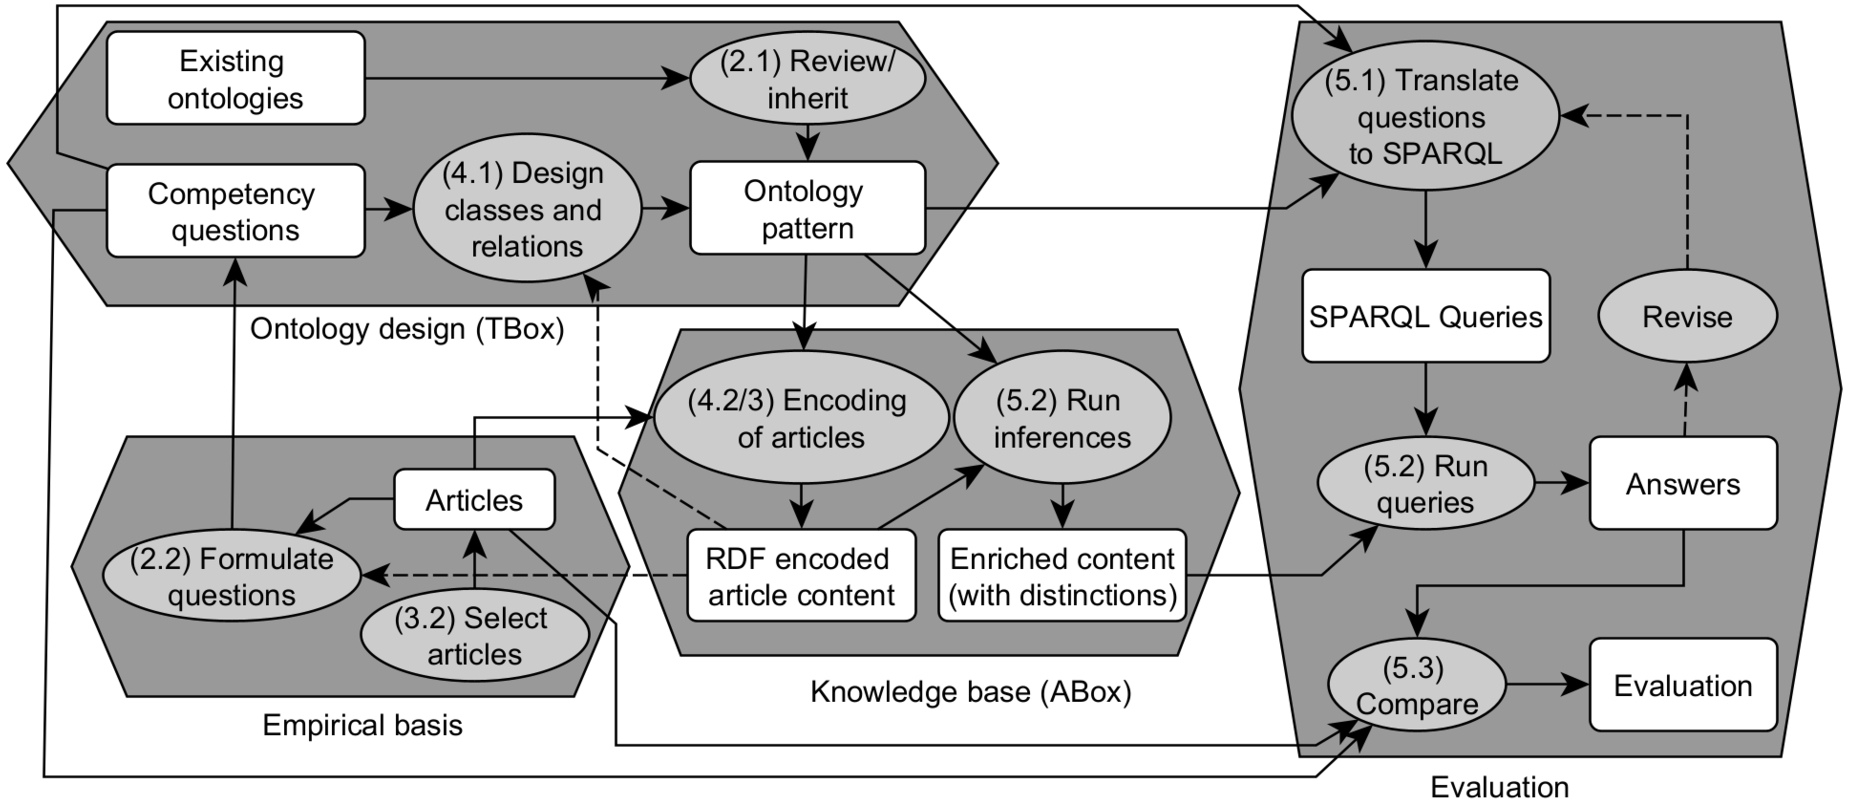
To test the pattern, we populated a knowledge base by adding facts extracted from the articles, see Fig. 1, ABox. We encoded the article content by filling the slots of the pattern with text snippets and examples manually extracted from exposure articles. If needed, the ontology was extended with new concepts. We fully encoded the content of each article into RDF,55 using classes and relations from the pattern. Using a mature version of the ontology, we then automatically enriched (Fig. 1) the RDF-encoded article contents by running OWL-RL66 and RDFS77 inference over the data. This step adds automatic class instantiations to the article content based on the formal definitions specified in the ontology pattern, and in this way allows us to classify article content based on logical reasoning (e.g., the fact that a certain exposure is of a certain type).
To evaluate the pattern, we (Fig. 1) translated the competency questions into SPARQL88 queries and finally ran all queries over the enriched article contents to analyse the content and to automatically classify and compare the articles against each other. We also compared the results against our expectations from reading the articles. This tests two things: first, whether the pattern is general enough to cover the diversity of exposure methods and specific enough to distinguish important methodical differences. And second, to what extent the pattern can be used for retrieval of methodological content. We discuss the results in Section 5.
3.2.Selection of articles
Articles were selected from literature databases99 such that they should cover varying epidemiological risk factors and exposure types. We selected six articles on exposure to fast food outlets, neighbourhood social norms, air pollution (household and outdoors), crime, violence, urban green space, natural and built environment, and travel mode (see Table 1).
Exposure to fast food outlets includes places that sell unhealthy food [63]. Neighbourhood social norms are the perceived social norms that a person has in terms of what behaviours are acceptable with others in the neighbourhood (in this case, it specifically relates to how much fast food consumption is normally accepted in a person’s neighbourhood) [63]. Both household and outdoor air pollution refer to the exposure of air pollution chemicals in a person’s surroundings [39,64]. Exposure to crime and violence refers to the exposure to such activities occurring in a person’s immediate surroundings [19]. Urban green space refers to parks, gardens, trees, or other plants that a person may encounter in their immediate surroundings [27]. Travel mode in this case refers to whether a person travels by foot, bike, or motorized transport [26].
We chose these papers for two intentions. One is that they serve as empirical examples for exposure modelling in order to develop the ontology. The other reason is that they serve as a way to empirically evaluate the ontology by running queries over the statements in the papers and evaluating the answers. Papers should be as diverse as possible to make sure our ontology pattern can cover different types of health exposures. Furthermore, the chosen subject areas make our ontology compatible with the goals of the Exposome NL project. Because of the wide variety of topics that cover the exposome, the papers were also picked with the intention to represent this assortment of topics. The chosen papers represent scenarios studied by researchers associated with Exposome NL.1010 [26] and [27] cover the topics of the obesogenic and built environments. [64] and [39] cover air pollution and lung or cardiovascular diseases. [63] explores the topics obesogenic and social enviornments, and [19] covers the social environment.
We made sure the papers that cover the same risk factor have different underlying exposure concepts, to show that even though a study may look similar at first glance, fundamental parts of it are structured differently, showing that it can be useful to use an ontology to more quickly discover these differences. We also made sure to cover a diversity of both active and passive exposure examples, including passive exposure examples of perceptual and physical nature. A short description of each article can be found in the Appendix.
Table 1
The content of six articles was used for the development and evaluation of the ontology
| Title of article | Main authors | Year published | Health exposure | Health risk |
| The Associations of Area-Level Violent Crime Rates and Self-Reported Violent Crime Exposure with Adolescent Behavioral Health | Grinshteyn et al. [19] | 2018 | crime, violence | Adolescents, Behavioral Health, Mental health |
| Constituents of household air pollution and risk of lung cancer among never-smoking women in Xuanwei and Fuyuan, China | Vermeulen et al. [64] | 2019 | (household) air pollution | lung cancer |
| Long-term exposure to air pollution and cardiorespiratory disease in the California teachers study cohort | Lipsett et al. [39] | 2011 | air pollution | cardiorespiratory diseases |
| Neighbourhood fast food exposure and consumption: The mediating role of neighbourhood social norms | Rongen et al. [63] | 2020 | fast food outlets, neighbourhood social norms | fast food consumption |
| The relationship between access and quality of urban green space with population physical activity | Hillsdon et al. [27] | 2006 | urban green space | physical activity levels |
| Natural and built environmental exposures on children’s active school travel: A Dutch global positioning system-based cross-sectional study | Helbich et al. [26] | 2016 | natural and built environment, travel mode | activity level of children |
4.Ontology design
This section describes our ontology design, motivating concepts, and the types of relations used to build it with the aid of description logic axioms.1111 Description Logic (DL) is implemented in the W3C standards OWL and RDF. Many fragments of this logic are decidable and thus allow not only defining classes and relations between classes, but also the automatic inference of class subsumption (whether classes are subclasses of each other), and class instantiations (whether e.g., data samples can be classified accordingly). The ontology pattern was tested for consistency/coherency using the HermiT reasoner.1212
Ontologies are often divided into upper/top-level and domain ontologies, as well as lightweight and heavyweight ones. Lightweight ontologies are mere taxonomies [18]. Upper ontologies axiomatize general categories that can be reused across many knowledge domains [29]. An example of an upper-level ontology is the Descriptive Ontology for Linguistic and Cognitive Engineering (DOLCE) ontology [5]. DOLCE embraces a pluralist, cognitive perspective rather than targeting a unique universal ontology for knowledge representation [5,6].
Ontologies may also be built off one another, similar to design patterns in software engineering [16]. Our ontology pattern can be used across the domains concerned with health-related exposure such as air pollution, food consumption and dieting, neighbourhood activities (crime, social activities), physical activity, built environment (grey, blue, green space), noise, radiation, sleep, social economic status, and much more. It goes beyond a mere taxonomy because it defines exposure-related classes based on causal structures. We aligned our classes with the top-level ontology DOLCE+DnS Ultralite ontology (DUL),1313 as it includes basic ontological distinctions relevant for modelling environmental agency (discussed below). We also reused a recently published ontology on quantities (AMMO1414 and GeoAMMO1515) [61] to describe quantifiable measures of exposure. Finally, we linked occurrences of these concepts to the articles in which they appear, as well as to corresponding data sources, by reusing standard vocabularies (DCAT1616 and PROV1717). Our pattern exposureBasis (exp) is available online1818 as well as on github together with all resources.1919
4.1.Basic model of active and passive exposure
We start with an informal motivation of the main concepts before introducing formal definitions. We first discuss the role of causal relations in exposure measurement, before we introduce concepts for the phenomena involved, and how they are related to each other. Afterwards, we introduce exposure types that can be defined as classes.
4.1.1.Causal relations and measure-able phenomena
From an analytical perspective, exposure is an important cause for health risks or health benefits. For example, exposure to an environment can cause a particular behaviour (e.g., when we are triggered by a nearby park to go running), which can be an indirect cause of exercising more and spending more time outdoors. Furthermore, it can also be a direct cause of health risks (e.g., when a person runs near a busy road). Finally, the environment can be modified by behaviour (e.g., when we decide to take a car instead of walking). Thus in environmental exposure, the environment can occur both as cause and effect in various causal chains [59].
In general, causal relations link measurable phenomena in a way that goes beyond spurious correlations. From causal theory [44,45], we know that measurable phenomena might not correlate even though there is a causal link between them, and vice versa. This is especially relevant for the environmental and health sciences [31]. For example, whether the environment causes health risks might be hidden by confounding effects (causal forks), such as residential self-selection [25]. The distinction between causal relations and non-causal relations cannot be made without background assumptions [44]. Making such assumptions explicit results in a causal diagram, where causal relations appear as directed arrows between measurable variables. In essence, such a diagram is a conceptual model [22] which can be formalised in an ontology. For this reason, we use a generalized causal relation as a basic primitive DL role for connecting exposure phenomena.
Which measurable exposure phenomena should be linked by cause-effect relations? DOLCE and other top-level ontologies distinguish events (phenomena measured in time) from objects (phenomena measured in space), and causal relations typically exist only between consecutive events [5]. Other types of relations, e.g., participation, are used to link events and the objects participating in them [56]. Furthermore, from a philosophical as well as a practical viewpoint, it can be important to distinguish causality, which is a general vehicle for explanation in the sciences, from actions and intentionality, which focuses on purposes needed for understanding people’s motives when deciding about their actions.2020 However, the practice of causal analysis seems to be rather tolerant allowing causal links also for human behavioural decisions (e.g., an object like a park can cause an event like a run). We think this practice has also important theoretical implications because it highlights the role of particular causal chains for the conceptualization of exposure. To still account for ontological nuance, more specific ontological relations could be used to differentiate between types of causality, or to separate ontological relations expressing participation or intentionality from causality. For example, we might specify that the person who decides to walk not only is a cause of the walking event but is also participating in this event and has the intention to walk. In the following, we reuse a participation relation in addition to a causal relation in order to express this, but we use a simplistic notion of causality that generalizes also over human intentions. In this way, we are able to distinguish intentional (caused) activities from unintentional participation. We leave more sophisticated types of specifications of effect relations open to sub-patterns of the ontology. For example, there is a causal relation between both food intake and health risk, and noise and health risk. However, they are based on very different physical processes that might be specified further in sub-ontologies.
4.1.2.Person, exposure, activity, environment, risk and dose
A person is a human being who participates or initiates an activity that will cause an exposure impacting their health. The person is the main study subject of the observation being made about how exposure is impacting their health.
What exactly is exposure? In the following, we base our explanations on the notions of measurement control as introduced by [54], on a related amount theory [61], as well as on standard definitions in epidemiology. Without being too specific, we can say that exposure is a measurement of some amount that is controlled by (and accumulates) over time. In many cases, exposure refers to the amount of a particular environmental phenomenon that reaches a person, expressed in terms of physical state, concentration, duration, and frequency.2121 If you are exposed to some phenomenon for some time, and then again for another time, the total amount of exposure will increase by the amount of exposure in this additional time interval. Exposure therefore can be defined as a temporally extensive (accumulative) amount, i.e. an amount controlled by and adding up over an amount of time [61]. This amount of time is, in turn, controlled by some activity of the person who is exposed (see Fig. 2).2222 For example, the amount of exposure to
Fig. 2.
Principle of exposure measurement: geo-referenced environments (e.g. fields or objects) are summarized over the time and space of some activity in which the exposed person is involved. Exposure is a temporally extensive (accumulated) sum.
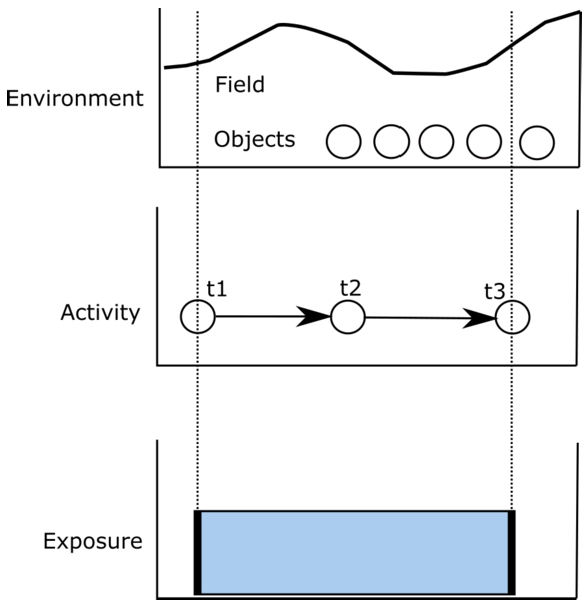
An activity happens in time and involves a person. We hold that exposure is always measured relative to some activity (e.g., it is always based on the duration of the activity and can be measured relative to the location of the person involved in the activity). Yet, how the activity influences exposure is different for different types of exposure: in the case of food intake, the amount and the quality of food are important. In the case of noise, the duration and the location of the person involved are relevant. As in the example above, activities are caused by persons. This could be anything from simply living in a certain place, to biking, or to buying food. Activities can be stationary or involve movement. If persons have control over an activity they can choose to perform it (for example, you choose to smoke or not). Sometimes there are many alternatives to choose from (for example, for your commute to work, you can choose to bike, take public transport, or walk). However, sometimes people do not have control over performing an activity. In fact, the environment constrains people’s activity options, sometimes up to the degree that there is no choice and the activity becomes involuntary. In that case, the person does not cause the activity but the environment or biological need causes it (e.g., a person falling asleep because of exhaustion, or a person shivering because it is cold outside). In the following, we assume activities are not necessarily voluntary (i.e., caused by persons), even though they always involve some person.
An environment consists of characteristics within a neighbourhood of the location of a person. This could involve tangible phenomena of the landscape or of our home (road intersections, coal mines, fast food outlets, food in your fridge) or intangible ones (
Dose is an amount of something accumulated in the person’s body due to exposure. For example, it can be the amount of a passive environmental stressor (e.g.,
Health Risk is a person’s probability of participating in an event that negatively influences the person’s health status within a specified period of time.2525 For instance, a health risk could be a heart attack, disruptive behaviour, or obesity. The degree to which a health risk influences one’s health or mortality varies. However, note that exposure might also decrease health risk. Health risks are often mediated by doses.
4.1.3.Active and passive exposure in a nutshell
While the same basic components, as outlined above, seem to constitute the parts of any exposure assessment, their causal configuration differs from one case to another. The argument we want to make in this article is that this causal structure precisely distinguishes the different cases of exposure from a methodological viewpoint. For example, for modelling the activity of food intake we have to consider the environment (e.g., fast food outlets), some activity (e.g., buying, eating), and the characteristics of a person involved (e.g., age), as well as the health risk involved (e.g., the risk for obesity). The activity of food intake can be caused by exposures to the environment as well as lead to exposures to food leading to a certain risk such as obesity. To model the exposure to noise, we likewise have to take into account an environment (noise level and noise sources), some activity (commuting to work) in which some person (school child) is involved, as well as some health risk (e.g., mental health). Yet, in the latter case, components are arranged in different order. Thus, to model the various cases of exposure, our pattern needs to allow the modelling of the configuration of the causal relations between these components.
Which causal patterns should be distinguished? In noise exposure, the exposure is caused by a particular environment. So there is a direct causal influence of the intensity of noise in the environment on the amount of exposure to noise, which then influences the amount of health risk. So we have a chain:
Fig. 3.
Possible models of active and passive exposure.
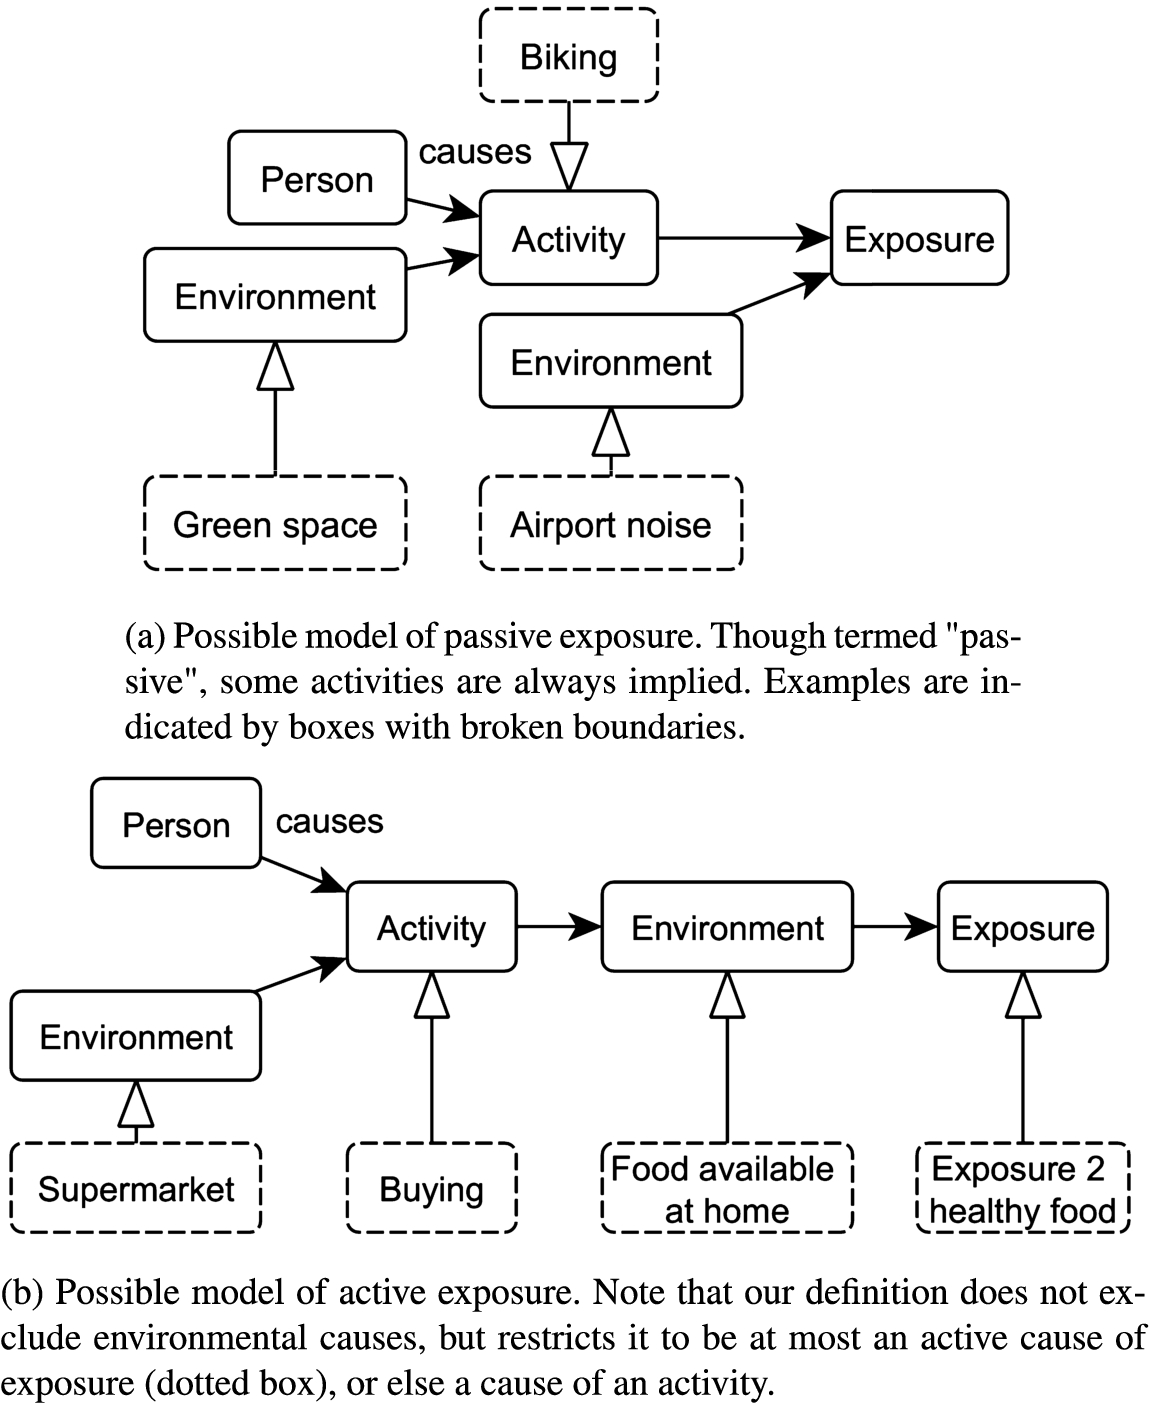
We call the causal configuration in Fig. 3b active exposure, where the exposure is controlled by a person, even if that person’s activity might be influenced by the environment. Note that this distinction has important implications for (1) the modelling of exposure (which components need to be modelled, in which order), but also in terms of (2) ethics: while fast food restaurants can be avoided, no one can avoid noise around an airport when driving by. The causal configuration in Fig. 3a is called passive exposure. Though an activity is always involved, there is also a component that is entirely independent of a person’s activity (and thus beyond that person’s control). Depending on how this component affects a person’s body, exposure can be further distinguished into physiological exposure, and perceptual exposure. Physiological exposures include exposures that physically enter or affect the body (e.g., air pollution, sunlight). Perceptual exposures are exposures that involve perception (e.g., the perception of crimes and its effect on the feeling of safety).
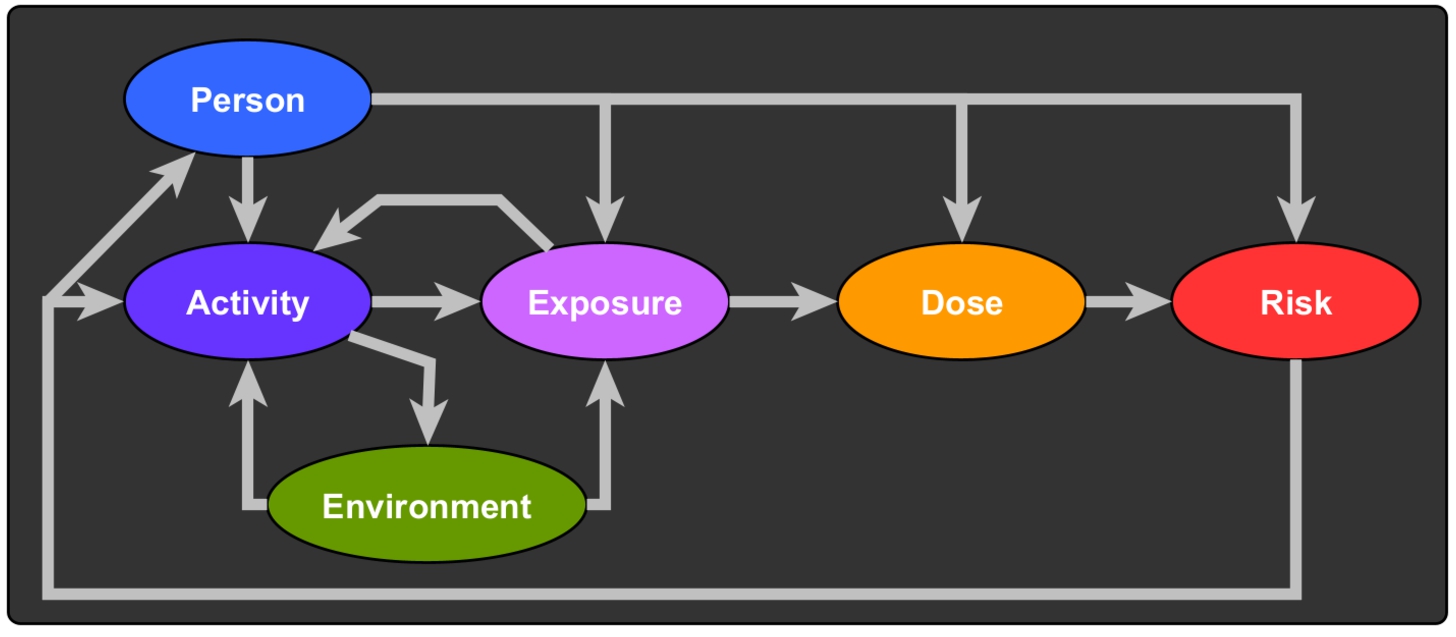
An overview of the most important concepts (base classes) and their possible causal relations is given in Fig. 4. We believe that all base classes are relevant at least as background assumptions in a specific model, even if such assumptions may not explicitly be modelled with data. In the following, we will make these differences formally explicit in terms of our basic exposure ontology pattern.
Fig. 4.
Base classes of the ontology. Arrows show possible causal relations, ellipses are classes denoting concepts.
4.1.4.DL-axiomatization of exposure concepts
We first introduce base classes for the different open slots in our causal model of exposure (standing for the ellipses of Fig. 4), including exposure, environment, activity, person, dose and health risk. While it would be beneficial for an exposure ontology to also model the variety of environments, this is out of scope in this article. This could be added in a sub-ontology by inheriting from the environment class (see Section 6). The six classes mentioned above are all mutually exclusive, meaning that something cannot be of more than one of these classes at the same time (e.g., not a person and an activity):
Axiom 1.
Base classes are mutually disjoint
Note that the phenomena that fall under these classes have measurable qualities that are not identical to the phenomena themselves. We distinguish different kinds of phenomena and their qualities using DOLCE+DnS Ultralite (DUL). Objects are phenomena whose qualities are controlled by time moments (dul:Object). For example, persons (dul:Person) as well as environments can change their qualities in time. We model environments as a dul:PhysicalPlace, i.e., phenomena where persons can be located. Activities are a form of an (dul:Event), i.e., entities whose qualities are not controlled by time moments, but which have some fixed temporal extent. More specifically, activities are a subclass of dul:Action, in which persons can participate and which they can cause. The following axioms specify causal relations (arrows) between the measured qualities of exposure concepts:
Axiom 2.
Causal roles
We consider a single causal relation causes which is the inverse of causedBy, denoting whether some quality of some phenomenon is causally influenced by some quality of another phenomenon. For example, both the environmental concentration of
Axiom 3.
Non causal roles
We also consider some non-causal relations. of relates an exposure to the person exposed, and has denotes the inverse relation. We use standard ontological notions (inherited from DUL) for saying that a person participatesIn some activity, and that, vice versa, the latter involves some person. Note that a person’s participation in an activity does not imply that the person is also causing (i.e., intending) it, though this fact can be expressed simply by using both roles participatesIn and causes to describe the relation between a person and an activity.
The classes exposure and dose correspond to a particular kind of amount (AMMO:Amount), namely an amount accumulated over (and thus controlled by) some time interval (GeoAMMO:AccumulationAmount).2626 More specifically, an exposure corresponds to a person’s accumulated amount of exposure to something over some time interval during an activity in which the person is involved. The time interval can be the extent of the activity or any part of it. For example, residents are exposed to local air quality at any time during which they reside in the same place. In this case, the air quality at the place is measured by concentration, the persons are residents and the activity is living somewhere. A dose is an amount of substance left in a person’s body as a consequence of its exposure. For example, this could be the amount of
We formalize the causal structure of these concepts by requiring that exposures always depend on particular persons via some activity in which they are involved during the exposure.2727 For example, a person’s exposure to
Axiom 4.
Exposures, persons and the activities in which they are involved
Furthermore, activities always involve some person, and if persons (intentionally) cause an activity, then they also participate in it. Finally, if a person is exposed to something, then this person also participates in the activity that causes this exposure.2828 Note that though every exposure belongs to only a single person, still several persons might be involved, intentionally or not, in a given exposure activity. For example, though a family collectively might burn coal in a household, every member of the family has their own exposure to the emissions as a consequence of their participation in this activity.
Next, we specify the effects of exposure on this person in terms of its dose and health risk. We call an exposure or dose health-relevant if it causes some health risk for this person. For example, exposure to fast food may increase the health risk of obesity. Note some exposures are not health-relevant because no health risk is involved. For example, a traffic sign may have caused me to stop at a road intersection. Furthermore, we call the activities causing these exposures also health-relevant. We define this in terms of DL role restrictions.
Definition 1.
Health impacts
If we know such exposures (or doses) promote health risk rather than hinder it, meaning there is a promoting chain of causes from activity to health risk, then we speak of a health risk promoting exposure (dose).
The term environmental stressor has been defined in various ways by different researchers. Most of these definitions involve both an environment and some (negative) response for the exposed person. For example, [32] describes an environmental stressor as “any intrinsic or extrinsic factor that challenges individuals and obliges them to adjust behaviour”. [17] defines environmental stress as “the emotional, cognitive and behavioural responses to an environmental stimulus (or environmental stressor)”. Thus “whether stress occurs is dependent on individual and contextual factors.” [23] shows how environmental stressors can be further categorized according to the degree of actionability (directly or indirectly), its predictability, and how salient or identifiable it is.
We define environmental stressors simply based on the causal relation between environments and health risks of the person exposed. Environmental stressors are environments which promote some exposure that promotes some health risk. Note that environmental stressors therefore are not necessarily part of an exposure: For example, in the case of exposure to fast food, there is no environmental stressor involved, because the environment does not directly cause the risky exposure. Furthermore, there are also environments that cause exposures which hinder health risk and thus promote health, e.g., exposure to green space. Finally, note that our definition leaves room for all the environmental stressor-related concepts cited above, including controllability, cognitive, and physiological responses. These can be accounted for by distinguishing corresponding relations between actions and the kinds of exposure involved (see the distinctions defined below).
Definition 2.
Environmental stressors
Finally, we can define the difference between active and passive exposures based on distinguishing their causes in terms of involved activities, and thus in terms of personal responsibility. We first introduce a class Active, which is defined as something that is either itself an activity or caused by some activity:
Definition 3.
Active
Note that this class includes, besides activities, also environments whenever the latter are caused by some activity. For example, when we burn coal in an oven without a vent, we cause air pollution in our homes. Note that this definition serves only as a way to generalize over both options. Now, we call an exposure active if has only active causes, i.e., it is either directly caused by an activity or by something that is itself caused by one. We call an exposure passive if it is directly caused by some environment:
Definition 4.
Active and passive exposures
This definition builds on the following logical reasons: If the exposure is caused only by some activity (Def. 4), and thus, indirectly, by the causes of that activity (e.g., a person’s decision to act) (by Axiom 4), then we know there is no independent influence of the environment on the exposure, and thus the responsibility of exposure lies entirely within the hands of the person who controls this activity. Our DL definitions above partially distinguish between these different models as illustrated in Fig. 3.
However, to implement this idea of active exposures in our model, we need to ensure that the exposure is not caused by something that is not active. This requires knowing whether something is not the case (logical negation ¬), which requires the logical closure of our knowledge base (cf. [52]). Since DL has an open-world assumption (what we do not know is not automatically false), this reasoning goes beyond standard DL reasoning. To account for this, we locally closed our world of causes to be able to make this inference within DL:
Inference rule 1.
Local closure of causedBy Activity. If something is caused only by activities in the graph g, then we add an all-constraint:
def locallyCloseWorld(g, property=exp:causedBy, all = exp:Active):
    for s in g.subjects(property, None):
        allconstraint = False
        objects = g.objects(s, property)
        for o in objects:
            if (o, rdf.type,all) in g:
                allconstraint = True
            else:
                allconstraint = False
                break
        if allconstraint:
            g.add(s, rdf.type, \forall property.all)
Note that our two definitions for passive and active exposure are not mutually exclusive, namely, in case the environment is caused by some activity (e.g. burning coal). To make them mutually exclusive, we would need to request that passive exposure causes are never active, which requires another local closure of a similar kind. In this paper, we decided to leave this stricter definition out, because the more loose definition also illustrates that sometimes exposure can be considered both active and passive. In addition, we added subclasses for perceptual and physiological exposure which capture differences in the way exposure is caused. The exposure class can be seen as a reified n-ary relation between the causes constituting the exposure. Thus, these exposure subclasses also capture specific ways in which an environment and a person are related, e.g., via perception or via physiological contact. Note that we do not restrict this to passive exposures, since in principle, active exposures could be caused by perceptual or physiological causes which are themselves controlled by activities (such as burning coal). These exposure subclasses are likewise not mutually exclusive:
Axiom 5.
Kinds of exposures
An overview of the entire class hierarchy focused around the base concepts can be seen in Fig. 5.
Fig. 5.
Overview of class hierarchy of the Exposure Basis pattern including defined classes. The class Active is left out as it is used only for axiomatization purposes.
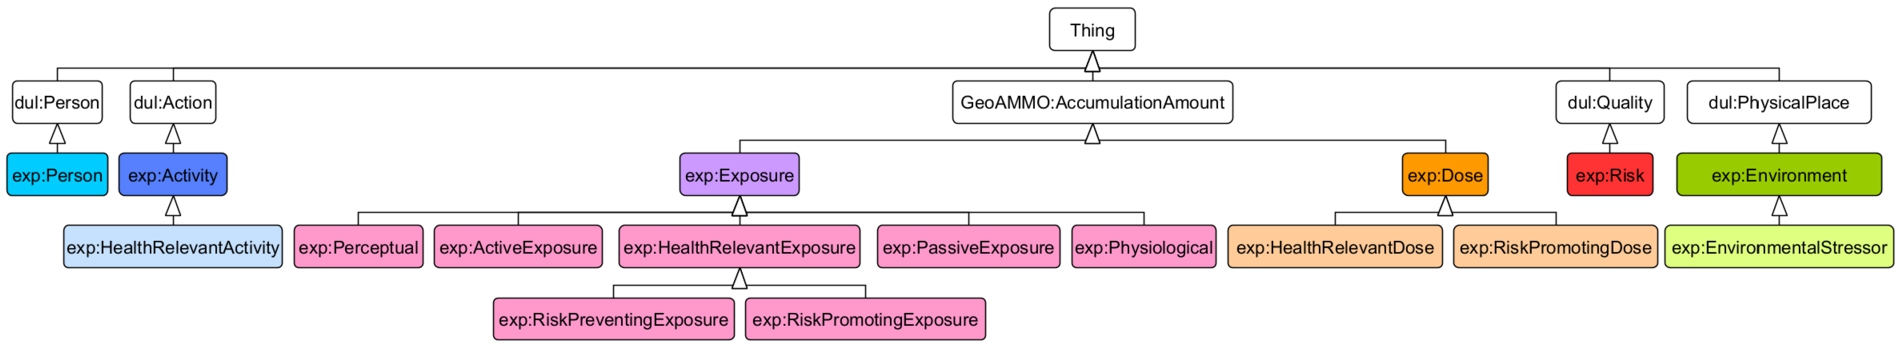
Fig. 6.
Class diagram illustrating the encoding of article content. Occurrences of exposure concepts (exp:[Class]) can be causally linked to each other and can be either a dcat:Dataset (in case they are represented by a dataset), or otherwise just a blank node. Datasets may have been derived from other datasets (encoded using PROV relations). Datasets can have distributions and derivations can have tools (encoded as prov:Agent).
![Class diagram illustrating the encoding of article content. Occurrences of exposure concepts (exp:[Class]) can be causally linked to each other and can be either a dcat:Dataset (in case they are represented by a dataset), or otherwise just a blank node. Datasets may have been derived from other datasets (encoded using PROV relations). Datasets can have distributions and derivations can have tools (encoded as prov:Agent).](https://content.iospress.com:443/media/sw/2024/15-5/sw-15-5-sw243546/sw-15-sw243546-g006.jpg)
4.2.Modelling data generation
The previous section introduced an ontology that can be used to reason over the different concepts that are needed to understand how exposure is modelled in an article. An important aspect of this question concerns how concepts are represented in terms of data.
In general, concepts may either stay implicit in the actual analysis or else may explicitly be represented by data. Certain factors involved in the exposure process are often part of the background assumptions without any explicit modelling. For example, many studies neither model the persons involved in exposure explicitly nor the actual exposure event, while others leave the environments implicit. Yet, still, these concepts are important to understand the author’s intentions and methodological approach. To investigate the extent of explicit/implicit modelling within an article, we indicate whether a concept has a data representation or not and if yes, from which data sources they might have been derived if this is known.
For this purpose, we use the Data Catalog Vocabulary (DCAT)2929 – Version 2, which is used to describe datasets and their distributions (via different URLs). To keep things simple, we label something as both an instance of a concept and of a data set (dcat:Dataset), meaning that the respective data set is instantiating the concept. For example, there might be a data set of temperature measurements which is at the same time an environment. Using the property dcat:distribution, we link the dataset to a particular distribution source (e.g., some URI from a public data catalogue).
Second, since data sources are often not used directly but need to be transformed to capture information about the intended concepts, we model such transformations by linking dataset nodes using the provenance ontology (PROV),3030 using the property prov:wasDerivedFrom (in case the derivation method is unknown), or else by triples of the following pattern (Fig. 6):
 _:dataOutput prov:wasGeneratedBy _:a1 .
 _:a1 prov:wasAssociatedWith <https://cran.r-project.org/web/packages/kdensity/>.
 _:a1 prov:used _:dataInput.
where _:a1 denotes the application of some R tool to derive _:dataOutput from _:dataInput.
4.3.Encoding of example articles
To test the ontology, the content of all six articles was encoded in RDF. For this purpose, we first identified all article content/text snippets that denote instances of some class in our ontology. In this study, we did this thoroughly by reading the articles and manually identifying the text phrases that corresponded to classes in exp or the dataset/provenance ontologies. We then generated a blank node for each detected text phrase that stands for an instance of a class (e.g., exp:Environment) and saved the corresponding phrases into RDFS comments describing this blank node (Fig. 6):
 _:proportionofcyclingpathlengths a exp:Environmental, dcat:Dataset;
 rdfs:comment "proportion of cycling path lengths".
 _:proportionofcyclingpathlengths prov:wasDerivedFrom _:cyclingstreets.
Text occurrences and data artefacts should in principle be distinguished from the concepts they represent (e.g. environments). Note that in our encoding, these can coincide. The reason is that for our purpose, it was not required to compare different datasets or text snippets representing the same concept. For this reason, we used a simplified encoding that does not force us to separate these items. If needed, this distinction can be drawn using existing ontology design patterns,3131 which distinguish information artefacts from what they represent.
In the future, this work may be automatized using a larger annotated corpus of articles and state-of-the-art deep learning-based NLP methods, similar to [58]. A particular challenge is that the concepts that play a role in the exposure assessment are sometimes left implicit by the authors. Furthermore, we added causal and other links between extracted instances whenever the authors either gave support for such a link (e.g., if they found a correlation) or when they mentioned or assumed such links in their overall approach. Both practices require implicit knowledge and therefore currently still pose a challenge for state-of-the-art NLP methods [58]. Since our article focuses on the modelling aspect, we did not use state-of-the-art text annotation techniques for finding text snippets [2].
5.Evaluation: Comparing conceptualizations and methods for measuring exposure
To evaluate the pattern, we tested to what extent the competency questions can be answered automatically in a way that corresponds to our understanding of each article’s method.
5.1.Translating competency questions into SPARQL queries
SPARQL,3232 the query language for RDF, is used here to automatically retrieve answers for competency questions. In the following, we go through each question and discuss its translation to SPARQL:
Query 1.
‘What kind of exposures are modelled in this paper?’
SELECT DISTINCT ?c ?y
WHERE {
    ?x a exp:Exposure.
    ?x rdfs:comment ?c
    OPTIONAL{?x a ?y.
    FILTER(?y not in (exp:Exposure, dcat:Dataset)).
    FILTER(!isBlank(?y))
    }
}
Here we query for exposures (
Query 2.
‘Which activities are involved in the exposure and who is exposed?’
SELECT DISTINCT ?yc ?zc
WHERE {
    ?x a exp:Exposure.
    ?x exp:causedBy ?y. ?y a exp:Activity.
    ?y rdfs:comment ?yc.
    OPTIONAL{?x exp:of ?z. ?z a exp:Person.
    ?z rdfs:comment ?zc.}
}
In this query, we search for activities that cause some exposure, and optionally for exposed persons. Since the ontology does not involve any activity/person types, we just retrieve the text descriptions (rdfs:comment) about these activities or persons.
Query 3.
‘What are subjects exposed to?’
SELECT DISTINCT ?yc
WHERE
    {
    ?x a exp:Exposure. ?x exp:causedBy ?y.  ?y rdfs:comment ?yc.
    FILTER NOT EXISTS{?x a exp:ActiveExposure. ?y a exp:Environment. }
    FILTER NOT EXISTS{?x a exp:PassiveExposure. ?y a exp:Activity. }
}
In this query, we search for all phenomena that cause exposure. Yet, the focus on what we are exposed to changes with the type of exposure. In the case of passive exposure, we focus on environments. This is because if someone is passively exposed to air pollution (e.g., we are not interested in his or her activity performed when being exposed). Conversely, for active exposure, we are mainly interested in the activity that is performed, such as running. This focus is encoded in FILTER NOT EXISTS statements, and of course, it could be removed if needed.
Query 4.
‘What is their health risk of exposure?’
SELECT DISTINCT ?yc
WHERE {
    ?x a exp:Exposure.
    ?x rdfs:comment ?c.
    ?x exp:causes+ ?y. ?y a exp:Risk. ?y rdfs:comment ?yc.
}
In this query, we retrieve health risks caused by exposures, potentially via some causal chain (+). This is because the exposure may cause health risks directly or indirectly via doses first. We want to keep this possibility open.
Query 5.
‘Which environments influence the exposure and from which datasets were they derived?’
SELECT DISTINCT ?yc ?zc ?d
WHERE {
    ?x a exp:Exposure.
    ?x rdfs:comment ?xc.
    ?x exp:causedBy+ ?y. ?y a exp:Environment. ?y rdfs:comment ?yc.
    ?y prov:wasDerivedFrom* ?z. ?z a dcat:Dataset; rdfs:comment ?zc.
    FILTER NOT EXISTS {?z prov:wasDerivedFrom ?u}
    OPTIONAL{?z dcat:distribution ?d}
}
In this query, we search for environments that (directly or indirectly) cause exposure. The causal chain (+) is needed since, in the case of active exposures, the environment is a direct cause of the activity, but only an indirect cause of the exposure, via the activity. Furthermore, we are also interested in the data sources of these environments, which could have been generated by zero or more (∗) steps of derivation via the provenance ontology prov:wasDerivedFrom. We want to focus on the sources of data, not intermediary datasets (FILTER NOT EXISTS), and possibly (OPTIONAL) retrieve a web link to where the data is available (dcat:distribution).
Query 6.
‘What are the environmental stressors?’
SELECT DISTINCT ?xc
WHERE {
    ?x a exp:Environment; rdfs:comment ?xc.
    ?y a exp:RiskPromotingExposure; exp:causedBy ?x .
}
In this query, we are looking for environments that cause some risk-promoting exposure (see Definition 1), i.e., an exposure that causes a health risk level to increase with the amount of exposure. This is what we call an environmental stressor.
5.2.Running inferences and queries
We loaded RDF files for each paper together with our ontology into separate RDF graphs in RDFLib.3333 We then used a brute force implementation3434 of the OWL 2 RL3535 and RDFS3636 inference schemes to expand each graph with all possible triples that logically follow from our ontology and the linked data encoding of a paper’s content. After this inference step, we applied locally closed world inferences to all unique causedBy.Active triples (as explained in Inference rule 1) using our script. Since the latter adds new OWL facts which serve as a start for further inferences, we needed to run the former inference steps again. Since the standard inference is conservative regarding causedBy triples, no further inference is possible. Afterwards, we fired all SPARQL queries over all graphs and summarized the answers.
5.3.Results
In this section, we discuss the potential of our model for filtering and classifying exposure-related concepts, data, and methods across studies. For this reason, we compare results across the six studies for each query individually. Retrieved answers to queries are shown in Tables 2 and 3.
Table 2
| Paper | Which exposures are modelled in this paper? (Query 1) | What types of exposures are these? (Query 1) | Which activities are involved in the exposure? (Query 2) | Who is exposed? (Query 2) | What are subjects exposed to? (Query 3) |
| Helbich_2016 [26] | exposure to physical activity | exp:RiskPreventingExposure, exp:ActiveExposure | walking or biking or motorized transport | school children (GPS tracks) | walking or biking or motorized transport |
| Lipsett_2011 [39] | PM 10 exposure | exp:PassiveExposure, exp:RiskPromotingExposure | Living in California | female teacher | PM 10 concentration raster |
| PM 2.5 exposure | exp:PassiveExposure, exp:RiskPromotingExposure | Living in California | female teacher | PM 25 concentration raster | |
| exp:PassiveExposure, exp:RiskPromotingExposure | Living in California | female teacher | |||
| exp:PassiveExposure, exp:RiskPromotingExposure | Living in California | female teacher | |||
| exp:PassiveExposure, exp:RiskPromotingExposure | Living in California | female teacher | |||
| CO exposure | exp:PassiveExposure, exp:RiskPromotingExposure | Living in California | female teacher | CO concentration raster | |
| exp:PassiveExposure, exp:RiskPromotingExposure | Living in California | female teacher | |||
| Vermeulen_2019 [64] | exposure to smokey coal | exp:RiskPromotingExposure, exp:ActiveExposure | indoor fuel use, data collected on a questionaire | never smoking women in Xuanwei and Fuyuan | indoor fuel use, data collected on a questionnaire |
| exposure to smokeless coal | exp:RiskPromotingExposure, exp:ActiveExposure | indoor fuel use, data collected on a questionaire | never smoking women in Xuanwei and Fuyuan | indoor fuel use, data collected on a questionaire | |
| Rongen_2020 [63] | poor diet | exp:RiskPromotingExposure, exp:ActiveExposure | eating at fast food outlets | adults in the Netherlands | eating at fast food outlets |
| Grinshteyn_2018 [19] | witnessed violent crime exposure | exp:PassiveExposure, exp:RiskPromotingExposure | living in crime neighborhoods | children aged 11 to 18 years old | violent crime |
| hearsay violent crime exposure | exp:PassiveExposure, exp:RiskPromotingExposure | living in crime neighborhoods | children aged 11 to 18 years old | violent crime | |
| victim of violent crime exposure | exp:PassiveExposure, exp:RiskPromotingExposure | living in crime neighborhoods | children aged 11 to 18 years old | violent crime | |
| witnessed non-violent crime exposure | exp:PassiveExposure, exp:RiskPromotingExposure | living in crime neighborhoods | children aged 11 to 18 years old | non-violent crime | |
| hearsay non-violent crime exposure | exp:PassiveExposure, exp:RiskPromotingExposure | living in crime neighborhoods | children aged 11 to 18 years old | non-violent crime | |
| victim of non-violent crime exposure | exp:PassiveExposure, exp:RiskPromotingExposure | living in crime neighborhoods | children aged 11 to 18 years old | non-violent crime | |
| Hillsdon_2006 [27] | exposure to physical activity | exp:RiskPreventingExposure, exp:ActiveExposure | physical activity | adults in Norwich, England | physical activity |
Table 3
| Paper | What is the risk of exposure? (Query 4) | Which environments influence the exposure? (Query 5) | From which datasets were they derived? (Query 5) | What are the environmental stressors? (Query 6) |
| Helbich_2016 [26] | obesity | homes | None | None |
| obesity | schools | None | None | |
| obesity | availability of major roads | roads, None | None | |
| obesity | distance 2 major roads | roads, None | None | |
| obesity | accident density | accidents, None | None | |
| obesity | proportion of cul-de-sac | roads, None | None | |
| obesity | wind speed | https://www.knmi.nl/nederland-nu/klimatologie/uurgegevens | None | |
| obesity | temperature | https://www.knmi.nl/nederland-nu/klimatologie/uurgegevens | None | |
| obesity | global radiation | https://www.knmi.nl/nederland-nu/klimatologie/uurgegevens | None | |
| obesity | hourly precipitation | https://www.knmi.nl/nederland-nu/klimatologie/uurgegevens | None | |
| obesity | the proportion of green landuse | land use LGN, https://www.wur.nl/nl/Onderzoek-Resultaten/Onderzoeksinstituten/Environmental-Research/Faciliteiten-tools/Kaarten-en-GIS-bestanden/Landelijk-Grondgebruik-Nederland/Wat-is-LGN.htm | None | |
| Lipsett_2011 [39] | Myocardial Infarction, stroke | PM 10 concentration raster | PM 10 monitoring stations, https://www.arb.ca.gov/adam | PM 10 concentration raster |
| Myocardial Infarction, stroke | PM 25 concentration raster | PM 2.5 monitoring stations, https://www.arb.ca.gov/adam | PM 25 concentration raster | |
| Myocardial Infarction, stroke | ||||
| Myocardial Infarction, stroke | ||||
| Myocardial Infarction, stroke | ||||
| Myocardial Infarction, stroke | CO concentration raster | CO monitoring stations, https://www.arb.ca.gov/adam | CO concentration raster | |
| Myocardial Infarction, stroke | SO monitoring stations, https://www.arb.ca.gov/adam | |||
| Vermeulen_2019 [64] | lung cancer | coal deposits or mines | https://doi.org/10.1002/ijc.32034 | None |
| lung cancer | homes located in Chinese Counties Xuanwei or Fuyuan | None | None | |
| lung cancer | socio-economic status | None | None | |
| lung cancer | household characteristics | None | None | |
| Rongen_2020 [63] | obesity | fast food outlets | https://locatus.com/applicatie/retail-facts/ | None |
| obesity | neighbourhood | None | None | |
| Grinshteyn_2018 [19] | adverse behavioural health characteristics | violent crime | None | violent crime |
| adverse behavioural health characteristics | non-violent crime | None | non-violent crime | |
| adverse behavioural health characteristics | neighbourhood crime rates | None | None | |
| Hillsdon_2006 [27] | obesity, health issues | large urban green space | None | None |
| obesity, health issues | quality urban green space | None | None | |
| obesity, health issues | distance to green space | None | None | |
| obesity, health issues | distance to city boundary | None | None |
Query 1 As you can see in Table 2, the amount of answers in each study for this query already tells us something about the focus of a study. For example [27,63], and [26] only study a single exposure, whereas [19,64], and [39] study multiple exposures. For example, [39] focus on types of air quality exposures and [19] on different variants of crime exposures. All exposures are health-relevant. Furthermore, we can see differences in how these exposures are automatically classified using inference. According to our model, [27,63,64], and [26] all study some form of active exposure. According to Def. 4, this means that exposures have exclusively active causes (so either are activities or are caused by activities). [27] and [26] focus on exposure to physical activity (walking or biking or motorized transport), while [63] focuses on an individual’s exposure to poor diet and fast food. Note that while these studies also take exposure to environments into focus, the latter are not direct causes of exposure. Furthermore, the poor diet exposure in the study of [63] is correctly classified as a risk-promoting exposure, whereas the other two kinds of exposures are correctly recognized as risk preventing instead. [64] is an interesting case of active risk-promoting exposure. Though air quality plays an important role in this process, the exposure is still classified as active, simply because burning coal is an activity causing air quality, and so the causal chain of exposure is entirely rooted in the underlying household decisions of the women. [19] is another interesting border case, because exposure to crime may be seen as an active exposure due to crime being an activity, yet it is classified as passive by our model. The reason is that [19] does not take into account crime as an activity, including the people committing the crime, but rather models crime as a (static) aspect of the environment. This way of modelling crime resembles the way any other environment is modelled.
Query 2 This query asks about the specific activity that causes health-relevant exposure and who is involved in that activity (see Table 2). In the case of [19], this activity is not committing a crime, but living in a neighbourhood with crime, as experienced by children. Living is also the prime activity considered in the study of [39] about air pollution, yet in this case, focusing on female teachers. Children’s transport to school is the focus for [26], whereas [27] focuses on the physical activity of adults in Norwich. Interestingly, the activity causing the exposure in [63] is not the food buying behaviour (though this could be done when studying exposure to poor diet), but it is instead eating at fast food outlets. Note that this distinction is crucial to understanding whether studies about food are comparable to not. In [64], our model makes clear that the cause of the smokey coal exposure is indoor fuel use by never smoking women. This shows the study intends to measure a health effect that can be exclusively attributed to the household environment, instead of smoking behaviour.
As shown in Table 2, most studies only take a single kind of activity into account, except for [26], where transport to school is distinguished into 3 different modes: walking, biking, and motorized transport. Note that all studies define a certain study group, though some have tighter restrictions on their subjects. [27,39,64], and [63] examine adults, whereas [64] and [39] place additional requirements on these adults. The remaining two studies, [26] and [19], both study children of different age groups: 6–11 years and 11–18 years, respectively.
Query 3 The third query (Table 2) focuses on what a person is exposed to, dependent on whether the exposure is active (activity) or passive (environment). In all active exposure cases, a person is exposed to exactly the activities that are causing their exposure. For example, in [26], school children are exposed to walking, biking, or motorized transport. In [64] people are exposed to indoor fuel use (though indirectly via indoor air pollution), [63] subjects are exposed to eating at fast food outlets, and [27]’s subjects are exposed to physical activity. In the passive exposure studies, subjects are exposed to air pollution concentrations particulate matter 10, particulate matter 2.5, ozone, nitrogen dioxide, nitrogen oxides, carbon, and sulfur dioxide (
Query 4 This query asks for the healthrisk of exposure (Table 3). All studies identified some health-related risks as a consequence of the exposure. [19] focuses on mental health rather than physical health (risk of adverse behaviour). [26,63], and [27] focus on obesity (though using different methods and considering different groups of people). [64] and [39]’s look at different risks of air pollution in their study, namely lung cancer, myocardial infarction, and stroke.
Query 5 The first part of Query 5 filters for environments that influence exposure (Table 3). In the study for [39], concentrations for
The second part of Query 5 asks about the data sets from which environments were derived. In this query, there are many missing (labelled as “None” in the table) answers because most studies provided only incomplete information on where data sets were obtained, and this was not enough to provide a reliable answer to this query. As shown in Table 3, [26] provided links to data sources for wind speed, temperature, global radiation, hourly precipitation, and proportion of green land use. Our query also reveals that data on the availability of major roads, distance to major roads, and proportion of cul-de-sacs was derived from the same road data set. Similarly, accident density was derived from an accident data set. However, the data links to the road and accident data set are not available. Location data and other qualitative data on homes and schools were also not available (may be due to privacy reasons). [64] and [63] provided access to data about coal deposits or mines and fast food outlets, respectively. [19] and [27] did not provide any data sets for any of their environments. Only [39] provided data links for all their environments (monitoring stations).
Query 6 This query is about environmental stressors (Table 2). Answers for this query are lacking (labelled as “None” in the table) for all active exposures because they can never be caused by environmental stressors by definition (cf. Def 2 and 4). For example, large urban green space [27] is an environment but is not a environmental stressor. The only environmental stressors, therefore, are air quality [39] and crime [19].
6.Discussion and future work
Ontologies are a way to organize knowledge in a field according to well-defined concepts. In combination with automatic annotation and information extraction methods, it can be used to handle large amounts of evidence on the influence of exposure in the health and behavioural sciences. In this study, we have focused on the design of an ontology that captures and makes comparable the conceptualizations of exposure and the underlying methods and data across different studies. The ontology categorizes parts of an epidemiological study in terms of the following related classes: person, activity, environment, exposure, dose, and health risk. Using these classes as well as a universal causal relation, we defined different exposure concepts using OWL definitions. Based on OWL-RL/RDFS reasoning, we were able to categorize whether a given study in question focused on active and or passive exposure, which environmental stressors are involved, who is exposed etc.
Our model illustrates the potential for an ontology to organize and extract information from exposure-related studies and classify them. It shows the variability of exposure conceptualizations including environmental causes and activities, but also basic commonalities, which allows us to compare articles against each other regarding their content. An article’s focus can be revealed by result frequencies (e.g., many environments causing one activity, vs different activities in the same environment). Also, passive exposures tend to neglect activities and persons, whereas active exposures tend to model both. Many articles tend to lack information on data sets that were used to measure exposure. The diversity of article topics and exposure cases encoded in our ontology shows that the ontology is general enough to cover various approaches to measuring exposure. This can be easily missed by keyword-based comparisons. For example, it is very easy to confuse the study by [64] about lung cancer and the study by [39] about air pollution if we remain unaware that the former focuses on indoor fuel use (an activity), not on the quality of air. Yet both studies involve the keyword “air pollution”. Thus our model is effective in adding semantic depth to meta-studies, which can now differentiate the underlying exposure model. Epidemiological researchers could use this to systematically compare approaches.
However, our work remains preliminary in the following respects: One limiting factor of this study is that its empirical basis for testing is rather narrow, as only six articles were used to test the ontology. Such a small number was needed because each article needed to be read thoroughly and then encoded into the ontology and RDF manually, which is a very time-consuming, iterative process. How could our study be scaled up to analyse larger amounts of articles? It is possible to integrate natural language processing (NLP) and supervised classification into the framework to scale up the analysis of articles with our ontology. Such an approach has been proposed by [38,42]. However, while it can be assumed that e.g., BERT based pre-trained deep learning models [11] can classify text snippets as persons, activities, environments, etc., with high-quality using named entity recognition, to date, it remains unclear to what extent such methods are also able to extract the rather implicit relations between the categories investigated here, which therefore remains a challenge [1,58]. The latter would be needed to populate our ontology and to automatically infer different exposure categories. Furthermore, in the future, we should investigate to what extent the interpretation of ontology classes and relations are reproducible across different annotators based on measuring inter-annotator agreement [2]. In this way, we could find out to what extent our ontology classes allow for incompatible interpretations.
In addition, the ontology pattern that we proposed here can be improved in several ways. For one, the difference between passive and active exposure was modelled as a binary decision. However, it might be more adequate to allow for passiveness in degrees. For example, one could define an exposure as semi-active if all its causes are caused by some activity, depending on the length of a chain of such causes that are routed in activities. This would allow us to recognize [64]’s air quality study as an active case, even in case we conceptualized the indoor environment as an independent cause. The causal chain would still reveal that such causes are all routed in the activity of burning coal, which can be controlled by the involved person. More generally, future work should investigate to what extent the used ontology of quantities [61] could be extended to capture the various ways how exposure measures are generated computationally. This would allow us to reason about the validity of method applications for certain measurement goals and, at the same time, to investigate the influence of systematic method variations on the quality of exposure-based models in the health sciences.
Notes
1 Exposome-NL https://exposome.nl/about-us/about-the-exposome/.
2 Sometimes also captured by the dichotomy voluntary vs. involuntary exposure. We prefer active/passive over voluntary/involuntary because the latter additionally implies an intention of the involved person, which we think is too restrictive.
3 EPO defines exposure as a BFO span:ProcessualEntity with the informal description “Proximity and/or contact with a source of a disease agent in such a manner that effective transmission of the agent or harmful effects of the agent may occur.”
4 Web Ontology Language, https://www.w3.org/OWL/.
9 https://pubmed.ncbi.nlm.nih.gov. However, note that a systematic review was beyond the scope of this article.
10 For more information on topics studied in Exposome NL, please refer to the list of published articles by Exposome NL researchers at https://exposome.nl/research/publications/.
11 For an introduction to the DL syntax, see [34].
20 Causality as a vehicle for explanation in science is not really the same thing as when motives and decisions (teleologically) “cause” human actions, cf. [65].
21 Cf. https://www.endocrinescience.org/glossary/exposure/. We generalized “substance” in this standard definition to phenomenon since some exposure types are immaterial.
22 Time as a control or measure is not explicitly modeled in this study because while it is an important component of exposure measurement, we tried to simplify the concepts as much as possible in the ontology.
23 Including core concepts of spatial information, such as fields, objects, networks, and events [36].
24 Environmental factors include the aggregation/measurement of the environment on a linear scale for an exposed person, while an environment itself can be conceptualized as a layer of similar phenomena in space. The difference is reflected in the preprocessing of geodata layers. There is separate work on aggregation of environmental factors and recent ontological work on quantification of amounts in GIS [61]. However, such distinctions were not needed for the purpose of this paper.
25 Risk in epidemiology is commonly used more loosely to talk about probabilities of events more generally. We stick to a more restrictive interpretation which we think is more informative.
26 An accumulation amount is measured by an accumulation measurement function. The latter is controlled by amounts of time [61].
27 A more complete formalization of our exposure definition above would require modelling amount domains explicitly in the pattern. We have refrained from doing so to keep the pattern simple.
28 The latter statements cannot be fully formalized in DL because of its restrictions regarding triangular relations.
Appendices
Appendix
AppendixSelection of articles
Grinshteyn et al The paper by [19] studies how children’s mental health is impacted by witnessing, being a victim, or knowing a victim of violent or non-violent crime, specifically when the children show delinquent or aggressive behaviour. Data was collected from seven cohorts in which children had been asked about their crime exposure. This data was then linked to uniform crime reporting data of the Federal Bureau of Investigations (FBI). Based on this data, three sensitivity analyses were performed, with results showing that self-reported crime exposure was associated with increased scores [19].
Vermeulen et al The paper by [64] investigates the relationship between lifelong exposure to the constituents of smoky coal and other fuel types, and lung cancer in females who do not smoke in two provinces in China. The researchers collected lung cancer cases among non-smoking women from six hospitals and also used a control population. Both cases and controls were interviewed using a questionnaire that collected information on residential history, fuel use, and established or suspected risk factors for lung cancer [64]. Statistical analysis revealed that the strongest association with lung cancer was for a cluster of 25 polycyclic aromatic hydrocarbons (PAHS) and for
Lipsett et al Lipsett et al [39] also look at air pollution, however from outdoors. The researchers’ goal was to examine associations of individualized long-term exposures to particulate and gas usage air pollution with myocardial infarction and stroke in female teachers in California. This was done by linking geocoded addresses with inverse distance-weighting monthly pollutant surfaces for two measures of particulate matter and for several gaseous pollutants [39]. They examined associations between these pollutants and risks of myocardial infarction and stroke using Cox proportional hazard models [39]. Results showed long-term exposure to
Rongen et al The study by [63] investigates Dutch neighbourhood social norms with respect to fast food consumption as a potential mediating pathway between fast food outlet exposure and residents’ fast food consumption [63]. A sample of respondents living across the Netherlands completed a survey, where they reported on their fast food consumption and related perceived norms in their neighbourhood [63]. The exposure to fast food was measured by the average count of fast food outlets within a 400 m walking distance buffer around the zip codes of respondents. Regression models were used to assess the association between residential fast food outlet exposure, fast food consumption, and social norm perceptions [63]. Results found that there was no overall direct association between residential fast food outlet exposure and residents’ fast food consumption [63]. However, the researchers found that fast food outlet exposure was positively associated with neighbourhood social norms regarding fast food consumption, which was positively associated with the odds of consuming fast food [63].
Hillsdon et al The study by [27] examined the association between access to quality urban green space and levels of physical activity among adults living in Norwich, United Kingdom. This was done by performing three measures of access to open green space based on distance only, distance and size of green space, and distance, size, and quality of green space [27]. These measurements were done using GIS, and multiple regression models were used to determine relationships between the three factors and the level of recreational physical activity. Results showed that there were no clear relationships. The authors concluded that access to urban green spaces does not appear to be associated with recreational physical activity for their sample group [27]. This article is interesting because it is the only article included in this study where no relationship was found between environments with an action, exposure, or health risk.
Helbich et al Lastly, the study by [26] is about measuring how the natural and built environment impacts Dutch children’s mode of transport to school, which may influence their exposure to physical activity, which in turn prevents obesity. This was done by giving children GPSs for several days, and by analysing the association between the environment on the school path and children’s active/passive transportation behaviour using mixed models. Results showed that distance to school, green space, and weather are not significant, but well-connected streets and cycling lanes are [26].
References
[1] | F.N. Al-Aswadi, H.Y. Chan and K.H. Gan, Automatic ontology construction from text: A review from shallow to deep learning trend, Artificial Intelligence Review 53: (6) ((2020) ), 3901–3928. doi:10.1007/s10462-019-09782-9. |
[2] | R. Artstein, Inter-annotator agreement, in: Handbook of Linguistic Annotation, Springer, (2017) , pp. 297–313. doi:10.1007/978-94-024-0881-2_11. |
[3] | A. Bandrowski, R. Brinkman, M. Brochhausen, M.H. Brush, B. Bug, M.C. Chibucos, K. Clancy, M. Courtot, D. Derom, M. Dumontier et al., The ontology for biomedical investigations, PloS One 11: (4) ((2016) ), e0154556. doi:10.1371/journal.pone.0154556. |
[4] | T.W. Bickmore, D. Schulman and C.L. Sidner, A reusable framework for health counseling dialogue systems based on a behavioral medicine ontology, Journal of Biomedical Informatics 44: (2) ((2011) ), 183–197. doi:10.1016/j.jbi.2010.12.006. |
[5] | S. Borgo and C. Masolo, Ontological foundations of DOLCE, in: Theory and Applications of Ontology: Computer Applications, Springer, (2010) , pp. 279–295. doi:10.1007/978-90-481-8847-5_13. |
[6] | E. Bottazzi and R. Ferrario, Preliminaries to a DOLCE ontology of organisations, International Journal of Business Process Integration and Management 4: (4) ((2009) ), 225–238. doi:10.1504/IJBPIM.2009.03228. |
[7] | P.L. Buttigieg, E. Pafilis, S.E. Lewis, M.P. Schildhauer, R.L. Walls and C.J. Mungall, The environment ontology in 2016: Bridging domains with increased scope, semantic density, and interoperation, Journal of Biomedical Semantics 7: ((2016) ), 1–12. doi:10.1186/s13326-016-0097-6. |
[8] | L. Chen, D. Lu, M. Zhu, M. Muzammal, O.W. Samuel, G. Huang, W. Li and H. Wu, OMDP: An ontology-based model for diagnosis and treatment of diabetes patients in remote healthcare systems, International Journal of Distributed Sensor Networks 15: (5) ((2019) ), 1550147719847112. doi:10.1177/1550147719847112. |
[9] | G.O. Consortium, The Gene Ontology (GO) database and informatics resource, Nucleic acids research 32: (suppl_1) ((2004) ), D258–D261. doi:10.1093/nar/gkh036. |
[10] | N.R. Council et al., Exposure Science in the 21st Century: A Vision and a Strategy, (2012) . doi:10.17226/13507. |
[11] | J. Devlin, M.-W. Chang, K. Lee and K. Toutanova, Bert: Pre-training of deep bidirectional transformers for language understanding, arXiv preprint, (2018) . arXiv:1810.04805. doi:10.48550/arXiv.1810.04805. |
[12] | D.M. Dooley, E.J. Griffiths, G.S. Gosal, P.L. Buttigieg, R. Hoehndorf, M.C. Lange, L.M. Schriml, F.S. Brinkman and W.W. Hsiao, FoodOn: A harmonized food ontology to increase global food traceability, quality control and data integration, npj Science of Food 2: (1) ((2018) ), 1–10. doi:10.1038/s41538-018-0032-6. |
[13] | D. Fensel, U. Şimşek, K. Angele, E. Huaman, E. Kärle, O. Panasiuk, I. Toma, J. Umbrich and A. Wahler, Introduction: What is a knowledge graph? in: Knowledge Graphs, Springer, (2020) , pp. 1–10. doi:10.1007/978-3-030-37439-6_1. |
[14] | M. Fernández-López, A. Gómez-Pérez and N. Juristo, Methontology: From ontological art towards ontological engineering, Technical Report, Technical Report SS-97-06, American Association for Artificial Intelligence, (1997) . |
[15] | J.D. Ferreira, D. Paolotti, F.M. Couto and M.J. Silva, On the usefulness of ontologies in epidemiology research and practice, J Epidemiol Community Health 67: (5) ((2013) ), 385–388. doi:10.1136/jech-2012-201142. |
[16] | A. Gangemi and V. Presutti, Ontology design patterns, in: Handbook on Ontologies, Springer, (2009) , pp. 221–243. doi:10.1007/978-3-540-92673-3_10. |
[17] | B. Gatersleben and I. Griffin, Environmental stress, in: Handbook of Environmental Psychology and Quality of Life Research, G. Fleury-Bahi, E. Pol and O. Navarro, eds, Springer International Publishing, Cham, (2017) , pp. 469–485. ISBN 978-3-319-31416-7. doi:10.1007/978-3-319-31416-7_25. |
[18] | F. Giunchiglia and I. Zaihrayeu, Lightweight Ontologies, (2007) . |
[19] | E.G. Grinshteyn, H. Xu, B. Manteuffel and S.L. Ettner, The associations of area-level violent crime rates and self-reported violent crime exposure with adolescent behavioral health, Community Mental Health Journal 54: (3) ((2018) ), 252–258. doi:10.1007/s10597-017-0159-y. |
[20] | T.R. Gruber, Toward principles for the design of ontologies used for knowledge sharing?, International Journal of Human-Computer Studies 43: (5–6) ((1995) ), 907–928. doi:10.1006/ijhc.1995.1081. |
[21] | M. Grüninger and M.S. Fox, The role of competency questions in enterprise engineering, in: Benchmarking – Theory and Practice, Springer, (1995) , pp. 22–31. doi:10.1007/978-0-387-34847-6_3. |
[22] | N. Guarino, G. Guizzardi and J. Mylopoulos, On the philosophical foundations of conceptual models, Information Modelling and Knowledge Bases 31: (321) ((2020) ), 1. doi:10.3233/FAIA200002. |
[23] | R. Guski, Environmental stress and health, in: International Encyclopedia of the Social & Behavioral Sciences, N.J. Smelser and P.B. Baltes, eds, Pergamon, Oxford, (2001) , pp. 4667–4671. https://www.sciencedirect.com/science/article/pii/B0080430767038328. ISBN 978-0-08-043076-8. doi:10.1016/B0-08-043076-7/03832-8. |
[24] | J. Hastings, S. Michie and M. Johnston, Theory and ontology in behavioural science, Nature Human Behaviour 4: (3) ((2020) ), 226. doi:10.1038/s41562-020-0826-9. |
[25] | E. Heinen, R. Mackett, B. van Wee, D. Ogilvie and J. Panter, Residential self-selection in quasi-experimental and natural experimental studies, Journal of transport and land use 11: (1) ((2018) ), 939–959. https://www.jstor.org/stable/26622438. |
[26] | M. Helbich, M.J.Z. van Emmichoven, M.J. Dijst, M.-P. Kwan, F.H. Pierik and S.I. de Vries, Natural and built environmental exposures on children’s active school travel: A Dutch global positioning system-based cross-sectional study, Health & Place 39: ((2016) ), 101–109. doi:10.1016/j.healthplace.2016.03.003. |
[27] | M. Hillsdon, J. Panter, C. Foster and A. Jones, The relationship between access and quality of urban green space with population physical activity, Public Health 120: (12) ((2006) ), 1127–1132. doi:10.1016/j.puhe.2006.10.007. |
[28] | P. Hitzler, A. Gangemi and K. Janowicz, Ontology Engineering with Ontology Design Patterns: Foundations and Applications, Vol. 25: , IOS Press, (2016) . |
[29] | R. Hoehndorf, What is an upper level ontology?, Ontogenesis ((2010) ). |
[30] | K. Janowicz, Observation-driven geo-ontology engineering, Transactions in GIS 16: (3) ((2012) ), 351–374. doi:10.1111/j.1467-9671.2012.01342.x. |
[31] | R. Kerry, T.E. Eriksen, S.A.N. Lie, S.D. Mumford and R.L. Anjum, Causation and evidence-based practice: An ontological review, Journal of Evaluation in Clinical Practice 18: (5) ((2012) ), 1006–1012. doi:10.1111/j.1365-2753.2012.01908.x. |
[32] | S.S. Killen, S. Marras, N.B. Metcalfe, D.J. McKenzie and P. Domenici, Environmental stressors alter relationships between physiology and behaviour, Trends in Ecology & Evolution 28: (11) ((2013) ), 651–658, https://www.sciencedirect.com/science/article/pii/S0169534713001122. doi:10.1016/j.tree.2013.05.005. |
[33] | W. Koller, A. Rappelsberger, B. Willinger, G. Kleinoscheg and K.-P. Adlassnig, Artificial intelligence in infection control – Healthcare institutions need intelligent information and communication technologies for surveillance and benchmarking, in: Soft Computing for Biomedical Applications and Related Topics, V. Kreinovich and N. Hoang Phuong, eds, Springer International Publishing, Cham, (2021) , pp. 37–48. ISBN 978-3-030-49536-7. doi:10.1007/978-3-030-49536-7_4. |
[34] | M. Krötzsch, F. Simancik and I. Horrocks, A description logic primer, arXiv preprint, (2012) . arXiv:1201.4089. doi:10.48550/arXiv.1201.4089. |
[35] | H. Küçük McGinty, U. Visser and S. Schürer, How to develop a drug target ontology: KNowledge acquisition and representation methodology (KNARM), in: Bioinformatics and Drug Discovery, (2019) , pp. 49–69. doi:10.1007/978-1-4939-9089-4_4. |
[36] | W. Kuhn, Core concepts of spatial information for transdisciplinary research, International Journal of Geographical Information Science 26: (12) ((2012) ), 2267–2276. doi:10.1080/13658816.2012.722637. |
[37] | M.-P. Kwan, The uncertain geographic context problem, Annals of the Association of American Geographers 102: (5) ((2012) ), 958–968. doi:10.1080/00045608.2012.687349. |
[38] | K.R. Larsen, S. Michie, E.B. Hekler, B. Gibson, D. Spruijt-Metz, D. Ahern, H. Cole-Lewis, R.J.B. Ellis, B. Hesse, R.P. Moser and J. Yi, Behavior change interventions: The potential of ontologies for advancing science and practice, Journal of Behavioral Medicine 40: (1) ((2017) ), 6–22. doi:10.1007/s10865-016-9768-0. |
[39] | M.J. Lipsett, B.D. Ostro, P. Reynolds, D. Goldberg, A. Hertz, M. Jerrett, D.F. Smith, C. Garcia, E.T. Chang and L. Bernstein, Long-term exposure to air pollution and cardiorespiratory disease in the California teachers study cohort, American Journal of Respiratory and Critical Care Medicine 184: (7) ((2011) ), 828–835. doi:10.1164/rccm.201012-2082OC. |
[40] | G. Mai, K. Janowicz and B. Yan, Combining text embedding and knowledge graph embedding techniques for academic search engines, in: Semdeep/NLIWoD@ ISWC, (2018) , pp. 77–88. |
[41] | C.J. Mattingly, T.E. McKone, M.A. Callahan, J.A. Blake and E.A.C. Hubal, Providing the Missing Link: The Exposure Science Ontology ExO, ACS Publications, (2012) . doi:10.1021/es2033857. |
[42] | S. Michie, J. Thomas, M. Johnston, P.M. Aonghusa, J. Shawe-Taylor, M.P. Kelly, L.A. Deleris, A.N. Finnerty, M.M. Marques, E. Norris et al., The human behaviour-change project: Harnessing the power of artificial intelligence and machine learning for evidence synthesis and interpretation, Implementation Science 12: (1) ((2017) ), 1–12. doi:10.1186/s13012-016-0533-0. |
[43] | N.F. Noy, D.L. McGuinness et al., Ontology development 101: A guide to creating your first ontology, Technical Report, KSL-01-05, Stanford Knowledge Systems Laboratory Technical Report, (2001) . |
[44] | J. Pearl, Causality, Cambridge University Press, (2009) . |
[45] | J. Pearl and D. Mackenzie, The Book of Why: The New Science of Cause and Effect, Basic Books, (2018) . |
[46] | C. Pesquita, J.D. Ferreira, F.M. Couto and M.J. Silva, The epidemiology ontology: An ontology for the semantic annotation of epidemiological resources, Journal of Biomedical Semantics 5: (1) ((2014) ), 1–7. doi:10.1186/2041-1480-5-4. |
[47] | N. Phan, D. Dou, H. Wang, D. Kil and B. Piniewski, Ontology-based deep learning for human behavior prediction with explanations in health social networks, Information Sciences 384: ((2017) ), 298–313. doi:10.1016/j.ins.2016.08.038. |
[48] | D.B. Richardson, N.D. Volkow, M.-P. Kwan, R.M. Kaplan, M.F. Goodchild and R.T. Croyle, Spatial turn in health research, Science 339: (6126) ((2013) ), 1390–1392. doi:10.1126/science.1232257. |
[49] | J. Schipperijn, B. Ejstrud and J. Troelsen, GIS: A spatial turn in the health science? in: Neighbourhood Structure and Health Promotion, Springer, (2013) , pp. 127–152. doi:10.1007/978-1-4614-6672-7_8. |
[50] | L.M. Schriml, C. Arze, S. Nadendla, Y.-W.W. Chang, M. Mazaitis, V. Felix, G. Feng and W.A. Kibbe, Disease ontology: A backbone for disease semantic integration, Nucleic Acids Research 40: (D1) ((2012) ), D940–D946. doi:10.1093/nar/gkr972. |
[51] | L.M. Schriml, C. Arze, S. Nadendla, A. Ganapathy, V. Felix, A. Mahurkar, K. Phillippy, A. Gussman, S. Angiuoli, E. Ghedin et al., GeMInA, genomic metadata for infectious agents, a geospatial surveillance pathogen database, Nucleic Acids Research 38: (suppl_1) ((2010) ), D754–D764. doi:10.1093/nar/gkp832. |
[52] | K. Sengupta, A.A. Krisnadhi and P. Hitzler, Local closed world semantics: Grounded circumscription for OWL, in: International Semantic Web Conference, Springer, (2011) , pp. 617–632. doi:10.1007/978-3-642-25073-6_39. |
[53] | X. Shi and M.-P. Kwan, Introduction: Geospatial Health Research and GIS, Vol. 21: , Taylor & Francis, (2015) , pp. 93–95. doi:10.1080/19475683.2015.1031204. |
[54] | D. Sinton, The inherent structure of information as a constraint to analysis: Mapped thematic data as a case study, in: Harvard Papers on Geographic Information Systems, (1978) . |
[55] | B. Smith, M. Ashburner, C. Rosse, J. Bard, W. Bug, W. Ceusters, L.J. Goldberg, K. Eilbeck, A. Ireland, C.J. Mungall et al., The OBO Foundry: Coordinated evolution of ontologies to support biomedical data integration, Nature Biotechnology 25: (11) ((2007) ), 1251–1255. doi:10.1038/nbt1346. |
[56] | B. Smith and P. Grenon, The cornucopia of formal-ontological relations, Dialectica 58: (3) ((2004) ), 279–296. doi:10.1111/j.1746-8361.2004.tb00305.x. |
[57] | B. Smith and A.C. Varzi, Fiat and bona fide boundaries: Towards an ontology of spatially extended objects, in: International Conference on Spatial Information Theory, Springer, (1997) , pp. 103–119. doi:10.1007/3-540-63623-4_45. |
[58] | T. Sonnenschein, G.A. de Wit, N. de Braver, R. Vermeulen and S. Scheider, Validating and constructing behavior models for simulation and projection using automated knowledge extraction, Information Sciences ((2024) ). doi:10.1016/j.ins.2024.120232. |
[59] | T. Sonnenschein, S. Scheider, G.A. de Wit, C.C. Tonne and R. Vermeulen, Agent-based modeling of urban exposome interventions: Prospects, model architectures, and methodological challenges, Exposome 2: (1) ((2022) ), osac009. doi:10.1093/exposome/osac009. |
[60] | C.J. Tomlinson, L. Chapman, J.E. Thornes and C.J. Baker, Including the urban heat island in spatial heat health risk assessment strategies: A case study for Birmingham, UK, International journal of health geographics 10: (1) ((2011) ), 1–14. doi:10.1186/1476-072X-10-42. |
[61] | E. Top, S. Scheider, H. Xu, E. Nyamsuren and N. Steenbergen, The semantics of extensive quantities within geographic information, Applied Ontology ((2022) ), 1–28. doi:10.3233/AO-220268. |
[62] | D. Tsatsou, E. Lalama, S. Wilson-Barnes, K. Hart, V. Cornelissen, R. Buys, I. Pagkalos, S. Dias, K. Dimitropoulos and P. Daras, NAct: The Nutrition and Activity Ontology for Healthy Living, (2021) . ISBN 9781643682488. doi:10.3233/FAIA210377. |
[63] | S. Van Rongen, M.P. Poelman, L. Thornton, G. Abbott, M. Lu, C. Kamphuis, K. Verkooijen and E. De Vet, Neighbourhood fast food exposure and consumption: The mediating role of neighbourhood social norms, International Journal of Behavioral Nutrition and Physical Activity 17: (1) ((2020) ), 1–9. doi:10.1186/s12966-020-00969-w. |
[64] | R. Vermeulen, G.S. Downward, J. Zhang, W. Hu, L. Portengen, B.A. Bassig, S.K. Hammond, J.Y. Wong, J. Li, B. Reiss et al., Constituents of household air pollution and risk of lung cancer among never-smoking women in Xuanwei and Fuyuan, China, Environmental Health Perspectives 127: (9) ((2019) ), 097001. doi:10.1289/EHP4913. |
[65] | G.H. Von Wright, Explanation and Understanding, Cornell University Press, (2004) . |
[66] | B. Yang, S. Sayers, Z. Xiang and Y. He, Protegen: A web-based protective antigen database and analysis system, Nucleic Acids Research 39: (suppl_1) ((2011) ), D1073–D1078. doi:10.1093/nar/gkq944. |
[67] | F. Zeshan and R. Mohamad, Medical ontology in the dynamic healthcare environment, Procedia Computer Science 10: ((2012) ), 340–348. doi:10.1016/j.procs.2012.06.045. |


