
LinkedDataOps:quality oriented end-to-end geospatial linked data production governance
Abstract
This work describes the application of semantic web standards to data quality governance of data production pipelines in the architectural, engineering, and construction (AEC) domain for Ordnance Survey Ireland (OSi). It illustrates a new approach to data quality governance based on establishing a unified knowledge graph for data quality measurements across a complex, heterogeneous, quality-centric data production pipeline. It provides the first comprehensive formal mappings between semantic models of data quality dimensions defined by the four International Organization for Standardization (ISO) and World Wide Web Consortium (W3C) data quality standards applied by different tools and stakeholders. It provides an approach to uplift rule-based data quality reports into quality metrics suitable for aggregation and end-to-end analysis. Current industrial practice tends towards stove-piped, vendor-specific and domain-dependent tools to process data quality observations however there is a lack of open techniques and methodologies for combining quality measurements derived from different data quality standards to provide end-to-end data quality reporting, root cause analysis or visualisation. This work demonstrated that it is effective to use a knowledge graph and semantic web standards to unify distributed data quality monitoring in an organisation and present the results in an end-to-end data dashboard in a data quality standards-agnostic fashion for the Ordnance Survey Ireland data publishing pipeline.
1.Introduction
Architectural, engineering, and construction (AEC) industries have transformed recently with a rising number of impact areas such as Building Information Modelling (BIM), smart construction, smart cities and digital twin applications. Digital technologies now play a significant role in the way the products are designed, modelled and maintained due to its benefits such as ease of usage, powerful design, sustainability and data sharing within different domains.
With the advancements in technology and requirements from the industry, AEC systems are evolving to more automated and interchangeable management of data, such as, Industry 4.0 communications among heterogeneous industrial assets [42] sustainable buildings for environment-friendly construction structures [20], sensors embedded smart city applications [22]. There is a common feature of all these systems that these applications need unification of high quality geospatial data, computer methods and domain knowledge to provide high quality results for the queries or decision support systems [22].
Given this, the structured and interlinked characteristics of Semantic Web technology can lay the foundations for seamless integration of different knowledge domains into the AEC domain such as geospatial information systems (GIS), built systems, and energy performance systems [35]. In addition, current AEC standardisation efforts have promoted interoperability using Linked Open Data (LOD). This has allowed location-based AEC applications to gain more prominence in the domain by incorporating geospatial semantics into the data.
Geospatial information systems have long been considered high-value resources for different domains due to their rich semantics. Geospatial Linked Data (GLD) has been even more crucial with the rise of knowledge graphs. However, the process of producing and transforming GLD is prone to errors11 and high demands are placed on data quality [6]. Thus, effective data governance mechanisms are required for the management and tracking of data quality during data production processes [11].
However currently most organisations have immature data governance capabilities [5]. A key organisational deficit is the lack of comprehensive data governance metadata describing data production. This is in part due to the diversity of data standards developed by organisations like the ISO. A practice rooted in the previous segregation of application domains like GIS that now must form part of an integrated AEC data ecosystem. Diversity of standards and segregated application domains have led to siloed data storage, data management tools and a lack of end-to-end toolchains for functions like data quality that must span the production pipeline and lifecycle for effective monitoring, root cause analysis and reporting. This is compounded by the fact that geospatial data typically have very complex, multi-stage data production pipelines dependent on a variety of remote sensing technologies, synthesis of a document or record-oriented environmental, local government and legal information, data transformations into entity-oriented representations, and conversion or summarisation for regional or application-oriented consumption. As more sources, tools and consumers are added to the pipeline, so the diversity of data quality governance needs grows. The provenance of this data becomes even more critical to track. In this environment, manual or isolated data quality solutions become increasingly inefficient so it is critical to developing standards-oriented, automated approaches to manage the quality of data in a production pipeline. Despite this need, there is a lack of open, standardised data governance metadata models to address this challenge. Tool or platform vendors instead provide point solutions with specialised data governance companies providing expensive, proprietary data governance metadata models and bespoke data ingestion tools.
Taking into account the above challenges, this paper investigates the research question “To what extent can semantic web-based methods and tools provide effective data quality governance metadata models for end-to-end production of geospatial data?”.
In order to solve this problem, we propose the LinkedDataOps approach [45] to create a comprehensive, consistent, multi-standards data governance metadata model of data quality in a complex, heterogeneous data production pipeline including both semantic web and non-semantic web tools, datasets and data stores. This enables the creation of end-to-end data quality monitoring and analysis processes and tools to ensure the consistent operations of data production pipelines. Semantic Web tools and vocabularies are employed to achieve this goal due to their strengths in merging data from multiple perspectives, uplifting or transforming data from varied formats and providing a set of standard vocabularies suitable to cover the data governance decision domains of quality, life cycle, access, and metadata [28].
The contributions of this paper are that (i) It defines a semantics and standards-based approach for data governance of knowledge graph production, especially for geospatial information systems. This is based on using data quality dimension mappings, provenance and dataset descriptions to create a unified data quality graph of a data production pipeline. This graph can merge quality assessments from heterogeneous tools and report the results according to all major geospatial quality standards. This is the first data governance metadata model to provide a comprehensive alignment22 of the geospatial data quality standards and data quality dimensions spanning ISO, W3C and Open Geospatial Consortium (OGC) standards and to describe them in a graph based on Dataset Quality Ontology (daQ). (ii) A set of supporting metrics for Geospatial Linked Data standards compliance are proposed.33 (iii) Capture of measurement context is supported by the definition of a data lineage model of the datasets in the pipeline based on the PROV-O44 and DCAT55 standards and United Nations Global Geospatial Information Management (UN-GGIM) data classification scheme.66 This combined model enables the collection, aggregation, transformation and querying of previously siloed quality metrics at any stage of the data production pipeline in terms of any geospatial data quality standards. (iv) A prototype open source data quality dashboard77 was developed to demonstrate these features. This paper validates the approach by applying it in an industrial geospatial data production pipeline in OSi. The model was applied using R2RML to generate data governance metadata unifying diverse quality measurements from the graph and relational databases, commercial and open source quality assessment tools,88 and a machine readable description of the OSi data production pipeline. Data quality reports were developed for multiple stakeholders. We document the lessons learned from this process.
The remainder of this paper is structured as follows: Section 2 describes the OSi use case, and Section 3 summarises the related work containing data quality standards and tools as well as the R2RML mapping language. Section 4 discusses the unified data quality knowledge graph approach including key concepts, data quality assessment uplift and alignment among standards, data quality metrics, data lineage and data quality dashboard. We present the evaluation based on a case study and results in Section 5 followed by lessons learned in Section 6. Finally, conclusions and future work are discussed in Section 7.
2.Use case : OSi data production pipeline
OSi is the national mapping agency of Ireland and it manages the national geospatial digital infrastructure. National mapping agencies such as OSi are now geospatial data publishers more than cartographic institutions. OSi produces data for planning, construction and engineering purposes which provides a detailed dataset of roads, rivers, buildings and other spatial features which might be found on a map. These maps are used for different occasions including emergency situations. Hence street furniture like lamp posts and bollards are represented as spatial features and the lifecycle of every spatial feature is tracked over time to support real-time planning of emergency response. Government departments and public-sector bodies under the National Mapping Agreement (NMA) (an Irish agreement) have unrestricted access to most of OSi’s geospatial data. Departments can request access to other datasets such as buildings and infrastructure [31]. This increasing, interconnected demand on the national geospatial data assets is relevant in every country [43].
The OSi data pipeline (Fig. 1). encompasses a range of surveying and data capture systems, image processing and feature extraction in the Geospatial Management System (GMS), conversion to the PRIME2 object-oriented spatial model of over 50 million spatial objects tracked in time and provenance, conversion to the multi-resolution data source datasets (MRDS) for preparation of data for cartographic products at a wide range of scales or onto other data sales and distribution channels such as Irish Geospatial Linked Data usually available99 through data.geohive.ie [17,31]. All of these services run on a state of the art Oracle Spatial and Graph installation that supports both relational and RDF models using dedicated exadata hardware.
Fig. 1.
OSi geospatial information publishing pipeline with quality control points.
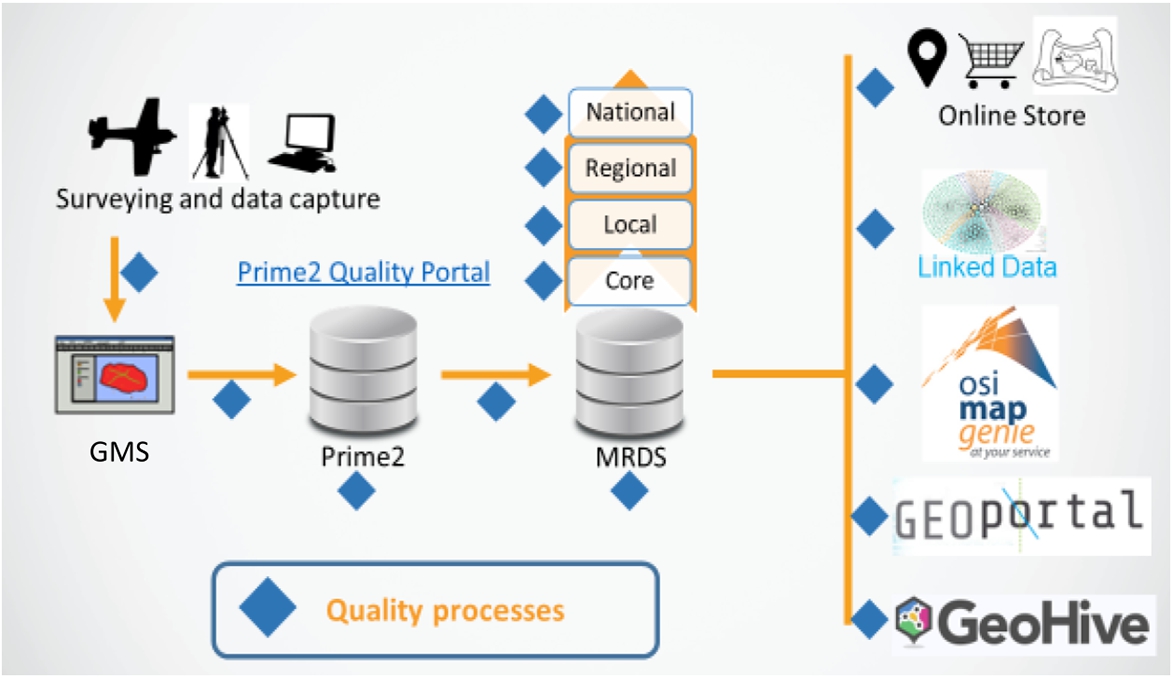
The data in the OSi data production pipeline comes from many government agencies 6 as well as the OSi survey teams and it is heterogeneous in terms of formats, transformations, and versions. For example the Galway city data is sourced from: (i) the earlier Prime1 national dataset as cartographic images (ii) 5-year National aerial surveys using LIDAR photogrammetry to generate point clouds (iii) OSi survey teams on the ground re-capturing local changes and storing them in PRIME2 directly (iv) archaeology relational data from the national moment service (v) political boundaries from the national boundaries geospatial polygon dataset (vi) documentation and CSV data from local county councils and other sources such as Sports Ireland.
As seen in Fig. 1 the Galway data enters the system at the GMS or directly into Prime2. To enter Prime 2 all data (images, pointclouds, documents, CSV, relational) is transformed into an object-oriented spatial model in the Oracle Spatial and Graph platform. From Prime2 the data is transformed into the MRDS (Multi-Resolution Data Store) that contains the first verified and standardised datasets that are available to customers. This is a report-oriented datastore and thus contains a simplified relational structure like a data warehouse (“Core” in Fig. 1)). A feature of this store is that it contains the logic to generate three views of the data (National, Regional and Local) that are suitable for automated cartographic generation and printing. In addition to typical data aggregation techniques these transformations require selective merging of geospatial entities at different scales or resolutions (e.g. high resolution views show individual buildings but lower resolution shows an urban area). This is all treated at a geospatial entity level and is subject to quality assessment. Finally the data is transformed to customer-facing interfaces such as the online OSi Map Store or Irish National Linked Data resources. Again quality checks are necessary after these transformations. OSi has independent field survey teams perform sampling-based quality analysis of the accuracy of its data products. Then additional quality feedback for products is sourced from customer service desks and complaints.
The data requires multi-dimensional, diverse quality measures in order to meet the needs of stakeholders, making the process of reporting data quality and providing effective data management in this dynamic environment more difficult. Each stakeholder monitors a specific set of user-oriented aspects of quality (quality dimensions) or sometimes even specific data quality metrics for the subset of the data they are interested in. In addition, standardisation conformance is a critical aspect of data quality that must be reported upon to stakeholders. Despite this, there is a lack of tools and metrics that specifically address the standards conformance of geospatial data. Internally, the diversity of tools, platforms and stakeholders acting on the pipeline (often in a domain-specific fashion, for example, data capture and processing of aerial photogrammetry) and the numerous, changing non-standardized data sources prevents the organisation from combining measurements along the entire pipeline.
Quality is assured by applying a suite of over 500 quality rules to the PRIME2 dataset and it is possible to assure very high levels of compliance with those rules. However, execution of the full ruleset on over 50 million spatial objects can take days, even on custom high-end hardware. This does not pose a problem when a regular flow of localised transactions is used to update the PRIME2 model but when large-scale data transformations must be carried out (for example for schema updates or to fix systematic errors identified in older releases) then the time required for a full data quality re-assessment of the data is unsustainable. In general, supporting a diversity of data quality tools is important to the system.
Data is collected, maintained and consumed by individual departments within OSi, often with their own tools or platforms that focus on specific vertical uses for the data. In some cases, this feedback into the pipeline with quality fixes or new requirements. Process changes in earlier stages of data production can often impact upstream activities. This distributed data processing introduces challenges in discovering data quality problems. Moreover, the data is often stored in different formats or platforms in different departments so different quality metrics and tools must be used. Therefore, it is of the utmost importance to have an end-to-end data quality portal visible to users across the organisation.
Data quality assessment in OSi was instead a set of independent data quality processes acting at points along the pipeline (the blue diamonds in Fig. 1). This depends on (i) the rules-based 1Spatial 1Integrate data quality assessment tool that periodically assesses the entire PRIME2 relational dataset which is at the centre of the pipeline (ii) semi-automated techniques by domain experts or statistical techniques based on scripting or spreadsheets (iii) manual inspection (iv) specialised tools that only work on specialised datasets or environments like the Luzzu quality assessment framework for Linked Data. None of these tools except Luzzu produce well-formed metrics [23] assigned to specific quality dimensions that are suitable for aggregation and analysis. A range of geospatial data quality standards is used, depending on the intended consumer of the quality information.
Frameworks such as the UN-GGIM publish a set of advice for managing data quality and developing integrated geospatial information systems at the national and international level [44]. It is required to conform to such standards for monitoring and reporting the data at different levels. This provides assurances for OSi’s customers, helps inform appropriate uses for their data; enables upward reporting to the Irish government, European Commission and UN; enables more sophisticated data quality monitoring within the organisation and provides feedback to managers within OSi for teams involved in data collection, modelling and transformation. Over 600 staff will be impacted by the new system and 10% of those staff will interact directly with the system.
Through a series of internal workshops with stakeholders the following requirements were identified:
– Req 1: Monitoring, analysing and reporting of end-to-end data quality in a unified way.
– Req 2: Ability to report quality in terms of a range of data quality dimensions for different stakeholders.
– Req 3: Ability to report on stakeholder-specified subsets of the data across all stages of the data pipeline.
– Req 4: Alignment of diverse data quality standards to provide a unified view of heterogeneous data quality assessment results.
– Req 5: Ability to combine quality assessments from diverse tools and data platforms at many stages of the data production pipeline.
– Req 6: Provence or data lineage models to support back tracing or root cause analysis of the location of errors occurring in the data.
– Req 7: Classification of the data to provide contextualization for statistical purposes.
3.Related work
This study especially aims at providing a unified solution for the enterprise quality pipelines which is easily solved by a semantic approach using an end-to-end knowledge graph. To the best of our knowledge, this has not been performed prior to this study.
3.1.International data quality standards for geospatial data
Data quality is described as “fitness for use”. Data quality assessment involves the measurement of quality dimensions and they are considered the characteristics of a dataset [50]. Measurement of the quality assessment is represented using data quality models. Quality models are important for providing consistent terminology and guidance for quality assessment and are the basis for the evaluation of any product or service [37]. Various standards aim at filling the gap for a specific area e.g. software quality, geospatial data quality. Thus, a standard might not be able to meet all the requirements needed by a data pipeline.
This section identifies, evaluates and compares a set of relevant standards and recommendations for GLD quality proposed by the OGC, ISO and W3C. This is necessary as there are many standard ways to represent quality data and metadata. The ISO/TC 211 Geographic information/Geomatics committee defines geographic technology standards in the ISO 19000 series [24], as well as, the OGC creates open geospatial standards. Both organisations have close connections such that some documents prepared by OGC are adopted by ISO or implemented by the collaboration of both parties. The standards are evaluated in 3 main groups:
Geospatial datasets ISO 19103, 19107, 19108, 19109, 19112, 19123, 19156 [24] are published to describe the data, in particular the schema, spatial referencing by geospatial data, and methods for representing geographical data and measurements. Old ISO 19113/19114/19138 are combined with 19157 data quality standards. Thus, while ISO 8000 defines data quality concepts and processes for generic information systems, ISO 19157 and ISO 19158 provide more detailed guidance on data quality practices for geospatial data. ISO 19158 specifies metrics and measurements for the evaluation of data quality elements at different stages of the geospatial data lifecycle. It also defines quality metric evaluation by using aggregation methods and thresholds. ISO 19157 defines a set of data quality measures when evaluating and reporting data quality of geospatial data.
Geospatial metadata ISO 19111 and 19115 describe the metadata standards for geospatial data. While ISO 19115 focuses on metadata for cataloguing and profiling purposes with the extensions for imagery and gridded data; ISO 19111 describes appropriate metadata for a Coordinate Reference System.
Geospatial linked data There are three relevant types of documents for data quality. (i) ISO 19150 which guides high level ontology schema appropriate for geospatial data and rules for using OWL-DL. (ii) OGC’s GeoSPARQL standard define a set of SPARQL extension functions for geospatial data, a set of RIF rules and a core RDF/OWL vocabulary for geographic information based on the General Feature Model, Simple Features, Feature Geometry and SQL MM [36]. (iii) W3C has two documents, first the Data on the Web Best Practices recommendation for improving the consistency of data management and secondly the Spatial Data On the Web working group note which complements the earlier recommendation but is specialised for geospatial data.
Fig. 2.
Classification of data quality standards.
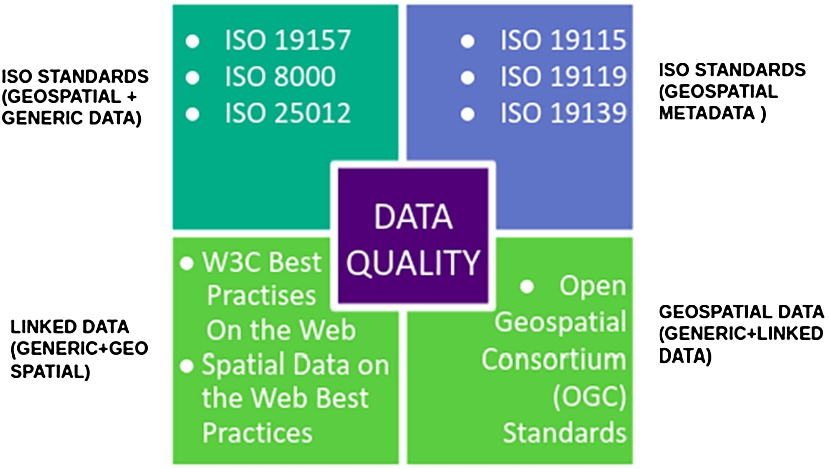
There are many standard ways to represent quality metadata proposed for managing quality data (Fig. 2). This paper focuses on the 3 main quality standards as well as W3C Best Practices to present quality reports:
ISO 8000 | 1010 defines characteristics of information and data quality applicable to all types of data. The document also provides methods to manage, measure and improve the quality of information and data which can be used in conjunction with quality management systems. The standard has 3 main categories namely semantic, syntactic and pragmatic quality including 16 dimensions. |
ISO 19157 | 1111 is published to understand the concepts of data quality related to geographic data including data quality conformance levels in data product specifications, schemas, evaluating and reporting data quality with geospatial focus. The standard describes 6 dimensions to define the quality of geospatial data. |
ISO 25012 | 1212 is one of the SQuaRE (Software product Quality Requirements and Evaluation) series of International Standards, which defines a general data quality model for data retained in a structured format within a computer system. In this study, we consider this standard as our main standard due to its high coverage of a wide range of dimensions. The standard includes 17 dimensions to describe generic data quality. |
W3C Best Practices DQV [1] | is described to publish and use high quality data on the web. The practice has 14 recommendations to provide data quality information with published datasets. Zaveri et al. [50] proposes 18 quality dimensions spread into 4 categories for the Linked Data environment thus in the scope of this work we use these categories and dimensions to sketch middle-ware standard mappings. |
3.2.Data quality tools for geospatial data
Several quality assessments of GLD have previously been conducted [27,30,33] but one of them relies on crowdsourced evaluations rather than automated metrics [27], another one provides a generic Linked Data quality assessments of the data that is not specific to geospatial concerns [30] and the other is tied to a custom ontology predating GLD standardisation [33]. In contrast, there are not a large amount of dedicated geospatial data quality tools implemented per se, especially for Linked Data. Existing tools are focused on the traditional data and business products such as ArcGis,1313 GeoToolkit.1414 The tools which are employed in the OSi data pipeline are 1Spatial 1Integrate and Luzzu tools.
1Spatial 1Integrate1515 is a tool which automates the correction of invalid data by applying rules-based data re-engineering tasks. Compliance of the data is achieved by creating and managing multiple rule sets for the datasets. Using rules-based automation, the tool aims at ensuring the accuracy, inviolability and validity of the data and that it is in the publishable state. The 1Integrate system performs over 200 rules on the relational data to ensure the compliance of the data with model prerequisites and to maintain the consistency of the data. The system produces statistical summaries, a map view of the results or GIS files for the analysis of the data. This tool has already been used in the OSi for quality assessment of relational data.
Luzzu [14] is an open-source Java based Linked Data quality assessment framework which allows users to use custom quality metrics to produce quality based statistics about the data. This is an interoperable tool allowing ontology driven backend to produce machine readable quality reports and metadata about the assessment results. After the processor streams, all the triples quality metadata is produced by provenance information and problematic triples are described in the problem report. The quality metadata is represented by domain independent daQ core ontology based on W3C RDF Data Cube and PROV-O vocabularies [16]. The data can be processed either from bulk data or SPARQL endpoints. In practice, rules definitions are expensive to develop and maintain. Luzzu framework is useful as it generates self-describing plug and play metrics and quality observations metadata. Thus, Luzzu was chosen as a data quality tool in this project.
Besides these tools, W3C standard Shapes Constraint Language1616 (SHACL) is used to validate the data against a set of conditions. SHACL models are described in terms of restrictions on a graph specifying which data graph nodes must adhere to which shape. This is a general validation approach rather than domain-specific quality assessment but it is also another approach which could be applied to the assessment of the data. However, this study investigates domain-specific approaches rather than a generic approach.
3.3.R2RML
R2RML1717[12] is a language to define mapping rules from relational data to RDF data so that they can be processed by a compliant mapping engine. It is a W3C recommendation. The mappings and any metadata are expressed in RDF. An R2RML mapping is written for a particular database schema and target vocabulary e.g. DQV, the W3C standard data quality vocabulary. A set of mapping rules and a relational database or tabular data in CSV (comma-separated value) format is used as input to produce RDF data with the corresponding schema. R2RML mappings refer to logical tables to convert data from the given database, hence database views or actual tables can be mapped to RDF. The result of the R2RML process is a graph representation of the input database. Once a set of mapping rules is written, data can be rapidly and reliably transformed between relational and RDF formats. For example, the Oracle Spatial and Graph database product can natively load a set of R2RML rules into the database to dynamically create an RDF view of the underlying data.
There are number of open research tools for geospatial data conversion from traditional data to Linked Data such as Geometry2RDF,1818 TripleGeo1919 [34], GeoTriples2020 [29] and Ontop-Spatial [3] which are used either to materialize the geospatial data or create an ontology-based database access (OBDA) over traditional data. Moreover, there are other tools using RML/R2RML approach to materialize the data such as RML+FnO [13], FunMap [26] or Morph-KGC [2]. However, in this study R2RML-F tool2121 of Debruyne et al. was used to produce Linked Data which allows domain-specific data transformations – such as transforming geospatial coordinates [18]. Also, it is important to note that the focus of this study is not on creating a production pipeline but on a quality assessment pipeline which may apply to any application.
3.4.Data lineage for geospatial data
Data lineage can be used for data validation and verification as well as data auditing. These features are proven to be practical for data governance and data quality monitoring [21]. This subsection investigates the data lineage approaches for geospatial data.
Chen et al. [7] define a domain-specific provenance model and a tracking approach to represent and track provenance information for remote sensing observations in a Sensor Web enabled environment. Closa et al. [8] analyse the potential for representing geospatial provenance in a distributed environment at the three levels of granularity (dataset, feature and attribute levels) using ISO 19115 and W3C PROV-O models. Another work by Closa et al. [9] presents a provenance engine (PE) that captures and represents provenance information using a combination of the Web Processing Service (WPS) standard and the ISO 19115 geospatial lineage model. Di et al. [19] capture the provenance information in a standard lineage model defined in ISO 19115:2003 and ISO 19115-2:2009 standards (geographic metadata). Also, the authors extend both workflow language and service interface between provenance and geo-processing workflow by making it possible for the automatic capture of provenance information in the geospatial web service environment.
Sadiq et al. [39] present ontologies for land administration workflows in the spatial information life cycle to determine records and allow access to provenance information. Sun et al. [40] present an ontological framework for geospatial data integration and sharing called GeoDataOnt which is divided into three compound modules: essential ontology, morphology ontology, and provenance ontology. Yuan et al. [49] propose to publish geospatial data provenance into the Web of Data extending the Provenir ontology.
To the best of our knowledge, there are not any proposals to catalogue the quality of data in an end-to-end pipeline providing comparative results w.r.t. the different standards.
4.Unified data quality knowledge graph
This section describes the data quality dimension mapping-based method to create a unified data quality graph of a data production pipeline.
4.1.Key concepts
This approach is designed to enable data governance by building a comprehensive metadata model [28] of a data pipeline, its component datasets, data quality metric observations made on those datasets and relevant context. Tracking data quality issues through the pipeline, for example, root cause analysis, requires knowledge of the relationships between datasets, for example, which data is generated from which data, in the pipeline and a way to connect diverse quality observations about that data. Relationships can be captured in a data lineage model of the pipeline using the W3C PROV-O ontology which is then linked to the data quality metric observations.
Data quality metrics and observations exhibit diversity in terms of definitions, tool reporting formats or even availability for specific datasets as data is transformed through the pipeline (e.g. a blank node count makes no sense for a relational database representation of data). To span these differences in the metrics and observations available for a specific dataset and make them available for an end-to-end visualisation or analysis it is usual to group metrics by consumer-focused views of data quality called data quality dimensions [50], e.g. completeness. Thus all metrics may be mapped to one or more data quality dimensions in a data quality model like daQ or DQV. We follow the W3C Best Practices for Data on the Web [1] by representing all data quality metric observations as a data cube of metadata attached to a representation of the dataset itself. In this way it is possible to measure a data quality dimension, for example, completeness, of data as it gets transformed from dataset (distribution) to dataset (distribution) along a production pipeline, e.g. from relational to graph, despite different specific metrics being used to make the observations at different stages. It is a natural extension to this W3C model to make a data pipeline stage dataset both a DCAT Dataset and a PROV-OEntity to link the data lineage and quality models.
Unfortunately, the definitions of data quality dimensions are not universally agreed. There are four different international standards in use for specifying geospatial (linked) data quality dimensions (see Section 3) and different consumers and producers of the quality observations have different preferences for how their metric observations are classified. This means that a comprehensive data quality model must be able to map between these data quality representations in order to integrate them. This leads to the need to develop a set of standard mappings between the standards-based quality dimension families.
Fig. 3.
Key classes and individuals for unified data quality graph.
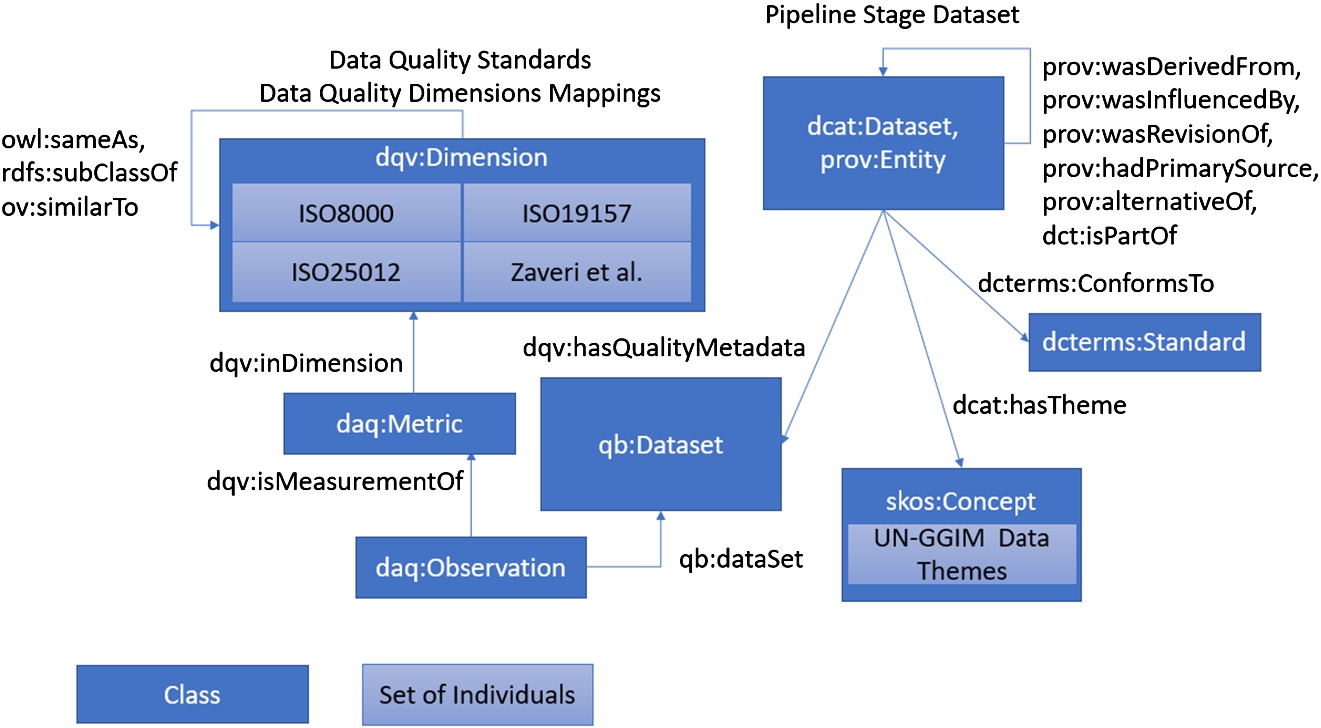
Fig. 4.
Technical architecture for a unified quality graph supporting end to end data quality views.
By bringing all these models together into a unified knowledge graph (Fig. 3) it is possible to query and analyse the data quality processes of the end-to-end data pipeline consisting of an arbitrary number of steps and with a large variety of tools or vendors. The central component of a data pipeline model is the pipeline stage dataset instance which is modelled as both a dcat:Dataset and a prov:Entity. These are connected to contextual information such as applicable standards, classification schemes called themes in geospatial data and quality metadata captured as a data cube of observations for each metric. Each quality metric is assigned to at least one data quality dimension and the relationships (mappings) between the dimensions in different quality models are explicitly modelled too.
Since standards compliance is a key quality indicator for geospatial datasets and there are a variety of possible standards it is helpful to define a set of standards-specific quality metrics for checking and reporting compliance. These are summarised below.
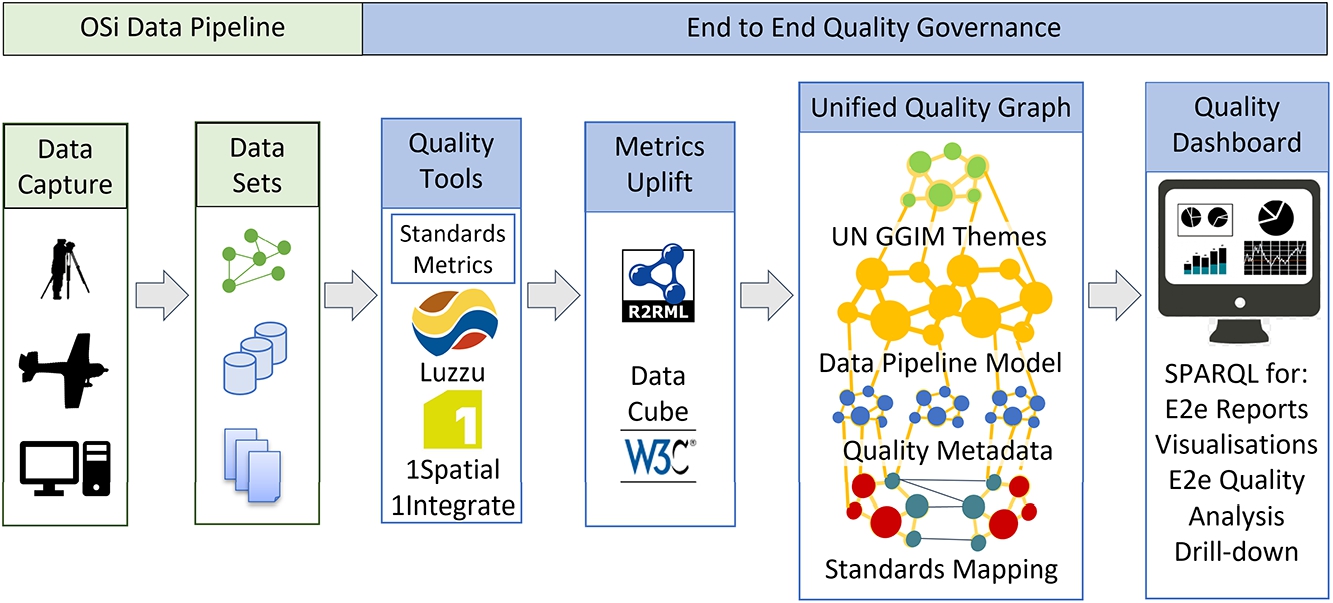
A layered technical architecture (Fig. 4) is defined to support end-to-end data quality for a data pipeline. The lowest layer represents the data pipeline itself. The first data quality governance layer (Data Quality Monitoring) enables dataset quality monitoring throughout the lifecycle of the data and as it moves from the data store to the data store along the pipeline. This monitoring is carried out by domain and dataset appropriate data quality tools. Regardless of the output format of a given tool, all metric observations must be converted into a conforming RDF model for integration into the unified quality knowledge graph. This requires both syntactic and semantic conversion (see below). This requires the creation of an uplift or data transformation workflow using R2RML. All observations are eventually stored in the W3C data cube model.
The second governance layer is where a unified quality graph is generated. The quality measurement results are integrated into the unified quality graph based on their point of collection (a specific dataset) in the data pipeline. This forms a linked quality and data lineage graph. The assigned metric dimensions enable comparison of data quality along the pipeline. The standard data quality dimension mappings ensure that data can be correctly interpreted, no matter what are the preferred dimensions standards for the producers or consumers. In some cases, additional metadata was also added to provide provenance data in this layer, for example, the name of the tool used to generate observations.
Finally, in the upper governance layer, the results are visualised in an end-to-end data quality dashboard for monitoring, analysis and generating reports based on Sparql queries of the unified quality graph. This integrates data that never had a common basis for representation before. The Linked Data design makes the system modular and distributed.
4.2.Data quality assessment uplift
Building a consistent unified data quality graph requires that all data quality assessments be in the form of metric observations that are assigned to at least one data quality dimension and represented as RDF using the daQ or DQV data quality vocabularies in a W3C data cube. For Linked Data quality tools this can be based on native RDF quality assessment reports produced by tools like Luzzu. Traditional data quality tools are unlikely to produce RDF reports but their reports can be uplifted, for example using R2RML or scripting. This syntactic conversion is often not sufficient. In practice, many rule-based data quality tools do not produce metric-based data quality reports following the five design requirements for effective data quality metrics by Heinrich et al. [23], for example, the use of bounded intervals for metrics. Instead, they produce a simple (unbounded) count of rule failures and a list of the dataset entities responsible for rule violations. Thus, we define here an approach to convert these less easily consumed quality assessment outputs into a unified data quality graph. There are two stages to the process: first creating an RDF-based metric definition using the daQ or DQV vocabularies [16] and secondly creating a time series of valid metric observations as a W3C data cube that references the RDF-based metric definition.
Stage 1: Metric Definition
Step (i) Creation of metric names. A set of rule results will be grouped into a metric so it is necessary to give the metric a name and to assign/generate an IRI for it. As with Linked Data best practices, it is useful to identify if a natural identifier e.g. a rule identifier already exists and to reuse that within a suitable IRI structure. A more complete description of the metric will include the label, definition and perhaps expected datatype id expressed in the daQ vocabulary.
Step (ii) Assigning metrics to data quality dimensions and categories. Each newly created metric must be assigned to a specific data quality dimension as defined by the desired data quality standard. This will often require consultation with domain experts and data consumers since the data quality dimensions are defined as user-oriented views of data quality. Expressing the dimension in an RDF model requires a set of appropriate identifiers for the data quality dimensions (see Section 4.3 for a set of ontologies).
Stage 2: Observation Uplift
Step (iii) Conversion of Unbounded outputs into bounded values supporting aggregation. The recommended [23] bounded range is 0–1 for metric observations. This can be achieved by converting a set of rule failures into a rate or a fraction of all the relevant dataset entity instances for the rule. More formally, the metric observation value
Step (iv) Adding provenance metadata. For each metric observation, it is possible to record metadata such as the identity of the software tools used to generate the observation or to specify the metric observation date and time. The time is required for the creation of a time series of observations in a W3C data cube. Depending on the rule logs being processed this information can be extracted from the file creation date metadata or is recorded within the log file itself.
Processing a suitable rule-based output log for each of the four steps above can be automated as part of the data quality monitoring system.
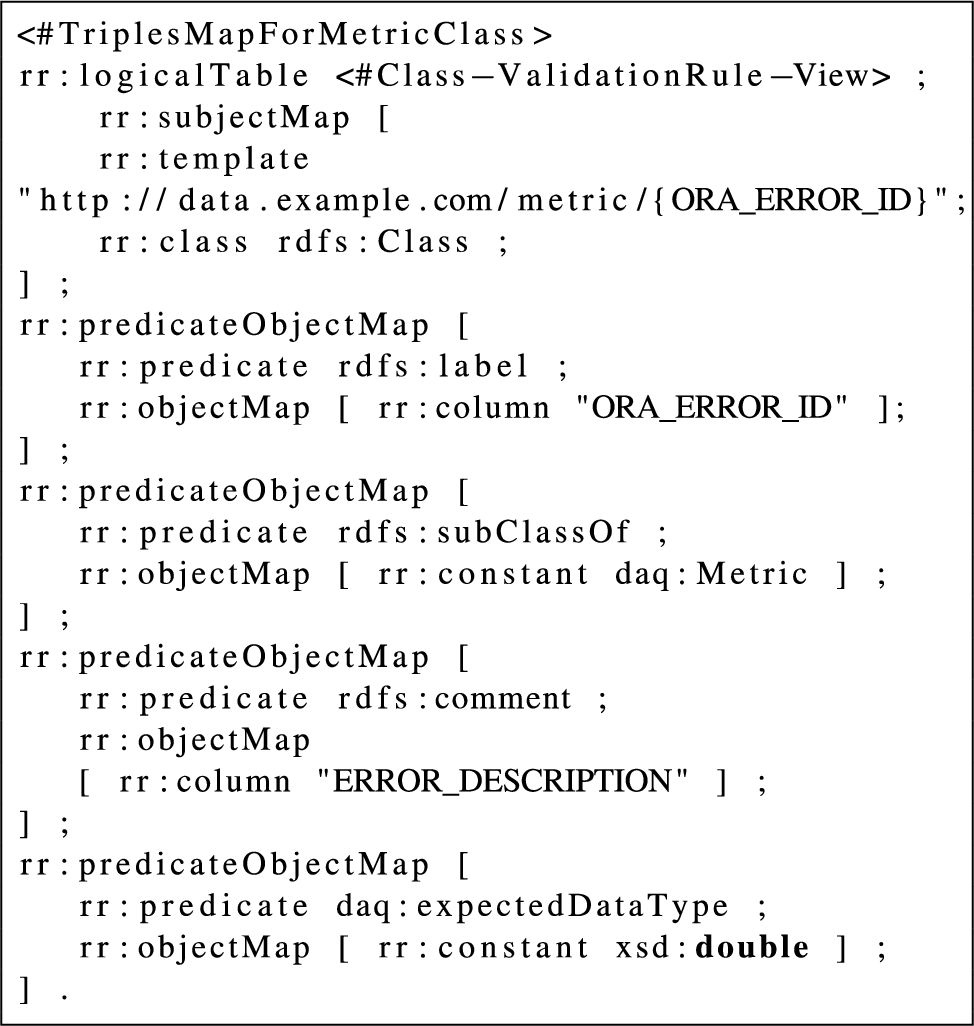
Listing 1.
Example metric definition R2RML mapping rules for 1Spatial quality rule logfile
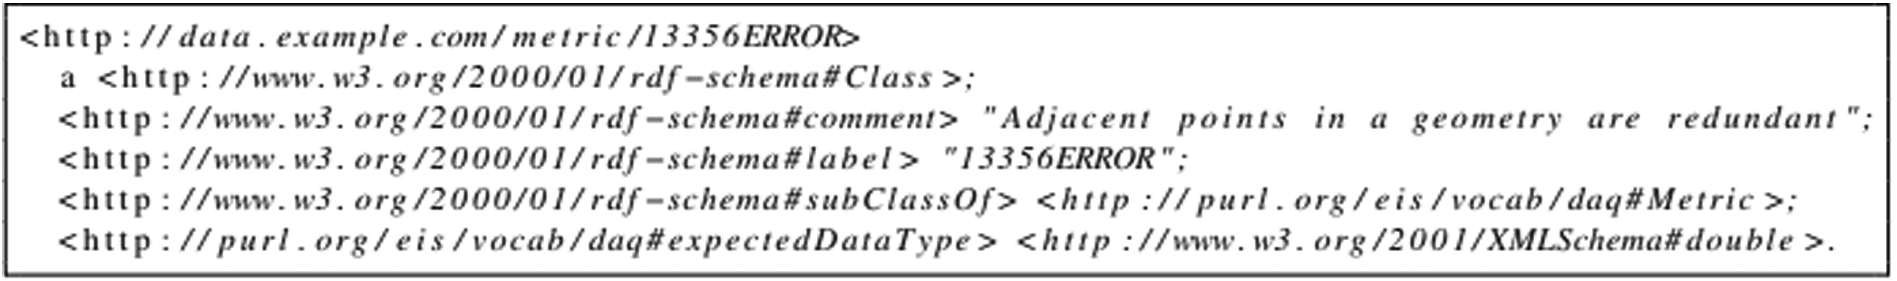
Listing 2.
Example metric definition triples produced by R2RML mapping
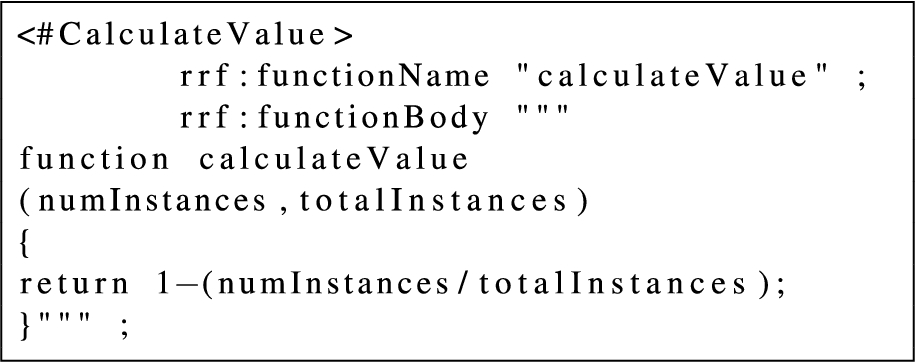
Listing 3.
R2RML-F for observation conversion into bounded value
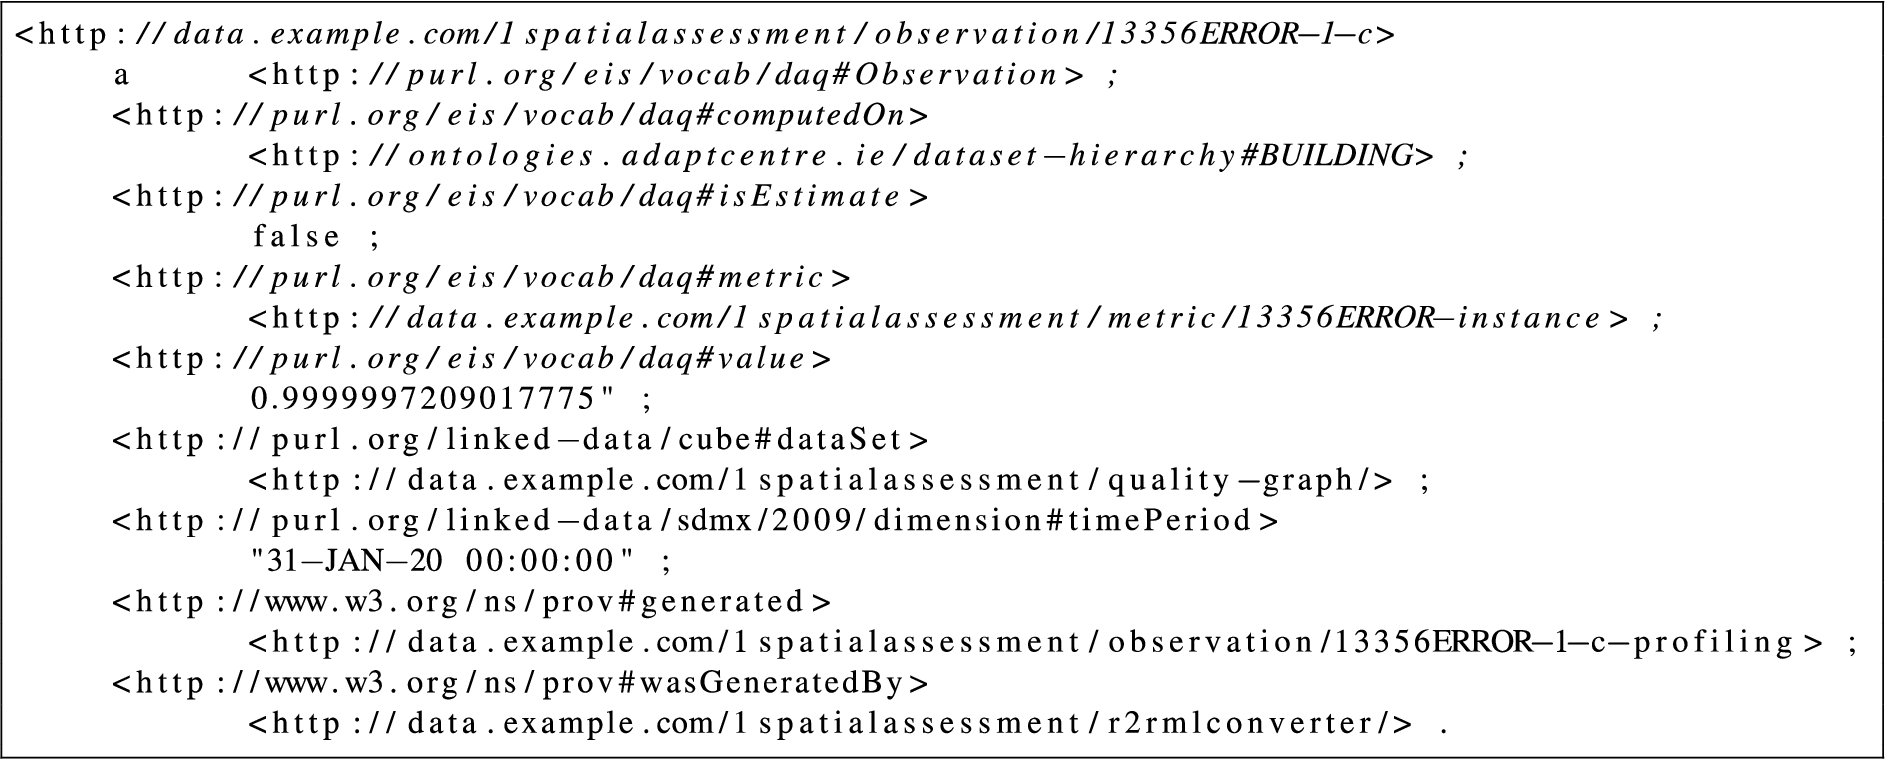
Listing 4.
Example observation data produced by uplift process
Uplift examples The OSi PRIME2 spatial data is periodically assessed using 186 quality rules by the commercial 1Spatial 1Integrate data assessment tool. This tool produces an output relational database for the quality rules log.
The log can be processed with a set of R2RML mapping rules (see Listing 1 for an example) to produce a set of metric definitions for the tests conducted by the tool. Thus 186 specific metrics based on the 1Spatial 1Integrate rules are generated in our case (see Listing 2 for an example). The 1Spatial 1Integrate tool did not define dimensions and categories, so these metrics were manually mapped in the R2RML declaration into 7 different quality dimensions and 2 categories based on the ISO 19157 standard which is OSi’s preferred standard for collecting geospatial data quality information. The quality observations are produced using the metric description extracted in the first stage. A cube of observations is produced for each PRIME2 sub-dataset defined by spatial entity types (buildings, foliage, ways, etc.) by extracting and calculating quality rule report instance values. In the 1Spatial 1Integrate log database, the results are given in terms of the number of failing instances and the number of total instances. These are used with a R2RML-F function to generate a bounded [0.0–1.0] value for all metrics (see Listing 3 for script and see Listing 4 for produced data).
In addition to external quality tools like 1Spatial 1Integrate, OSi uses Oracle’s Spatial & Graph platform to perform integrated spatial analytic validation checks. This includes support for OGC validation checks for spatial entities in the database. After running these functions on a dataset any validation errors generated can also be converted into new metrics as above.
This approach enables the previously siloed 1Spatial 1Integrate data assessment data and Oracle Spatial & Graph OGC data validation data to be integrated with the results of other quality assessment tools acting on other parts of the data production pipeline. In the past, their outputs were limited to being used for generating human readable reports targeted at specific stakeholders.
4.3.Alignment of standards-based data quality dimensions
As explained above, different geospatial data quality standards define diverse data quality dimensions with overlapping definitions. Specific communities of consumers of the unified data quality graph have different preferred standards and hence it is necessary to have a comprehensive method of converting between standard dimensions so that quality observations, no matter how recorded, can be converted to the desired output. Our approach is to formally model this background knowledge in the unified quality graph so it is available to applications.
This section describes the creation of a comprehensive set of 55 correspondences2 of all identified data quality dimensions by defining a set of semantic links between the data quality dimension concepts defined in each standard. This includes those defined by ISO/TC 211 (Geographic information/Geomatics) in the ISO 19157 standard, ISO/TC 184 (Automation systems and integration) in the ISO 8000 standard, ISO/IEC JTC 1/SC 7 (Software and systems engineering) in the ISO/IEC 25012 standard and the W3C Data on the Web Best Practices working group note on the data quality vocabulary. Our approach is an extension of the 21 correspondences identified in the W3C Best Practices specification between two sources of quality dimensions (ISO/IEC 25012 and Zaveri et al.) [1,41].
The steps followed to create these correspondences were: (i) identifying the quality standards relevant to geospatial Linked Data (ii) comparing the definitions of data quality dimensions employed in different standards to discover the similarities or the differences between them. (iii) consulting with geospatial data quality experts to validate a set of candidate mappings (iv) creating RDF models based on the daQ vocabulary for the data quality dimensions of the ISO 8000 and ISO 25012 quality standards which lacked official ontologies.2323 (v) creating the set of 55 RDF correspondences between the standards using OWL, RDFS and Open.vocab.org predicates and documenting them in an open repository2.
Step (i) is addressed in the related work section. This was in turn based on data quality generation and reporting use cases in OSi and common to any national mapping agency. A wider set of data quality standards have been addressed compared to earlier work. For example, ISO 19157 is an important geospatial data quality standard that has not to our knowledge been considered by the Semantic Web community before.
Step (ii) and (iii) The standards document definitions for data quality dimensions were assembled and examined. A set of candidate mappings were identified and discussed in OSi internal workshops. Reports were generated from the mappings and validated with end-users. This was a complex, iterative process. In many cases, the standards use the same or a similar term in subtly different ways, leading to more complex mappings. For example, the standards descriptions of the Completeness and Complete dimensions are given below:
Completeness (ISO 25012) | The degree to which subject data associated with an entity has values for all expected attributes and related entity instances in a specific context of use. |
Complete (ISO 8000) | Information is perceived to be mapped completely to entities in the domain of interest in a reliable 1:1 mapping. |
This example shows that two different types of system properties are described by the definitions even though superficially the term names seem to be referring to the same concept. Hence an exact match is not appropriate. In consultation with geospatial data quality experts, it was decided that for this specific example the requirement for a 1:1 mapping of entities in the Complete definition has a narrower definition than Completeness which allows for other mappings too. Thus, the rdfs:subClassOf logical relation was used between these data quality dimensions in our model.
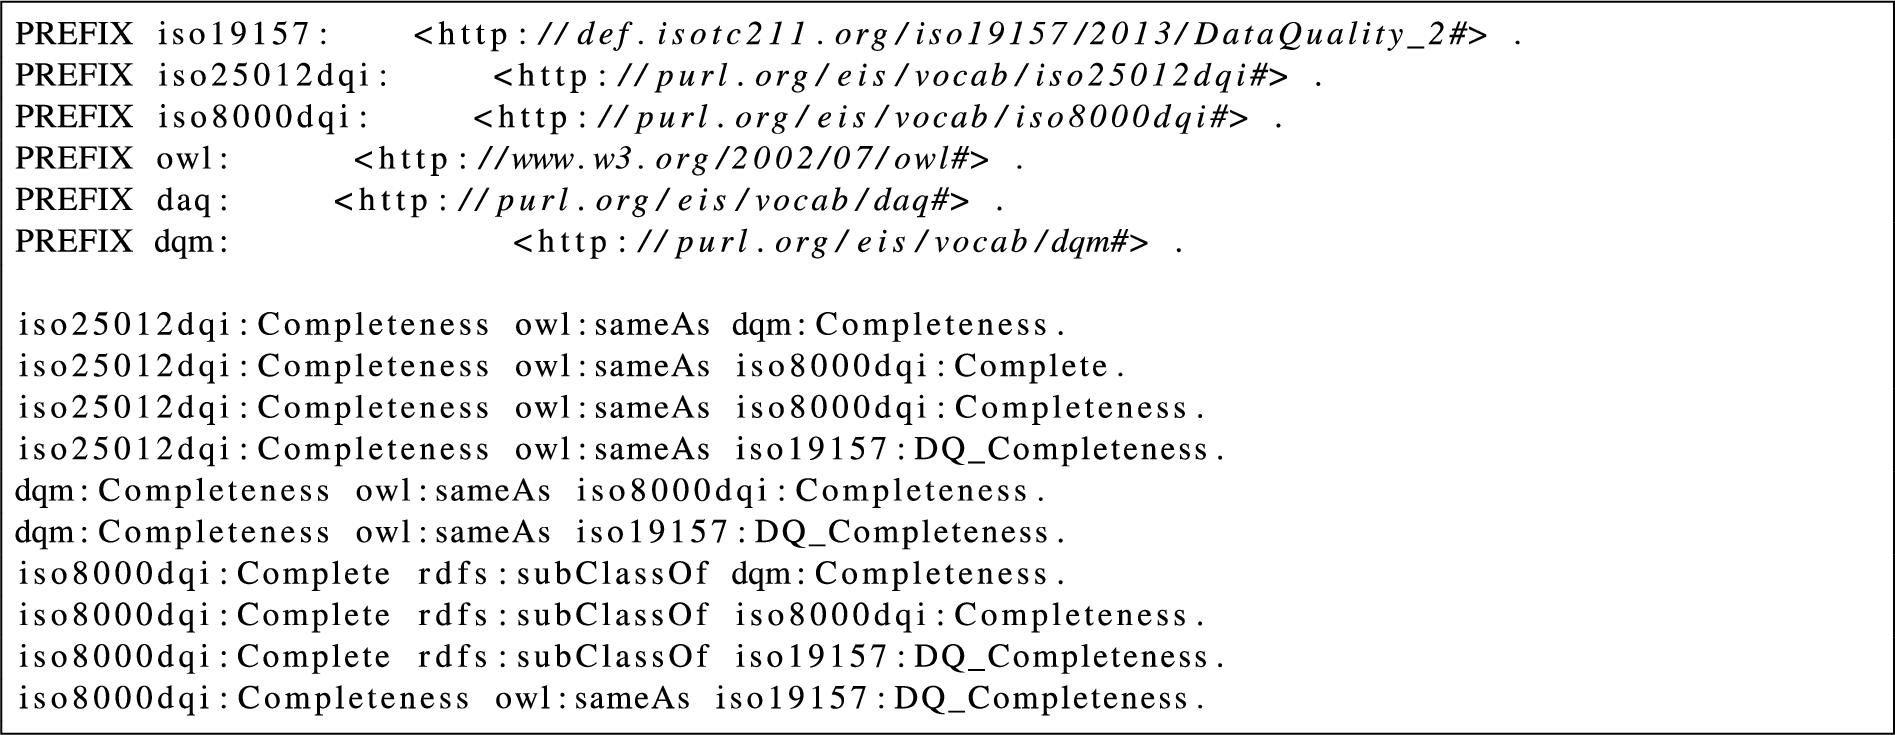
Three types of correspondence relations were used for the quality dimensions: the equality (concept unification) relationship owl:sameAs2424, the similarity relationship ov:similarTo2525 and the inclusion relationship rdfs:subClassOf2626 (broader/narrower concept) for complex correspondences. An example correspondence would be represented in a triple like: iso8000dqi:Complete rdfs:subClassOf dqm:Completeness. This model was sufficiently rich to enable aggregated metric observations to be calculated for data quality dimensions along a data pipeline despite different quality dimensions being used to record the observations at different points in the pipeline. A part of the mapping can be seen for the Completeness dimension in Listing 5.
Listing 5.
Correspondences between completeness data quality dimensions in standards
Step (iv) The daQ vocabulary was used to create a set of instances describing the ISO 8000 and ISO 25012 data quality dimensions as no official ISO ontologies exist for these standards2. This enabled the creation of the RDF-based correspondences model as these concepts could be used as subjects or objects of mappings. It also enables the use of these definitions and labels in user interfaces derived from the unified data quality knowledge graph. A mapping is defined from daQ to W3C DQV in the W3C data quality vocabulary specification.
Table 1
Semantic mapping of standard data quality dimensions
| Standard Defining the Data Quality Dimension | ||||||
| ISO 25012 | ISO 19157 | ISO 8000 | W3C Linked Data1 | Mapping Property | ||
| Semantic | Syntactic | Pragmatic | ||||
| Completeness | Completeness | Completeness | – | – | Completeness | owl:sameAs |
| Completeness | – | – | – | Complete | – | rdfs:subClassOf |
| Consistency | – | Consistency | – | – | Consistency | owl:sameAs |
| Consistency | Logical consistency | – | Entity integrity | – | – | rdfs:subClassOf |
| Accuracy | – | Accuracy | – | – | – | owl:sameAs |
| Accuracy | Positional accuracy | – | – | – | Semantic | rdfs:subClassOf |
| Thematic accuracy | Accuracy | |||||
| Currentness | – | – | – | Timeliness | owl:sameAs | |
| Currentness | Temporal quality | – | – | – | rdfs:subClassOf | |
| Compliance | – | Compliance | – | – | – | owl:sameAs |
| Compliance | – | – | Domain integrity | – | Representational | rdfs:subClassOf |
| Referential int. | Conciseness | |||||
| User defined int. | ||||||
| Confidentiality | – | – | – | – | Security | rdfs:subClassOf |
| – | – | Secure | Security | owl:sameAs | ||
| Traceability | – | – | – | – | Provenance | rdfs:subClassOf |
| Traceability | – | – | – | – | Trustworthiness | ov:similarTo |
| Credibility | – | – | – | – | Trustworthiness | rdfs:subClassOf |
| Efficiency | – | – | – | – | Performance | owl:sameAs |
| Understandability | – | – | – | – | Understandability | owl:sameAs |
| Understandability | – | Versatility | ov:similarTo | |||
| Availability | – | – | – | – | Availability | owl:sameAs |
| Accessible | – | – | – | Accessibility | owl:sameAs | |
| Accessible | – | – | – | – | Interlinking | ov:similarTo |
| Accessible | – | – | – | – | Licensing | ov:similarTo |
| Portability | – | – | – | – | Interoperability | ov:similarTo |
| – | Usability element | – | – | Useful | – | ov:similarTo |
1The set of dimensions defined by Zaveri et al. and referenced in Data on the Web Best Practices: Data Quality Vocabulary, Appendix C.
Step (v). Table 1 presents the comprehensive set of mappings we developed between data quality dimensions defined in the four relevant standards identified. In each row the bold dimension is the subject of an RDF triple specifying the correspondence, the triple predicate is defined in the mapping column, and the object is defined in the non-bold column(s). The ISO 25012 standard was employed as the main object of mapping due to having the best overall coverage of the quality dimensions, thus the other standards were mainly mapped to this standard. Note that 6 dimensions are omitted from the table as they are disjoint with all other definitions and have no correspondences. These are: Flexible content and Flexible layout from ISO 8000, Recoverability and Precision from ISO 25012, and Relevancy and Interpretability from Data on the Web Best Practices/Zaveri et al. For the full set of correspondence triples please see the git repository.
4.4.Data pipeline governance metadata model
In order to govern the data quality in an end-to-end fashion it is necessary to have (i) a consistent set of data quality metric observation time series collected along the pipeline (as discussed in the previous sub-sections); (ii) a model showing the topology of the data pipeline itself i.e. the set of relationships between those time series (a data lineage model), and (iii) additional context useful for analysis or reporting. If the data pipeline was a physical system this combined model would be known as a digital twin, since the data pipeline contains many native digital elements it is collectively known as the metadata (model) supporting data governance.
In order to structure our conceptual model for the governance metadata, it was created based on Khatri and Brown’s set of data governance decision domains i.e. data principles, data quality, data lifecycle, data access and metadata [28]. Figure 5 demonstrates that the Semantic Web community has provided standard models (ontologies or vocabularies) for many of the model components required.
Fig. 5.
Semantic web vocabularies aligned with Khatri and Brown’s data governance decision domains [28].
![Semantic web vocabularies aligned with Khatri and Brown’s data governance decision domains [28].](https://content.iospress.com:443/media/sw/2024/15-2/sw-15-2-sw233293/sw-15-sw233293-g010.jpg)
The core of the pipeline model is the set of DCAT representations of the datasets at each stage in the pipeline. Each dataset in the depiction may have multiple distributions and is typically generated from earlier stages of the pipeline but has its own scope, purpose and organisational focus. Each dataset definition is an organising element within the metadata model that can be used to link to additional metadata: quality observations, provenance (lineage), and context like standardised data classifications (themes). Within OSi, extensive use is made of the definition of sub-datasets (using the dct:isPartOf property). This allows for a richer understanding of the provenance of different components of the dataset, storage of more fine-grained quality metric observations and more fine-grained reporting. The usual basis for this subdivision in OSi is in terms of spatial entity types (buildings, ways, boundaries and so on) that are often the basis of division of labour or reporting for OSi. The set of all dataset descriptions forms a machine readable data catalogue that enables dataset interoperability within the organisation itself and potentially externally.
A data lineage model was needed to define the relationships between the datasets and provide a basis for end-to-end data quality monitoring. The W3C PROV-O was used to provide a vocabulary for these relationships and all data pipeline datasets are also W3C PROV-O Entities (prov:Entity). Thus the governance metadata captures the high-level structure of the origin of data (at a dataset of origin level2727) and the evolution of data over time, as well as, describing the datasets and their relationships in the end-to-end data quality pipeline. The links between the datasets allow applications to show end-to-end quality and to help trace quality errors back to their root cause.
Additional metadata describing summary geospatial information on datasets is already supported by both DCAT and the geoDCAT-AP2828 profile. This type of metadata is useful for context and to have a high level summary of the geospatial information covered by the datasets, for example, to record the spatial coverage of a dataset. Additional context is given by allocating datasets to themes (classifications). The UN-GGIM data themes are a special set of standard themes particularly important for OSi data governance. OSi’s quality reporting must be aligned with a set of priority national data themes, which are aligned to the globally endorsed UN-GGIM data themes. Including this metadata for a dataset allows OSi to analyse and query the observation data according to the main geospatial themes and the stakeholders to visualise it according to their requirements. The UN-GGIM data themes vocabulary is created using the Simple Knowledge Organization System (SKOS) [32]. The details of the vocabulary are described in our previous paper [48].
Fig. 6.
Data lineage illustrated in the OSi pipeline data governance metadata.
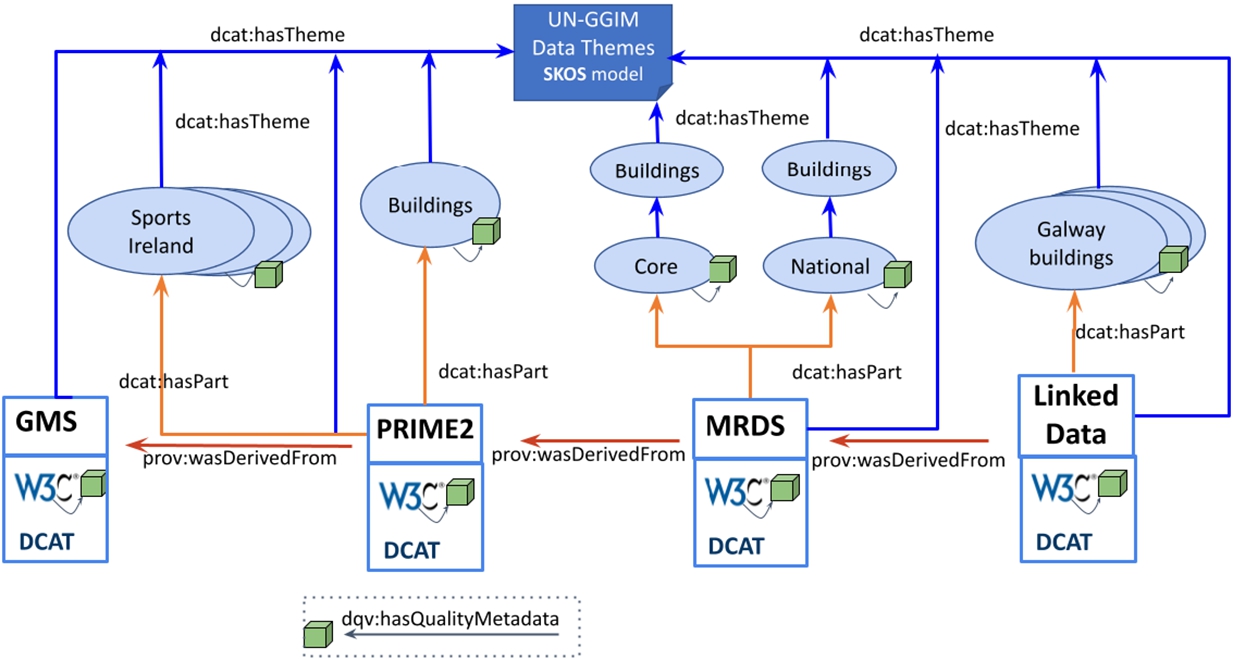
4.5.Data lineage model
An OSi business data lineage view of the OSi data pipeline model focused on the Buildings theme (Fig. 6). The structure describes the datasets at each stage of the OSi data pipeline (GMS [Sensor Data], PRIME2, MRDS, and Linked Data) and illustrates the use of subdatasets (Buildings, Core, etc.). The metadata information is described based on the W3C standards DCAT, PROV-O, DQV and UN-GGIM data themes. The DCAT properties dcat:hasTheme defines the data theme(s), from the list provided in the UN-GGIM, for each dataset and subdataset (Fig. 6 purple arrows), respectively. The prov:wasDerivedFrom property from the PROV-O ontology defines a dataset or subdataset as the result of a derivation or transformation from a pre-existing source dataset or subdataset (Fig. 6 orange arrow).
Listing 6.
Data catalog entry for the data pipeline governance metadata
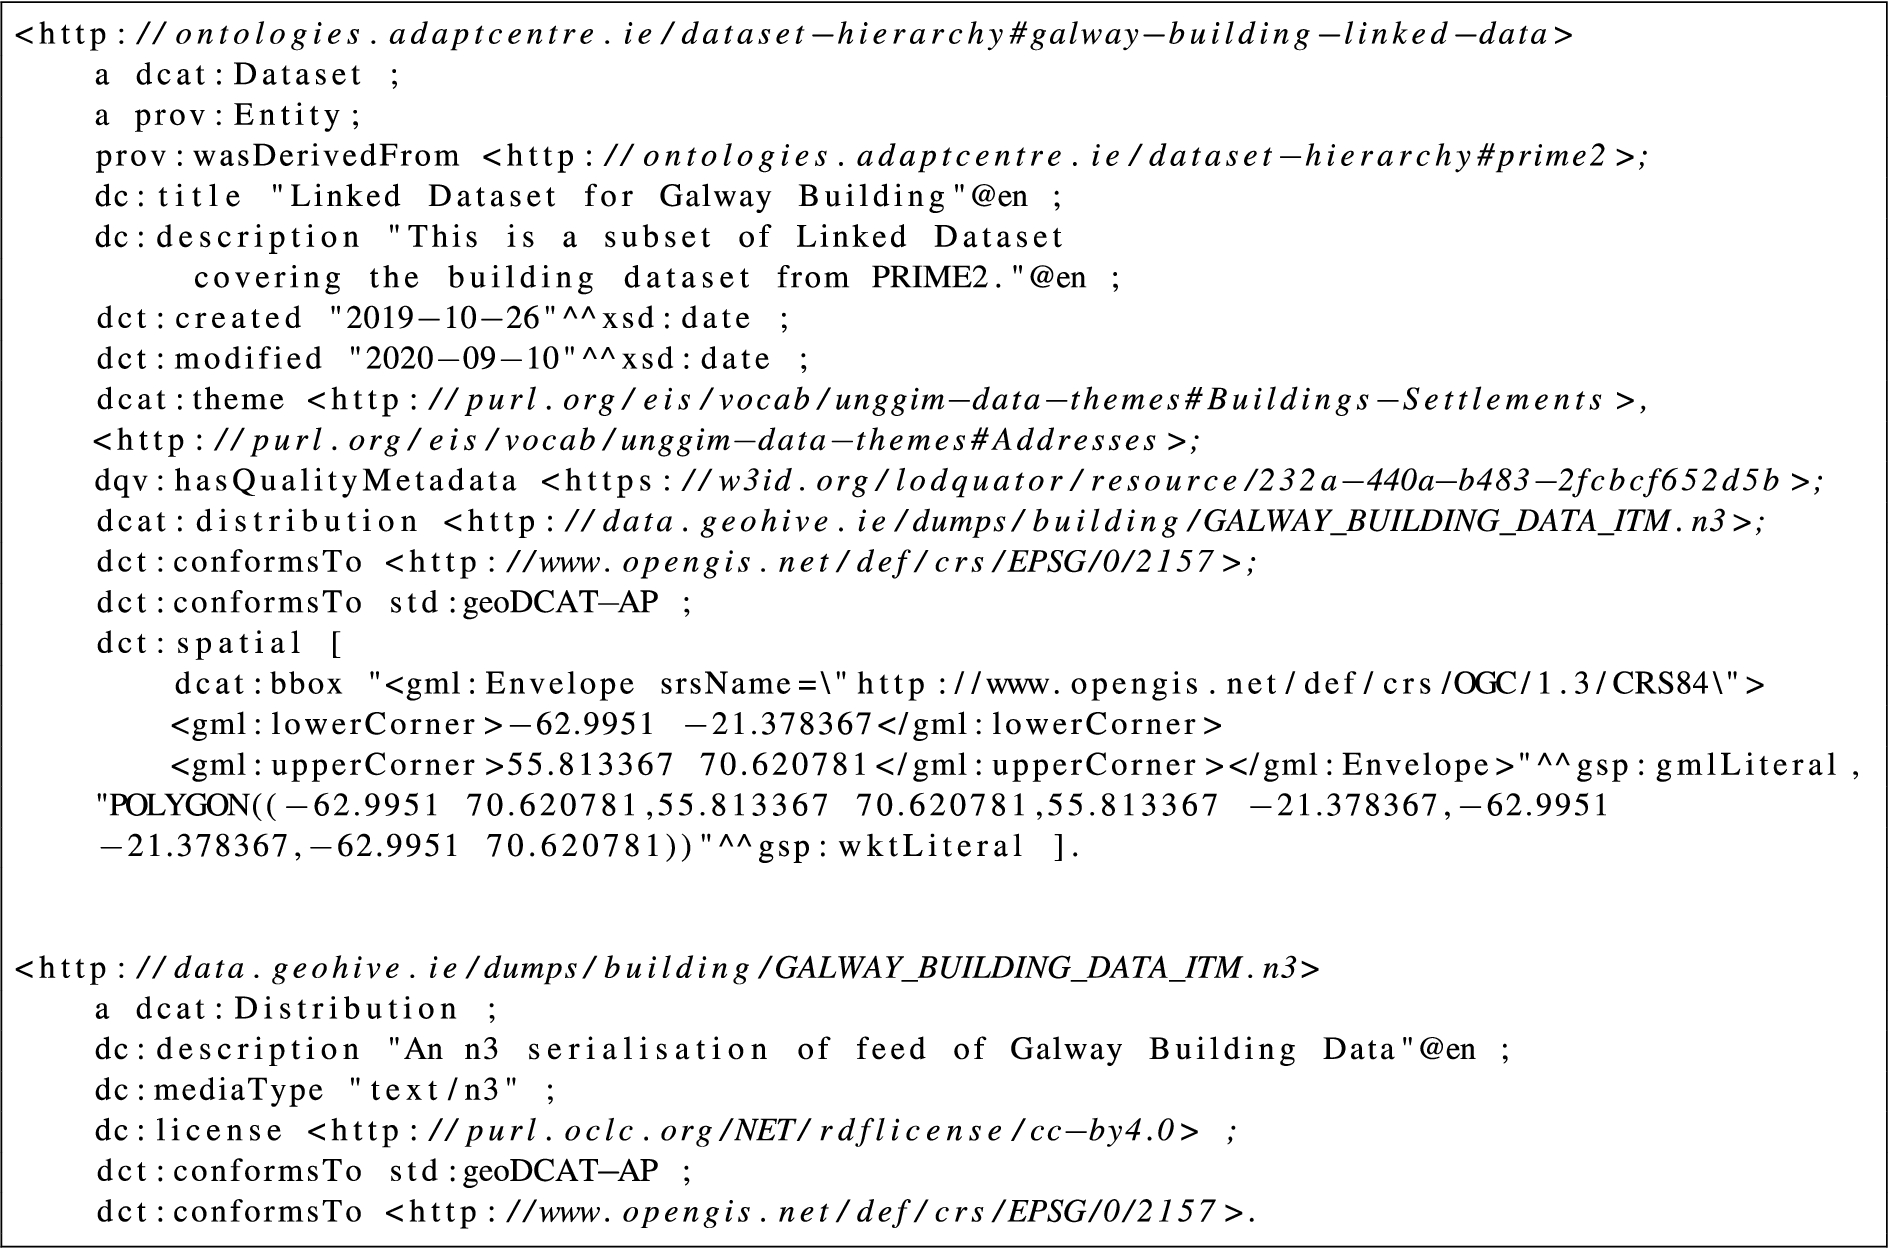
Listing 6 presents an entry in the data catalogue created to manage the metadata describing the OSi Data Production Pipeline. This snippet shows the quality data (dqv:hasQualityMetadata), standardisation data (dct:conformsTo), provenance data (prov:wasDerivedFrom, dct:created, dct:modified), data themes (dcat:theme) and spatial aspect (dct:spatial) of the data in one place using DCAT [10]. Providing a human readable and easily searched data catalogue makes maintenance of the Data Pipeline Governance Metadata Model easier, especially for non-technical users. It also provides a more effective alternative than human-oriented data catalogue efforts in the organisation and helps add value to the data governance solution since this aspect is not limited to data quality applications. In practice, similar metadata is created for a range of dataset granularities and hierarchical layers of the data production pipeline to support analysis of the query results at these levels. The visualisation of query results performed on this piece of data is presented in Section 4.7.
4.6.Geospatial standards conformance quality metrics
Given the central role of standards for geospatial data quality, the table given in this section summarises a set of geospatial data quality metrics that can be used to assess a dataset in terms of standards conformance. The assessments include conformance to required or recommended metadata, spatial reference systems and geometry classes. In order to create these metrics, a list of requirements was determined with the help and feedback from the OSi data quality team. More details are described in our previous papers [46,47]. We summarise the metric description and formulae in Table 2. These metric computations are each computed as a rate over the whole dataset as follows:
Table 2
New geospatial standards conformance quality metrics
| ID | Metric Name | Dimension | Formula |
| CS-M1 | Geometry Extension Property Check | Completeness | |
| CS-M2 | Geometry Extension Object Consistency Check | Completeness | |
| CS-M3 | Geometry Classes and Properties Check | Completeness | |
| CS-M4 | Geometry Classes and Properties Check | Completeness | |
| CS-M5 | Spatial Dimensions Existence Check | Completeness | |
| I-M6 | Links to Spatial Things (internal&external) | Interlinking | |
| I-M7 | Links to Spatial Things from popular repositories | Interlinking | |
| CY-M8 | Polygon and Multipolygon Check | Consistency | |
| T-M9 | Freshness Check | Timeliness |
4.7.End to end quality dashboard
A generic data quality dashboard was implemented as a javascript web app to consume the data pipeline governance metadata using SPARQL and to create and store additional analysis metadata in the triplestore. The dashboard consisted of four main views:
Data pipeline visualisation By loading the data lineage model of a data pipeline and aggregating quality metadata for the node this page displays a depiction of the apex datasets (sub-datasets are not shown) being monitored with a traffic-light style overview of aggregated data quality in each pipeline node. The traffic light colours (red, amber, green) displayed are based on user-supplied threshold rules for each node. The details of quality observation data can be viewed by clicking on the node (see next). The pipeline page serves as the dashboard’s home screen where configuration details can also be set.
Node-based quality view This page displays a more detailed node or dataset-centric view of dataset quality. A time series of quality metric observations aggregated into quality dimension evaluations is visualised as a bar chart depicting past assessment results compared to user-configured quality thresholds. Drill down into the dimensions is supported by a new screen that displays the dimension’s aggregated quality observation as well as a list of the metrics that have been used to calculate it. Each metric displays a quality assessment result, a success threshold, and a definition of the metric from the unified quality graph.
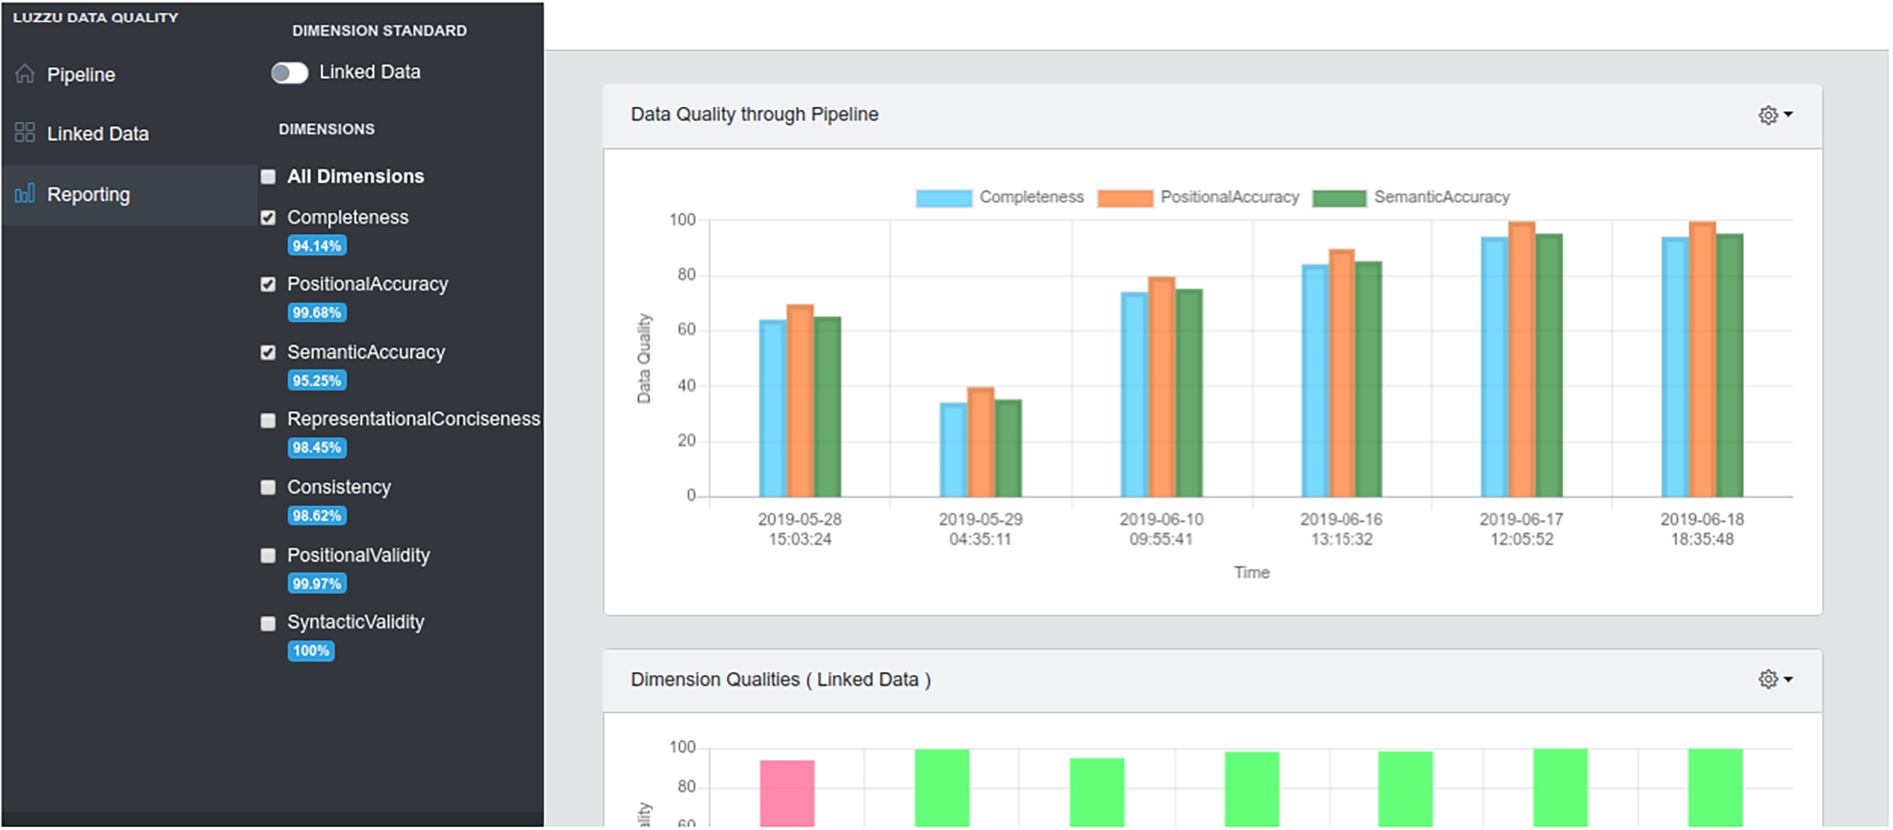
End to end data quality analysis This page visualises the data quality of an end-to-end data pipeline over time, as well as the dynamic conversion of the view into unified quality dimensions along the pipeline: both ISO 19157 and W3C Linked Data quality dimensions are currently supported. A time series view enables a user to see how these quality dimensions have changed over time. The data quality analysis page in Fig. 7 is divided into three parts: a bar chart depicting the aggregated data quality over time of the pipeline nodes, a second bar chart depicting user-selected quality dimensions of the pipeline nodes, and a navigation bar on the left with a toggle for changing the quality standards view and checkboxes for selecting specific quality dimensions. This enables a user to explore the end-to-end behaviour of either individuals or groups of quality dimensions.
Fig. 7.
End to end Dashboard for Data Quality Analysis. Showing data lineage information over time according to the W3C Linked Data Quality Model. An ISO 19157 view of data quality can be displayed by changing the “dimension Standard” toggle switch.
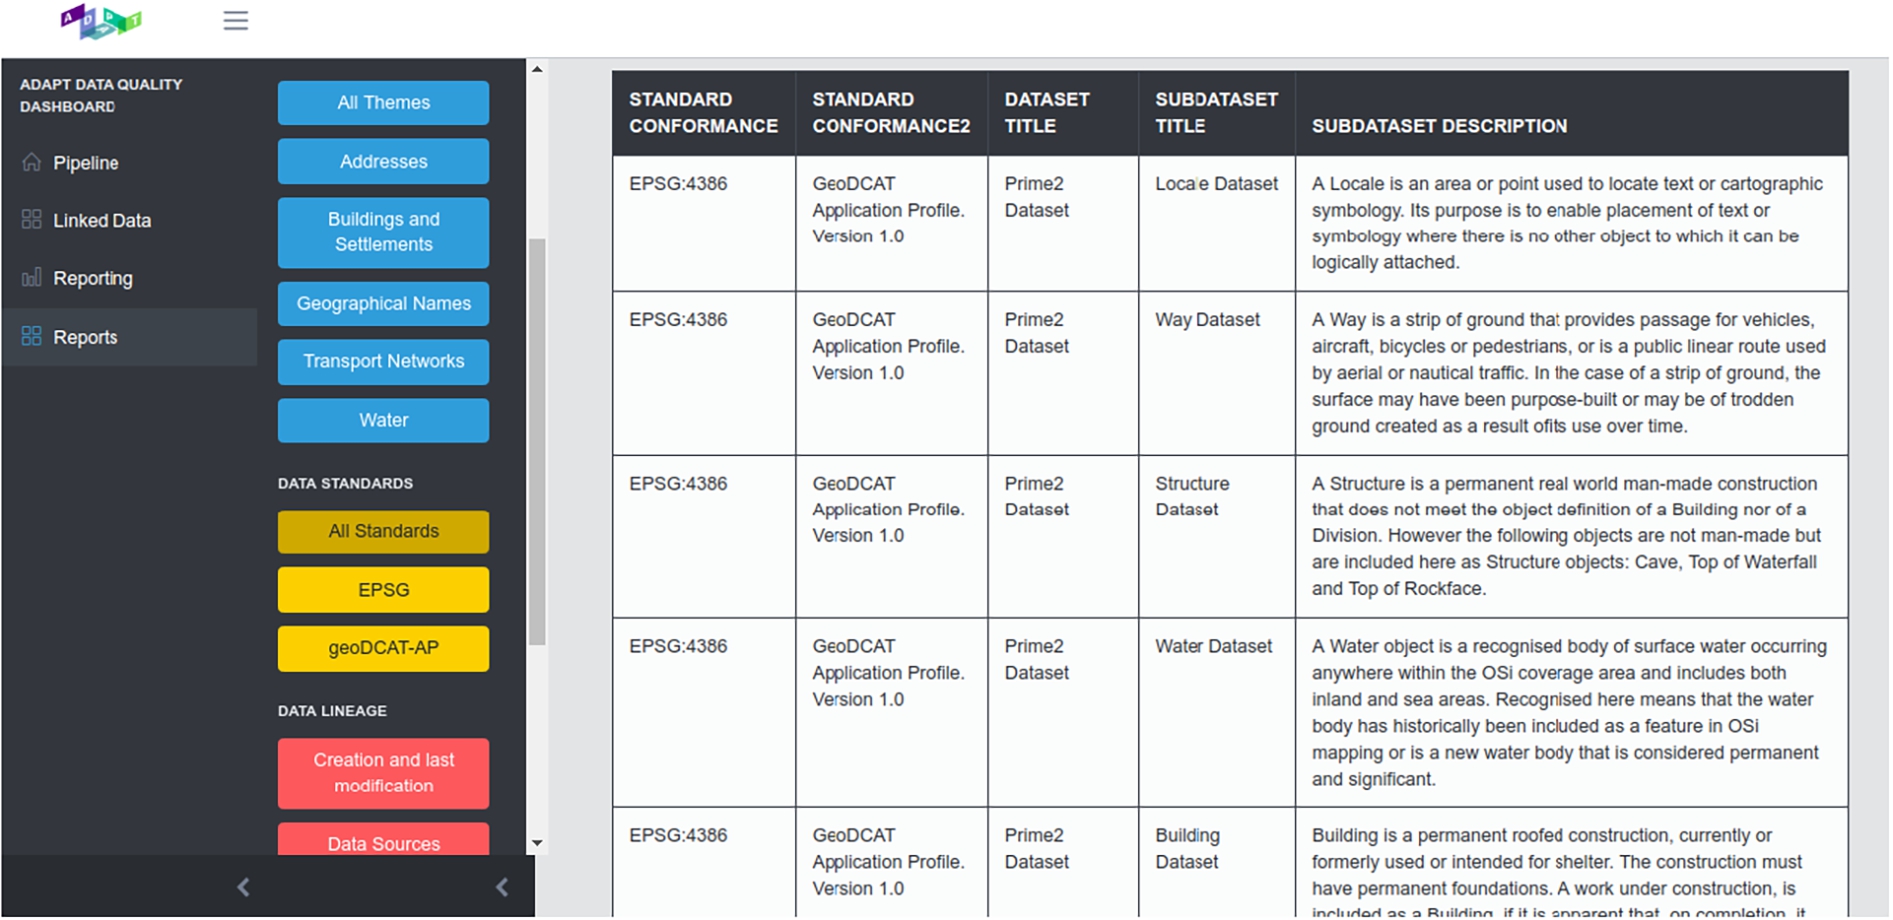
Report generation A key function of data quality governance is to ensure efficient and accurate communication about data quality issues and progress throughout the organisation. By consulting with stakeholders a set of quality reports was identified. The report generation page (see Fig. 8) supports dynamic visual SPARQL query building and output into a tabular format which can be downloaded and plotted as desired. Dataset and sub-dataset selection is an important feature as most quality reporting is based on specific organisational functions which map onto data themes (classifications) or spatial entity types. The report page has extensive interactive filters on the left side of the page that enables the user to navigate the data lineage model. The datasets or sub-datasets currently selected are displayed on the right of the dashboard panel based on the left-hand filter selections. Querying the data catalogue included in the unified data quality model underlies this functionality. Once datasets are selected, a tabular report is generated of end-to-end dataset status and where data quality issues occur in the process. Blue filters show data quality dimensions, yellow filters report on data standards compliance and red filters select based on data lineage or theme classification.
Fig. 8.
End-to-End Dashboard Reporting.
5.Evaluation
This section describes data governance maturity assessment in Section 5.1 followed by the usability evaluation of the defined metrics in Section 5.2 and design evaluation of uplifted and new metrics in Section 5.3.
5.1.Data governance maturity assessment
Prior to starting the work described here a baseline study of the DAMA DMBoK [11] data management capability areas (Data Governance, Data Architecture, Data Modelling and Design, Data Storage and Operations, Data Security, Data Integration and Interoperability, Document and Content Management, Reference and Master Data, Data Warehousing and BI, Metadata, and Data Quality) was conducted in OSi via a series of workshops and a Data Management Maturity Assessment survey for OSi staff (37 questionnaires returned). Reporting was based on the 5-level DAMA maturity assessment scoring scale. Data quality, as a core OSi activity, scored well in this process at mid-way between level 2 (defined) and level 3 (repeatable). However, the workshops focused on setting future target levels and identified data quality as a medium term (3-year) target for very significant improvement to maturity level 5 (optimised) within the organisation. Under the DAMA maturity model, this required the creation of scalable processes and tools for data quality, a reduction in manual processes, more predictable data quality outcomes and support for Centralised planning and governance. The key requirements to achieve this level under the DAMA maturity model are:
– Scalable processes and tools for data quality (Level 3)
– Reduction in manual processes (Level 3)
– More predictable data quality outcomes (Level 3)
– Centralised planning and governance (Level 4/5)
– Data management performance metrics (Level 4/5)
– Measurable improvements in data quality (Level 4/5)
Table 3
ISO 33020 Processes Maturity Assessment of OSi Linked Data Ops (LDops) vs OSi Baseline Data Quality processes (N = not achieved, P = partially achieved, L = largely achieved, F = fully achieved). A score of at least L is required to achieve a capability level. Highest score is bold
| Maturity Requirement | System | Assessed ISO 33020 Process Capability Level | |||||
| Incomplete | Performed | Managed | Defined | Predictable | Innovating | ||
| Scalable data quality proc. | LDops | F | F | F | F | F | P |
| Baseline | F | P | F | P | P | N | |
| Reduced manual processes | LDops | F | F | F | F | F | P |
| Baseline | F | P | N | N | N | N | |
| More predictable quality | LDops | F | F | F | F | F | P |
| Baseline | F | L | P | N | N | N | |
| Centralised governance | LDops | L | L | L | L | L | P |
| Baseline | F | P | N | N | N | N | |
| Data management perf. metrics | LDops | F | F | F | F | L | P |
| Baseline | F | L | L | L | P | N | |
| Meas. quality improvements | LDops | F | F | F | L | L | P |
| Baseline | F | F | L | P | P | P | |
The technical goals set to achieve these process improvements were as follows:
– Creation of data catalogues for OSi data products
– Creation of an enterprise data flow model
– Define data quality dimensions and relevant standards
– Measure and monitor quality throughout the pipeline
– Integrate the results of existing quality tools
– Create a unified data quality portal
The contrasting features of the Linked Data Ops approach that made such a difference in the assessment were the semantic integration of data catalogues, data lineage and data quality assessment results into a single unified graph. This contrasted with the baseline approach of (i) non-machine readable data catalogues based on Confluence wiki pages, (ii) proprietary enterprise data flow diagrams formats suitable for siloed consumption rather than deployment in a toolchain, and (iii) tool-specific data quality assessment repositories associated with particular parts of the data pipeline. In addition, the definition of unified quality models and diverse report-oriented classification metadata in our model allowed for a wide range of reports to be generated from a common knowledge graph. This increased visibility to stakeholders.
5.2.Usability evaluation of dashboard
The end to end quality dashboard (see Section 4.7) was the main way for most internal stakeholders to interact with the unified data quality graph and this introduced many new concepts and features for OSi staff. Despite being developed iteratively with feedback from the OSi data quality team, it was important to evaluate the system with all stakeholders. Ethical approval for the workshop data collection and questionnaire was sought and has been approved by the Dublin City University (DCU) Research Ethics Committee (reference: DCUREC/2021/098).
In March 2021, a demo and usability workshop was organised with 24 attendees including representatives from all the potential users from the Geospatial Services division of OSi: the cartography team, (data) products team, business and marketing team. The workshop included demos and open discussions of the dashboard features and potential impact. Key comments are listed in Table 4. Several new features were requested including map-based visualisations of quality reports and map-based selection of geospatial entities for the focus of a quality report.
Table 4
Usability workshop stakeholder comments
| Being able to visualise reporting on a map basis by annual quarter is a desirable feature |
| Traditionally OSi data has been used for mapping, need to know when it is conformant to different standards for decision making applications |
| There is an opportunity for this work to feed into the customer action plan |
| Good to have clickable links on the causes of quality failures |
| Most current business plans depend on effective communication of quality and this tool helps with that |
| Quality processes and reporting are integral to the national mapping agreement and it is great to see it so well done. |
| We are keen to integrate our department’s CSV-based quality reporting |
Table 5
Additional usability questions. All answers were on a 5-point Likert scale from strongly agree to strongly disagree
| 11. The dashboard shows data quality in a more understandable way than the 1Spatial data quality results. |
| 12. It would be easier to generate data quality reports using the Dashboard than my current method (if any). |
| 13. It would be easier to track changes to data using the Dashboard. |
| 14. My organisation would benefit from using the Dashboard. |
| 15. Using Dashboard reports would increase the standards conformance of OSi data in the future. |
Fig. 9.
Mean SUS scores for each usability question.
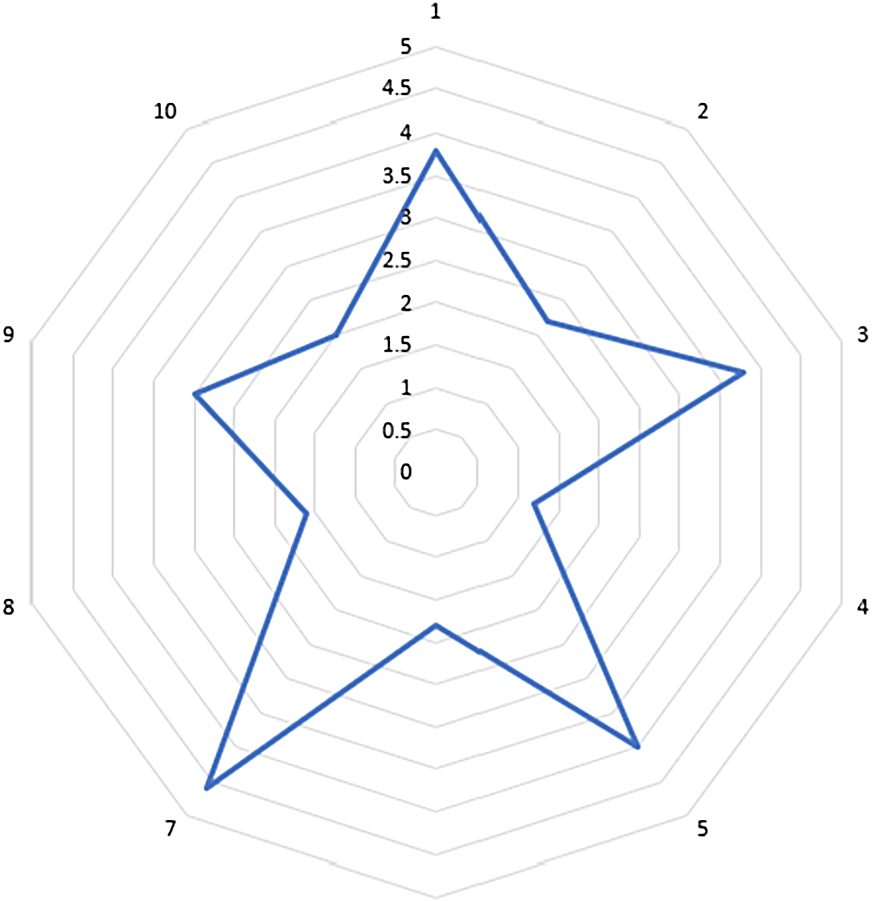
As part of the workshop an online questionnaire form was created to measure the System Usability Scale (SUS) [4] score for the End-to-end Data Quality Dashboard. This questionnaire was carried out after users gained some experience with the OSi end-to-end data quality dashboard and they were asked to fill in the ten standard questions of the SUS questionnaire and a set of additional feature-oriented questions which are listed in Table 5. The SUS questionnaire mean values are illustrated in Fig. 9. The overall SUS score achieved was 76 which places the Dashboard as B-grade usability under the SUS scale. This is a good result since most of the users had never seen the Dashboard before and it introduced new concepts. In terms of the feature-oriented questions (Table 5): 80% of respondents agreed the dashboard reports would increase the standards conformance of OSi data, 60% of respondents agreed the Dashboard was more understandable than the 1Spatial results, that it would be easier to generate reports using the dashboard and their organisation would benefit from using it. Only 20% of respondents agreed it would be easier to track changes to data using the dashboard. These results are promising and especially given the project focus on providing new standards conformance reporting metrics were seen to have an impact.
Table 6
Heinrich et al. Metric requirement testing results (Y = complies, P = partial, N = does not comply)
| Metric Requirement | CS-M1 | CS-M2 | CS-M3 | CS-M4 | CS-M5 | I-M6 | I-M7 | CY-M8 | T-M9 | 1Spt | Uplift |
| Min. & max. values (MR1) | Y | Y | Y | Y | Y | Y | Y | Y | Y | N | Y |
| Interval-scale (MR2) | Y | Y | Y | Y | Y | Y | Y | Y | Y | N | Y |
| Scientific criteria (MR3) | Y | Y | Y | Y | Y | Y | Y | Y | P | Y | Y |
| Sound aggregation (MR4) | Y | Y | Y | Y | Y | Y | Y | Y | Y | N | Y |
| Economic efficiency (MR5) | Y | Y | Y | Y | Y | Y | Y | Y | P | Y | Y |
5.3.Design evaluation of uplifted and new metrics
Heinrich et al. [23] have defined a set of five design requirements for effective data quality metrics for both decision making under uncertainty and economically oriented data quality management. This section evaluates the original 1Spatial 1Integrate quality rules output (1Spt column), our uplifted 1Spatial Metrics (Uplift column) and our new geospatial standards compliance metrics against these five requirements (summarised in Table 6). The requirements of Heinrich et al. and our analysis of compliance are summarised as:
Existence of minimum and maximum metric values (MR1) Data quality metrics should take values only within a specified range. The minimum values should represent the poorest data quality and the maximum representing the highest data quality. Each value within the range should represent different data quality levels. Assessment: With the exception of the original 1Spatial 1 Integrate output (1Spt column), all our metrics are defined over the bounded interval [0–1] representing gradually increasing quality levels and thus fulfilling this requirement.
Interval-scaled metric values (MR2) The data quality metric must represent the computation results as interval-scaled or ratio-scaled values. This avoids metrics with arbitrary scales such as poor, good, or best. Assessment: Metric values (except for T-M9 and 1Spt) are interval scaled, the impact of a data quality improvement measure can thus be assessed precisely.
Quality of the configuration parameters and the determination of the metric values (MR3) The scientific quality criteria (i.e., objectivity, reliability, and validity) must be satisfied by any metric configuration parameters. Assessment: The provided metrics have formal, mathematical formulae for calculating the scores that allow for an objective and reliable determination based on defined data quality dimensions (completeness, consistency, interlinking). All metrics fulfil this except for: T-M9 as it is not possible to determine a single fixed value for the configuration parameter “shelf life” of the metric.
Sound aggregation of the metric values (MR4) A data quality metric must be applicable to single data values as well as to sets of data values. The metric should be performed in different levels of data with consistent aggregation values. Assessment: In all cases, we propose normalised metrics that are scaled to the number of triples or geospatial terms they assess. Thus this requirement is satisfied. The original 1Spatial 1 Integrate output (1Spt column) does not fulfil this property as the results are not scaled to the dataset, This is fixed for our uplifted versions.
Economic efficiency of the metric (MR5) This requirement addresses the metric’s utility from an economic perspective. Application of the data quality metric should provide a cost-beneficial effect on the business, thus computation time should not be excessive. The metric should support effective decision making.Assessment: All of the metrics can be calculated with mathematical formulations automatizing the computations in an effective way at a low cost. They have proved effective for decision making in OSi. All the metrics fulfil this requirement except T-M9 since it depends on knowledge of the dataset creation date, which is not always available.
6.Lessons learned
The ADAPT Centre developed this work over two years of collaboration with the Geospatial Services, Data Governance & Quality department in OSi and knowledge exchange was a key outcome. This was facilitated by quarterly workshops with senior stakeholders as well as regular weekly meetings between the design and implementation teams. Key lessons learned from the deployment of semantic web technologies and standards for the creation of metadata supporting unified data quality governance of a complex data production pipeline are described below.
Despite the rapid advances in general purpose Linked Data metrics in the last decade [15,38,50], domain and application specific metrics are often needed to complement generic metrics to get a full picture of quality in a specific data production pipeline. For example, in our case, OSi needed additional geospatial conformance standards metrics and uplifted metrics based on domain-specific rules.
If the domain and application specific metrics are not defined effectively, they can lead to poor decisions and economic losses. The effective design depends on applying best practice [23] for metrics so that rather than being local measures of quality they can form part of a quality system and support combination with other metrics.
Data quality dimensions provide an important mechanism for unifying heterogeneous metrics into a single measurement system. This is an excellent way to provide visibility of quality along a data pipeline with multiple storages and representation technologies as measurements from diverse quality tools can be mapped into a single model. However, most previous work, e.g. Zaveri et al. [50] has assumed a single model of data quality dimensions and this is insufficient in modern data production systems as they span multiple domains which had previously independent data quality dimension models. Thus dimension mappings are required for more flexibility.
It was seen that the capability to dynamically exhibit the same quality data from the perspectives of many quality standards was particularly well received by system stakeholders (see Section 5.2). This was significant as at the beginning of this study it was not known which quality standards were the most important and this will vary as more stakeholders and use cases are added.
OSi gained three significant advantages by creating and classifying metrics based on 1Spatial rule-based data validation into the ISO 19157 data quality framework as part of our uplift process (Section 4.2) as follows: (i) they were previously limited to reviewing the raw outputs of validation rules, which was difficult to track over time for trends due to the lack of normalised reporting; (ii) mapping to common dimensions was necessary to ensure quality traceability along the data pipeline, and (iii) ISO 19157 defines the preferred reporting framework for the OSi geospatial services department but was not natively supported by the 1Spatial 1Integrate tool.
Despite the broad adoption of Linked Data, traditional standards bodies like the ISO are still transitioning to providing official ontologies documenting their work. For example, the ISO/TC 211 committee specifies methods, tools and services for geographic data management and has a continuous effort to create and publish Linked Data about their standards and the concepts therein, whereas other ISO committees do not have any initiative for this. This creates a formal knowledge gap that can be filled by local initiatives like our model of ISO 25012 quality dimensions but the community would be better served by having official representations. This does show that there is great potential for further semantic modelling of standards, even if ontologies are not a core data transfer mechanism used within the standard itself.
The Semantic Web approach to building metadata supporting data governance enabled rich data fusion across different organisational contexts into a unified data governance system without requiring any loss to the underlying data. The Semantic Web community has already standardised many core vocabularies and ontologies for the types of metadata required to describe a data ecosystem (see Section 4.4). These are all easily combined and provide standards-based mechanisms for data platform and data governance vendors that are currently under-exploited in the marketplace.
7.Conclusions and future work
This research investigated how a uniform semantic information space for data quality measures may be created and then used to give end-to-end views of data quality along a data production pipeline from disparate quality assessment instruments. Semantic Web methods and tools showed themselves to be effective at data fusion and model building (as expected) but we also showed that the Semantic Web community has already standardised the core set of vocabularies for building data quality governance metadata (Section 4.4), a key current area of economic and technological development that is not often exploited by practitioners. Our approach relies on the DCAT, PROV-O and daQ specifications by the W3C.
In order to uplift data quality metric observations from rule-based quality tools and local scripts, it was necessary to define an uplift process that included metric naming, data quality dimension assignment, conversion of unbounded results to bounded normalised ranges and syntactic conversion to RDF (Section 4.2). Our implementation used R2RML-F but other approaches are valid. Given the diversity of the data quality tools and stakeholder communities, it was necessary to define a set of formal mappings between four standard models of data quality (Section 4.3). The unified quality graph created allowed us to present the heterogeneous data with different formats and assessments of different tools to be presented in a homogeneous way (Section 4). Stakeholders identified standards compliance reporting for geospatial data as a gap in current Geospatial Linked Data metrics and a set of new metrics were defined (Section 3.1). A web-based dashboard was designed and implemented to visualise the quality analysis and changes through time (Section 4.7). The dashboard received strong validation from stakeholders and scored 76 (B-class) SUS usability (see Section 5.2). Overall the program to increase the data quality governance capabilities was successful with an ISO 33020 process evaluation showing an improvement from Managed Data Quality to Predictable Data Quality and the use of Semantic Web technology contributed to that success, especially in the areas of reduced reliance on manual processes and enabling centralised data quality governance by delivering end to end monitoring (Section 5.1).
This work has provided a reusable approach to building data quality governance metadata for data production pipelines, a domain expert-validated set of 55 data quality dimension correspondences, daQ models of data quality standards, a process for rules-based data quality output uplift into metric observations capable of aggregation, open source implementations of 9 new geospatial linked data standards conformance metrics, and an open source data quality dashboard prototype
In future work, we will expand the data quality model to include FAIR principles, and data value dimensions, and include R2RML mapping support for the uplift of quality metric observations from more quality tools.
Notes
9 At the time of writing, this service was disabled due to the high global risk of cyber attack.
23 Some standardisation bodies already implemented the RDF models of their standards such as ISO 19157 (https://def.isotc211.org/ontologies/iso19157/) or the W3C Data Quality Vocabulary (https://www.w3.org/TR/vocab-dqv/).
24 @prefix http://www.w3.org/2002/07/owl#.
25 @prefix http://open.vocab.org/terms#.
26 @prefix http://www.w3.org/2000/01/rdf-schema#.
27 This is sometimes called business data lineage in contrast with technical data lineage which records the correspondences between individual data items in different data stores.
Acknowledgements
This research received funding from the ADAPT Centre for Digital Content Technology [grant number 13/RC/2106_2] by Science Foundation Ireland and co-funded by the European Regional Development Fund, the European Union’s Horizon 2020 research and innovation programme under Marie Sklodowska-Curie grant agreement No. 801522, and Ordnance Survey Ireland. The authors would like to thank Jeremy Debattista for his contribution to early versions of this work.
References
[1] | R. Albertoni and A. Isaac, Data on the web best practices: Data quality vocabulary, 2016, W3C Working Draft, 19. |
[2] | J. Arenas-Guerrero, D. Chaves-Fraga, J. Toledo, M.S. Pérez and O. Corcho, Morph-kgc: Scalable knowledge graph materialization with mapping partitions, Semantic Web ((2022) ). |
[3] | K. Bereta, G. Xiao and M. Koubarakis, Ontop-spatial: Ontop of geospatial databases, Journal of Web Semantics 58: ((2019) ), 100514. doi:10.1016/j.websem.2019.100514. |
[4] | J. Brooke et al., Sus-a quick and dirty usability scale, Usability evaluation in industry 189: (194) ((1996) ), 4–7. |
[5] | P. Brous, M. Janssen and R. Krans, Data governance as success factor for data science, in: Conference on e-Business, e-Services and e-Society, Springer, (2020) , pp. 431–442. |
[6] | B. Catania, G. Guerrini and B. Yaman, Exploiting context and quality for linked data source selection, in: Proceedings of the 34th ACM/SIGAPP Symposium on Applied Computing, SAC 2019, Limassol, Cyprus, April 8–12, 2019, C. Hung and G.A. Papadopoulos, eds, ACM, (2019) , pp. 2251–2258. doi:10.1145/3297280.3297503. |
[7] | Z. Chen and N. Chen, Provenance information representation and tracking for remote sensing observations in a sensor web enabled environment, Remote Sensing 7: (6) ((2015) ), 7646–7670. doi:10.3390/rs70607646. |
[8] | G. Closa, J. Masó-Pau, B. Proß and X. Pons, W3C PROV to describe provenance at the dataset, feature and attribute levels in a distributed environment, Comput. Environ. Urban Syst. 64: ((2017) ), 103–117. doi:10.1016/j.compenvurbsys.2017.01.008. |
[9] | G. Closa, J. Masó-Pau, A. Zabala, L. Pesquer and X. Pons, A provenance metadata model integrating ISO geospatial lineage and the OGC WPS: Conceptual model and implementation, Trans. GIS 23: (5) ((2019) ), 1102–1124. doi:10.1111/tgis.12555. |
[10] | W.W.W. Consortium et al., Data Catalog Vocabulary (DCAT), (2014) . |
[11] | DAMA International, DAMA-DMBOK: Data Management Body of Knowledge, Technics Publications, LLC, (2017) . |
[12] | S. Das, S. Sundara and R. Cyganiak, R2RML: RDB to RDF mapping language, W3C Recommendation 27 September 2012, 2012. |
[13] | B. De Meester, W. Maroy, A. Dimou, R. Verborgh and E. Mannens, Rml and fno: Shaping dbpedia declaratively, in: European Semantic Web Conference, Springer, (2017) , pp. 172–177. |
[14] | J. Debattista, S. Auer and C. Lange, Luzzu – a methodology and framework for linked data quality assessment, Journal of Data and Information Quality (JDIQ) 8: (1) ((2016) ), 1–32. doi:10.1145/2992786. |
[15] | J. Debattista, E. Clinton and R. Brennan, Assessing the Quality of Geospatial Linked Data–Experiences from Ordnance Survey Ireland (OSI), (2018) . |
[16] | J. Debattista, C. Lange and S. Auer, Representing dataset quality metadata using multi-dimensional views, in: Proceedings of the 10th International Conference on Semantic Systems, SEMANTICS 2014, Leipzig, Germany, September 4–5, 2014, (2014) , pp. 92–99. |
[17] | C. Debruyne, A. Meehan, É. Clinton, L. McNerney, A. Nautiyal, P. Lavin and D. O’Sullivan, Ireland? S authoritative geospatial linked data, in: International Semantic Web Conference, Springer, (2017) , pp. 66–74. |
[18] | C. Debruyne and D. O’Sullivan, R2RML-F: Towards sharing and executing domain logic in R2RML mappings, in: Proceedings of the Workshop on Linked Data on the Web, LDOW 2016, Co-Located with 25th International World Wide Web Conference (WWW 2016), S. Auer, T. Berners-Lee, C. Bizer and T. Heath, eds, CEUR Workshop Proceedings, Vol. 1593: , CEUR-WS.org, (2016) . |
[19] | L. Di, Y. Shao and L. Kang, Implementation of geospatial data provenance in a web service workflow environment with ISO 19115 and ISO 19115-2 lineage model, IEEE Trans. Geosci. Remote. Sens. 51: (11) ((2013) ), 5082–5089. doi:10.1109/TGRS.2013.2285999. |
[20] | J.F.T. Djuedja, F.H. Abanda, B. Kamsu-Foguem, P. Pauwels, C. Magniont and M. Karray, An integrated linked building data system: AEC industry case, Adv. Eng. Softw. 152: ((2021) ), 102930. doi:10.1016/j.advengsoft.2020.102930. |
[21] | H. Galhardas, D. Florescu, D.E. Shasha, E. Simon and C.-A. Saita, Improving data cleaning quality using a data lineage facility, in: DMDW, (2001) , p. 3. |
[22] | P. Geyer, C. Koch and P. Pauwels, Fusing data, engineering knowledge and artificial intelligence for the built environment, Adv. Eng. Informatics 48: ((2021) ), 101242. doi:10.1016/j.aei.2020.101242. |
[23] | B. Heinrich, D. Hristova, M. Klier, A. Schiller and M. Szubartowicz, Requirements for data quality metrics, Journal of Data and Information Quality (JDIQ) 9: (2) ((2018) ), 1–32. |
[24] | International standardization organization, https://ec.europa.eu/eip/ageing/standards/ict-and-communication/data/iso-19000-series_en. Access date: 15.09.2020. |
[25] | ISO/IEC/IEEE, Information technology – process assessment – process measurement framework for assessment of process capability, ISO/IEC/IEEE 33020:2019(E) 11 2019. |
[26] | S. Jozashoori, D. Chaves-Fraga, E. Iglesias, M.-E. Vidal and O.C. Funmap, Efficient execution of functional mappings for knowledge graph creation, in: International Semantic Web Conference, Springer, (2020) , pp. 276–293. |
[27] | R. Karam and M. Melchiori, Improving geo-spatial linked data with the wisdom of the crowds, in: Proceedings of the Joint EDBT/ICDT 2013 Workshops, ACM, (2013) , pp. 68–74. doi:10.1145/2457317.2457329. |
[28] | V. Khatri and C.V. Brown, Designing data governance, Communications of the ACM 53: (1) ((2010) ), 148–152. doi:10.1145/1629175.1629210. |
[29] | K. Kyzirakos, D. Savva, I. Vlachopoulos, A. Vasileiou, N. Karalis, M. Koubarakis and S.M. Geotriples, Transforming geospatial data into RDF graphs using R2RML and RML mappings, J. Web Semant. 52–53: ((2018) ), 16–32. doi:10.1016/j.websem.2018.08.003. |
[30] | J. Lehmann, S. Athanasiou, A. Both, A. García-Rojas, G. Giannopoulos, D. Hladky, J.J. Le Grange, A.-C.N. Ngomo, M.A. Sherif, C. Stadler et al., Managing Geospatial Linked Data in the Geoknow Project, (2015) . |
[31] | K. McGlinn, R. Brennan, C. Debruyne, A. Meehan, L. McNerney, E. Clinton, P. Kelly and D. O’Sullivan, Publishing authoritative geospatial data to support interlinking of building information models, Automation in Construction 124: ((2021) ), 103534. doi:10.1016/j.autcon.2020.103534. |
[32] | A. Miles, B. Matthews, M. Wilson and D. Brickley, Skos core: Simple knowledge organisation for the web, in: International Conference on Dublin Core and Metadata Applications, (2005) , pp. 3–10. |
[33] | M.-A. Mostafavi, G. Edwards and R. Jeansoulin, An Ontology-Based Method for Quality Assessment of Spatial Data Bases, (2004) . |
[34] | K. Patroumpas, M. Alexakis, G. Giannopoulos and S. Athanasiou, Triplegeo: An ETL tool for transforming geospatial data into RDF triples, in: Proceedings of the Workshops of the EDBT/ICDT 2014 Joint Conference (EDBT/ICDT 2014), Athens, Greece, March 28, 2014, K.S. Candan, S. Amer-Yahia, N. Schweikardt, V. Christophides and V. Leroy, eds, CEUR Workshop Proceedings, Vol. 1133: , CEUR-WS.org, (2014) , pp. 275–278. |
[35] | P. Pauwels and W. Terkaj, Express to owl for construction industry: Towards a recommendable and usable ifcowl ontology, Automation in construction 63: ((2016) ), 100–133. doi:10.1016/j.autcon.2015.12.003. |
[36] | M. Perry and J. Herring, Ogc geosparql-a geographic query language for rdf data, OGC implementation standard 40: ((2012) ). |
[37] | F. Radulovic, N. Mihindukulasooriya, R. García-Castro and A. Gómez-Pérez, A comprehensive quality model for linked data, Semantic Web 9: (1) ((2018) ), 3–24. doi:10.3233/SW-170267. |
[38] | F. Radulovic, N. Mihindukulasooriya, R. García-Castro and A. Gómez-Pérez, A comprehensive quality model for linked data, Semantic Web 9: (1) ((2018) ), 3–24. doi:10.3233/SW-170267. |
[39] | M.A. Sadiq, G. West, D.A. McMeekin, L. Arnold and S. Moncrieff, Provenance ontology model for land administration spatial data supply chains, in: 2015 11th International Conference on Innovations in Information Technology (IIT), IEEE, (2015) , pp. 184–189. doi:10.1109/INNOVATIONS.2015.7381537. |
[40] | K. Sun, Y. Zhu, P. Pan, Z. Hou, D. Wang, W. Li and J. Song, Geospatial data ontology: The semantic foundation of geospatial data integration and sharing, Big Earth Data 3: (3) ((2019) ), 269–296. doi:10.1080/20964471.2019.1661662. |
[41] | J. Tandy, L. van den Brink and P. Barnaghi, Spatial Data on the Web Best Practices. W3C Working Group Note, (2017) . |
[42] | D. Thakker, P. Patel, M.I. Ali and T. Shah, Semantic web of things for industry 4.0, Semantic Web 11: (6) ((2020) ), 885–886. doi:10.3233/SW-200407. |
[43] | N. van Oorschot and B. van Leeuwen, Intelligent fire risk monitor based on linked open data, in: ISCRAM, (2017) . |
[44] | W. B. United Nations Statistics Division, Global Geospatial Information Management. A Strategic Guide To Develop And Strengthen National Geospatial Information Management Part 1: Overarching Strategic Framework. http://ggim.un.org/meetings/GGIM-committee/8th-Session/documents/Part%201-IGIF-Overarching-Strategic-Framework-24July2018.pdf, 2018. [Online; accessed 11-Dec-2018]. |
[45] | B. Yaman and R. Brennan, Linkeddataops: Linked data operations based on quality process cycle, in: Proceedings of the EKAW 2020 Posters and Demonstrations Session Co-Located with 22nd International Conference on Knowledge Engineering and Knowledge Management (EKAW 2020), Globally online & Bozen-Bolzano, Italy, September 17, 2020, D. Garijo and A. Lawrynowicz, eds, CEUR Workshop Proceedings, Vol. 2751: , CEUR-WS.org, (2020) , pp. 31–35. |
[46] | B. Yaman, K. Thompson and R. Brennan, Quality metrics to measure the standards conformance of geospatial linked data, in: Proceedings of the ISWC 2020 Demos and Industry Tracks: From Novel Ideas to Industrial Practice Co-Located with 19th International Semantic Web Conference (ISWC 2020), Globally Online, November 1-6, 2020 (UTC), K.L. Taylor, R.S. Gonçalves, F. Lécué and J. Yan, eds, CEUR Workshop Proceedings, Vol. 2721: , CEUR-WS.org, (2020) , pp. 109–114. |
[47] | B. Yaman, K. Thompson and R. Brennan, Standards conformance metrics for geospatial linked data, in: Iberoamerican Knowledge Graphs and Semantic Web Conference, Springer, (2020) , pp. 113–129. doi:10.1007/978-3-030-65384-2_9. |
[48] | B. Yaman, K. Thompson and R. Brennan, A SKOS taxonomy of the UN global geospatial information management data themes (short paper), in: Proceedings of the 4th International Workshop on Geospatial Linked Data (GeoLD) Co-Located with the 18th Extended Semantic Web Conference (ESWC 2021), Virtual Event, Greece, June 7th, 2021, B. Yaman, M.A. Sherif, A.N. Ngomo and A. Haller, eds, CEUR Workshop Proceedings, Vol. 2977: , CEUR-WS.org, (2021) , pp. 89–96. |
[49] | J. Yuan, P. Yue, J. Gong and M. Zhang, A linked data approach for geospatial data provenance, IEEE Trans. Geosci. Remote. Sens. 51: (11) ((2013) ), 5105–5112. doi:10.1109/TGRS.2013.2249523. |
[50] | A. Zaveri, A. Rula, A. Maurino, R. Pietrobon, J. Lehmann and S. Auer, Quality assessment for linked data: A survey, Semantic Web 7: (1) ((2016) ), 63–93. doi:10.3233/SW-150175. |


