
A semantic meta-model for data integration and exploitation in precision agriculture and livestock farming
Abstract
At the domains of agriculture and livestock farming a large amount of data are produced through numerous heterogeneous sources including sensor data, weather/climate data, statistical and government data, drone/satellite imagery, video, and maps. This plethora of data can be used at precision agriculture and precision livestock farming in order to provide predictive insights in farming operations, drive real-time operational decisions, redesign business processes and support policy-making. The predictive power of the data can be further boosted if data from diverse sources are integrated and processed together, thus providing more unexplored insights. However, the exploitation and integration of data used in precision agriculture is not straightforward since they: i) cannot be easily discovered across the numerous heterogeneous sources and ii) use different structural and naming conventions hindering their interoperability. The aim of this paper is to: i) study the characteristics of data used in precision agriculture & livestock farming and ii) study the user requirements related to data modeling and processing from nine real cases at the agriculture, livestock farming and aquaculture domains and iii) propose a semantic meta-model that is based on W3C standards (DCAT, PROV-O and QB vocabulary) in order to enable the definition of metadata that facilitate the discovery, exploration, integration and accessing of data in the domain.
1.Introduction and motivation
Today, the agriculture and livestock farming sectors produce large amounts of heterogeneous data [19,41]. Examples of these data include IoT sensor data measuring soil electrical conductivity [22], drone/satellite imagery data presenting the state of crops at different parts of a field [25] and video data monitoring animal behaviour [8,47]. Precision agriculture and precision livestock farming make intense use of these data accompanied with other data such as weather data, statistical and government data, and maps to gain insights, make predictions, drive real-time operational decisions and redesign business processes regarding, e.g., disease [23], pests and weeds control, fertilization, harvest, irrigation, and seeding [9], as well as animal behaviour recognition [5,8,47] and animal body weight measurement [14].
The full potential of precision agriculture and precision livestock farming can be explored if data from diverse heterogeneous sources are processed together, thus providing more unexplored insights. For example, the processing of satellite imagery and weather data about the same time period and geographic area enables the prediction of crop growth and yield as well as the identification of the best harvesting period [44]. However, these data are usually fragmented and come from heterogeneous sources [31,33] using different standards, structures and units (e.g., streaming sensor data and weather data from meteorological institutes). Thus, due to their heterogeneity and fragmentation it is not straightforward to identify data exploited in precision agriculture or livestock farming that can be processed together (e.g., identify weather data for a specific time period and geographic area) and if done so, it is difficult to actually combine them [36].
The objective of this paper is to design, develop and apply a semantic meta-model that facilitates data integration and exploitation in the domains of precision agriculture and precision livestock farming. Towards this end, a wide range of relevant stakeholders were engaged in a co-creation process including the definition of nine relevant use cases and, finally, the identification of domain requirements. Based on the identified requirements, a model was created considering also the re-use of standard vocabularies such as DCAT [1], PROV-O [32] and QB [12]. The model was applied in the context of the identified use cases, proving its sufficiency. Although the model has been developed for the specific domain, it can potentially be used at other domains that have similar requirements.
The aim of the proposed model is to serve as a common reference model for: i) the alignment of data exploited in precision agriculture and livestock farming in order to tackle heterogeneity issues and ii) the semantic annotation of data in the domain in order to facilitate data identification and exploration. The model can be used to create metadata (e.g., spatial/temporal coverage of the data, structure of the data) that support:
– The on-demand data discovery and exploration. For example, enable the identification of data that address specific criteria, e.g., data of area X at the time frame [2018–2019] that contain sensor-generated data related to soya yield cultivation.
– Data interoperability by aligning/mapping the structure of the data to the model. For example, align the dimensions (e.g., time and geography) and measures (e.g., temperature and weight) of the data to the dimensions/measures defined by the model.
– Data access. The model contains structural and access metadata that enable the querying/accessing of data. For example, enable the formulation and execution of queries based on the metadata.
The proposed model is hosted in a permanent URI http://w3id.org/cybele/model by OGC making it sustainable and shared across multiple communities of practice fostering and promoting its wider adoption.
The rest of the paper is organised as follows, Section 2 presents background and related work, Section 3 presents the methodology followed in this paper in order to create the model, Section 4 presents the model specification including the relevant use cases, data and requirements, Section 5 presents the conceptualisation and implementation of the model, Section 6 applies and demonstrates the use of the model at data exploited in precision agriculture and livestock farming and finally Section 7 concludes the paper and discusses interesting points.
2.Background and related work
This section presents existing vocabularies that enable the definition of metadata (Section 2.1) focusing mainly on four categories that are relevant to the scope of this paper. The four categories are: i) catalog-related descriptive metadata that facilitate the discoverability of datasets, ii) structural metadata that describe the structure of datasets, iii) provenance metadata that describe the way datasets where generated and iv) access metadata describing the way to access the actual data specified by the metadata. This section (sub-Section 2.2) also includes domain (agriculture and livestock farming) specific models and other related controlled vocabularies (e.g., about time or measurement units) that can be used to populate the aforementioned four categories of metadata.
2.1.Metadata vocabularies
Regarding the catalog-related descriptive metadata, Data Catalog Vocabulary (DCAT) [1] is the most popular one. DCAT is an RDF vocabulary designed to facilitate interoperability between data catalogs published on the Web. By using DCAT to define metadata of data catalogs, publishers increase discoverability and enable applications to easily consume metadata from multiple catalogs.
Multiple extensions of DCAT have been proposed to cover the needs of different domains. These include: i) the DCAT Application Profile (DCAT-AP) [37] for data portals in Europe that enables cross-data portal search for datasets, ii) multiple national (Belgium, Germany, Ireland, Italy, The Netherlands, Norway, Spain, Sweden and Switzerland) application profiles for DCAT-AP [10] addressing national specific needs iii) the StatDCAT Application Profile (StatDCAT-AP) [45] that aims at providing a commonly-agreed dissemination vocabulary for statistical open data and iv) the GeoDCAT-AP [17] Application Profile that aims at making geospatial information better searchable across borders and sectors.
The EU INSPIRE directive [16] proposes specific rules to make spatial data available covering diverse aspects including the definition of metadata and the interoperability of spatial data. The spatial data considered under the directive is extensive and includes among others the agriculture domain. Regarding descriptive metadata, INSPIRE defines the elements that should be used for documenting a dataset. The INSPIRE metadata elements have been aligned with ISO 19115/ISO 19119 as well as with DCAT.
A popular vocabulary for defining structural metadata is the RDF Data Cube (QB) vocabulary [12]. It is a W3C standard for publishing statistical data on the Web using the linked data principles. The core class of the vocabulary is the qb:DataSet that represents a cube, which comprises a set of dimensions – qb:DimensionProperty (e.g., time, geography), measures – qb:MeasureProperty (e.g., temperature, weight) and attributes – qb:AttributeProperty (e.g., unit of measurement). The declaration of the dimensions, attributes, and measures is done at the qb:DataStructureDefinition, which defines the structure of the cube. Usually the values of the dimensions, attributes, and measures are populated using predefined code lists. A set of best practices [30] for using the QB vocabulary and modelling linked statistical data, which also address relevant interoperability challenges [29], is considered at the definition of the proposed model in this paper.
Another RDF vocabulary for defining structural metadata is VoID [2]. However, VoID is limited for expressing metadata only about RDF datasets. Except from the structural metadata, VoID enables also the definition of other types of metadata including general metadata following the Dublin Core model, access metadata describing how RDF data can be accessed using various protocols and metadata about links between datasets for understanding how multiple datasets are related and can be used together.
The PROV-O [32] W3C recommendation enables the definition of provenance metadata in terms of relationships between three main types of concepts: i) prov:Entity, which represents physical, digital, or other types of things, ii) prov:Activity, which occurs over time and can generate (prov:wasGeneratedBy) entities and iii) prov:Agent, which is responsible for activities occurring (prov:wasAssociatedWith) and entities existing (prov:wasAttributedTo).
PROV-O can be used in conjunction with other vocabularies and ontologies, including the Observation and Measurements (O&M) conceptual model [38] and the Semantic Sensor Network (SSN) ontology [21] in order to provide domain specific provenance information. The Observation and Measurements (O&M) conceptual model [38] is an OGC specification for observations and features involved in sampling when making observations. These provide models for the exchange of information describing observation acts and their results.
The Semantic Sensor Network (SSN) ontology [21] is used for describing actuators, sensors and their observations, the involved procedures, the studied features of interest, the samples used to do so, and the observed properties. SSN is a domain-independent model that supports a wide range of use cases e.g., satellite imagery, large-scale scientific monitoring, observation-driven ontology engineering, and the Web of Things. Such use cases are implemented with domain specific subclasses of abstract concepts such as “procedures” and “observableProperties”. SSN is aligned with PROV-O and O&M models.
All the aforementioned vocabularies and ontologies partially cover the four categories of metadata. In the case of access metadata none of the existing vocabularies provide adequate information. A research approach, similar to the one proposed in this paper, that tries to combine descriptive, structural and access metadata is proposed by Gottschalk et al [20]. However, their approach is mainly based on adhoc vocabularies and does not include standards (except from DCAT). Finally, a preliminary approach to define dataset metadata for the agriculture domain is proposed by Pesce et al [42]. They propose a small extension to DCAT that enables the provision of access metadata providing technical information on how to access the datasets.
2.2.Domain specific models and controlled vocabularies
The Agricultural and Aquaculture Facilities (AF) [27] model is used to define geographical information of entities under the Agriculture and Aquaculture scope. AF is based on the Activity Complex model [26] proposed by INSPIRE that avoids specific thematic connotations, e.g., AF contain concepts such as the “holding”, “site”, “location”, etc. However, AF also includes an extended model to represent domain information, e.g., plots, agri-buildings, installations, irrigation and drainage, farm animals and animal health.
FOODIE ontology [40] provides an application vocabulary that enable the definition of data and metadata related to farm management. The main concept of the ontology is the “Plot” that is a continuous area of agricultural land with one type of crop species, cultivated by one user applying one farming mode. One lower level than Plot is the “Management Zone”, which enables a more precise description of the land characteristics in fine-grained areas.
Agricultural Data Application Programming Toolkit (ADAPT)11 is a framework for precision agriculture that enables data interoperability between different software and hardware applications. It comprises an Agricultural Application Data Model, a common API and a set of data conversion plugins. The data model covers many aspects including data and metadata related to growers, their machines, and their partners.
AGROVOC [18] is a controlled vocabulary defined by the Food and Agriculture Organization (FAO) of the United Nations that includes concepts related to food, nutrition, agriculture, forestry, fisheries, techniques of plant cultivation, etc. More than half of the concepts fall under the top concept “organism”, which confirms that AGROVOC is largely oriented towards the agricultural and livestock farming sectors.
Animal Trait and Animal Health ontologies is a collection of ontologies related to livestock farming: i) ATOL (Animal Trait Ontology for Livestock) [24] is an ontology of characteristics defining phenotypes of livestock in their environment, ii) EOL (Environment Ontology for Livestock) [28] is an ontology that describes environmental conditions of livestock farms, e.g., feeding modalities, the environment, the structure of livestock farms and iii) AHOL (Animal Health Ontology for Livestock) [43] is an ontology that describes production diseases (associated symptoms, the affected organism, the organism causing the disease).
There are also a number of pertinent OBO Foundry ontologies. For example EnvO [7] is an ontology for the semantically controlled description of environmental entities (e.g. environmental processes), while FoodOn [15] include terms to describe parts of animals and plants which can bear a food role for humans and domesticated animals, as well as derived food products and the processes used to make them. Another relevant OBO ontology, is AgrO [4] that describes agronomic practices, techniques, and variables used in agronomic experiments (e.g. agricultural processes).
OWL-Time [11] is an ontology for describing the temporal properties of resources in any data. The ontology provides a vocabulary for expressing information about durations, and about temporal position including date-time information. The main class of the ontology is the “TemporalEntity” that has two subclasses: “Interval” and “Instant”. Intervals have some extent, while Instants are point-like in that they have no interior points.
QUDT units ontology [39] provides semantic specifications for units of measure, quantity kind, dimensions and data types. QUDT semantics are based on dimensional analysis expressed in OWL. The dimensional approach relates each unit to a system of base units.
Fig. 1.
Methodology to develop the model.
3.Methodology
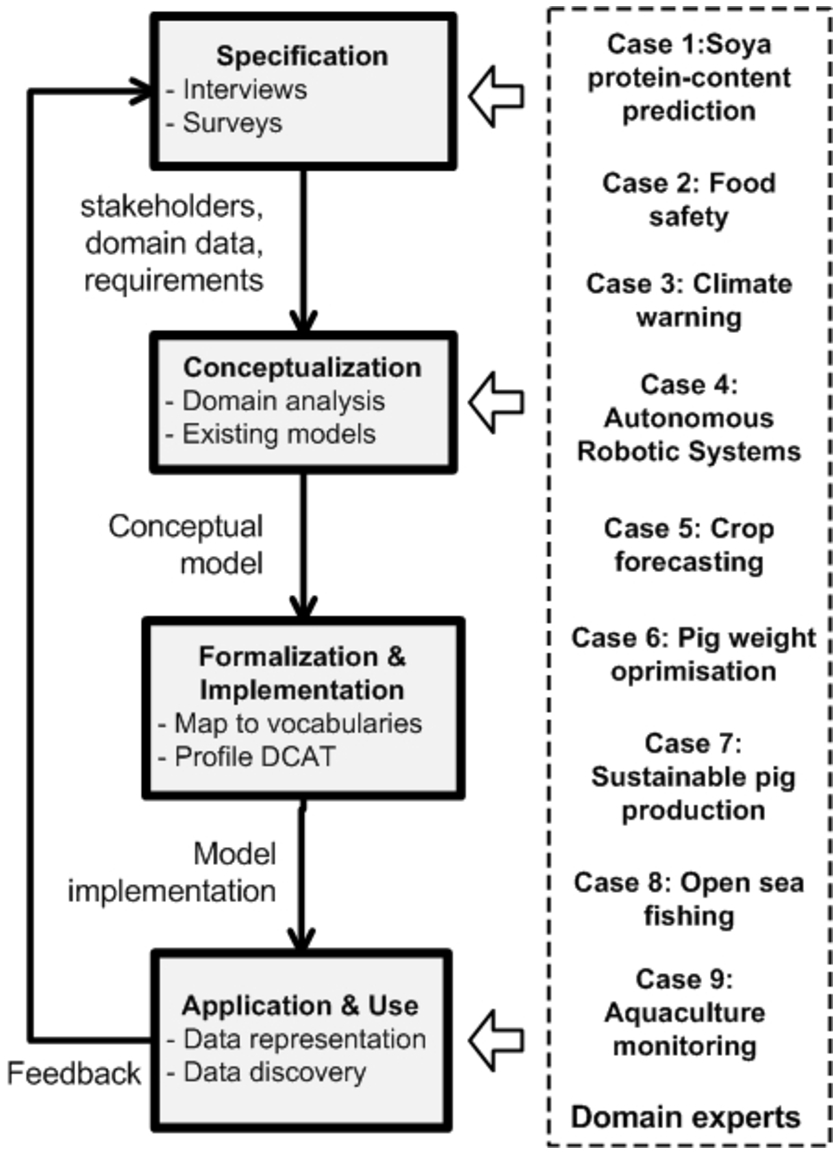
The development of the proposed model adopts a “meet-in-the-middle” approach [48] where concepts emerge both in a bottom-up (i.e., analyzing the domain) and top-down (i.e., analyze and integrate existing ontologies, vocabularies and models) fashion. The methodology (Fig. 1) focuses on a collaborative development that entails the active engagement of domain experts, i.e., agriculture and livestock farming stakeholders. More specifically the methodology comprises of the following phases:
– Specification (Section 4). This step defines a set of relevant use cases (Section 4.1), identifies and analyses the domain data (Section 4.2) and identifies specific domain requirements (Section 4.3). Towards this direction, a set of interviews with the stakeholders have been performed.
– Conceptualization (Section 5.1). This step identifies the concepts of the model and their relations. Concepts emerge by analyzing the domain (e.g., data exploited in precision agriculture and livestock farming, requirements) considering also the re-use of existing ontologies, models and vocabularies presented in Sections 2.1 and 2.2. The output of this phase is a conceptual model comprising all identified concepts and relationships in a human-readable form (e.g., class diagram). For simplicity and space reasons the figure of the conceptual model is not presented in the paper since it is similar and includes less information than the implementation model (see Fig. 2) e.g., the mapping of the concepts to existing vocabularies is not part of the conceptual model.
– Formalization and Implementation (Sections 5.1 and 5.2). This step transforms the conceptual model into a formal or semi-computable model. The identified concepts are mapped to existing standards and vocabularies (Section 5.1). This activity builds a computable model in an ontology language. The implementation language selected is RDF. Additionally, this step presents the implementation choices in order to formalise the model as a reusable profile of DCAT (Section 5.2).
– Application (Section 6). This step adopts a two-fold approach: i) applies the model at data exploited in precision agriculture and livestock farming to check its sufficiency and ii) use the model by performing queries for data retrieval and by developing applications for data exploration.
The methodology has been applied within the EU funded project CYBELE22 that deals with precision agriculture and precision livestock farming. Seven industrial institutions dealing with precision agriculture and precision livestock farming were involved:
– Donau Soja: a non-profit organization that supports sustainable soy production in Europe involving participants along the value-chain (farmers unions, feed producers, livestock enterprises, supermarket chains and traders).
– Vion: an international meat producer with production locations in the Netherlands and Germany and sales support offices in sixteen countries worldwide.
– Cooperatives Agro-alimentàries de la Comunitat Valenciana (CACV): an entity that represents 265 agri-food entities in the Valencian Region (Spain).
– GMV Aerospace and Defence: a technology multinational industrial group that among other deals with climate services for organic fruit production.
– AGROKNOW: a company that finds, connects and delivers agriculture and food information worldwide.
– BioSense: an institute that applies state-of-the-art ICT solutions in agriculture, ecology, environmental protection, water management and industry.
– Nireus: a large aquaculture company with production facilities in Greece and Spain selling products to over 35 countries worldwide.
Stakeholders from the above institutions were involved through interviews (details about the interviews are provided in Section 4.3). The methodology was applied in two rounds. The feedback of the first round was exploited in order to extract new requirements and improve the model. A broad range of nine real cases were explored at the domains of agriculture, livestock farming and aquaculture in order to collect relevant data and requirements. The cases are further described in Section 4.1. The model was applied at these cases and also acted as a central artifact that drove the development of relevant data-centric applications.
4.Specification: Identifying metadata requirements in precision agriculture & livestock farming
This section identifies the cases and requirements that should be covered by the model. Towards this direction, it presents nine agriculture, livestock farming and aquaculture cases (Section 4.1), it identifies and analyses domain data i.e., data exploited in the nine cases (Section 4.2) and identifies specific requirements (Section 4.3).
4.1.Use cases
The selected cases aim to cover a wide range of indicative scenarios at the domains of precision agriculture (five cases), livestock farming (two cases) and aquaculture (two cases) including: i) the prediction of yield quality (case 1), distribution (case 4) and quantity (case 5), ii) the prediction of food safety cases (case 2), iii) the prediction of extreme weather conditions (case 3), iv) optimization of agricultural activities (case 4), v) the prediction of pig weight (case 6), vi) the optimization of meat quality (case 7), vii) the optimization of open sea fishing avoiding also overfishing (case 8) and viii) the optimization of feeding at aquaculture (case 9). The selection of the cases is not exhaustive, however it enables the extraction of multiple indicative requirements in the domain.
Case 1: Organic Soya yield and protein-content prediction. The aim of this case is to predict yield and protein-content maps based on satellite imagery and additional information concerning electromagnetic soil scans, drone images and sensory data. This will enable e.g., farmers to separate A class from B class soya and sell them separately at higher prices.
Case 2: Food Safety. The aim of this case is to assist food safety experts with advanced data analysis and risk prediction for the food supply chain. This includes the prediction of food recalls in the supply chain of various products and the prediction of prices for agricultural products. The data exploited in the case include food recalls, border rejections, lab testing data, fraud cases, production data and trade data.
Case 3: Climate Services for Organic Fruit Production. The aim of this case is to develop an end-to-end frost and hail early warning system for the protection of organic fruit from extreme weather events by mitigating/preventing damages and injuries in sensitive crops. The data exploited in the case include agroclimatic data, weather forecasts, phenology data and satellite images.
Case 4: Autonomous Robotic Systems within Arable Frameworks. The aims of this case are: i) to support decisions and plans for harvest or fertilizer applications and ii) to provide yield predictions and information of yield distributions across the field. The data exploited in the case include soil chemical analysis, hypespectral images of soil, drone images and satellite images.
Case 5: Optimizing computations for crop yield forecasting. The aim of this case is to predict farmer’s crop yields at a high spatial resolution in order to improve the quantity of the produced yields, improve resources management, decrease production costs and decrease yield losses. The data exploited in the case include crop data, soil data, weather forecasts, historic yield data, parcel specific data and satellite images.
Case 6: Pig Weighing Optimisation. The aim of the case is to estimate and track the live weight of pigs in a pen based on video images. Convolutional neural networks (CNNs) will be developed that will use video images of pigs in a pen in order to measure the mean weight and the standard deviation of the weight of pigs in the pen. The growth curve estimated by the CNNs in previously developed models for early warning of diarrhoea will also be incorporated.
Case 7: Sustainable Pig Production. The aims of this case are to: i) improve carcass and meat quality by measuring pork water holding capacity and using hyper spectral imaging to measure meat quality and ii) improve health, welfare and production by improving warning systems and detect anomalies. The data exploited in the case include climate sensor data, feed/medicine registration, human observations, weighting data, flow measurements, slaughterhouse data (sensors for carcass grading, infrared sensor, hyperspectral images).
Case 8: Open Sea Fishing. The aim of this case is to monitor fish stocks and manage commercial fishing vessels in order to prevent overfishing. Three different data sources will be exploited: i) vessels’ electronic logbooks that comprise daily landing data of commercial fish stocks, ii) a board system that collects location data from a GPS logger, weights of the landings per species group, vessel speed, fuel consumption and tractive power and iii) a visual-based processing of the catch using an RGB camera. The above data will also be combined with meteorological data, habitat maps and environmental data from satellite based imaginary systems.
Case 9: Aquaculture monitoring and feeding optimization. The aim of this case is to develop an efficient feed management system including the estimation of fish growth, cage alignment and dead fish identification. The data exploited in the case include aerial images of fish farms taken from drones, weather information and sensor measurements (mainly related to oxygen and current speed).
4.2.Data used in precision agriculture & livestock farming
Based on the cases presented in Section 4.1, it is obvious that different types of data from diverse sources are available. The proposed model should be able to adequately define metadata for all these domain data. The aim of this section is to identify, describe and provide a deeper understanding of the diverse types and characteristics of these data in terms of their nature (e.g., sensor data, earth observations), structure (e.g., structured, unstructured) and domain of coverage (e.g., domain specific, cross-domain). Such data include the following broader categories:
– Sensor data are continuously collected through dedicated hardware and produce spatiotemporal measurements e.g., measure the temperature and humidity at a specific location and time. Sensors produce large volume of data since measurements are repeated regularly (e.g., every 1 minute). A common source of sensor data at precision agriculture include the agricultural machinery that may bear multiple sensors.
– Earth observations e.g., satellite images, drone aerial images, hyper-spectral images, RGB images. This type of data can produce large volume of spatiotemporal data since they provide high resolution images of the earth.
– Video e.g., video data from pig pens to monitor pigs behaviour or RBG video data on conveyor belt to automatically sort the fish catches. This type also produces large volume of data.
– Crowd-sourced data and human observations are collected through manual measurements and inspections (e.g., health inspection at livestock farms). Usually these data are not of big volume, but need to be combined with other data e.g., sensor data, to support decision making at precision agriculture and precision livestock farming.
– Forecasts e.g., for weather, prices, production. These data are also of spatiotemporal nature and usually are not of big volume. They can be combined with other data to facilitate decision making at precision agriculture and precision livestock farming.
– Maps can be combined with other data to provide easily interpretable results and visualization e.g., show sensor measurements on a map.
– Statistical and government data e.g., daily landing data of commercial fish stocks, price data, trade data, food recalls, border rejections, fraud cases. Usually these data are not of big volume, but need to be combined with other data e.g., sensor data, to support decision making at precision agriculture and precision livestock farming.
– Location data e.g., location data of the fishing fleet from a Vessel Monitoring System. Like the sensor data these data can be of large volume since the location of the vessels is updated regularly
Based on their structure, the above data can be separated to: i) structured data (sensor data, earth observations, crowd-sourced data, forecasts, statistical data, maps, location data) that have a well-defined structure and are available as e.g., CSV files, JSON files, relational databases and ii) unstructured data (videos) that do not have a structure and are available as e.g., video or plain image files. Each of the two categories has different characteristics that need to be expressed by the model, but they also share some common. More specifically, both categories have some generic characteristics that need to be expressed (e.g., title, licence, format, geographical coverage) that will facilitate the exploration of the data (e.g., find data for a specific geographical area). However, regarding the structural data, there is also a need to describe their structure enabling in this way a more fine-grained data exploration (e.g., find data that measure the temperature in a specific geographical area) and also facilitate the accessing/querying of the data.
The data can also be classified based on their domain of coverage to domain specific and cross domain. The domain specific include: i) Agriculture data e.g., crop data, protein content, soil chemical analysis, yield maps, ii) Food safety data e.g., food recalls, border rejections, fraud cases, production data, lab testing data, iii) Livestock farming data e.g., pig weight, livestock health, slaughterhouse data, iv) Fishing data e.g., fish behaviour data, landing data of fish stocks, v) Aquaculture data e.g., water info data (temperature, quality, current speed). While the cross-domain data include the: i) Climate and weather data e.g., temperature, wind speed, humidity and ii) Satellite & aerial image data.
The above categorization of the data offers a means to understand the diverse types of data exploited in precision agriculture and livestock farming and does not intend to provide a formal taxonomy of the data.
4.3.User requirements
This section presents the requirements for the proposed semantic model. In order to identify the requirements a set of interviews were performed within the CYBELE project involving 15 stakeholders from the 7 industrial institutions that were involved in the model development. The stakeholders that participated included IT personnel who can describe the technical platforms and infrastructure of the institutions (e.g., databases, information systems, available data, data formats, etc.) as well as managers and decision makers who can describe business needs, business roles and existing business processes of the institutions. The interviews included questions related to:
– The definition of the precision agriculture or precision livestock farming cases including the AS IS and TO BE situations.
– The end-users involved.
– The data used e.g., What kind of data are used? What data need to be collected? Are there any restrictions to obtain the data?
The complete questionnaire that was used at the interviews can be found at the Appendix. The questionnaire as well as the process (i.e. interview) used to collect the information were aligned to research ethics protocols and passed a research ethics review before used.
The information collected during the interviews contributed at the definition of the cases, as well as the identification of data and requirements that need to be covered by the model. The questionnaire collected also information for other aspects related to precision agriculture and precision livestock farming (e.g., Hyper Performance Computing and Artificial Intelligence) that however are out of the scope of this paper.
Table 1
Requirements as a result of an analysis of data exploited in precision agriculture and livestock farming
| Property | Analysis result | Requirement |
| Format | Datasets are available in multiple structured (e.g., CSV,JSON, XLSX, GeoTIFF) and unstructured (e.g., TXT, JPG, PNG) data formats. | Express the dataset format. Support structured and unstructured data formats. |
| Language | Datasets are expressed in diverse languages (e.g., English, Greek, French). | Express the dataset language. Support datasets in different languages. |
| Thematic area | A broad range of areas are covered: i) specific cultivation e.g., soya, ii) cultivation activities e.g., applying fertilizer, harvesting, iii) livestock farming activities e.g.,feeding, iv) fish farming activities e.g., catches and v) weather/climate data. | Express the dataset thematic area. Support diverse thematic areas related to agriculture, livestock farming, fish farming and weather/climate data. |
| Update rate | Datasets are updated in diverse rates e.g.,every minute, daily, weekly, monthly, quarterly, seasonal, annually, sexennial, never. | Express the dataset update rate. Support diverse dataset update rates (every minute, daily, weekly, monthly, quarterly, seasonal, annually, sexennial, never). |
| Temporal coverage | The temporal coverage is expressed as a time range having a min/max value. The granularity is the year (e.g., 2010 – 2020) or the day (e.g., 1/1/2020 – 31/10/2020). | Express the dataset temporal coverage. Support temporal coverages in diverse granularities (e.g., year, date). |
| Minimum temporal step | The datasets use diverse temporal steps (minimum time period resolvable in the dataset) e.g., day, 10 days, plant growth stages, streams. | Express the dataset minimum temporal step. Support a wide range of temporal steps within dataset. |
| Spatial coverage | The spatial coverage is expressed in diverse granularities including the country (e.g., Spain), group of countries (e.g., European Union), land geographic areas (e.g., Central America), sea areas (e.g North East Atlantic), specified coordinates, specific polygon, specific sites (e.g., farm site). | Express the dataset spatial coverage. Support a wide range of spatial coverages including predefined areas (e.g., countries, group of countries, land/sea geographic areas) and dynamic areas (e.g., coordinates, polygons). |
| Data standard | Datasets follow diverse data standards models, schema or ontologies e.g., Data Cube vocabulary, INSPIRE, EPSG 28992 coordinate system | Express the standard the dataset is based on. Support diverse standards for datasets. |
| Structure (dimension, measure) | The structured data contain a broad range of dimensions (e.g., time, geography) and measures (e.g., temperature, weight). The measures may vary on the aggregation function (e.g., min/max/average temperature) or on the measurement subject (e.g., water/air/soil temperature). | Express the structure of datasets including their dimensions and measures. Support diverse dimensions and measures related to agriculture and livestock/fish farming. |
| Units of measure | Measurements are expressed in a variety on units e.g., meter/centimetre/millimetre for distances, gram/kg/tonne for weight, celsius/fahrenheit for temperature, degree/rad for angles. | Express the unit of measure. Support a broad range of units. |
| License | Datasets are available under different licenses including e.g., Creative Commons, custom. | Express the dataset license. Support diverse types of license. |
| Activity | The datasets are created as a result of an activities including: i) Observation e.g., through sensors, autonomous vehicles, human inspection, satellites, aerial drones, ii) Forecasting e.g., weather, price, production, iii) Fusion of two pre-existing datasets | Express the activity that created the dataset. Support diverse types of activities including observation, forecasting and data fusion. |
| Data service (how the data is accessible) | Datasets are available through APIs, Download URLs, SPARQL endpoints, Databases. | Express the service that makes the dataset available. Support different types of services. Facilitate the querying of datasets available through different types of databases. |
| Publisher | Datasets are published by diverse organizations e.g., the 7 industrial institutions. | Express the dataset publisher. Support diverse publishers. |
| Issued, modified | Datasets are issued/modified at specific points in time. | Express the date/time the datasets are issued/modified. |
| Spatial resolution | Datasets have different minimum spatial separation of items within the dataset e.g., 30 meters. | Express the dataset minimum spatial separation. |
| Access rights | Datasets are available as public/open data, private data, and restricted data. | Express the dataset access rights. Support diverse types of access rights (e.g., open, private, restricted). |
| Byte size | Datasets have different sizes in terms of bytes | Express the dataset byte size. |
The identified requirements that are related to the model can be summarized as following:
– Find and locate data based on diverse criteria, e.g., time/geographical coverage, structure.
– Use and query various types of data from different data sources including, e.g., geospatial data, time series.
– Combine data from different and heterogeneous data sources that can be used/queried together.
Additional requirements were collected by analysing the data used at the nine cases considering diverse characteristics/properties (e.g., data format, language, theme, temporal/spatial coverage, and structure). The characteristics considered for the analysis are based on the DCAT model [1]. Table 1 presents the result of the analysis (e.g., what formats are used by the data? what is the temporal/spatial coverage of the data?) and the requirements. The following paragraphs present some interesting insights of the data analysis.
The analyzed data cover a broad range of thematic areas including specific cultivations (e.g., soya), cultivation activities (e.g., applying fertilizer, harvesting), livestock farming activities (e.g., feeding), fish farming activities (e.g., catches) and weather/climate data.
The temporal and spatial coverage of the data are expressed in different granularity levels. The time can be expressed in years or days while the granularity of the spatial dimension can be the country (e.g., Spain), group of countries (e.g., European Union), land geographic area (e.g., Central America), sea area (e.g North East Atlantic), specified coordinates (e.g., a point), specific area (e.g., a polygon), specific site (e.g., farm site).
The structure of the data uses a broad range of dimensions (e.g., time, geography) and measures (e.g., temperature, weight). The measures may vary on the aggregation function (e.g., min/max/average temperature) or on the measurement subject (e.g., water/air/soil temperature). Thus, a broad range of measurement variations may occur, e.g., min water temperature, max air temperature.
The data can be stored at diverse types of databases (e.g., relational databases or NoSQL databases) each exploiting different structural constructs to store and serve the data (e.g., tables for relational databases, collections for NoSQL).
Finally, the datasets can be created as a result of activities such as observation (e.g., through sensors, autonomous vehicles, human inspection, satellites, aerial drones), forecasting (e.g., weather, price, production) and fusion of pre-existing datasets.
5.Model conceptualization and implementation
This section presents the conceptualization and implementation (Section 5.1) of the model by identifying the concepts, their relations and their mapping to existing standards and vocabularies. The section also presents the decision choices for the formalisation of the model as a reusable profile of DCAT (Section 5.2) and details about the publication of the model using the FAIR principles (Section 5.3).
5.1.The model conceptualization and implementation
Based on the requirements (Section 4) four main categories of metadata need to be covered by the model:
– Descriptive metadata: describe the overall features of datasets (e.g., title, language). This category of metadata facilitates the discovery and exploration of data.
– Structural metadata: describe the schema and internal structure of a dataset (e.g., dimensions/measures). This category of metadata facilitates the fine-grained data discovery and exploration based on their structure and enables data interoperability by aligning the structure of the data to the model. This kind of metadata are only applicable to structured data (e.g., CSV, JSON files).
– Provenance metadata: provide information about the origins of the data (e.g., the activity that generated the data). This kind of metadata facilitates the discovery and exoloration of data based on their origin (e.g., search for sensor-generated or crowd-sourced data).
– Access metadata: describe the way to access the data (e.g., Database/Table where the dataset is stored). This information accompanied with the structural metadata facilitates the formulation of queries.
These categories are aligned with the categories proposed by the W3C Data on the Web Best Practices [34].
The requirements presented at Section 4 were further specialized to competency aspects that should be considered at the design of the model. The competency aspects define what should the model be able to express. Table 2 presents these competency aspects, the model concepts that occur for each of them and their mapping to existing vocabularies. The vocabularies used for the mapping are the DCAT, Dublin Core Metadata Terms (dct) [13], RDFS [6], PROV-O, QB and SDMX.33 In some cases no relevant concepts where identified at existing vocabularies, thus new concepts are defined using the prefix “cybele”. The information provided in Table 2 is grouped based on the four categories of metadata.
The “competency aspects” described at Table 2 can also be mapped one-to-one to “competency questions” that the model should address. For example the competency aspect “Dataset is update e.g., monthly” can be express as a competency question “How often is the dataset updated?” or the competency aspect “Dataset is published by an organization” can be expressed as “Which is the publisher of the dataset?”.
Table 2
Model competency aspects, concepts and mapping to vocabularies
| Competency aspect | Concept | Map to vocabularies | |
| Descriptive metadata | Search for datasets registered at a catalog | Dataset, Catalog | dcat:Dataset, dcat:Catalog |
| Dataset contains data about a specific cultivation (e.g., soya) or livestock | Theme (e.g., cultivation, livestock) | dcat:theme | |
| Dataset contains data about a specific theme e.g., weather data, price data | Theme (e.g., weather, price) | ||
| Dataset contains data about cultivation/farming activities e.g., irrigation, applying fertilizer, harvesting, feeding, weighing, slaughter | Theme (e.g., the farming activity) | ||
| Dataset is published by an organization | Publisher | dcat:publisher | |
| Dataset contains data in a specific language e.g., English | Language | dct:language | |
| Dataset is issued/modified at e.g., 1/1/2019 | Issuing, modification date | dct:issued, dct:modified | |
| Dataset is updated e.g., monthly | Update frequency | dct:accrualPeriodicity | |
| Dataset contains data with temporal coverage e.g., [1/1/2017–31/12/2017] | Temporal coverage | dct:temporal | |
| Dataset contains measurements with temporal spacing e.g., one hour (measurements are repeated every one hour) | Temporal resolution | dcat:temporal Resolution | |
| Dataset contains data with spatial coverage e.g., an area defined by a polygon | Spatial coverage | dct:spatial | |
| Dataset contains measurements minimum distance between items e.g., 30 meters | Spatial resolution | dcat:spatialResolution InMeters | |
| Dataset has specific access rights e.g., open access, restricted | Access rights | dct:accessRights | |
| Dataset conforms to a model/schema/ontology/view/profile e.g., Data Cube vocabulary | Standard | dct:conformsTo | |
| Dataset is accessed through a web page | Web page | dcat:landingPage | |
| Access metadata | Dataset is distributed under a specific license | Distribution, license | dcat:Distribution, dct:license |
| Dataset is distributed in a specific format e.g., CSV, XML, Json | Format | dcat:mediaType | |
| Dataset’s distribution is e.g., 100 MB | Size | dcat:byteSize | |
| Dataset distribution can be downloaded through a URL | Download URL | dcat:downloadURL | |
| Dataset is distributed through a service e.g., API | Data service | dcat:DataService | |
| Data service is accessed through an endpoint URL | Endpoint URL | dcat:endpointURL | |
| Datasets distribution is accessible through a Data Base | Database | cybele:Database | |
| Database is accessible through a URL using some connection info e.g., username, password | Connection URL | cybele:connection String | |
| Dataset is accessible and can be queried through a specific structure of the database (e.g., table in relational DBs, collection in NoSQL etc) | Queryable structure, Table, table name | cybele:Queryable Structure, cybele:Table, cybele:tableName | |
| Structural | Dataset measures e.g., NDVI | Measurement | qb:MeasureProperty |
| Dataset has specific dimensions e.g., time, geography | Dimension | qb:DimensionProperty | |
| Dataset’s dimension/measure has a specific range type | Range | rdfs:range | |
| Dataset uses a unit of measure e.g., prices in euro | Unit of measure | sdmx:unitMeasure | |
| Provenance | Dataset is the result of an activity that involves e.g., sensors, humans, satellites | Activity, agent (human, hardware) | prov:Activity, prov:Agent |
| Dataset is the result of an aggregation activity of other data (e.g., raw data) |
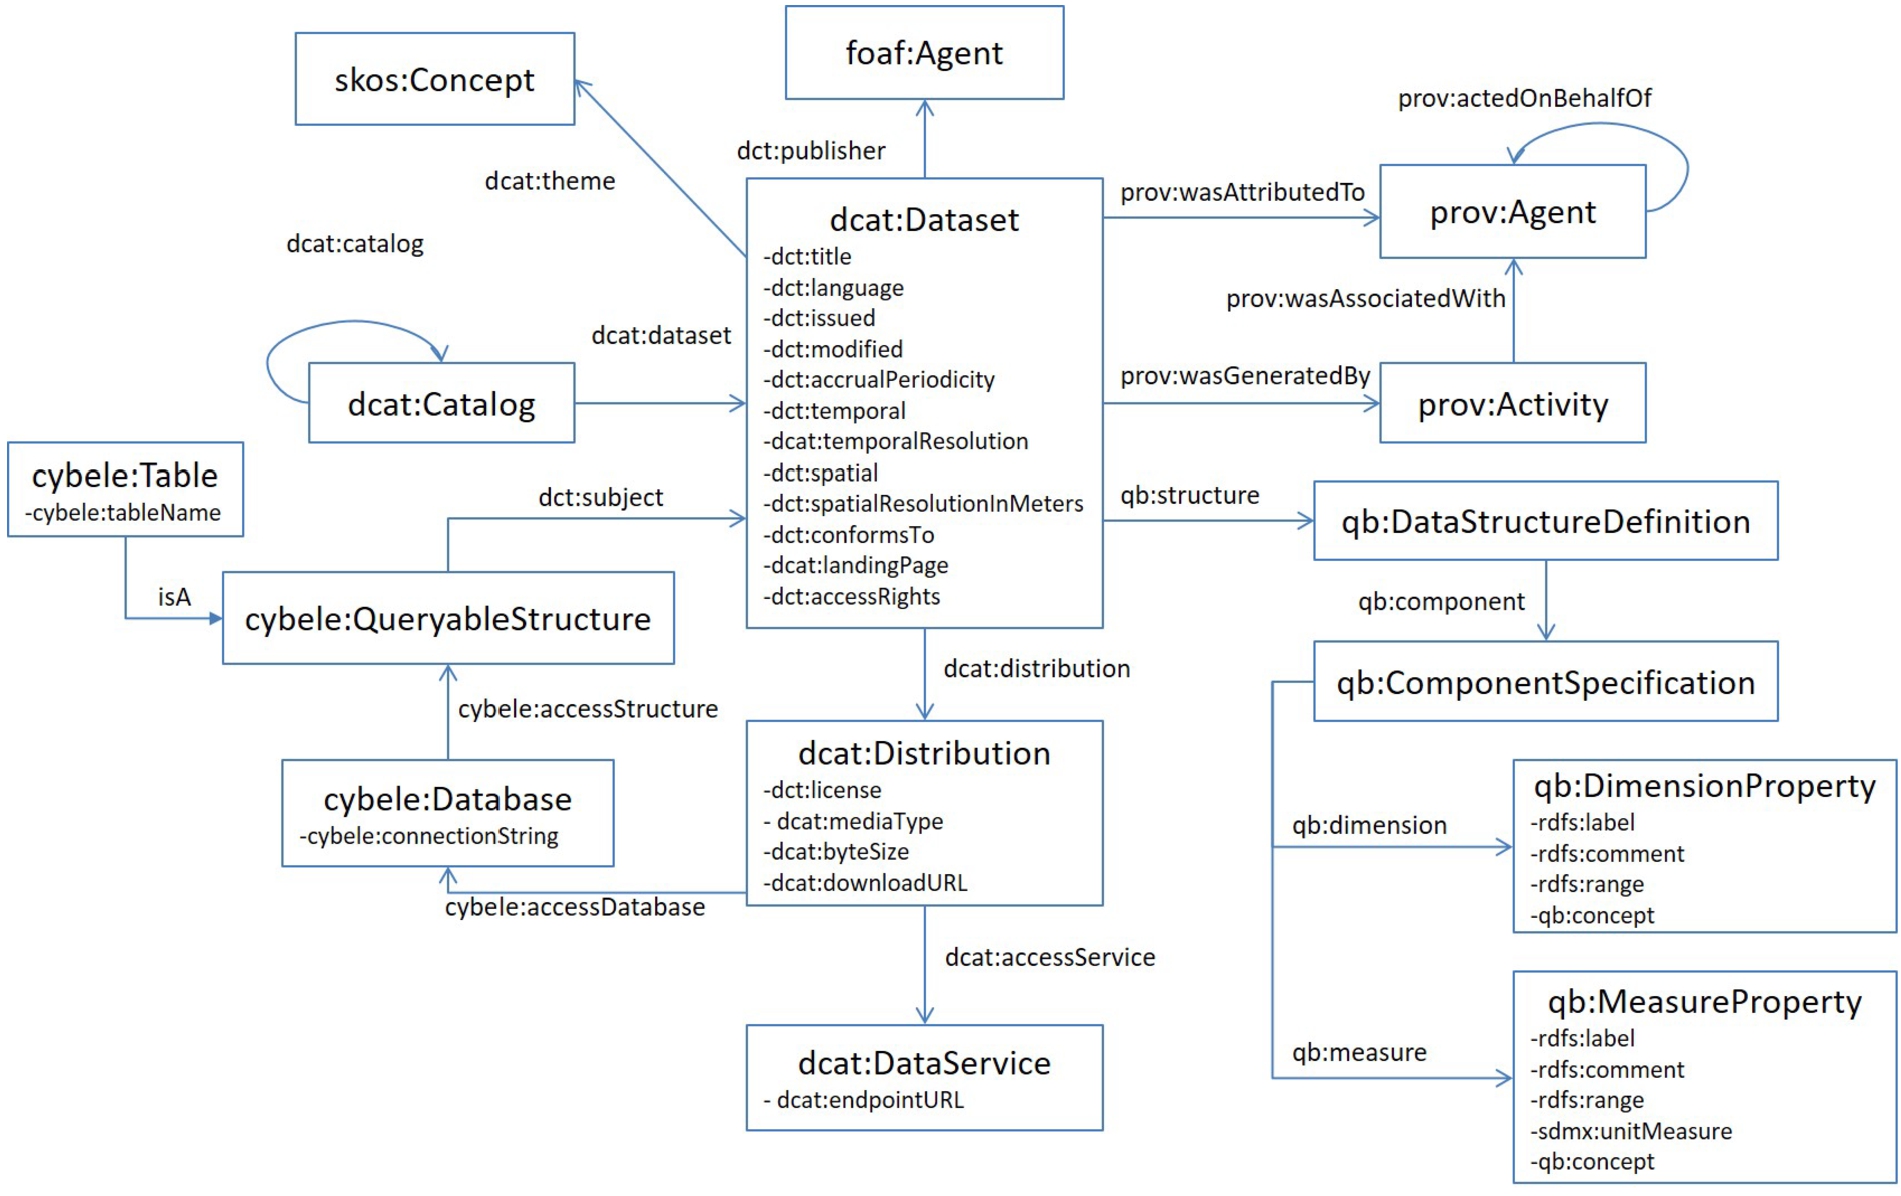
The main classes of the model are: i) the Dataset, that is a collection of data published by a specific publisher (person or organization), ii) the Catalog/Repository, that is a collection of metadata about Datasets, iii) the Activity, that represents the way/method the Dataset was generated involving Agents e.g., human, sensor, iv) the Distribution, that represents an accessible form of a Dataset e.g., downloadable file, Data Service, Database and v) the Structure, that includes structural information of Datasets (Dimensions and Measures). The complete model is depicted at Fig. 2
Each of these main classes have extra properties. For example the Dataset has properties including the Theme (e.g., pig farming), Language, Issuing/Modification date, Update frequency, Spatial/Temporal coverage, Spatial/Temporal resolution, Access rights, Standard and Web page. These properties of the dataset can be used for data discovery and exploration e.g., identify data about pig farming.
In order to define the structure of a dataset including the Dimensions (e.g., time) and Measures (e.g., temperature), the model uses the classes qb:Dimension Property and qb:MeasureProperty and the relevant properties qb:dimension and qb:measure. However, the qb:dimension and qb:measure properties have the qb:ComponentSpecification as domain and they cannot be used directly at the dcat:Dataset. Thus, the model includes also two auxiliary classes from the QB vocabulary the qb:ComponentSpecification and the qb:DataStructureDefinition, the later representing the structure of the dataset. The association of the dataset with its structure is done through the property qb:structure. The use of this property on an individual entails that it is a member of the class qb:Dataset. So, the datasets should also be members (isa) of the class qb:Dataset.
The definition of the dataset’s structure accompanied with the definition of access metadata for datasets which are distributed through a database (cybele:Database, cybele:QueryableStructure) enables the formulation/execution of queries (e.g., SQL). More specifically, the formulation/execution of queries can be done as follows:
– Information about the database where the dataset is stored and the way to connect to the databases is provided through the cybele:Database.
– Information about the structural construct where the dataset is stored is provided through the cybele:QueryableStructure. For example at relational databases this can be a cybele:Table.
– Information about the cybele:QueryableStructure schema is provided through the structure of the dataset (qb:DataStructureDefinition). In this case, the label of the qb:DimensionProperty or the qb:MeasureProperty should map with the corresponding fields of the cybele:QueryableStructure where the dataset is stored. For example if the label of a qb:DimensionProperty is “Geography” then the same name should be used at the schema of the cybele:QueryableStructure.
In case that a dataset is not distributed through a database but is available as a download file or through an API, other modeling options should be followed. Specifically, if the data is available as a download file, then the property dcat:downloadURL of the class dcat:Distribution should be used, while if the dataset is distributed through an API then the property dcat:endpointURL of the class dcat:DataService should be used.
Finally, the provenance metadata of the dataset are provided through the classes prov:Activity and prov:Agent. The first defining the activity that generated the dataset, while the secong defining the agent that is involved at the generation of the dataset. The association of these classes with the dataset requires that the dataset is also member (isa) of the class prov:Entity
Fig. 2.
Semantic model for precision agriculture and precision livestock farming.
5.2.Formalising the model as a profile of DCAT
Whenever a “general-purpose” standard model (e.g., DCAT) is applied to an application domain (e.g., agriculture), a set of implementation choices are made. This set of choices can be explicitly named and described as an “application profile” of the standard model. This paper proposes a semantic model implemented as an application profile of DCAT for the agricultural domain. The specific implementation choices of the proposed model are related to the:
– Optional elements of DCAT that are mandatory at the proposed model.
– Additional constraints and rules that are applied to the proposed model.
– Controlled vocabularies that should be used as the range of properties.
For example, the use of the qb:DataStructureDefinition to describe data structure is not part of DCAT, but allowable under the semantic modelling approach. To effectively profile DCAT Datasets to allow the qb:sructure property to link to qb:DataStructureDefinition, a SHACL constraint was used:
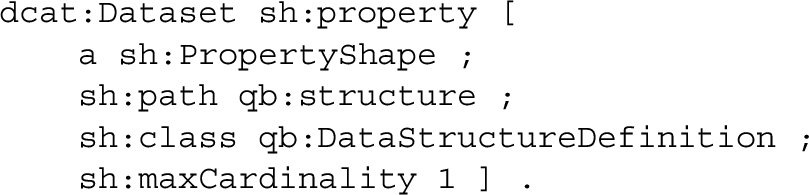
An important aspect of defining a profile is to be able to make statements about use of a generic property, without fundamentally altering the semantics of that property in a way which would preclude two different models from co-existing. By making statements using SHACL, the domain of application of the SHACL rules can be managed independently of the original model (i.e DCAT) enabling the combination of models without introducing conflicting statements.
The previous example could have been expressed in OWL using dcat:Dataset owl:equivalent Class qb:Dataset or by dcat:Dataset dfs:subClassOf qb:Dataset. This however would mean that another system with different expectations about DCAT datasets would potentially fall foul of expectations about qb:Datasets. It would also require application of OWL and/or RDFS reasoning across the entire combined model, whereas the SHACL constraints can be applied only when circumstances apply (via either additional filter conditions or business logic about what rules to apply, and when).
Additionally, regarding the controlled vocabularies, AGROVOC [18] is a good candidate to be used for the dcat:theme of datasets since it is a standard largely oriented towards the agricultural and livestock farming sectors. For example, the URI <http://aims.fao.org/aos/agrovoc/c_14477> correspond to “soya beans” and can be used as a theme of datasets related to soya cultivation. Other controlled vocabularies could also be used.
The proposed model is an application profile of DCAT, but also re-uses other standard vocabularies including the QB vocabulary, PROV-O, SKOS, FOAF and DC Terms. The relationship of the model to other standards is expressed using the PROFILES vocabulary [3] as shown in the following RDF code.
Note that each of the vocabularies used by the model have a “proxy” profile generated for it (e.g., https://w3id.org/cybele/proxy/foaf) in order to allow the referenced models to be accessed with a set of implementation resources describing which parts of these models are used. The next section further discusses the principles of open and stable access to model resources. 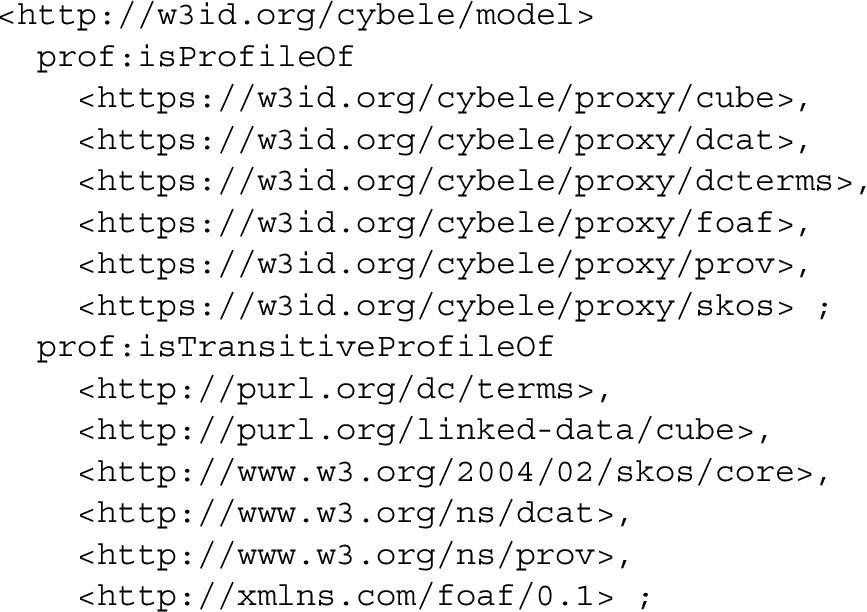
5.3.Publication of the model using FAIR principles
The FAIR principles (“Findable, Accessible, Interoperable, Reusable”) provide a basis for model publication requirements to support interoperability in a domain over time. Reusability is dependent on stability, and a stable home for such models is predicated on the semantic relationships between the model and the available governance and resourcing models in the domain. In this case, the semantic model proposed in this paper describes interoperability constraints for spatio-temporal data and conveniently falls under the interest domain of the Open Geospatial Consortium (OGC). This has represented a valid challenge to the OGC’s own development of Linked Data publication approaches, and hence has been used to drive additional Linked Data infrastructure to support the nexus between OGC activities and the wider community of implementers of OGC specifications. The result was the development of the “OGC Definitions Server” that is a semantic publishing framework applying the FAIR principles.
The community node of the “OGC Definitions Server” provides a catalog of profiles and is maintained as an interoperable adjunct to its normative Linked Data published content. Interaction with the server is seamless via URI redirection, while browse and search options, and potentially various UI theme styles, for each node is distinct.
The semantic model proposed in this paper and the supporting implementation resources (e.g., “proxy” profiles of existing vocabularies) are published through the “OGC Definitions Server” using a combination of Linked Data technologies, APIs and relevant open standards. The published model is made available through a dereferenceable URI: http://w3id.org/cybele/model.
Various alternative representation of the model are available and can be accessed via the URI of the model using “Content negotiation by profile” (e.g., http://w3id.org/cybele/model?_profile=owl). The alternative model representations are:
– The “SKOS Concept Scheme” contains a representation of all the models’ concepts in a hierarchical way.
– The “Class Diagram” provides an overview diagram of the model.
– The “JSON-LD” representation of the model.
– The “JSON Schema” view of the classes and properties of the model.
– The “FeatureType” representation that uses the ISO19109 meta-model.
– The “OWL” representation that contains all profile-specific statements and all the statements from the imported vocabularies needed for a self-contained model.
– The “SHACL” representation contains a set of constraints describing the profiled classes in the model. This provides additional detail about constraints often only available implicitly.
This approach can be further extended to support interoperability between related domains by “factoring out” specific reusable profiles of the base standards. The two identified as priorities for reuse across other domains of applicability are:
– “DCAT-QB” – a profile of DCAT aligned to the RDF Datacube (QB) vocabulary allowing QB descriptions of the structure of datasets.
– “DCAT-PROV” – a profile of DCAT aligned to the Provenence (PROV-O) vocabulary allowing descriptions of the provenance of datasets.
These profiles are published as resources in the OGC Definitions Server as experimental resources – at http://www.opengis.net/def/metamodel/profiles/dcatqb and http://www.opengis.net/def/metamodel/profiles/dcatprov. Work is currently underway to expose the details of the constraints they impose using SHACL, and these will be refined in additional contexts before being promoted to the https://w3id.org namespace.
This profile hierarchy mechanism becomes a powerful means to incrementally establish and declare practical domains of interoperability as integration across multiple domains is considered. The semantic modelling work described here may be quite simple but the application of principles of re-use and modularity extend common practices of aggregation of model elements to support as a basis for improving interoperability through declaration of the scope of that reuse.
The publication of the model according to the FAIR principles addresses the most common barrier to reuse of common models in that they are not necessarily directly accessible, and discovery of the resources needed to implement them is often difficult. It also provides an opportunity to easily compare the model with other application domains and determine the extent of shared usage and hence interoperability.
Finally, in order to understand how similar agriculture and livestock farming datasets may be compared and be interoperable is a complicated task. It requires comparison of the details of each dataset, which may be serialised in many different forms, and distributed across a range of imported or implicitly referenced resources. To solve this problem and facilitate the comparison of agriculture and livestock farming datasets, the datasets could declare conformance to the proposed model. Thus, a statement such as <DATASET_URI> dct:conformsTo <http://w3id.org/cybele/model> can be made to more accurately describe the interoperability of datasets.
The conformance to the model is implemented through the use of the model to describe the dataset’s metadata. The conformance is not related to the actual data of the dataset, but is in the level of metadata. In this way, a minimum understanding can be achieved that enables the comparison of different datasets used in precision agriculture and livestock farming.
Fig. 3.
The role of the semantic model.
6.Application of the model
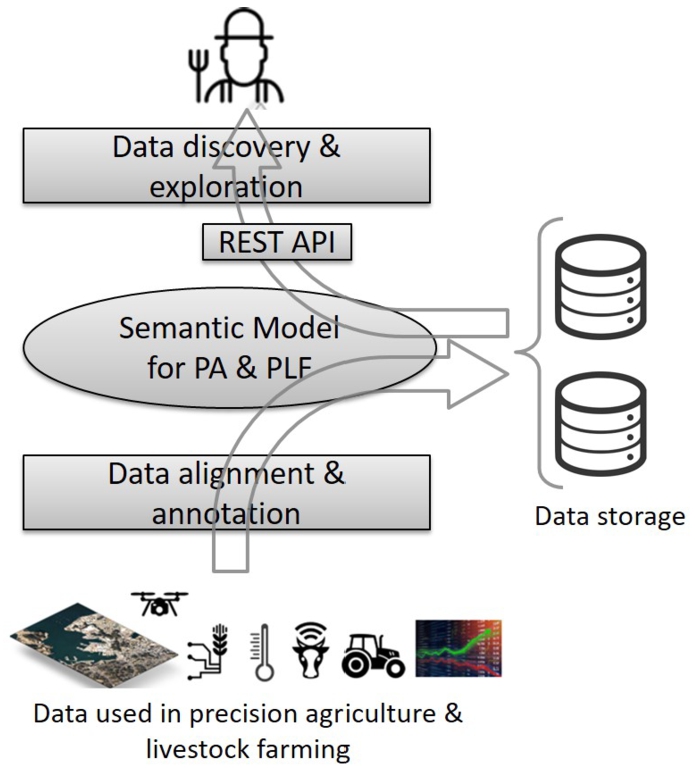
This section applies the proposed model at the cases for precision agriculture and livestock farming presented at Section 4.1. The application of the model was conducted in the context of the CYBELE project where the role of the model (Fig. 3) was to act as a central artifact to drive the development of an ecosystem of applications related to:
– Data alignment: a component has been developed that maps the structure of the datasets to the model in order to facilitate their interoperability. In this way, heterogeneous data coming from different cases or data providers can be harmonized and processed together. The mapping is done through a common set of dimensions/measures44 that have been defined for precision agriculture and livestock farming.
– Annotation: a component has been developed that enables the semi-automatic generation of metadata like those presented at Section 6.1.
– Discovery/exploration: a component has been developed that enables the exploration of datasets, the generation of queries (e.g., SQL) based on the metadata and the integrated view of datasets. This component is supported by a semantic REST API (Section 6.3) that is built on top of the model and facilitates the data exploration. The API is implemented base on SPARQL queries like those presented at Section 6.2.
The complete description of the above components and their architecture is out of the scope of this paper.
In a nutshell, the model enables the uniform annotation and alignment of data, thus enabling their interoperability and integration. The data could reside at different data storages, however the alignment and annotation provided by the model enables the identification of datasets from different data storages that can be integrated as well as their integrated processing through e.g., federated queries.
The rest of section is organized as follows, Section 6.1 introduces some agriculture and livestock farming datasets and demonstrates how these can be described using the semantic model. Section 6.2 presents examples for data retrieval using SPARQL queries over data generated and stored based on the model, while Section 6.3 introduces the semantic REST API.
6.1.Applying the model at domain datasets
Dataset 1 (case 7): a time series dataset about the feeding process in a farm in Belgium for the day 02/02/2019. The dataset is published by the Flanders Research Institute for Agriculture, Fisheries and Food (ILVO) on 24/03/2021 as a CSV file and is distributed through a relational database (the CSV is inserted at the database using a dedicated software component). The data about individual pigs are automatically collected through sensors (namely sensorA100 and sensorC205) located at the feeding station of a barn. The feeding station contains a platform weighing scale to measure the pig body weight, a feeding tray with weighing scale that measures the content of the feeding tray and an RFID antenna that registers the identity of the pig in the feeding station by scanning its RFID ear tag. One line of data is provided per feeding visit.
The structure of the dataset comprises the following fields: i) Location – the feeding location inside the barn e.g., pen number, feeding station number, ii) Responder – the pig RFID identifier), iii) Animal number – a short pig identifier iv) Life number – an optional additional pig identifier, v) Time – the timestamp of the beginning of the feeding visit, vi) Duration – the duration of the feeding visit in seconds, vii) Feed intake – the amount of feed provided during feeding visit (precision 1 gram) and viii) Weight – median of pig weights measured during feeding visit (precision 500 grams).
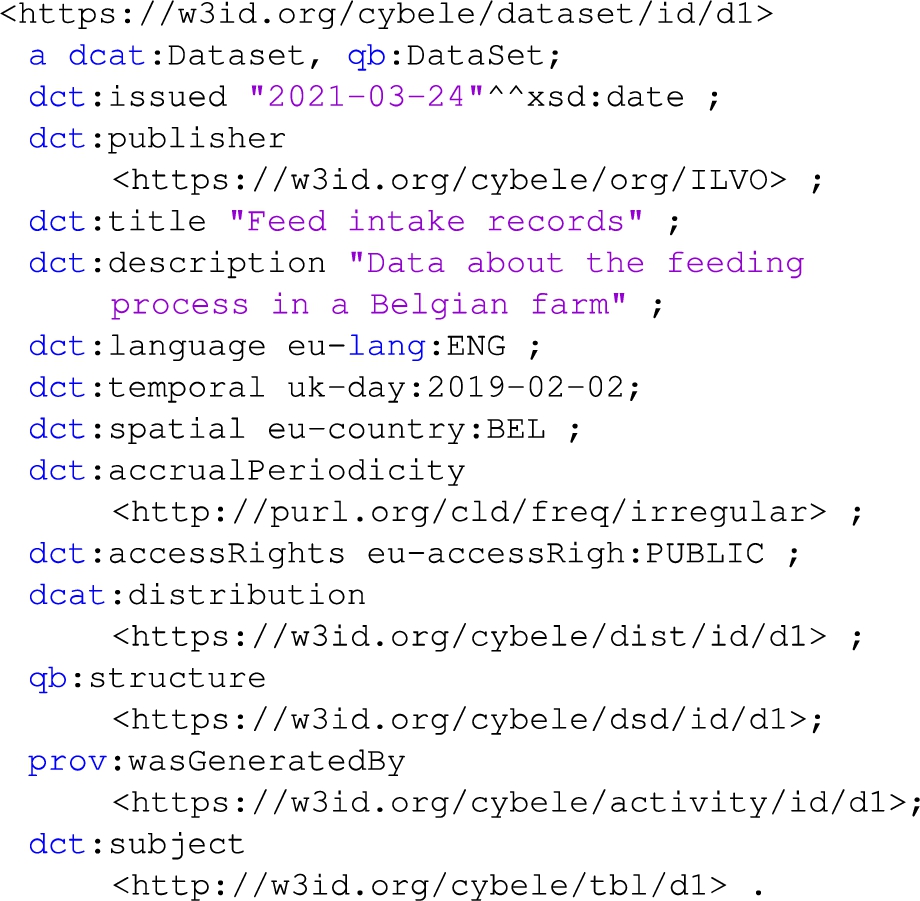
Listing 1 presents some general descriptive metadata for the dataset e.g., the publisher, date issued, title, language. Some of the metadata use primitive values (e.g., date, string) while other use URIs to link to concepts defined at controlled vocabularies (dct:spatial, dct:language, dct:accessRights, dct:accrualPeriodicity) or to link to complex structures within the dataset description (e.g., dct:temporal, qb:structure). The controlled vocabularies used are defined by the European Union.55 The examples use the prefixes eu-lang, eu-country, eu-accessRight, eu-license, eu-fileType for the code lists defined by the European Union that correspond to the language, country, access rights, license and file type accordingly. The temporal coverage is defined using the reference.data.gov.uk Time Interval vocabulary (the example uses the prefix uk-day).
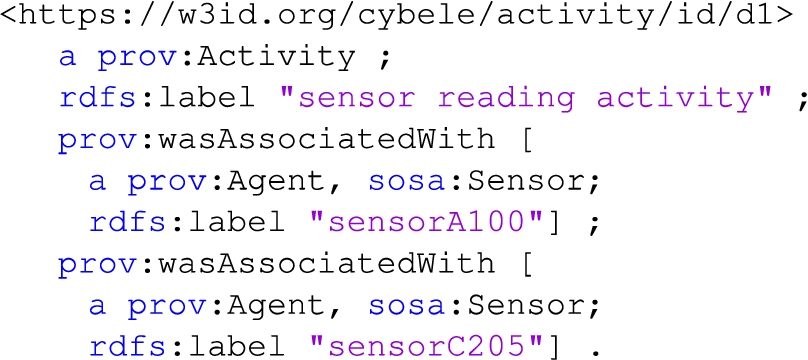
Listing 2 defines the Dataset 1 provenance information, namely the sensor reading activity that generated it, along with the sensors (sosa:Sensor) used to carry out this activity. Note that sosa:Sensor is defined at the SSN ontology as a subclass of prov:Agent.
Listing 1.
Dataset 1 general description
Listing 2.
Dataset 1 provenance information
Listing 3.
Dataset 1 distribution through a database
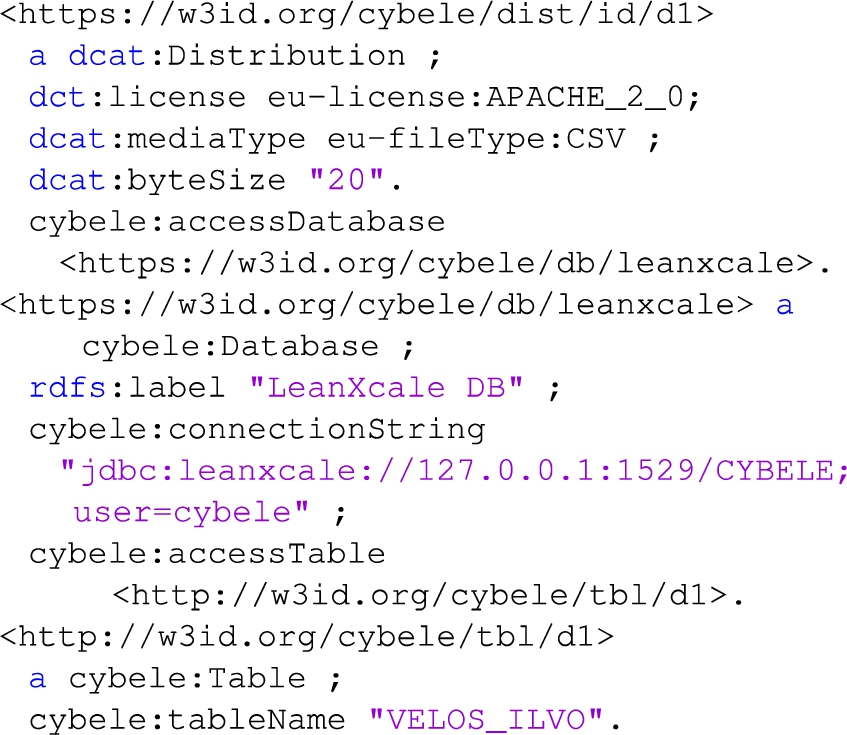
The dataset is stored and made accessible through a database. Listing 3 defines information about the distribution (e.g., dct:license, dcat:mediaType), the specific database (cybele:Database) and table (cybele:Table) where the dataset is stored. For the license and format values the description uses predefined controlled vocabularies defined by the European Union. The definition of all the available tables at the database is done through the property cybele:accessTable. The example uses only one table, however more tables may exist. The association of the dataset to the specific table where a dataset is stored is done through the property dct:subject of the dcat:Dataset.
Listing 4 defines partially the structure of the dataset. For space reasons, only two dimensions (location and time) and one measure (feed intake) are defined. The definition of the rest dimensions/measures can be done in a similar way. In order to enable the generation and execution of queries based on the metadata, the label (rdfs:label) of the dimension/measure should be the same as the corresponding field at the database where the dataset is stored. For example, the field that stores the feed intake at the database table should use the name “feed_intake”. The range (rdfs:range) of dimensions and measure (e.g., xsd:dateTime, xsd:int) is also defined in order to facilitate the processing of the data. Additionally, the unit of measure (sdmx-attribute:unitMeasure) is defined in order to facilitate the transformation of data to other metric systems or granularities (e.g., transform kilograms to grams or pounds).
Listing 4.
Dataset 1 structure (partial)
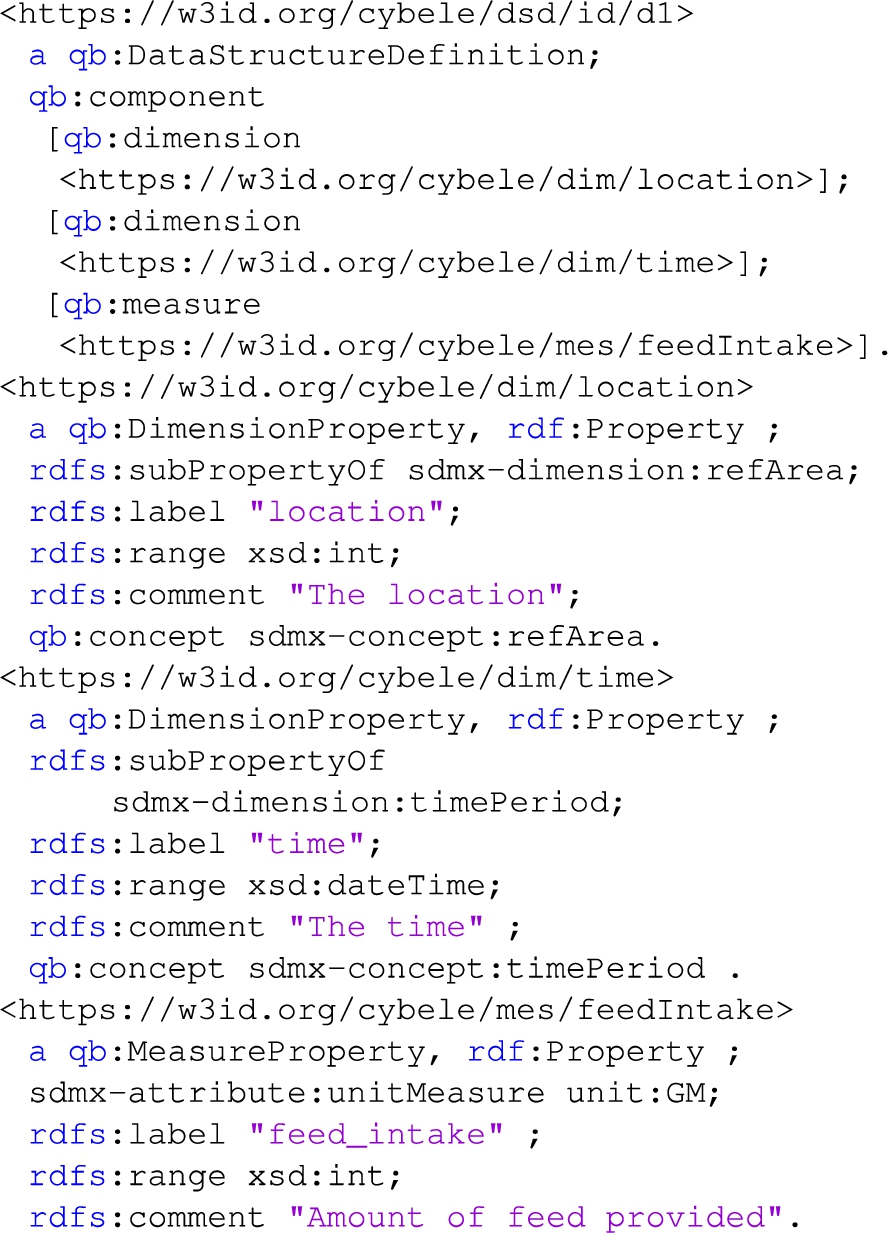
The presented dimensions/measures are the aligned ones that occur after mapping the original data to the common set of dimensions/measures. For example, the original CSV data contains the column “visit_time” that is mapped to the dimension “time”. In this way heterogeneous data (e.g. from other data providers) that have a time dimension but use different naming conventions are aligned and can be processed together. Additionally, the data are aligned in terms of unit of measurement. For each measure in the common set a “standard” unit is defined and all data should be aligned to it. For example, the feedIntake “standard” unit is the gram, thus all relevant measurements should be transformed to grams during the alignment.
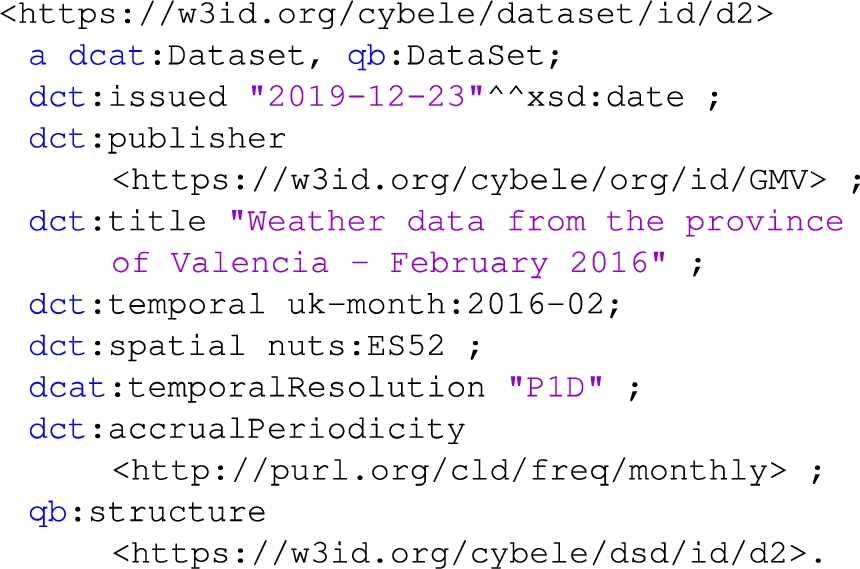
Dataset 2 (case 3): contains weather data at the granularity of day captured by an Agri-climatic station in the province of Valencia, during the period 01/02/2016–29/02/2016. The dataset is published by GMV Aerospace and Defence company in Spain on 23/12/2019 and is updated monthly. The dataset is available in CSV format and contains dimension and measures including: i) IdProvincia (province identifier), ii) Time of observation, iii) TempMax (max air temperature) and iv) HoraTempMax (time of max air temperature). The dataset contains more measures (e.g., moisture) that are omitted for space reasons.
Listing 5 presents some general descriptive metadata for the dataset. In this dataset the temporal coverage (February 2016) is defined using the reference.data.gov.uk time interval vocabulary (the example uses the prefix uk-month). The temporal resolution (i.e. the minimum time resolvable in the dataset) is the “day” that is expressed through the string “P1D” which follows a specific format defined by the xsd:duration. The update rate (dct:accrualPeriodicity) of the dataset-as-a-whole is the “month” that is expressed using the Dublin Core Collection Description Frequency Vocabulary.66 The spatial coverage is defined using the NUTS classification77 (Nomenclature of territorial units for statistics) that is a hierarchical system for dividing up the economic territory of the EU (Valencia corresponds to the code ES52).
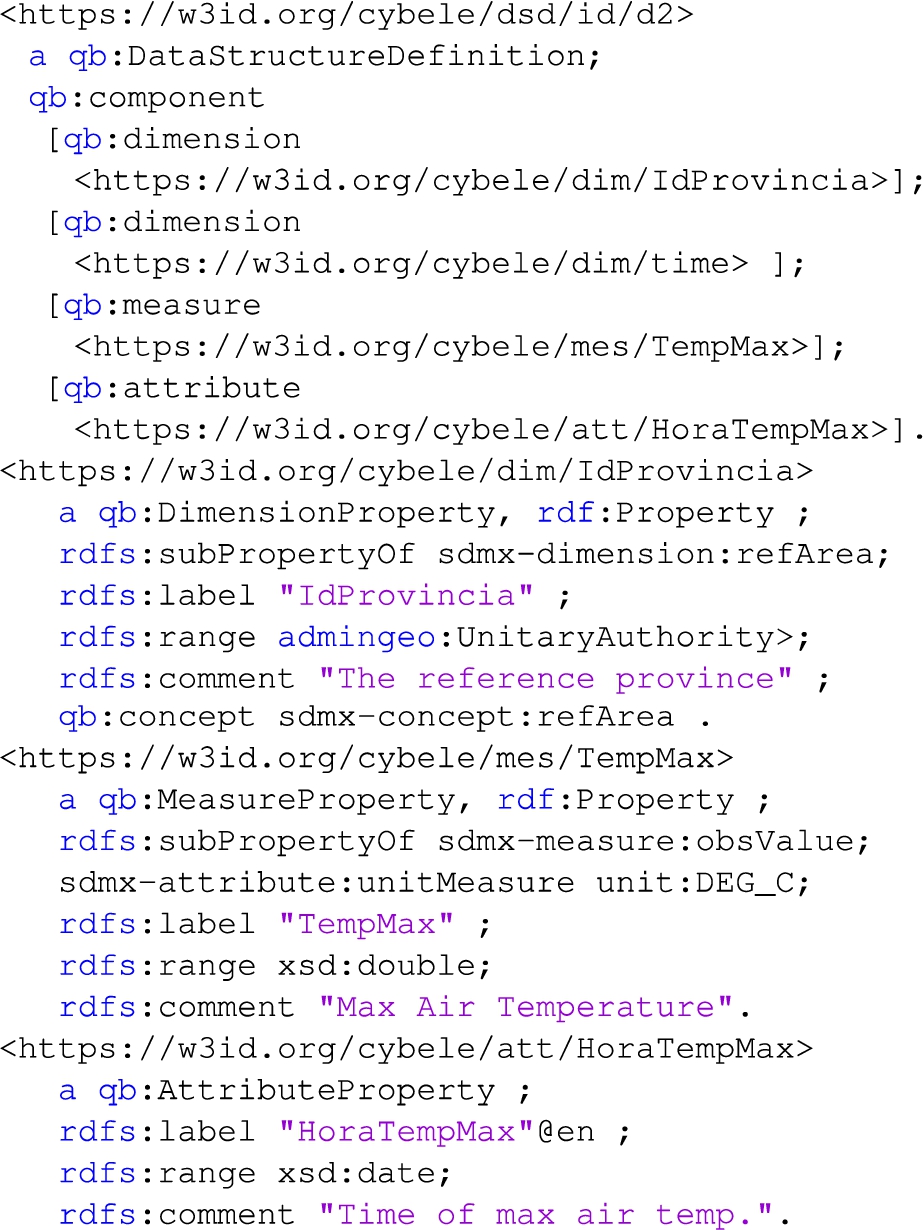
Listing 6 defines partially the structure of the dataset. Two dimensions, one measure and one attribute are used. The time dimension URI is the same as the one used at listing 4 in order to facilitate the interoperability between datasets. However, the URIs used for the geographical dimensions are not the same since they have different ranges (rdfs:range). The range of the dimension “IdProvincia” is the “Unitary Authority” as defined by the “Administrative geography and civil voting area ontology”,88 while the range of the dimension “location” at listing 4 is int (e.g., feeding station number). In this case, interoperability is achieve indirectly by defining both dimensions (IdProvincia, location) as sub-properties of the sdmx-dimension:refArea and by associating them with the same concept (sdmx-concept:refArea). The attribute “HoraTempMax” is used to define the time of max air temperature. In a similar way attributes can be used to associate the aggregated values of measures such as min or max within a specific time period e.g., day, month, year.
Listing 5.
Dataset 2 description
Listing 6.
Dataset 2 structure (partial)
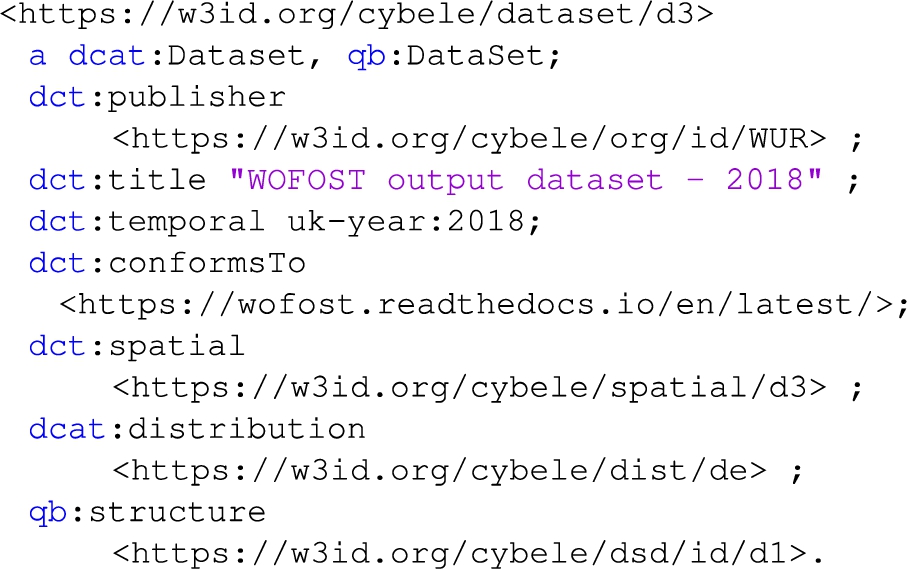
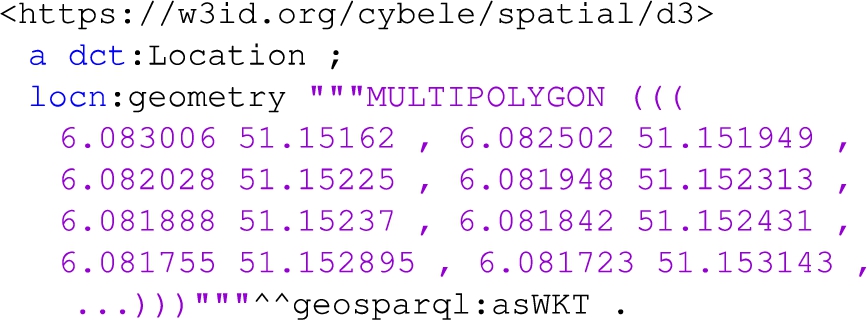
Dataset 3 (case 5): the organization Wageningen University & Research (WUR) has published a dataset with the output of the crop simulation WOFOST (WOrld FOod STudies) model that performs quantitative analysis of the growth and production of annual field crops. The model has run for a specific field (with ID 7977923) with maize crop in Netherlands for the year 2018. In this example the spatial coverage corresponds to the geometry of the field 7977923, which is provided in a WKT format [35]. WKT supports geospatial positions expressed in coordinate reference systems. The description of the dataset structure is omitted, as it is similar to the examples above.
Listing 7 provides the general description of the dataset. The temporal coverage of the dataset (2018) is defined using the reference.data.gov.uk controlled vocabulary, while the spatial coverage is defined at the listing 8. The dataset is the output of the WOFOST model, thus it conforms (dct:conformsTo) to the structure formally defined by the model.
Listing 7.
Dataset 3 description
Listing 8 provides the spatial coverage of the dataset that is defined as a dct:Location which in turn is associated (locn:geometry) with the WKT polygon.
Listing 8.
Dataset 3 spatial information description
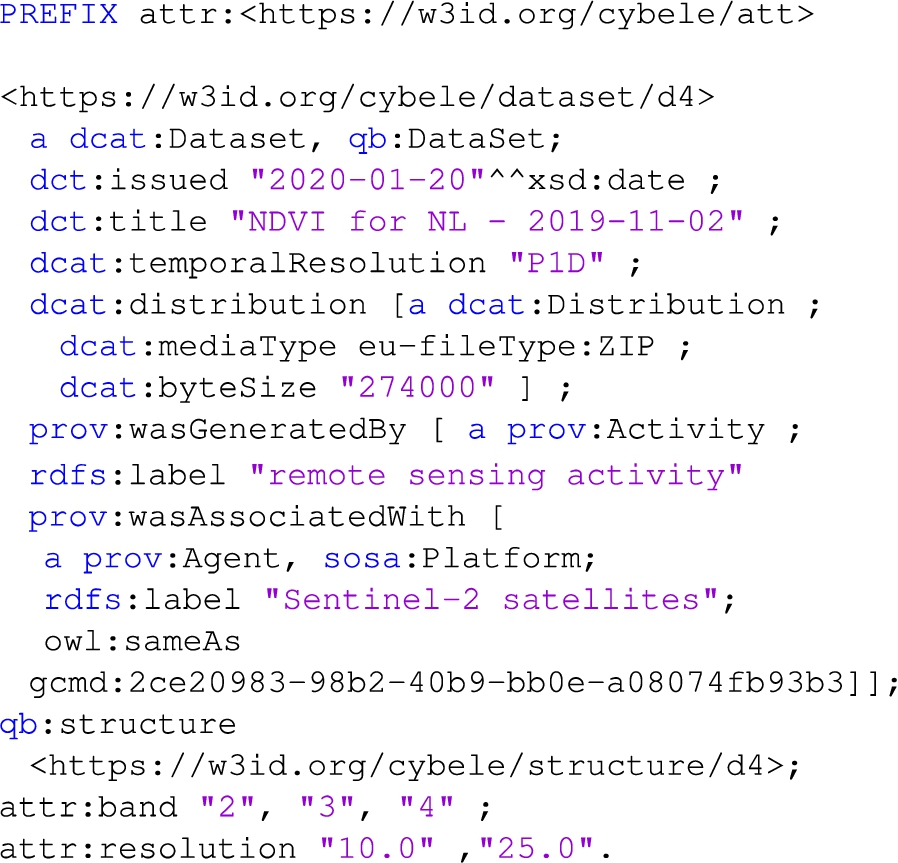
Dataset 4 (case 5): the organization Wageningen University & Research (WUR) has published a dataset with the Normalized Difference Vegetation Index (NDVI) for some areas in the Netherlands for a particular day in 2019. NDVI [46] is an index produced by satellite images and can be used to estimate the density of green on an area of land. Low values of NDVI correspond to barren areas (rock, sand, snow), moderate values represent shrub and grassland, while high values indicate tropical rainforests. The dataset is distributed as zip file with a few Sentinel 2 satellite images (bands 2, 3, and 4), and derived Normalized Difference Vegetation Index (NDVI) (at 10m and 25m resolution), in GeoTIFF format. To describe this dataset we will use the QB extension for Earth Observation data (qb4st)99 that allows to represent geospatial raster data in QB.
Listing 9 presents the general description of the dataset. Some interesting remarks include the use of custom qb:AttributeProperties that are defined in the dataset structure (e.g., bands, resolution) and are attached directly at the dataset. The satellite is modeled as a sosa:Platform that can host other entities e.g., sensors, and references the Global Change Master Directory (GCMD) controlled Earth Science vocabularies. Additionally, the provenance information defines the remote sensing process carried out that produced the images from which the NDVI values were derived.
Listing 9.
Dataset 4 description
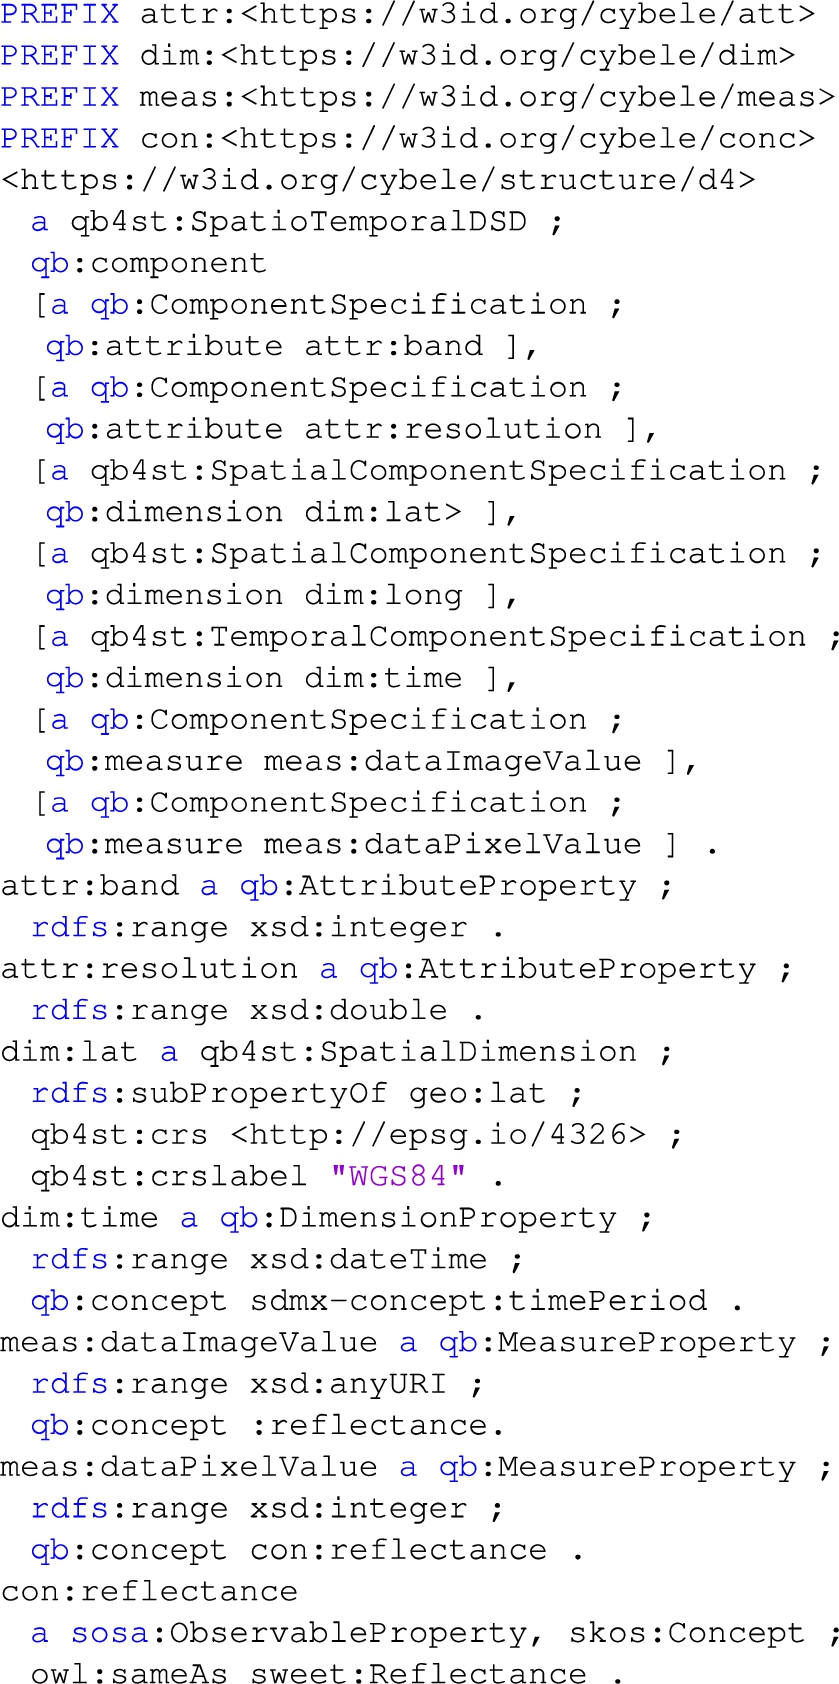
Listing 10 is the partial Dataset 4 structure. The structure uses several concepts from qb4st, which allow to model detailed information of the raster data.
Listing 10.
Dataset 4 structure
6.2.Data discovery using SPARQL queries
This section presents some data discovery and exploration SPARQL queries that can be created based on the model and the dataset descriptions provided at the previous sub-section. Note that one of the key advantages of having such rich metadata about datasets is to allow the semantic integration of data from different sources. For instance, based on the structure information, we could find datasets having a common (sub-)set of dimensions that could be integrated (see Query 3).
The queries can be tested directly at the SPARQL endpoint that hosts the generated data: https://www.foodie-cloud.org/sparql.
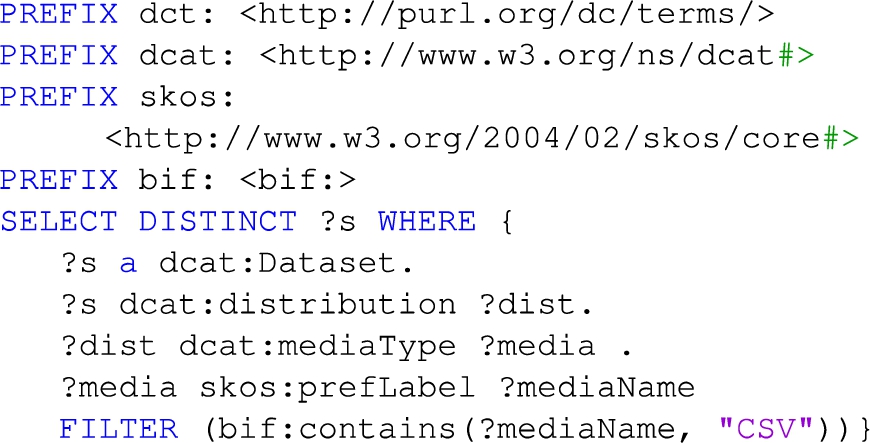
Query 1: retrieves all datasets distributed in CSV format. This query can be used for data exploration e.g., for applications that can process specific file formats. The query searches at the name of the format the string “CSV”. An alternative would be to search using a predefined URI from a code list e.g., eu-fileType:CSV. See Listing 11.
Listing 11.
Query 1: retrieves all datasets distributed in CSV format
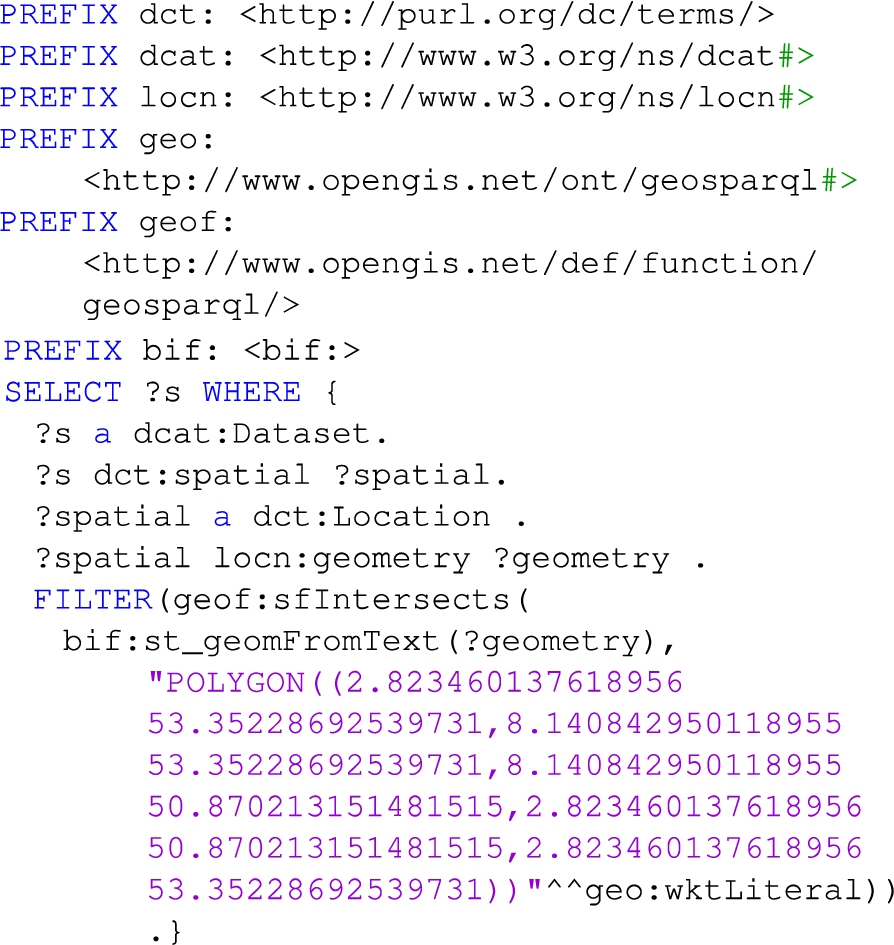
Query 2: retrieves all datasets with spatial coverage intersecting a particular polygon. This query is applicable to datasets with spatial coverage expressed as polygons (e.g., Listing 8) and can be used for data exploration e.g., identify datasets for a specific area of interest. See Listing 12.
Listing 12.
Query 2: retrieves datasets with spatial coverage intersecting a particular polygon
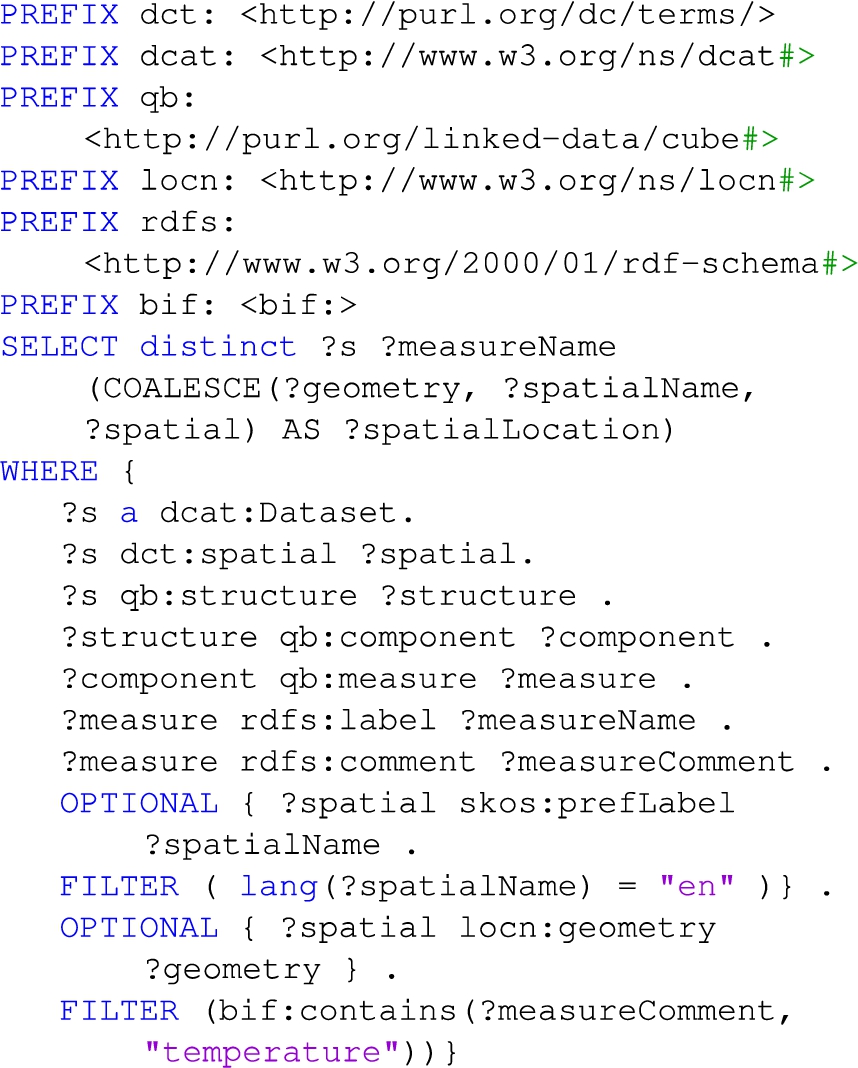
Query 3: retrieve all datasets that measure temperature (e.g., max/min air temperature, sea temperature) and show the name of the measure and the spatial location associated (which can be a named place or some geometry). The query searches at the comment of the measure the string “temperature” in order to identify all temperature-related measures. An alternative would be to search using a URI e.g., https://w3id.org/cybele/mes/TempMax but in this case only datasets that measure the max air temperature would be returned. This query can be used for fine-grained data discovery and exploration based on the dataset structure. See Listing 13.
Listing 13.
Query 3: retrieves all datasets that measure temperature
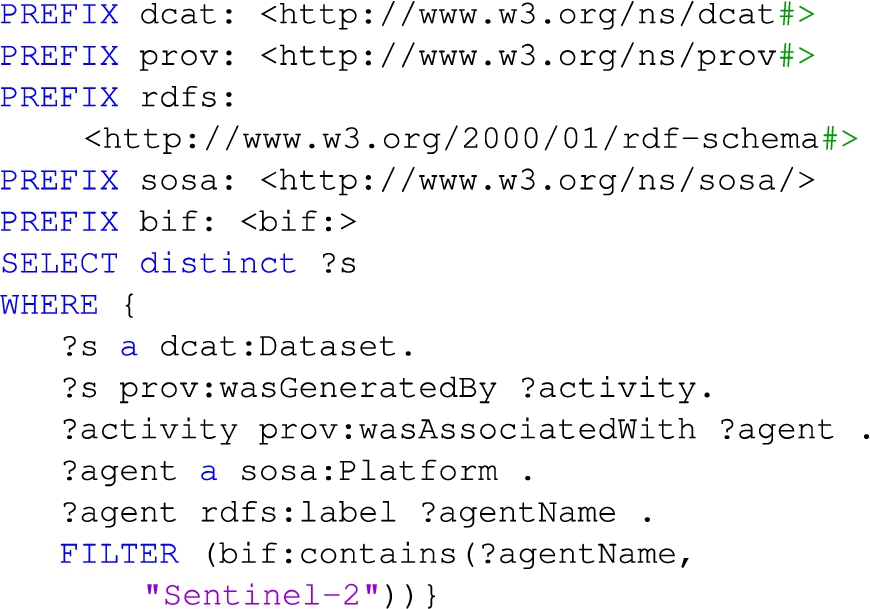
Query 4: retrieve all datasets that were generated by SENTINEL-2 satellites. The query searches the string “Sentinel-2” at the name of the sosa:Platform responsible for the generation of the dataset. See Listing 14.
Listing 14.
Query 4: retrieves all datasets that were generated by SENTINEL-2 satellites
6.3.Semantic REST API
The native language to access the RDF data generated based on the model is SPARQL. However, in order to facilitate the access and consumption of data to other components/services a REST API is also provided that returns JSON. The REST API is implemented using GRLC1010 that translates SPARQL queries stored in a Git repository1111 to a REST API on the fly.
The functionality of the API includes: i) GET /allDatasets: the retrieval of information about all the datasets, with full structure and including information of referenced resources, ii) GET /getByKeyword: the retrieval of information about datasets that contain a specific keyword (e.g., “greece”) in any of their labels, iii) GET /getDatasetStructure: the retrieval of structural information about a particular dataset, iv) GET/getDatasetSpatialInfo: the retrieval of spatial information about a particular dataset and v) GET/getDatasetDBDistribution: the retrieval of the database distribution information of a particular dataset.
Datasets may be registered at different catalogs (dcat:Catalog). The API supports the use of multiple catalogs enabling the retrieval of information across all of them (using federated queries) or from a specific one. For example, the API contains a method that enables the retrieval of all information of datasets that belog to a specific catalog.
All methods of the API can be accessed and tested via the Swagger interface: http://grlc.io/api-git/cybele-project/metadata/ (At the Swagger interface the term “Testbet”is used as an alias to the catalog).
7.Conclusion and discussion
As the global population is growing, there is a push to agriculture and livestock farming domains to be more effective and efficient. Towards this direction, they make intense use of data coming from numerous heterogeneous sources (e.g., sensor data, weather/climate data, statistical & government data, drone/satellite imagery, video, and maps) in order to provide insights and drive operational decisions through precision agriculture and precision livestock farming. However, a further boost can be given to precision agriculture and precision livestock farming if data from heterogeneous sources could be exploited together.
Towards this direction, this paper studies nine real cases at the domains of agriculture, livestock farming and aquaculture in order to identify the data characteristics and requirements at the domain. On-wards the paper proposes a semantic meta-model for defining adequate metadata in the domain. The meta-model is based on the W3C standards DCAT, PROV-O and QB in order to facilitate the discovery, exploration, integration and accessing of data.
Although the existing vocabularies can individually express most of the model’s concepts there is no single model that can address all the requirements. For example, there is no property to associate a dcat:Dataset with the measures it contains. StatDCAT defines a property to associate only the dataset dimensions, while the QB vocabulary defines the property qb:measure that however is not applicable to dcat:Datasets. Towards this direction the paper proposes a “merging” of the DCAT and the QB vocabularies by associating a qb:DataStructureDefinition at the dataset. This merging is done through the definition of domain specific SHACL constraints that can be managed independently of the original model (i.e DCAT), thus it does not fundamentally alter the semantics of the original model.
The proposed model currently enables the definition of dimensions (qb:DimensionProperty) and measures (qb:MeasurePoroperty). The use of attributes (qb:AttributeProperty) is also possible through the QB vocabulary. The paper presents an example use of attributes (Listing 6) however this potential is not fully explored, thus the qb:AttributeProperty is not part of the proposed model but could be possibly added in the future.
In a similar way, a “merging” of DCAT with PROV-O is proposed in order to allow the definition of provenance metadata for the datasets.
Additionally the model defines concepts (cybele: QueryableStructure, cybele:Database, cybele:Table) that facilitate the access and querying of data stored at databases. The model has already been tested using structured data that are stored at relational databases, however its design is open for supporting more structured or semi-structured data (e.g. JSON) that are stored at different types of databases e.g., noSQL or Graph databases. Such an extension will enable the generation and execution of queries at more types of databases based on the provided metadata. The use of different types of databases will also raise issues of integration among them that could be settled by following linked data approaches to transform or query on the fly different sources in an integrated manner.
The proposed model has been tested and demonstrated within the CYBELE H2020 project at the domains of agriculture and livestock farming in order to achieve interoperability and homogenized access to data sources. However it could also be exploited in other domains that have similar data and requirements. The model extends DCAT by enabling the definition of structural metadata (association with the QB vocabulary) and provenance metadata (association with PROV-O ontology). The definition of such metadata could also be beneficial for other domains too.
Notes
Acknowledgements
Part of this work was funded by the European Commission within the H2020 Programme in the context of the project CYBELE under grant agreement no. 825355.
Appendices
Appendix
AppendixInterview questionnaire
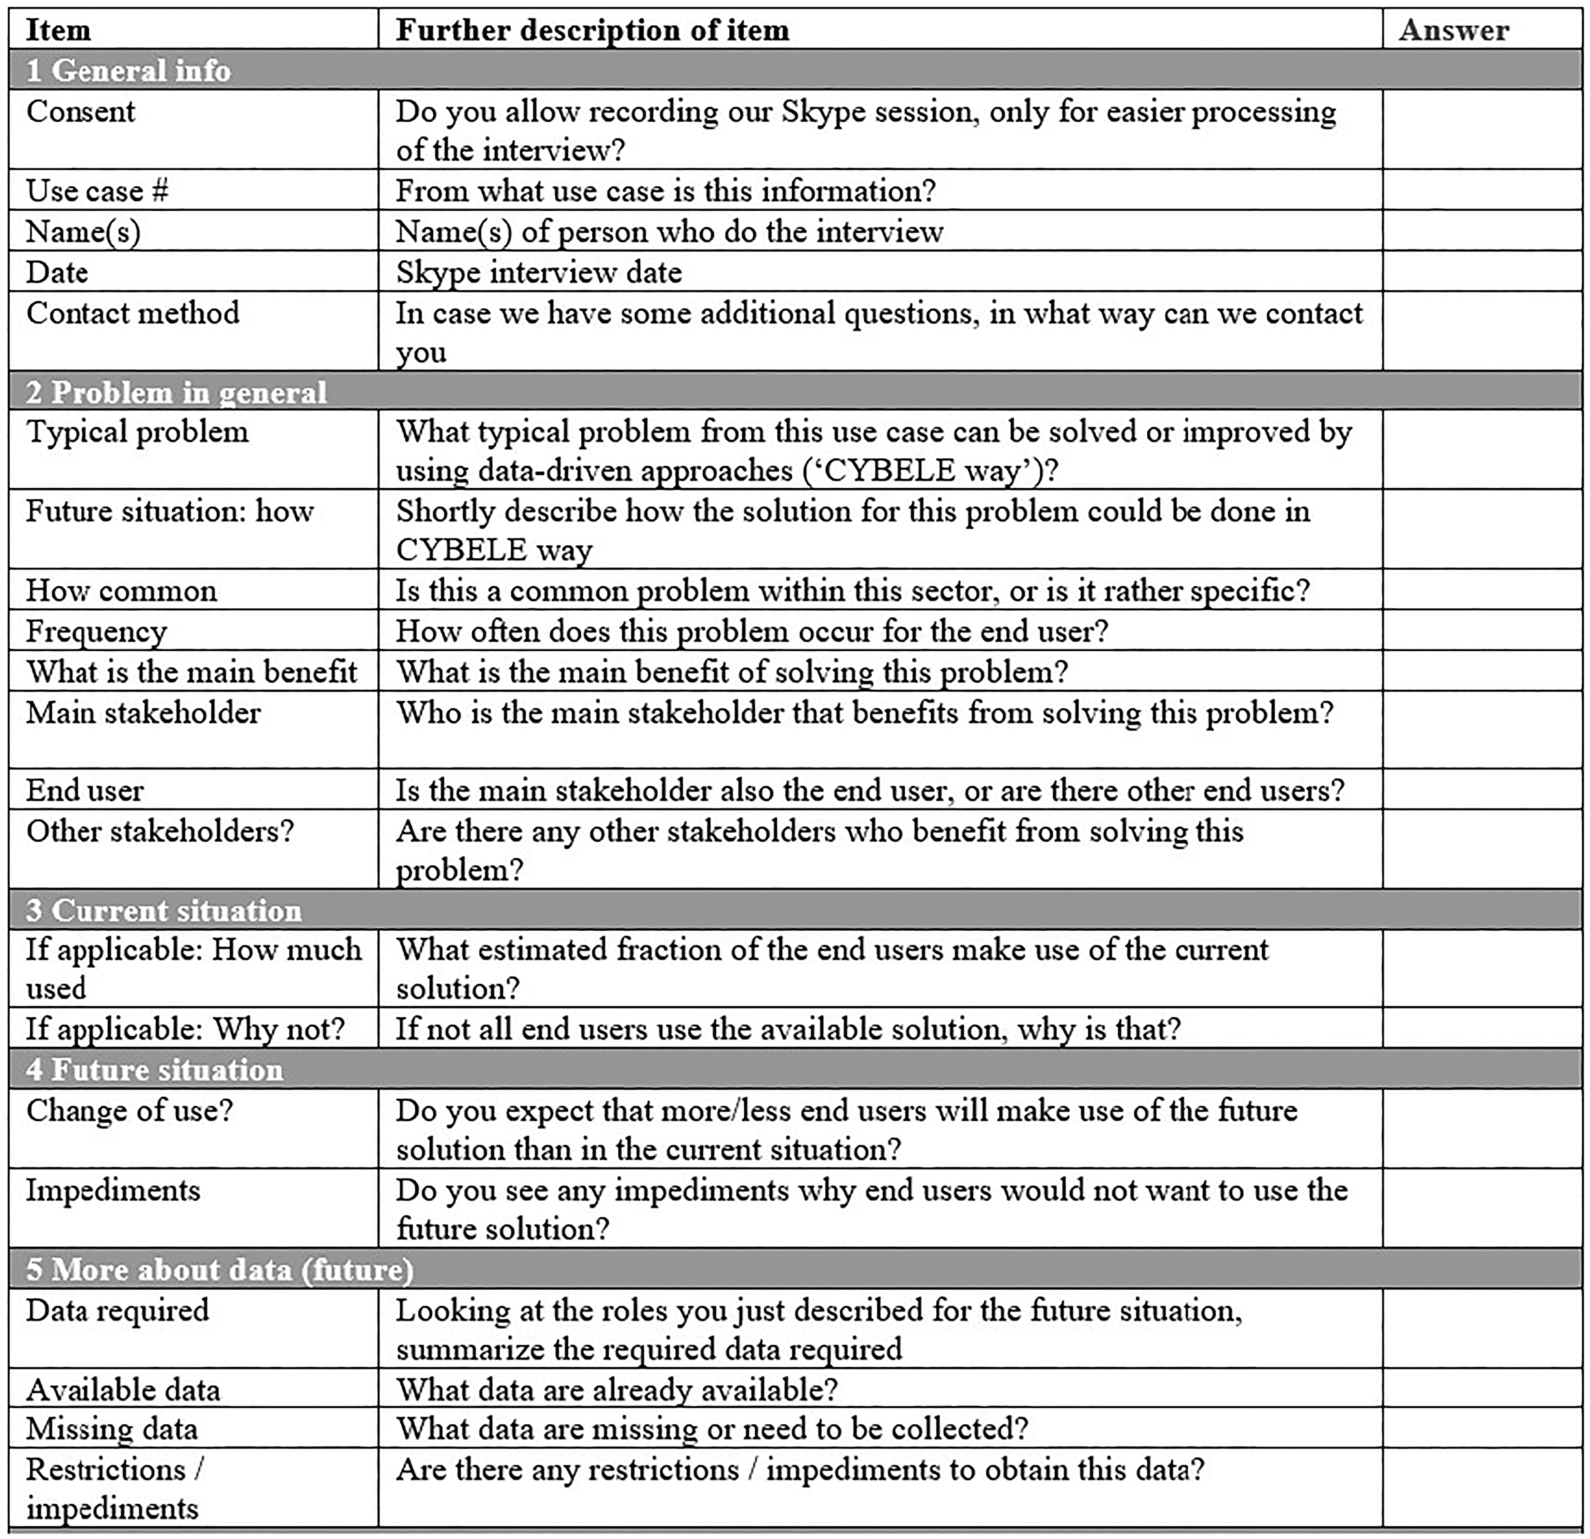
References
[1] | R. Albertoni, D. Browning, S. Cox, A.G. Beltran, A. Perego and P. Winstanley, Data catalog vocabulary (DCAT) – version 2, W3C recommendation, 2020, https://www.w3.org/TR/vocab-dcat-2/. |
[2] | K. Alexander, R. Cyganiak, M. Hausenblas and J. Zhao, Describing linked datasets with the VoID vocabulary, W3C Interest Group note, 2011, https://www.w3.org/TR/void/. |
[3] | R. Atkinson and N. Car, The profiles vocabulary, W3C Working Group note, 2019, https://www.w3.org/TR/dx-prof/. |
[4] | C. Aubert, P.L. Buttigieg, M.A. Laporte, M. Devare and E. Arnaud, CGIAR Agronomy Ontology, 2017, http://purl.obolibrary.org/obo/agro.owl, licensed under CC BY 4.0. |
[5] | D. Berckmans, Precision livestock farming technologies for welfare management in intensive livestock systems, Scientific and Technical Review of the Office International des Epizooties 33: (1) ((2014) ), 189–196. doi:10.20506/rst.33.1.2273. |
[6] | D. Brickley and R.V. Guha, RDF schema 1.1, W3C recommendation, 2014, https://www.w3.org/TR/rdf-schema/. |
[7] | P.L. Buttigieg, N. Morrison, B. Smith, C.J. Mungall and S.E. Lewis, The environment ontology: Contextualising biological and biomedical entities, Journal of biomedical semantics 4: (1) ((2013) ), 1–9. doi:10.1186/2041-1480-4-43. |
[8] | C. Chen, W. Zhu and T. Norton, Behaviour recognition of pigs and cattle: Journey from computer vision to deep learning, Computers and Electronics in Agriculture 187: ((2021) ), 106255. doi:10.1016/j.compag.2021.106255. |
[9] | I. Cisternas, I. Velásquez, A. Caro and A. Rodríguez, Systematic literature review of implementations of precision agriculture, Computers and Electronics in Agriculture 176: ((2020) ), 105626. doi:10.1016/j.compag.2020.105626. |
[10] | M. Cochez, N. Karim and I. Dimitriadis, Analysis of the DCAT-AP extensions, European Union ISA2, 2017. |
[11] | S. Cox and C. Little, Time ontology in OWL, W3C candidate recommendation, 2020, https://www.w3.org/TR/owl-time/. |
[12] | R. Cyganiak and D. Reynolds, The RDF data cube vocabulary, W3C recommendation, 2014, https://www.w3.org/TR/vocab-data-cube/. |
[13] | DCMI recommendation, DCMI metadata terms, 2020, https://www.dublincore.org/specifications/dublin-core/dcmi-terms/. |
[14] | R. Dohmen, C. Catal and Q. Liu, Computer vision-based weight estimation of livestock: A systematic literature review, New Zealand Journal of Agricultural Research 65: (2–3) ((2022) ), 227–247. doi:10.1080/00288233.2021.1876107. |
[15] | D.M. Dooley, E.J. Griffiths, G.S. Gosal, P.L. Buttigieg, R. Hoehndorf, M.C. Lange, L.M. Schriml, F.S. Brinkman and W.W. Hsiao, FoodOn: A harmonized food ontology to increase global food traceability, quality control and data integration, npj Science of Food 2: (1) ((2018) ), 1–10. doi:10.1038/s41538-018-0032-6. |
[16] | Establishing an infrastructure for spatial information in the European Community (INSPIRE), 2007, directive 2007/2/EC of the European Parliament and of the Council. |
[17] | European Union ISA2, GeoDCAT-AP: A geospatial extension for the DCAT application profile for data portals in Europe, 2016. |
[18] | Food and Agriculture Organization of the United Nations (FAO), AGROVOC, 2021, https://www.fao.org/agrovoc. |
[19] | R. García, J. Aguilar, M. Toro, A. Pinto and P. Rodríguez, A systematic literature review on the use of machine learning in precision livestock farming, Computers and Electronics in Agriculture 179: ((2020) ), 105826. doi:10.1016/j.compag.2020.105826. |
[20] | S. Gottschalk, N. Tempelmeier, G. Kniesel, V. Iosifidis, B. Fetahu and E. Demidova, Simple-ML: Towards a framework for semantic data analytics workflows, 2019, arXiv. doi:10.48550/ARXIV.1909.05859. |
[21] | A. Haller, K. Janowicz, S. Cox, D.L. Phuoc, K. Taylor and M. Lefrancois, Semantic sensor network ontology, W3C recommendation, 2017, https://www.w3.org/TR/vocab-ssn/. |
[22] | L. Hamami and B. Nassereddine, Application of wireless sensor networks in the field of irrigation: A review, Computers and Electronics in Agriculture 179: ((2020) ), 105782. doi:10.1016/j.compag.2020.105782. |
[23] | N. Hatton, A. Sharda, W. Schapaugh and D. van der Merwe, Remote thermal infrared imaging for rapid screening of sudden death syndrome in soybean, Computers and Electronics in Agriculture 178: ((2020) ), 105738. doi:10.1016/j.compag.2020.105738. |
[24] | C. Hurtaud, J. Bugeon, O. Dameron, A. Fatet, I. Hue, M.-C. Meunier-Salaün, M. Reichstadt, A. Valancogne, J. Vernet, J. Reecy, C. Park and P.-Y. Le Bail, ATOL: A new ontology for livestock, in: ICAR 2011: “New Technologies and New Challenges for Breeding and Herd Management”, Bourg-en-Bresse, France, (2011) , Session 2: phenotyping of complex traits, https://hal.archives-ouvertes.fr/hal-01189518. |
[25] | Y. Inoue, Satellite- and drone-based remote sensing of crops and soils for smart farming – a review, Soil Science and Plant Nutrition 66: (6) ((2020) ), 798–810. doi:10.1080/00380768.2020.1738899. |
[26] | INSPIRE Thematic Working Group, INSPIRE data specifications – base models – activity complex, European Commission Joint Research Centre, 2012. |
[27] | INSPIRE Thematic Working Group, Data specification on agricultural and aquaculture facilities – technical guidelines, European Commission Joint Research Centre, 2013. |
[28] | L. Joret, J. Bugeon, J. Aubin, J.P. Blancheton, M. Hassouna, C. Hurtaud, S.S. Kaushik, F. Médale, M.-C. Meunier-Salaün, J. Vernet, A. Wilfart, J.-Y. Dourmad and P.-Y. Le Bail, EOL: A new ontology for livestock system and rearing conditions, in: 64. Annual Meeting of the European Federation of Animal Science (EAAP), Book of Abstracts of the 64th Annual Meeting of the European Federation of Animal Science, Vol. 19: , Wageningen Academic Publishers, Nantes, France, (2013) , 660 p., https://hal.inrae.fr/hal-02745982. |
[29] | E. Kalampokis, A. Karamanou and K. Tarabanis, Interoperability conflicts in linked open statistical data, Information 10: (8) ((2019) ). doi:10.3390/info10080249. |
[30] | E. Kalampokis, D. Zeginis and K. Tarabanis, On modeling linked open statistical data, Journal of Web Semantics 55: ((2019) ), 56–68. doi:10.1016/j.websem.2018.11.002. |
[31] | A. Kamilaris, A. Kartakoullis and F.X. Prenafeta-Boldú, A review on the practice of big data analysis in agriculture, Computers and Electronics in Agriculture 143: ((2017) ), 23–37. doi:10.1016/j.compag.2017.09.037. |
[32] | T. Lebo, S. Sahoo and D. McGuinness, PROV-O: The PROV ontology, W3C recommendation, 2013, https://www.w3.org/TR/prov-o/. |
[33] | R. Lokers, R. Knapen, S. Janssen, Y. van Randen and J. Jansen, Analysis of big data technologies for use in agro-environmental science, Environmental Modelling & Software 84: ((2016) ), 494–504. doi:10.1016/j.envsoft.2016.07.017. |
[34] | B.F. Loscio, C. Burle and N. Calegari, Data on the web best practices, W3C recommendation, 2017, https://www.w3.org/TR/dwbp/. |
[35] | R. Lott, K. Ryden, M. Desruisseaux, M. Hedley and C. Heazel, Geographic information – well-known text representation of coordinate reference systems, OGC standard, 2019, http://www.opengis.net/doc/is/wkt-crs/2.0.6. |
[36] | V.M. Ngo and M.-T. Kechadi, Crop knowledge discovery based on agricultural big data integration, in: Proceedings of the 4th International Conference on Machine Learning and Soft Computing, ICMLSC 2020, Association for Computing Machinery, New York, NY, USA, (2020) , pp. 46–50. ISBN 9781450376310. doi:10.1145/3380688.3380705. |
[37] | B.V. Nuffelen, DCAT application profile for data portals in Europe version 2.1.1, European Commission, 2022. |
[38] | Open Geospatial Consortium, OGC abstract specification geographic information – observations and measurements, 2013. https://www.ogc.org/standards/om. |
[39] | QUDT.org, Quantities, units, dimensions and data types ontologies (QUDT), 2021, http://qudt.org/. |
[40] | R. Palma, T. Reznik, M. Esbrí, K. Charvat and C. Mazurek, An INSPIRE-based vocabulary for the publication of agricultural linked data, in: Ontology Engineering, V. Tamma, M. Dragoni, R. Gonçalves and A. Ławrynowicz, eds, Springer International Publishing, Cham, (2016) , pp. 124–133. ISBN 978-3-319-33245-1. doi:10.1007/978-3-319-33245-1_13. |
[41] | D.I. Patrício and R. Rieder, Computer vision and artificial intelligence in precision agriculture for grain crops: A systematic review, Computers and Electronics in Agriculture 153: ((2018) ), 69–81. doi:10.1016/j.compag.2018.08.001. |
[42] | V. Pesce, A. Maru, P. Archer, T. Malapela and J. Keizer, Setting up a global linked data catalog of datasets for agriculture, in: Metadata and Semantics Research, E. Garoufallou, R.J. Hartley and P. Gaitanou, eds, Springer International Publishing, Cham, (2015) , pp. 357–368. ISBN 978-3-319-24129-6. doi:10.1007/978-3-319-24129-6_31. |
[43] | M.-C. Salaun, J. Yon, P.-Y. Le Bail and M. Reichstadt, Animal health ontology for livestock, portail data INRAE, 2019. doi:10.15454/KKZ3TS. |
[44] | R.A. Schwalbert, T. Amado, G. Corassa, L.P. Pott, P.V.V. Prasad and I.A. Ciampitti, Satellite-based soybean yield forecast: Integrating machine learning and weather data for improving crop yield prediction in southern Brazil, Agricultural and Forest Meteorology 284: ((2020) ), 107886. doi:10.1016/j.agrformet.2019.107886. |
[45] | N. Sofou and A. Dragan, StatDCAT-AP – DCAT application profile for description of statistical datasets version 1.0.1, European Union ISA2, 2019. |
[46] | J. Weier and D. Herring, Measuring vegetation (ndvi & evi), NASA Earth Observatory 20 (2000). |
[47] | Q. Yang and D. Xiao, A review of video-based pig behavior recognition, Applied Animal Behaviour Science 233: ((2020) ), 105146. doi:10.1016/j.applanim.2020.105146. |
[48] | D. Zeginis, A. Hasnain, N. Loutas, H.F. Deus, R. Fox and K. Tarabanis, A collaborative methodology for developing a semantic model for interlinking cancer chemoprevention linked-data sources, Semantic Web 2: (5) ((2014) ), 127–142. doi:10.3233/SW-130112. |


