
Understanding the structure of knowledge graphs with ABSTAT profiles
Abstract
While there has been a trend in the last decades for publishing large-scale and highly-interconnected Knowledge Graphs (KGs), their users often get overwhelmed by the task of understanding their content as a result of their size and complexity. Data profiling approaches have been proposed to summarize large KGs into concise and meaningful representations, so that they can be better explored, processed, and managed. Profiles based on schema patterns represent each triple in a KG with its schema-level counterpart, thus covering the entire KG with profiles of considerable size. In this paper, we provide empirical evidence that profiles based on schema patterns, if explored with suitable mechanisms, can be useful to help users understand the content of big and complex KGs. ABSTAT provides concise pattern-based profiles and comes with faceted interfaces for profile exploration. Using this tool we present a user study based on query completion tasks. We demonstrate that users who look at ABSTAT profiles formulate their queries better and faster than users browsing the ontology of the KGs. The latter is a pretty strong baseline considering that many KGs do not even come with a specific ontology to be explored by the users. To the best of our knowledge, this is the first attempt to investigate the impact of profiling techniques on tasks related to knowledge graph understanding with a user study.
1.Introduction
Knowledge Graphs (KGs), such as DBpedia,11 Wikidata,22 Google’s Knowledge Graph and Microsoft’s Satori, contain facts about a variety of different entities such as places, people, organizations, events and artworks [36]. To support reuse and interoperability, hundreds of publicly available KGs are published using the RDF33 data model, which is based on triples having the form ⟨subject, predicate, object⟩ [36]. In RDF graphs, nodes are connected by directed edges labeled with (RDF) properties and represent entities, literals (e.g., strings, numbers, etc.), or entity and data types.44 Types and properties provide the vocabulary used to organize the KG, which may be also formally specified using ontologies [27].
RDF-Schema55 (RDFS), one ontology language,66 supports the specification of subclass relations (e.g., City is subclass of Place), subproperty relations (e.g., capitalOf is subproperty of locatedIn), and domain and range restrictions, which constrain the usage of properties (e.g., subjects and objects of triples using the capitalOf predicate must be, respectively, of type City and Country). More expressive languages, e.g., OWL,77 support more fine-grained constraints [27].
Fig. 1.
Knowledge graph and extracted patterns.
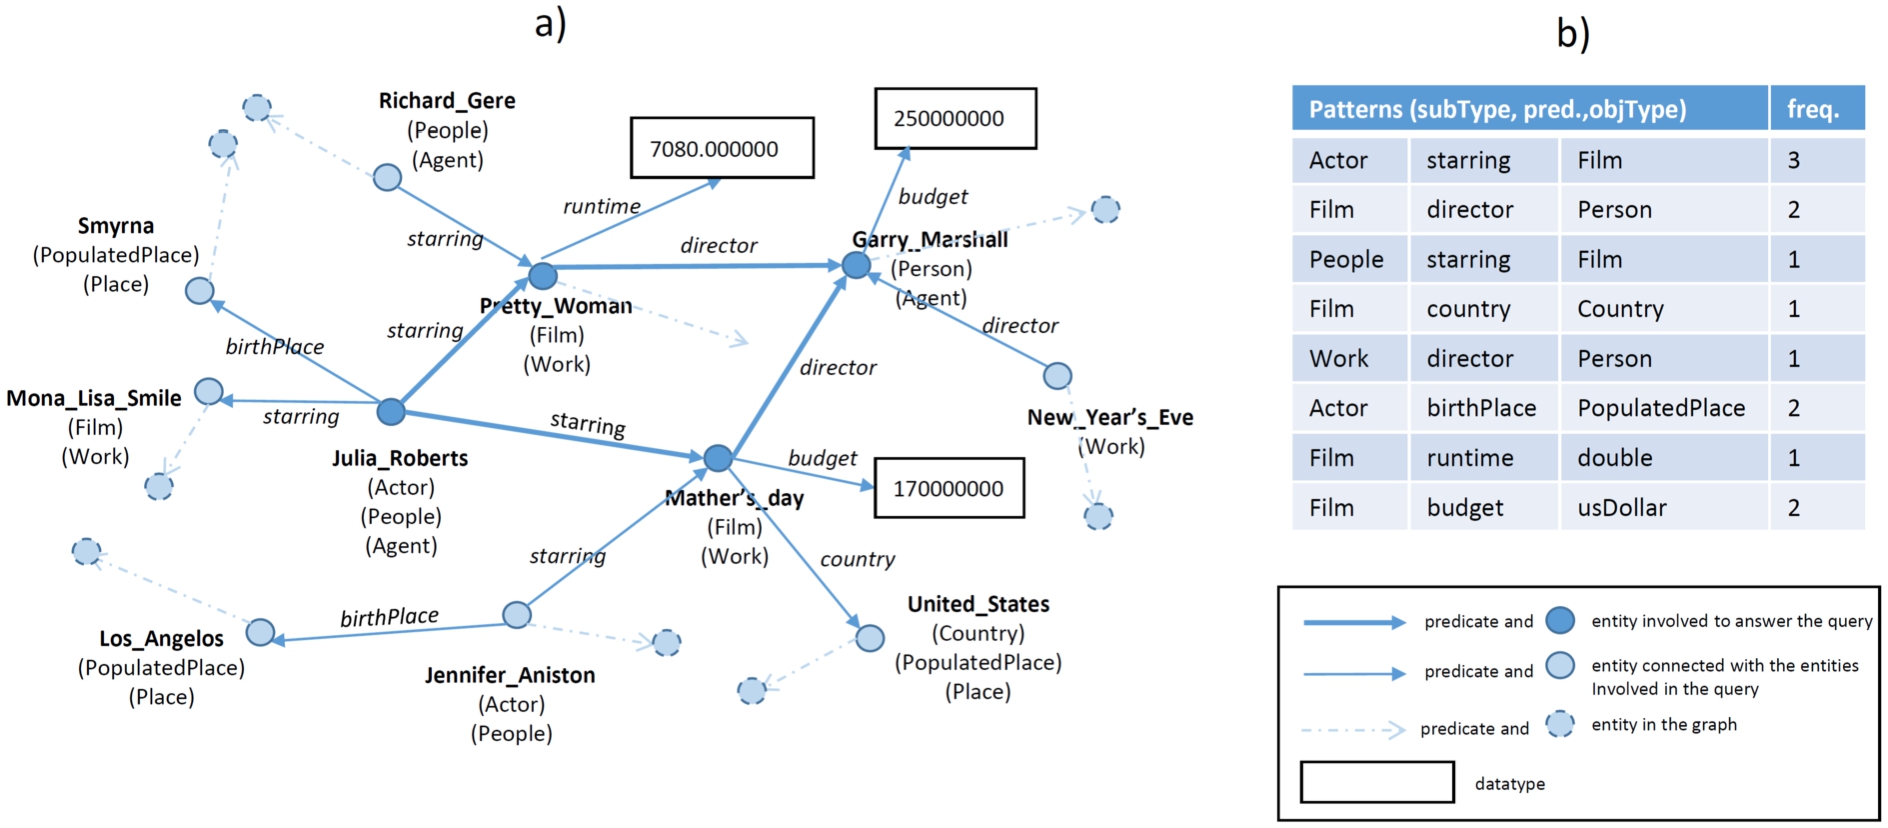
Ontologies inform users about the structure of a KG by describing dependencies among types and predicates, and, especially, the types of entities that are expected with specific predicates. These dependencies can be inspected using ontology editing tools such as Protégé [26,55] and are very important to effectively consume the data contained in a KG. Let us consider query answering, a quintessential data consumption task: to formulate a proper query, e.g., using the SPARQL88 language, the user needs some prior knowledge about how the KG is structured. For example, consider the small subset of DBpedia represented in Fig. 1 a) and the following target query: “In which films directed by Garry Marshall was Julia Roberts starring?” To formulate this query, the user needs to know that actors and films are connected with the property
Ontologies are helpful but often insufficient to fully understand the structure of a KG for a variety of reasons. First, a KG may use a vocabulary that is not explicitly associated with a reference formal ontology (e.g., Linked Geo Data,99 but consider also Schema.org,1010 which does not come with a specification in a formal language, e.g., first-order logic), or pick terms from multiple ontologies. Second, the ontology may be underspecified, i.e., specifications cover only a few dependencies (e.g., in DBpedia several properties do not have domain and/or range restrictions1111). Third, KGs may not only be very large (e.g., Microsoft Academic Knowledge Graph1212 (makg)) but also have a complex ontology (e.g., the 2016-10 DBpedia ontology contains 467 types and 1.446 properties). Fourth, KGs may use terms in a way that is not fully compliant with the ontology specifications. Finally, some users may find it difficult to master ontological languages [38].
Some of these limitations can be mitigated by exploratory search [43], i.e., by formulating queries and retrieving results iteratively. However, this method is effort-consuming and can even fail when some of the exploratory queries match too many results (e.g., find all the properties where the triple subject is a movie) [65]. Several approaches have been proposed to help users overcome these challenges.
Approaches based on faceted search [30,54] and query-by-example [47,48] allow users to query a KG without any knowledge about its structure. Others propose to exploit data visualization [8,51] (including ontology visualization functionalities [39]) to understand structural properties. Profiling and summarization approaches [1,2,10,16,24,28,34,37,40,45,46,53,59,63] are more specifically targeted to help users (and/or machines) understand the structure of a KG, its properties, and its more salient content. While “understanding” intuitively refers to the ability to know how something works or what something means, we could not find any agreed definition about what understanding the structure of a KG actually means.
Following some previous work [42], in this paper, we refer to knowledge graphs understanding as the process of gaining insights by accessing and exploring a set of simple structures that are easily understood and meaningful.
Pattern-based profiling and summarization approaches [6,12,41] such as ABSTAT1313 [4,65] and Loupe [53] use vocabulary usage patterns – referred to as schema-level patterns in the following – as primitives to represent these simple structures, under the assumption that they can be easily understood by users. These schema-level patterns have the form (Type, Predicate, Type), e.g.,
ABSTAT profiles cover all the triples in the KG, which means that each triple is represented by at least one schema-level pattern. The number of patterns depends therefore on the number of different usage patterns that occur in a dataset and may be quite large for large KGs using complex ontologies, e.g., DBpedia. To reduce the number of patterns ABSTAT uses a minimalization mechanism to retain only the most specific patterns for each triple. In addition, it comes with user interfaces that support search, filter and exploration over profiles, thus helping understand also complex KGs with a large number of patterns [5].
The main objective of this paper is to provide empirical evidence that pattern-based profiles, explored from suitable user interfaces, can be useful to help users understand the structure of large and complex KGs, and, especially, when compared to ontology exploration frameworks. We must observe that defining what precisely means, for a user, to understand a KG (or, in general, a data set) is not trivial. We are not aware of previous work providing a conclusive definition of knowledge graph understanding, or a set of agreed-upon methods to measure understanding by humans.
In this paper, we, therefore, apply a methodology used to evaluate other inner cognitive processes that are hard to measure directly and have been studied by measuring the performance on different “proxy” downstream cognitive tasks, which are more amenable to measurement [60,62]. In our case, the inner cognitive process of understanding the structure of KG is measured by the performance (time and accuracy) on the query completion task, under the assumption that some understanding of the structure of a KG and of the vocabulary used to model it is required to fill-in predicates and types in a query template.
To evaluate our hypothesis, we present a user study based on query completion tasks over DBpedia: the users’ ability to understand the KG structure is measured downstream by their ability to fill in schema-level elements in SPARQL queries using ABSTAT or Protégé as supporting tools. Protégé is a well-known, highly adopted and mature tool that provides several features to explore ontologies. DBpedia is a large and complex KG that has its own specific OWL ontology that can be explored in Protégé (we remark that this condition does not apply to all KGs, which can still be explored through their ABSTAT-based profiles). Our findings suggest that users supported by ABSTAT formulate their queries better and faster than users supported by Protégé. In this paper we report a detailed analysis of our findings and the feedback collected during the study, which provides insights into the difficulties that users encounter when they have to choose the vocabulary to formulate queries. We release all the data collected in our study for future research.
To the best of our knowledge, this is the first attempt to investigate the impact of KG profiling and summarization approaches on abilities that are related to knowledge graph understanding. While our study focuses on pattern-based approaches, we believe that the proposed evaluation methodology can be adapted to evaluate future KG profiling and summarization approaches based on different principles.
In this paper we make the following contributions:
– Provide an extended analysis of the conciseness of the summary computed by ABSTAT.
– Propose a methodology to evaluate how a profiling tool helps users in understanding the data through the assignment of cognitive tasks.
– Construct and present a user study based on query completion tasks where users make use of profiles to complete their queries.
– Apply the proposed methodology to evaluate ABSTAT profiles from a user understanding perspective and demonstrate empirically its superiority over a baseline approach.
– Make publicly available all questionnaires and their results so further research and investigation can be made.1414
This paper is structured as follows: Section 2 introduces the ABSTAT summarization framework and presents ABSTAT profiles, the Web application and provides an analysis of the conciseness of the profiles. The design of the user study is presented in Section 3 while the empirical evaluation of the user study and the quality analysis of the results is discussed in Section 4. Related work of approaches and tools that support data understanding is reviewed in Section 5. Finally, conclusions end the paper in Section 6.
2.ABSTAT – a data profiling framework
In this section, we present ABSTAT framework that computes and provides access to semantic profiles. First, we present and describe profiles content in Section 2.1 and then in Section 2.2 we present ABSTAT Web application. An overview of the performance of our tool’s interface is provided in Section 2.3. Finally, in Section 2.4 we discuss how minimalization, a distinctive feature of ABSTAT, allows the creation of profiles that are compact and concise with respect to the content of the KG.
2.1.ABSTAT profiles
ABSTAT is a data profiling framework aiming to help users understand the content of big data set by exploring its semantic profile [4]. It takes as input a data set and an ontology (used by the data set) and returns a semantic profile (Fig. 2). Thanks to the highly distributed architecture, ABSTAT is able to profile big KGs [4]. The semantic profile produced by ABSTAT consists of a summary of patterns and several statistics. The key aspect of the summary is the use of minimal type patterns that represent an abstraction of the data set. A minimal type pattern is a triple (C, P, D) that represents the occurrence of triples
Fig. 2.
A sample of the semantic profile of the DBpedia 2015-10 data set.
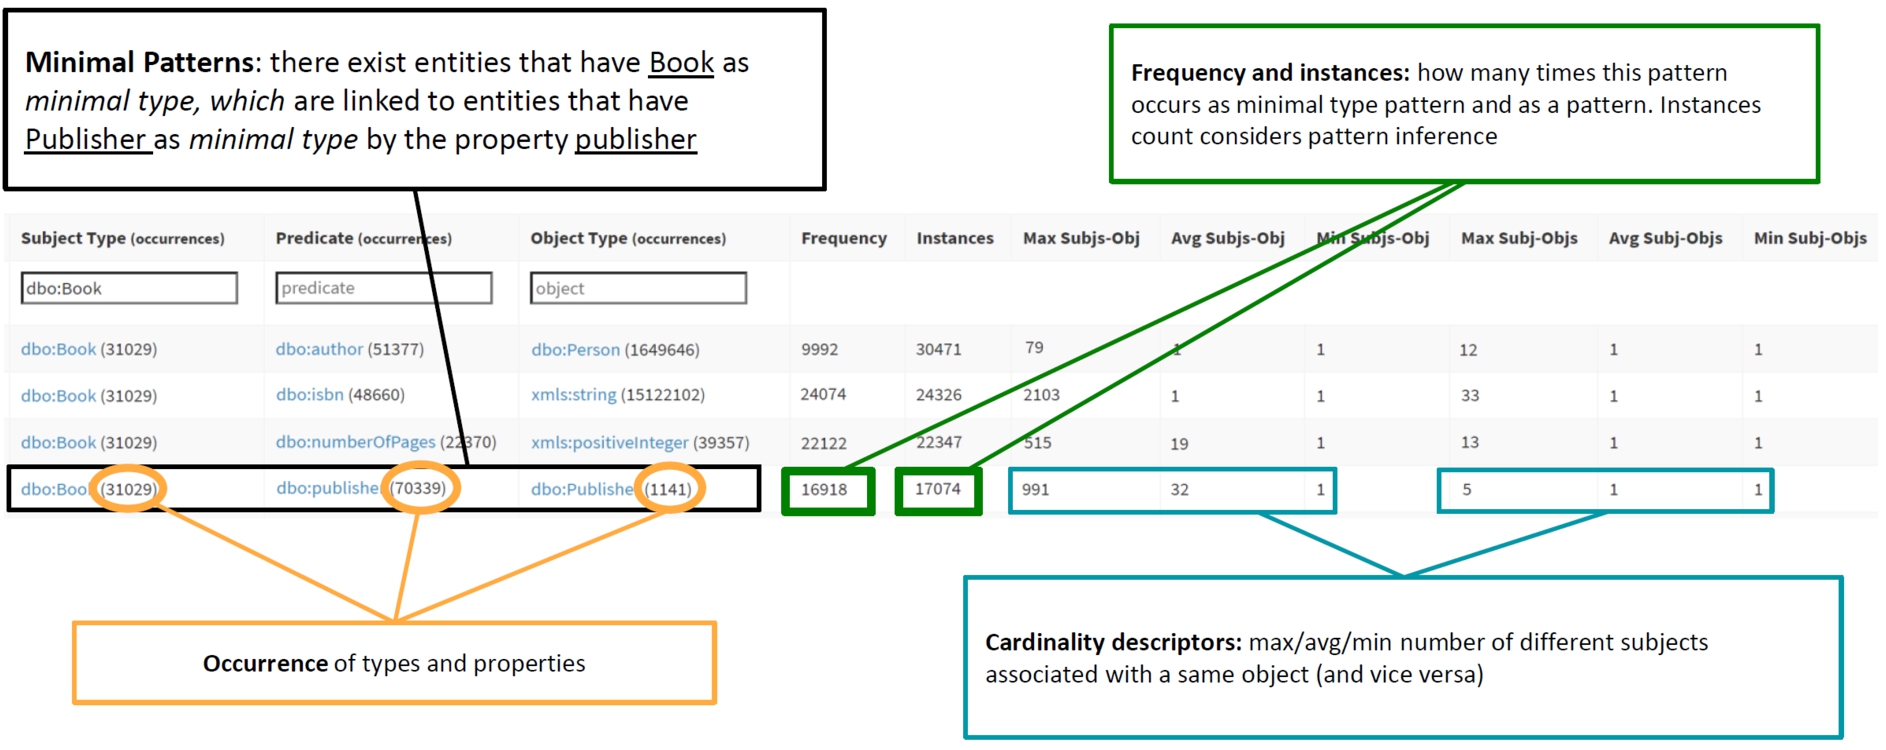
Finally, the semantic profile also includes several statistics. In the following we provide an overview of the statistics produced by ABSTAT considering the highlighted pattern in Fig. 2:
– occurrence (in orange) for types, predicates and datatypes. This statistic gives the occurrence of the respective types, predicates and datatypes in the data set. For example, in the sample of DBpedia, the types Book and Publisher occur 31029 and 1141 times respectively, while the predicate publisher occurs 70339 times.
– frequency (in green) of the pattern shows how many times the pattern (minimal) occurs in the data set.
– instances (in green) for patterns shows how many instances have this pattern including those for which the types Book and Publisher and the predicate publisher can be inferred.
– cardinality statistics (in turquoise) provide information about cardinality estimation for a given predicate. Max (Min, Avg) subj-obj cardinality is the maximal (minimal, average) number of distinct entities of type Book linked to a single entity of type Publisher through the predicate publisher.
For a formal and complete definition of the profiling model of ABSTAT please refer to [4].
2.2.Accessing profiles with the ABSTAT tool
An ABSTAT profile provides an abstraction over a data set but it would not be helpful without a proper access, navigation and presentation of results. ABSTAT tool fulfills this need through a Web application that computes and provides access to profiles.
To help users explore the information represented in the profiles, ABSTAT provides two graphic user interfaces (GUIs).
Fig. 3.
Semantic profile exploration of the DBpedia 2015-10 data set (browse GUI).
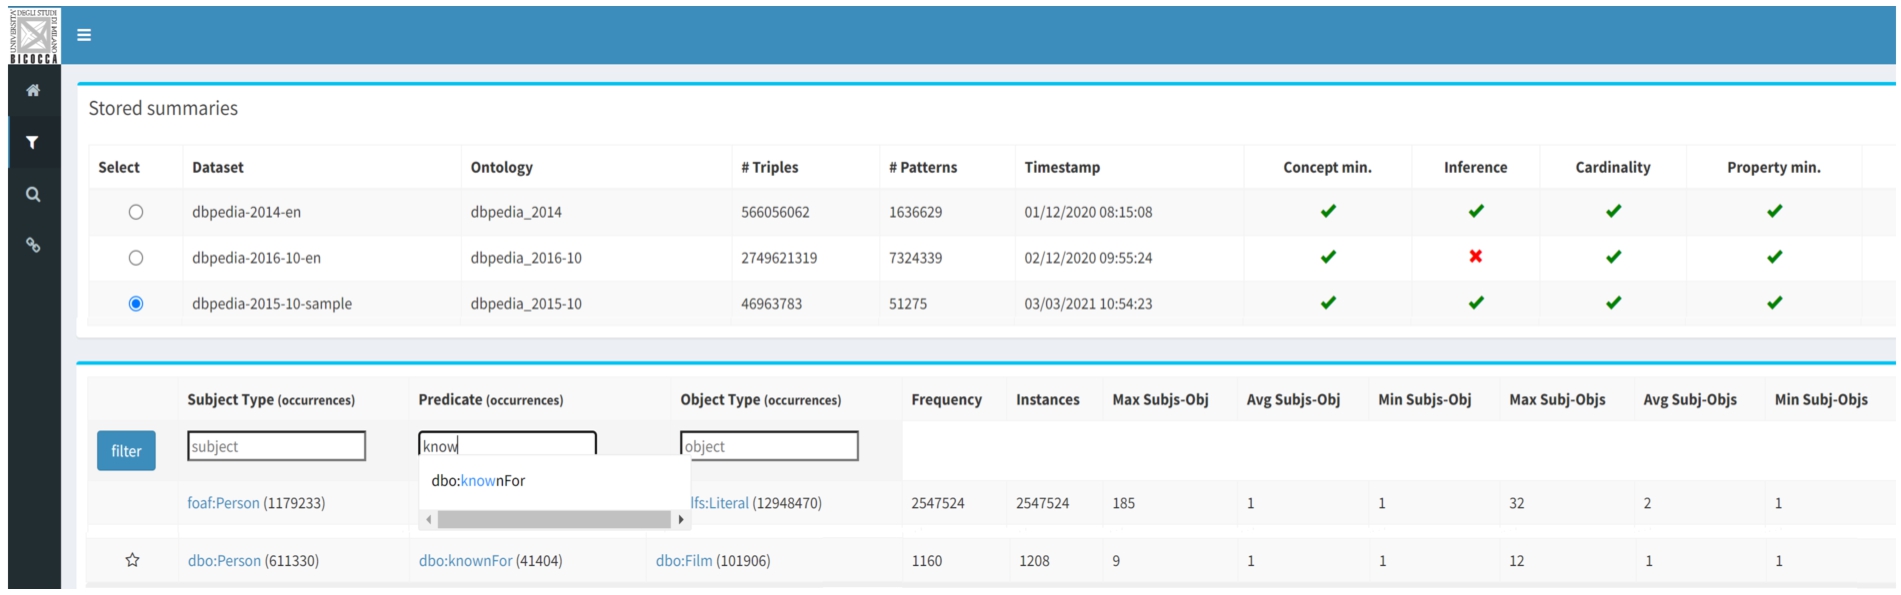
Browse. Suppose the user wants to explore a data set that has been profiled with ABSTAT. Since the user often does not know much about the data, the individual probably does not have a clear idea about what to search for. First of all, the user selects the profile to inspect as shown in top-most part of Fig. 3. Patterns are sorted by frequency in order to present a small snapshot of the most frequently used patterns in the data. Subsequently, the user can decide to filter the data using the three available text boxes for adding constraints on the subject type, predicate, object type and any combination of these. While the input is typed inside a text box the autocompletion feature will recommend types/predicates that occur in the patterns (the bottom part of Fig. 3 shows how predicate text box suggest dbo:knownFor and dbo:trackNumber for the input string “kn”). For example, by filtering patterns in the subject box with the constraint dbo:Film, patterns with interesting predicates such as dbo:starring, dbo:producer, dbo:musicComposer, dbo:budget will be returned, which explains what kind of information we can retrieve from the data set with respect to movies. Therefore, we can see how ABSTAT guides the user to understand a data set through Browse GUI.
In addition, the GUI shows statistics associated with the patterns. Figure 3 shows the patterns that match the predicate dbo:knownFor and the object type dbo:Film. Considering the one in the black box, in the sequence order we have; occurrence of subject type, predicate and, object type, frequency of the patterns (number of minimally represented assertions) and additional statistics. More in details, statistics for this pattern tell that there are 1.160 relational assertions
Finally, Max (Min, Avg) subj-obj cardinality is the maximal (minimal, average) number of distinct entities of type Person linked to a single entity of type Film through the predicate knownFor. Max (Min, Avg) subj-obj is the maximal (minimal, average) number of distinct entities of type Film linked to a single entity of type Person through the predicate knownFor. For more details about these additional statistics, we refer to [5].
Fig. 4.
Semantic profile search for DBpedia 2015-10 data set (search GUI).
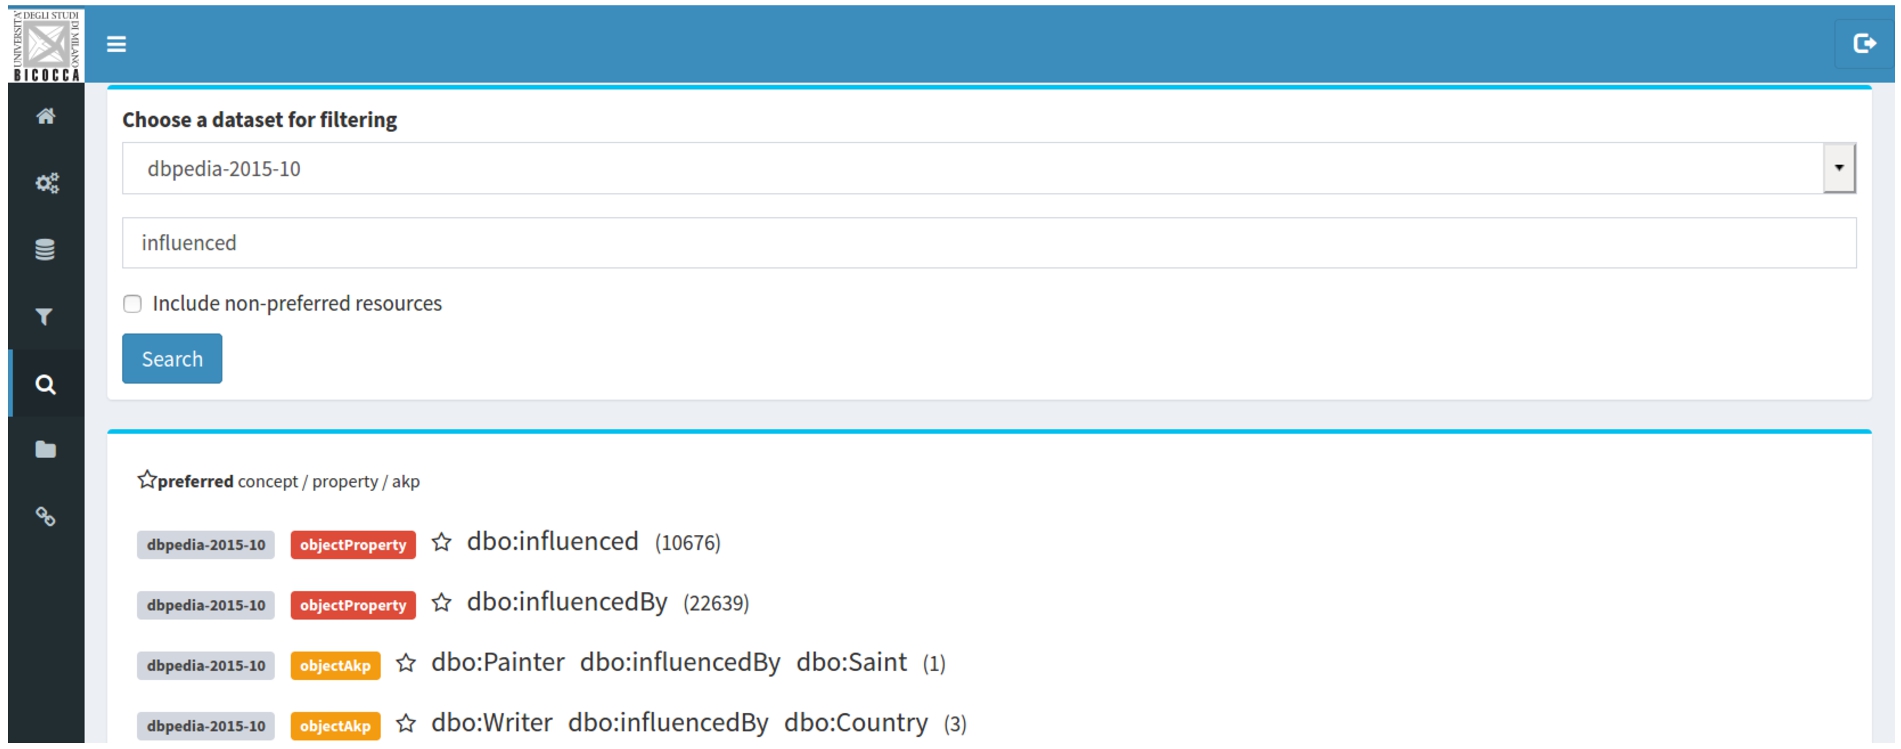
Search. This interface is the GUI for full-text search, where the user can insert any keyword and get results that match the input (patterns, types and predicates) for all the profiles or some specific profile. Statistics, data set names and patterns will be shown in the results of the query. Figure 4 shows the results for the input “influenced” over the dbpedia-2015-10 data set. Notice that, for each result, a colored label indicates if it is a predicate, a type or a pattern. The first two results show information about properties, followed by two patterns. Frequency is shown for patterns and occurrence for types and properties. For example, dbo:influencedBy is an object property that occurs 10.676 times in the dbpedia-2015-10 data set.
GUI-based access to ABSTAT profile is more relevant to the scope of this paper. However, it is worth noting that ABSTAT supports API-based access to control the profile process (e.g., launch a summarization, store profiles, etc.) and to make third-party applications access the profiles. APIs that provide access to the profiles support all the functionalities that are available with the Browse and Search GUIs. In addition, vocabulary suggestion APIs have been developed. They serve vocabulary suggestions and pattern search (Suggestions-APIs) in semantic table interpretation and annotation tools [17,20–22] and, with more sophisticated ranking functions, feature selection in KB-based recommender systems [23,58].
2.3.Performance of the ABSTAT tool
In addition to the KG exploration features provided by the ABSTAT tool, profile processing and navigation performance are also addressed, scalably managing billions of triples at profiling-time and millions of patterns at query-time. The responsiveness1616 of the Browse interface in fetching and filtering the chosen profile is immediate (regardless of the size of the profiles shown in this work) thanks to the intensive use of caching and multi-key indexing to efficiently support queries with any combination of input constraints. In addition, the autocomplete menu corresponding to the subject/predicate/object fields triggers an autocomplete query for input strings with at least 2 characters after 0.5 seconds that the user has stopped typing; each query takes less than 1 second to return suggestions. As for the Search interface, the under-the-hood Apache Solr search engine enables efficient full-text queries. Differently from Browse, Search allows the query search space to be expanded to all computed profiles rather than one at a time; also in this case the response time is instantaneous. It is worth noting that to make profile consumption efficient, the patterns shown during the browsing are not computed at runtime (e.g., using complex SPARQL queries mimicking minimalization algorithm on potentially very large KGs), instead ABSTAT processes the KG first and the generated profile is stored in a dedicated database for later use. Less relevant for this paper but still important is the loading time of the KGs through the web interface. The uploading time depends linearly on the file size (e.g., in our configuration, each gigabyte uploaded adds 11 minutes to the total). However, since ABSTAT only accepts the n-triples format as input, a further improvement could be to also accept compressed formats such as turtle to optimise the amount of information transmitted and consequently drastically reducing the uploading time. Finally, a significant effort has been dedicated to the optimization of the KGs profiling process especially for very large KGs. For more details about processing scalability please refer to [4].
2.4.Conciseness of ABSTAT profiles
Understanding data sets with large numbers of concepts, relationships, and entities is a hard problem since their presentation could easily overload the user with information and prevent them to reach an overall understanding or to find particular information [57]. In this section, we measure the conciseness of the summary produced by ABSTAT and compare it with the conciseness achieved by Loupe [53] an approach similar to ours that does not use minimalization. From all the available works on profiling, for conciseness we compare ABSTAT with Loupe for two reasons: (i) many of the works on profiling do not provide an instrument to explore profiles, and (ii) from all the available tools, Loupe profiles are most similar to ABSTAT, with the difference that ABSTAT adopts the minimalization technique.
For this comparison we use summaries extracted from different RDF data sets: different versions of DBpedia (2014-en,1717 2015-10,1818 2016-101919), LinkedBrainz,2020 DrugBank,2121 pharmagkb,2222 linkedgeodata,2323 geonames,2424 geonames-mod (a version of geonames where codes2525 were substituted with their specific label for two reasons: (i) to have a better reduction rate, and (ii) to have a summary that is better understandable by humans who can easily read labels instead of codes) and makg.2626
Table 1
Statistics about relations, assertions, types, properties and patterns used in the data set
| Relational | Typing | Assertions | Types*(Ext.) | Properties*(Ext.) | |
| linkedbrainz | ∼208.9M | ∼29.7M | ∼238.6M | 12 (9) | 29 (10) |
| dbp2014-en | ∼521.6M | ∼44.4M | ∼566M | 528 (79) | 57451 (56015) |
| dbp2015-10-en | ∼606.4M | ∼75.2M | ∼221.7M | 2424 (1918) | 62556 (61121) |
| dbp2016-10-en | ∼ 2.4B | ∼324.8M | ∼2.7B | 1220 (753) | 122973 (121527) |
| drugbank | ∼3.9M | ∼773.6K | ∼4.7M | 102 (91) | 102 (59) |
| pharmgkb | ∼2.7M | ∼40.6K | ∼2.8M | 57 (51) | 75 (67) |
| linkedgeodata | ∼818.8M | ∼397.7M | ∼1.2B | 1143 (1143) | 33347 (33347) |
| geonames | ∼164.9M | ∼11.7M | ∼176.6M | 1 (0) | 24 (6) |
| geonames-mod | ∼141.6M | ∼11.7M | ∼153.3M | 682 (681) | 26 (6) |
| makg | ∼7.4B | ∼744.1M | ∼8.1B | 13 (5) | 50 (3) |
* The number of types and properties refer to the total number of types and properties used in the data set (internal and external to the ontology). In brackets it is given only the number of external types and properties with respect to the ontology.
Table 2
Statistics about relations, assertions, types, properties and patterns used in the data set
| Patterns ABSTAT | Patterns Loupe | R.R. (e-4) ABSTAT | Loupe | R.C. ABSTAT | |
| linkedbrainz | 98 | 99 | 0.0041 | 0.0041 | 2435x |
| dbp2014-en | 1636629 | 2919869 | 30 | 50 | 346x |
| dbp2015-10-en | 21298654 | 25195035 | 900 | 1140 | 10.4x |
| dbp2016-10-en | 7324742 | 8922021 | 0.27 | 0.33 | 368.6x |
| drugbank | 1403 | 1403 | 3 | 3 | 3349.9x |
| pharmgkb | 644 | 644 | 2 | 2 | 4347.8x |
| linkedgeodata | 398297 | 398297 | 3 | 3 | 3012.8x |
| geonames | 27 | 27 | 0.001 | 0.001 | 6540.7x |
| geonames-mod | 4691 | 15760 | 0.3 | 1 | 32679.6x |
| makg | 233 | 233 | 0.002 | 0.002 | 34763.9x |
Table 1 provides a quantitative overview of data sets and their summaries. To assess the conciseness of a summary we measure the reduction rate (R.R.), defined as the ratio between the number of patterns in a summary and the number of assertions from which the summary has been extracted. To assess the reduction coefficient (R.C.) of the profile, we compute the ratio between the number of assertions in the data set and the number of patterns.
We compare the reduction rate (R.R.) achieved by our model with respect to Loupe in Table 2. A lower R.R value, refers to a smaller summary with respect to the number of assertions, meaning that the profile produced by the tool is more concise.
For all data sets ABSTAT achieves a lower reduction rate (for dbp2914-en, dbp2015-10-en,dbp2016-10-en, geonames-mod) or equal (for linkedbrainz, drugbank, pharmagkb, linkedgeodata, geonames and makg) to the one achieved by Loupe. We observe that the summaries computed by ABSTAT are more concise, as we only include minimal type patterns. Loupe instead, does not apply any minimalization technique thus its summaries are less concise. For instance, a user that explores the profiles of dbpedia-2016-10-en who is particularly interested in exploring all patterns that have dbo:birthPlace as predicate and dbo:Place as their object type, has to explore 111 patterns using ABSTAT and 395 using Loupe (almost 3.5 times more patterns). Although the reduction rate, even for ABSTAT profiles, humans still have to explore manually or by eye-balling many patterns. Producing even more concise summaries by reducing the number of patterns to explore i.e., patterns might be grouped in super patterns that the user might afterward zoom in for more specific patterns, is a task that we consider for future work.
As explained more in detail in [4], minimalization leads to pruning patterns that are redundant because they could be inferred using the subtype relations. For this reason, the richer the subtype relation is, the lower the reduction rate is. It is quite easy to see that, given a type graph, the number of patterns decreases monotonically with the increase of the edges in the graph, until this addition preserves the poset structure. This explains why ABSTAT obtains a lower reduction rate in DBpedia. The same effect is evident also for geonames-mod, for which ABSTAT achieves a lower (i.e., better) reduction rate than Loupe.
ABSTAT summaries are more concise with respect to the size of the data set itself (please refer to the R.C column in Table 2). Although ABSTAT gives its best in terms of reduction coefficient when summarization is applied over a data set with a terminology graph characterized by a rich type hierarchy, summaries remain powerful also with a poor terminology or even when it is missing. In case of a missing ontology, the minimal type calculation is skipped and every type that describes an individual is included in the profile. In this case, the pattern frequency is equal to the pattern occurrence since there is no minimalization.
However, we should mention that having a low reduction rate is not our goal (or the goal of Loupe); it is only our means to find redundant patterns. Low reduction ratios are exactly a sign that many redundancies are discovered (i.e., patterns) which can be inferred and thus, users explore a smaller summary and understand the input graph better.
3.Design of the experimental study
In this section we introduce the design of the experimental settings to evaluate how profiling tools help users in knowledge graph understanding. We measure knowledge graph understanding by setting up a user study where users are assigned some cognitive tasks [60]. Users performance can be quantitatively measured and it is used as proxy for evaluating a cognitive process [62]. Our proposed experimental settings encompasses five sequential steps, which need to be executed in the specified order, since the outputs of previous steps feed the tasks of the next steps. In the following we provide details for each step:
1. Context definition: The first step of the experimentation regards the definition of the context i.e., information gathered about the data set and the tested systems. First, we need to specify the domain of interest and the related data sets for which a summary needs to be executed. Second, we need to identify the systems to be compared. They should: (i) have similar aim, (2) be available, and (3) be comparable on the output that they provide to the user.
2. Tasks definition: The second step of the experimentation refers to the definition of tasks. There might be different dimensions to measure knowledge graph understanding e.g., quantifying query completion, data exploration for natural language question answering, etc. In this paper, we consider query completion as a component of knowledge graph understanding. Different approaches might use different tasks to evaluate KG understanding from their perspective, however, one of the challenges when designing user study experiments is the number of tasks that users have to complete as they are time-consuming and fatigue bias need to be reduced [56].
3. User profiling and recruitment: This step regards the definition of a user model to assess the KG understanding through the tasks defined in step 2. A user can be someone who might have some knowledge and/or is familiar with the technologies related to the defined tasks. Once the user profile is defined, the next step is to determine the recruiting process. For the recruitment one might consider: public mailing lists, social communities (Facebook, Tweeters, etc.) or people from laboratories or department working on similar technologies related to the defined tasks. However, for the new system which is being tested, supporting material that present the aim and the functionalities of the system should be provided to the users at the beginning of the experiments.
4. Questionnaire composition: This step regards, the design of the questionnaire that, on the basis of the data set chosen, the user profiling and task defined in the previous steps, can include several blocks. For example, one might consider to dedicate a first block of questions to gather background information about users participating in the survey; a second block regards questions to complete the defined tasks; and a third block comprises a set of feedback questions for the task and general comments about the survey at the end. Moreover, the environment where the survey is being executed should be the same for all users such that the results are comparable.
5. Evaluation metrics: The final step considers the design of the evaluation process. In order to compare the performance of users that complete their tasks for both systems a set of metrics should be set. The performance might be compared in terms of precision, recall, f-measure, accuracy and time. Moreover, a set of questions for the qualitative analysis should be set in order to gain a deep understanding of users behaviour and the characteristics of the systems being evaluated.
4.Evaluation
In this section, we present and discuss the practical application of the user study. First, we present in Section 4.1 how we applied each phase of the experimental settings in a real user study. Second, in Section 4.2 we analyse the results of the user study, while in Section 4.3 we provide a thorough qualitative analysis of the results of the experiment. Finally, in Section 4.4 we draw some limitations and lessons learned.
4.1.User study
In the following we describe the user study:
Context definition Firstly, we choose the systems to be compared and the data set on which to apply the user study. For the systems to be used we performed a survey of the available tools and approaches (see Section 5 for a thorough analysis). As stated in Section 2.2 the tool most similar to ABSTAT is Loupe. However, we could not use Loupe in a direct experimental comparison mainly because: (1) Loupe code is not available, profiles accessible through the Loop interface are from a DBpedia version that is not specified; therefore we could not use the tool in a controlled setting; (2) the experimental setup requires effort and recruiting Loupe users would be an additional challenge; and (3) the main objective of the experiment is to demonstrate that schema-level profiles (including, in principle, also Loupe’s profiles) are helpful for users writing queries. The above reasons encouraged us to use WebProtégé as the baseline tool. There are three main reasons for such choice: (1) There are no other up-and-running tools for data profiling (except Loupe which we could not use for the above reasons); (2) Ontologies help users understand the data at hand as they describe the data by making semantics explicit; and (3) Both tools, ABSTAT and Protégé, give information about schema (the ontology in Protégé and schema-patterns in ABSTAT) not about instances or entities.
Regarding the choice of the data set, DBpedia is the data set that users needed to explore and understand. DBpedia is one of the most important data sets of the Semantic Web community as it contains real, large-scale data and is complex enough with 449 classes and 1436 properties. It has a documented schema which might be downloaded easily.2727 All the above reasons make DBpedia challenging enough to assess the abilities of users to understand the data by exploring ABSTAT profiles or the ontology in WebProtégé.
Tasks definition We designed a user study based on the assignment of cognitive tasks related to query completion. We selected a set of queries from the Questions and Answering in Linked Open Data benchmark.2828 Such queries are believed to be representative of realistic information needs [49], although we cannot guarantee that they cover every possible information need. To gather evidence and evaluate data understanding, we ask users to complete and answer three queries from DBpedia 2014, using either ABSTAT or Protégé. In order to answer the selected queries we require users to explore the profile of DBpedia provided by ABSTAT or by exploring the ontology in WebProtégé. For each query, we provide a “template” of the corresponding SPARQL query, with spaces intentionally left blank for properties and/or concepts. For example, given the natural language specification “Which is the second highest mountain on Earth?”, we ask participants to fill in the blank spaces:
SELECT DISTINCT ?uri WHERE
?uri rdf:type .... .
?uri .... ?elevation .
ORDER BY DESC(?elevation)
OFFSET 1 LIMIT 1
The three queries are of different lengths, defined in terms of the number of triple patterns within the WHERE clause; one query of length one, one of length two and one of length four. Using 3 queries is in line with other related work which suggests that the user study would have 20-60 participants, who are given 10-30 minutes of training, followed by all participants doing the same 2-20 tasks, during a 1-3 hour session [56]. Both groups execute SPARQL queries against the DBpedia 2014 data set through the same interface and were asked to submit the results they considered correct for each query.
User profiling and recruitment For the aim of our user study, we designed an online survey, which was distributed in the semantic-web and public-lod public mailing lists of the W3C;2929 in the internal mailing lists of the affiliation lab of the authors; and social communities in Facebook and Twitter. As the survey was distributed online, no special recruitment is required. In the introductory page of the survey, we explain to all users the scope of the survey and give instructions on how to complete the survey. For users who choose to answer queries using ABSTAT, we strongly recommended watching an explanatory video about how to use ABSTAT.3030 For users who choose to answer the queries using Protégé, we did not give any training as we assume that users who choose to take such survey are familiar with SPARQL and ontologies.
Questionnaire composition The survey is designed in three parts and would take on average around 30 minutes to be completed. In the first part, we ask users 6 background questions in the form of choosing the best answer which describes them. The second part is about query completion, while in the third part of the survey, we ask all users 7 feedback questions for each query and at the end general comments about the survey.
Evaluation metrics To evaluate the performance of users in completing the survey, we measure the time spent to complete each query and the correctness of the answers. The survey contained the link to a local SPARQL endpoint, accessible from a web page; all participants could use this endpoint to post as many queries as they want and check the results. Users did not receive any explicit feedback on the correctness of the query, but they could check the results of their trials. The users were asked to eventually submit their final query to the survey form. As query time, we recorded the time from the moment when a user accesses the query specification to the moment when the individual submits the result to the query form. The correctness of the answers is calculated as the ratio between the number of correctly answered types and/or properties of the given query against the total number of query variables. We also run different statistical tests in order to evaluate the significance of the obtained results. Moreover, for the qualitative analysis, we defined a set of questions to understand the users’ behavior and systems characteristics.
Once we specify and apply all steps of the methodology we define a set of questions to answer with our user study:
Q1. Does ABSTAT help users to complete queries more accurately with respect to the baseline?
Q2. Does ABSTAT help users to complete queries faster than using the baseline?
Q3. Which is the target group that would take more advantage of ABSTAT profiles and for what kind of queries?
Q4. How intuitive is ABSTAT?
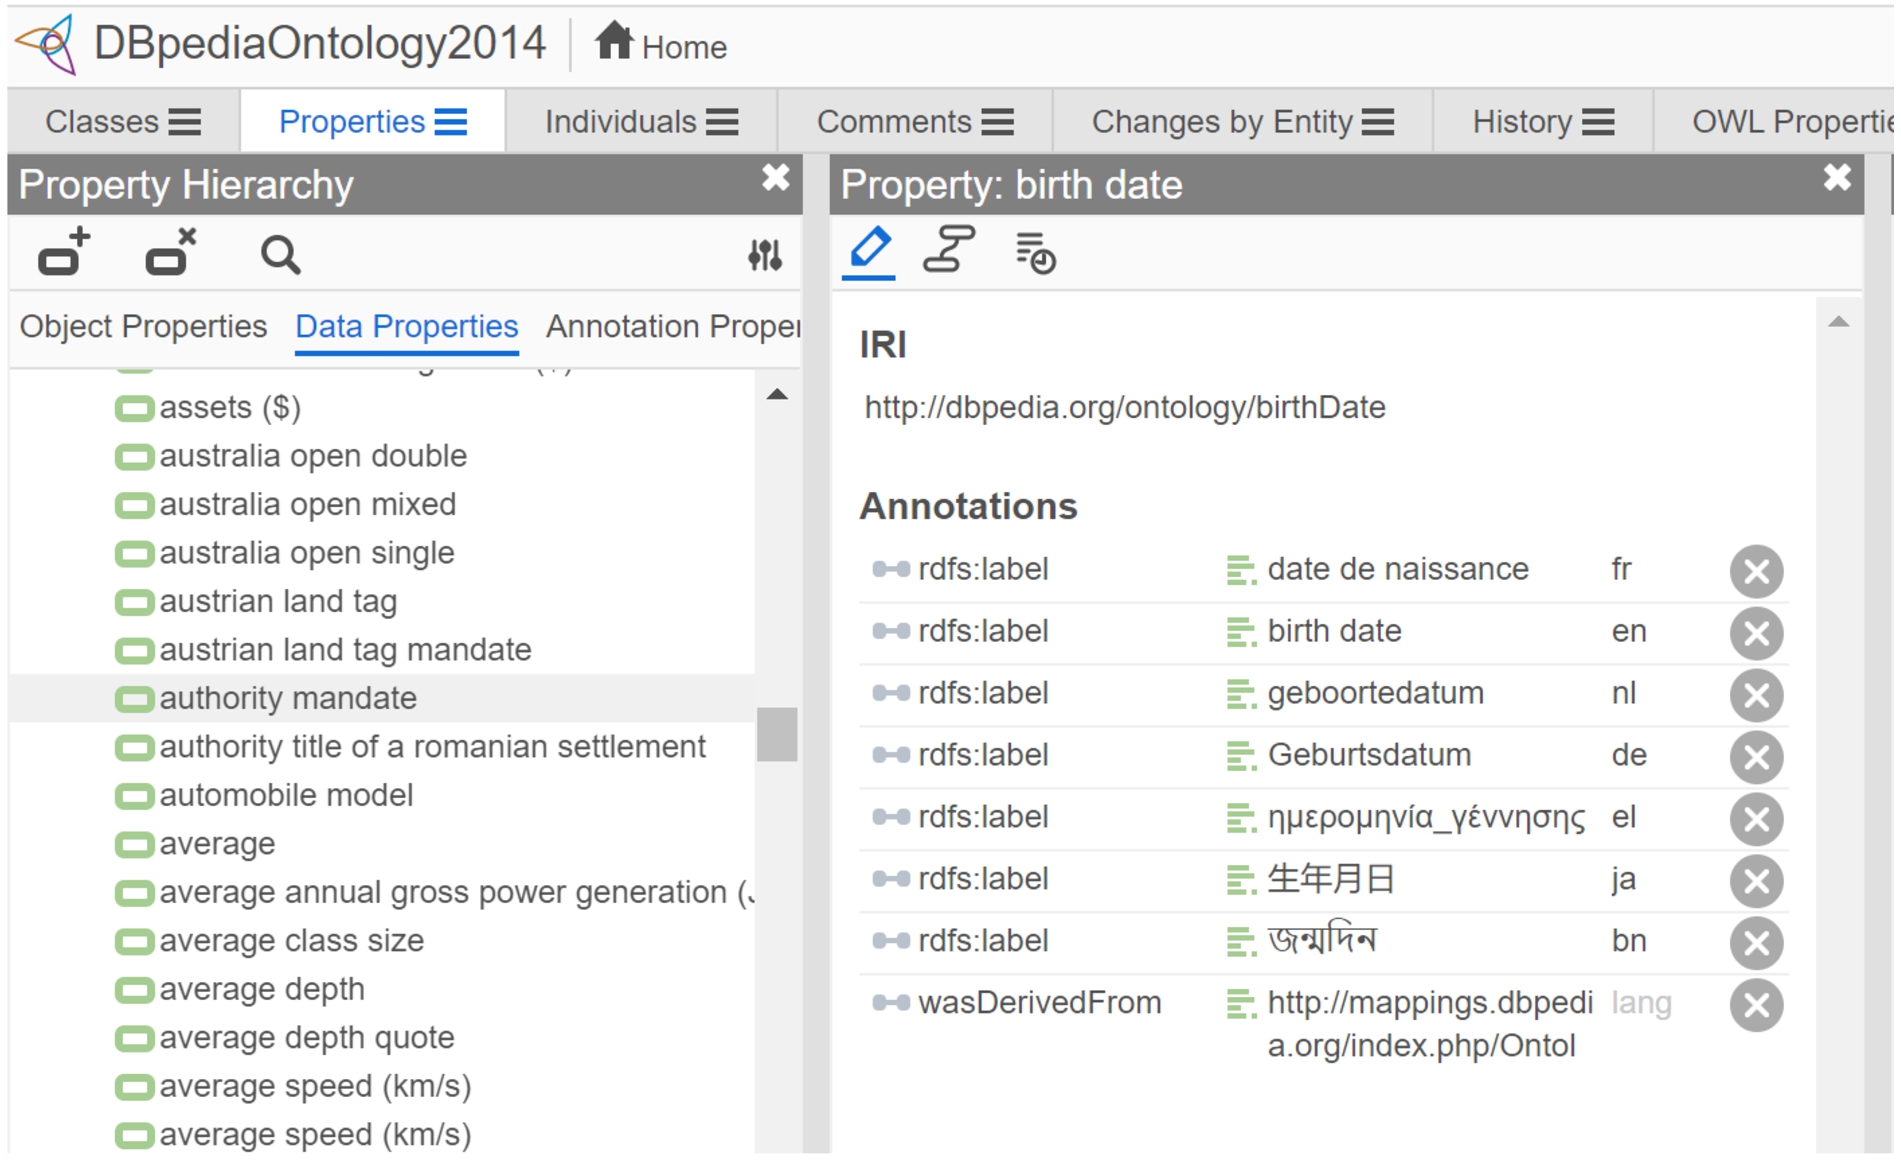
Fig. 5.
Screenshot of DBpedia ontology in WebProtégé.
4.2.Quantitative analysis
In total 117 users completed the survey. Before analysing the results we performed the data cleaning process. Data cleaning is performed in order to remove incorrect information or information that could skew the data. We removed from our data three cases:
– the data from two users who opened and left the survey in stand by (the time spent to answer one single query was ≈2 hours.
– the data from one user who completed only the first part of the survey (background questions)
– the data from a user who took the experiment twice (same mail address and IP). The completion time for the whole experiment had a discrepancy; with one having a bias toward the other as the second experiment had a considerable smaller completion time than the other.
After cleaning the responses from dirty or useless data, we considered 113 answers; 59 users answered the queries using ABSTAT and 54 using Protégé. Not all the users completed the whole survey: 113 (54 ABSTAT and 49 Protégé) completed the first query, 105 (55 ABSTAT and 50 Protégé) the first two queries and only 103 (54 ABSTAT and 49 Protégé) answered to all the three queries.
In the following, we analyse and respond to each of the questions introduced at the beginning of this section.
Q1. Does ABSTAT help users to complete queries more accurately with respect to the baseline?
Table 3 provides the distribution of the number of users and their percentage in answering the survey for each group. The number and the percentage are given for users who correctly answer each query and those who did not.
Table 3
The distribution of the number (and the percentage) of users from both groups for each query
| ABSTAT | Protégé | Total | ||
| Query 1: “Which is the second highest mountain on Earth?” | Correct | 54 (47.8%) | 49 (43.4%) | 103 (91.2%) |
| Not Correct | 5 (4.4%) | 5 (4.4%) | 10 (8.8%) | |
| Query 2: “Which German cities have more than 250000 inhabitants?” | Correct | 23 (21.9%) | 9 (8.6%) | 32 (30.5%) |
| Not Correct | 32 (30.5%) | 41 (39.0%) | 73 (69.5%) | |
| Query 3: “Who is the Formula 1 race driver with the most races?” | Correct | 47 (45.6%) | 40 (38.9%) | 87 (84.5%) |
| Not Correct | 7 (7%) | 9 (9%) | 16 (15.5%) |
Table 4
The average time to answer queries for both groups and the Mann-Whitney test significance
| ABSTAT | Protégé | ||
| Query 1: “Which is the second highest mountain on Earth?” | Avg. time (sec) | 165.3 | 948.6 |
| Mann–Whitney U | U = 2433, | ||
| Query 2: “Which German cities have more than 250000 inhabitants?” | Avg. time (sec) | 979.0 | 1861.6 |
| Mann–Whitney U | U = 1736, | ||
| Query 3: “Who is the Formula 1 race driver with the most races?” | Avg. time (sec) | 309.3 | 375.7 |
| Mann–Whitney U | U = 1151, | ||
Response to Q1: We can observe that for each query, users who choose to answer queries with ABSTAT achieve a higher accuracy (the ratio between the number of correctly answered types and/or properties to the given query against the total number of query variables). There is a notable difference between the number of users who correctly answer all queries using ABSTAT and those who used Protégé. This effect is notable for all queries despite their difficulty (regarding their query length).
Q2. Does ABSTAT help users to complete queries faster with respect to the baseline?
In order to answer Q2, we performed the Mann-Whitney test to understand if there is a statistical difference between the time needed for users from both groups to correctly answer queries in the survey. The Mann-Whitney test compares whether there is a difference in the dependent variable for two independent groups. It compares whether the distribution of the dependent variable is the same for the two groups and therefore from the same population. ABSTAT users performed the task of query completion faster for the most difficult queries still assuring a high accuracy. We interpret the latter trend as a classical cognitive pattern, as the participants became more familiar with ABSTAT interface.
Response to Q2: The Mann-Whitney U test shows that there is a significant difference between the time needed to correctly answer the first two queries, the most difficult ones. Moreover, the average time to answer the easiest query is almost in the same range, even though smaller for ABSTAT users (−66.4 sec). Table 4 reports the value of the Mann-Whitney U test and the average time for correctly answering each query from both groups.
Q3. Which is the target group that would take more advantage of ABSTAT profiles and for what kind of queries?
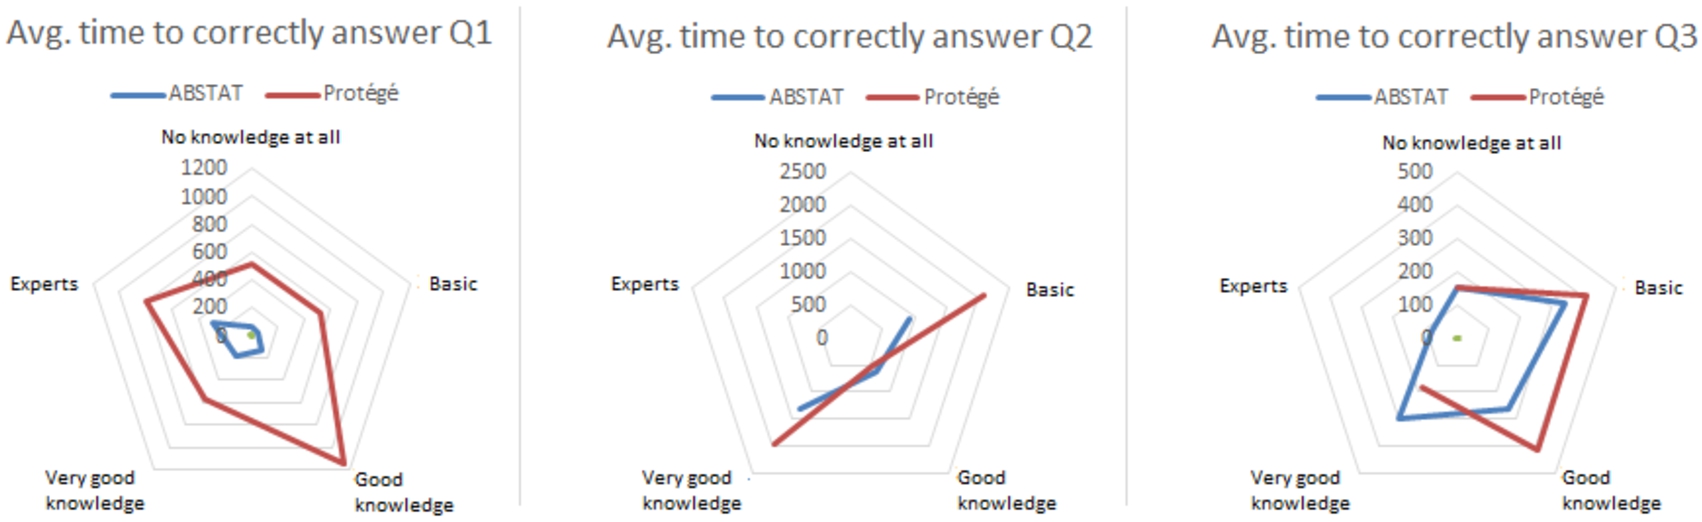
In order to answer the above question we profiled all the participants in terms of knowledge about SPARQL, data modelling, DBpedia data set and ontology. As the aim of the experiment is to evaluate query completion task, we report in Fig. 6 for all users, only the average time for correctly answering each query for each level of SPARQL knowledge that participants reported. The reason for providing only the average time w.r.t. SPARQL knowledge and not the average time of answering queries w.r.t. DBpedia knowledge, or modelling knowledge, is that to the best of our knowledge, we believe that SPARQL knowledge is more important when it comes to the ability of a user to write correct and accurate queries. However, due to the limited space and as a contribution for the community, we make the data available so researchers can exploit other multivariate analyses.
Response to Q3: The average time needed for all participants to correctly answer to the queries, regardless of the SPARQL knowledge, is lower for ABSTAT users than for Protégé users. For the first query, even for Protégé users who reported to have “Good Knowledge”, the time needed is almost 10 times greater than for ABSTAT users. While for the second query, in general users from the Protégé group required more time to answer the query despite their SPARQL knowledge. However, only for users that have “Good Knowledge” the time is slightly higher for ABSTAT users (637 s vs 523 s). Finally, for the third query, the easiest one, the average time between the two groups is relatively in the same range for each SPARQL knowledge level participants report. In general, with respect to Protégé, ABSTAT helps all users despite their SPARQL knowledge to answer correctly and in less time to all queries. Moreover, ABSTAT users took advantage of ABSTAT profiles in answering correctly to medium and more difficult queries.
Fig. 6.
The average time (sec) in answering correctly to the queries for both groups with respect to their SPARQL knowledge.
Q4. How intuitive is exploring ABSTAT’ profiles?
To answer such question we gather evidence on the process of exploring ABSTAT patterns by means of feedback questions: (i) We asked users about their perception of the difficulty in answering the queries, (ii) For each query we asked the number of attempts users submitted to correctly answer them, (iii) Users reported if they made use of other tools / information to answer the queries, and (iv) We analyse users performance on answering queries correctly with respect to the fact that they watched the introductory video of ABSTAT.
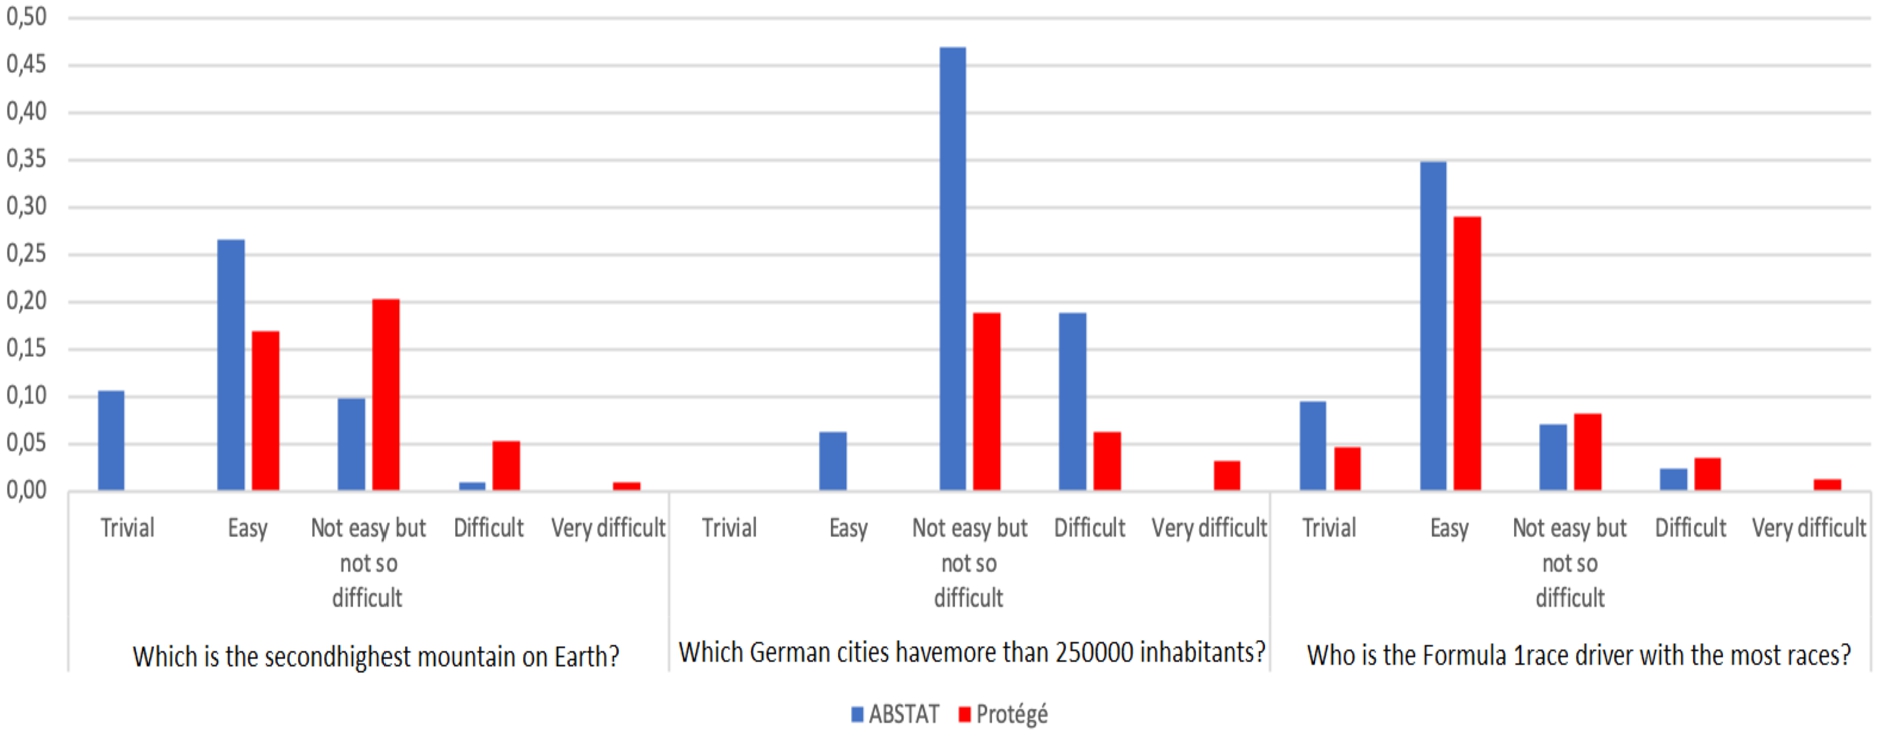
First, participants reported their perception about the difficulty of answering queries by means of the tool chosen for the survey. Figure 7 shows the perception of the participants who answer correctly to the three queries for both groups. ABSTAT users interpret each query to be easier than Protégé users. None of the participants from ABSTAT group reported any query as “Very difficult”. Moreover, the number of the participants from Protégé group who reported the query to be “Difficult” is greater than ABSTAT users and vice versa the perception of the simplicity for each query. Even for query number 2, the most difficult one, 6% of the users who belong to ABSTAT group reported the query to be “Easy”, while none of the users from Protégé reported such query as easy.
Fig. 7.
Perception of the difficulty to answer correctly to each query from both groups.
In order to determine whether there is a significant difference about users perception we use the Mann-Whitney test [33]. The null hypothesis is: There is no evidence for an association between the difficulty in answering the queries and the tool used. The Mann-Whitney test for the perception of the difficulty in answering the first two queries has a p-value smaller than our chosen significance level (p = 0.05), thus we reject the null hypothesis. Rather, we conclude that there is enough evidence to suggest an association between the tool used to complete the queries and the perception of the difficulty in answering them. Participants using ABSTAT perceive the queries to be less difficult than those using Protégé.
Secondly, we asked both groups about the attempts to correctly answer each query. Table 5 shows within each group the percentage of the users and the attempts made to correctly answer each query. For all queries, the percentage of the users who correctly answered with the first try is greater for ABSTAT, while the percentage of the users who made several attempts (for both properties and classes) is greater for Protégé users. Moreover, for query 2, the most difficult one, more than half of Protégé users made several attempts for both classes and predicates and none of them answered it with the first attempt. More than half of Protégé users made several attempts, while there are around 18% of ABSTAT users who answered the first query with the first attempt.
Table 5
Attempts to correctly answer to queries by both groups
| Attempts to correctly answer queries | Query 1 | Query 2 | Query 3 | |||
| ABSTAT | Protégé | ABSTAT | Protégé | ABSTAT | Protégé | |
| No answer | 0.00% | 0.00% | 0.00% | 0.00% | 2.10% | 0.00% |
| I found both variables with the first try | 61.10% | 22.40% | 17.40% | 0.00% | 59.60% | 60.00% |
| I found the class with the first try while I made more than one attempt for the property | 14.80% | 46.90% | 21.70% | 0.00% | 8.50% | 20.00% |
| I found the property with the first try while I made more than one attempt for the object | 22.20% | 16.30% | 21.70% | 44.40% | 19.10% | 7.50% |
| I made several attempts for both variables | 1.90% | 12.20% | 34.80% | 55.60% | 8.50% | 12.50% |
| Other | 0.00% | 2.00% | 4.30% | 0.00% | 2.10% | 0.00% |
| Total | 52.40% | 47.60% | 71.90% | 28.10% | 54.00% | 46.00% |
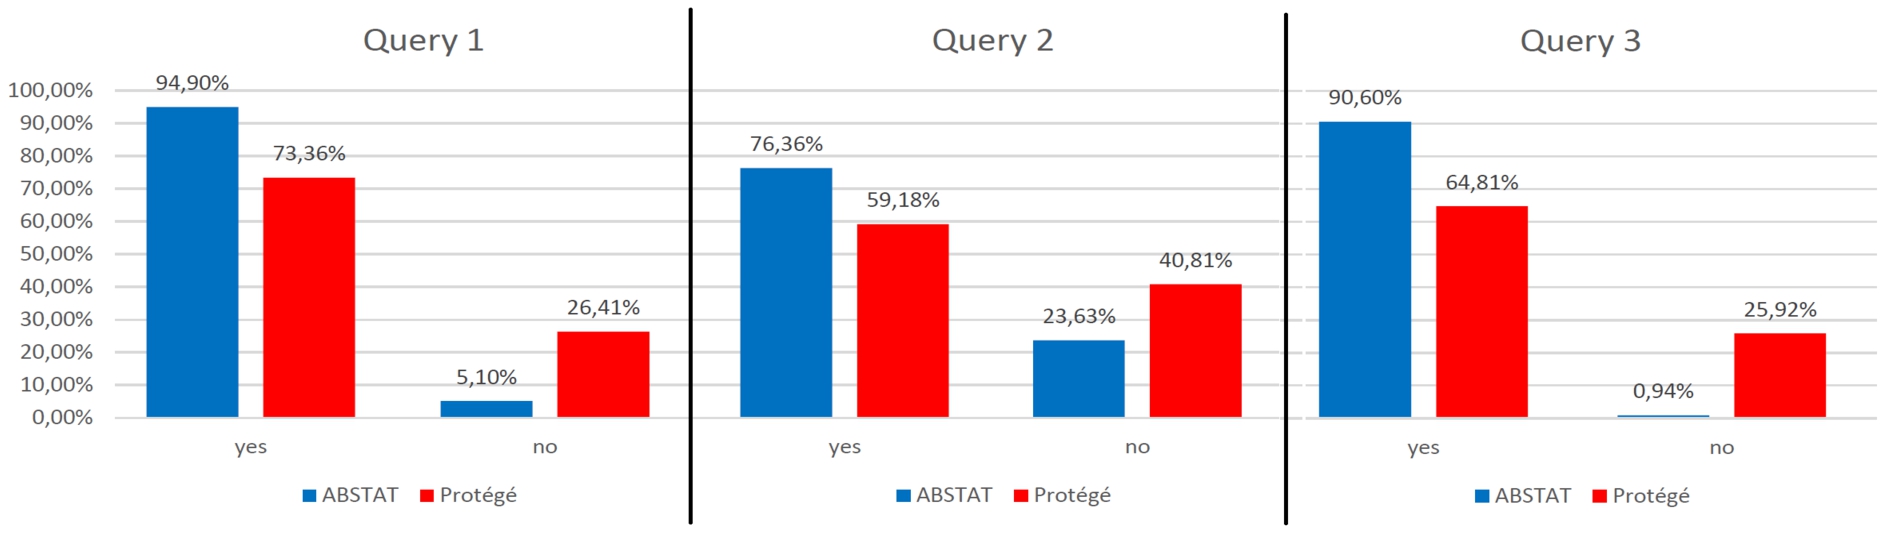
Third, we asked users if the information provided by ABSTAT or Protégé was enough to answer the queries. Figure 8 shows the distribution in the percentage of the users who used only the tool (ABSTAT or Protégé) chosen at the beginning of the survey, to answer queries. For each query, the percentage of the users who choose to make use of other sources to answer the queries is almost twice greater for Protégé users. For the second query, the number of users who needed also other support is around 40% for Protégé group. The main reason why ABSTAT users reported to use other tools to answer the queries, is that they were more familiar with the other chosen tools (DBpedia data set, Google, etc). The comparison between the two groups shows that the percentage of the users who use other methods except the one requested by the survey to answer the queries is greater for Protégé users. None of the users who answer the queries using ABSTAT made research in Google while this was quite often for Protégé users.
Fig. 8.
Distribution of users who used only ABSTAT or Protégé to answer each query.
Fourth, we analysed the performance of users who watched the introductory video on how ABSTAT works at the beginning of the survey. Table 6 sums up the distribution of ABSTAT users who watched the introductory video before taking the survey and correctly answer all queries (Table 3).
Table 6
Distribution of users who watched or did not watch the introductory video of ABSTAT and correctly answer the queries
| Did you watch the video on how to use ABSTAT? | |||
| Yes | No | Total | |
| Query 1 | 29 | 25 | 54 |
| Query 2 | 12 | 11 | 23 |
| Query 3 | 24 | 23 | 47 |
We run the Chi-square test to verify if there is a significant statistical evidence between users who watched the introductory video of ABSTAT and those who did not. The Chi-square test showed that there is no statistical difference between users who watched the introductory video before taking the survey and those who did not, still answering the queries correctly.
Response to Q4: From the results of our analysis we may deduce that ABSTAT profiles are intuitive to understand and use for query completion tasks even without a preliminary explanation.
4.3.Qualitative analysis
The qualitative analysis seeks to explore the phenomena, thus in this section, we answer questions such as: Why did ABSTAT users use only ABSTAT to answer the queries and why did Protégé users also need other support? Why exploring the ontology in Protégé to answer the queries was not enough?
Table 7
Usage of different methods to answer the queries from both groups
| Which is the second highest mountain on Earth? | Which German cities have more than 250000 inhabitants? | Who is the Formula 1 race driver with the most races? | ||||
| ABSTAT | Protege | ABSTAT | Protege | ABSTAT | Protege | |
| DBpedia Ontology (not in Protege) | 1 | 4 | 4 | 5 | 1 | 4 |
| DBpedia web page describing the resource in the query | 2 | 7 | 9 | 12 | 3 | 7 |
| A research in Google | 0 | 3 | 0 | 3 | 0 | 3 |
| Other | 0 | 0 | 0 | 0 | 1 | 0 |
| Total | 3 | 14 | 13 | 20 | 5 | 14 |
The two most used strategies to answer the queries by participants that used Protégé were: to directly access the public web page describing the DBpedia named individuals mentioned in the query and to submit exploratory SPARQL queries to the endpoint (Table 7). Many users searched on Google for some entity in the query, then consulted DBpedia web pages to find the correct answer. DBpedia is arguably the best searchable data set, which is the reason why this exploratory approach was successful for relatively simple queries (query number 3). However, this exploratory approach does not work with other non-indexed data sets (e.g., LinkedBrainz) and for complex queries (query 1 and 2). Instead, participants that use ABSTAT took advantage of the profile, obtaining benefits in terms of average completion time, accuracy, or both, for all queries.
Another interesting result is given by the analysis of users who did not answer correctly to the queries. We profiled users in order to know, what, how and why did they fail to give the right answer. In order to answer to the what question we profiled users in base of their errors. For all queries, ABSTAT users have failed more to find the right classes rather than the right properties. However, this difference is more evident for difficult queries such as query 2, rather than simpler ones.
In order to answer to the how question, we ask users after completing each query, to describe the steps they took to answer it. For the first query, users who failed to answer correctly used wrong properties such as dbo:highestMountain or dbo:height instead of dbo:elevation. However, even though the users did not find the class dbo:Mountain in ABSTAT patterns for the chosen wrong properties (there are no patterns Mountain highestMountain or Mountain height), users were “sure” that dbo:Mountain was the right class. Obviously, with the above configurations for the class and property, users could not retrieve any results as there are no entities in DBpedia represented with such class and predicate. For the Protégé group, users reported that was easier for them to find the right class but it was harder to understand the right property as from the ontology is impossible to understand how such classes are used. ABSTAT users could search for predicates, classes and / or patterns in the query. Once they could search for patterns, users could also visualise and explore them. Thus, their trial and error attempts to accurately complete the queries were much lower with respect to Protégé users. The latter did not have the possibility to explore the relations between concepts. In fact, when Protégé users where asked to explain the steps they took to answer the query, they made several exploratory queries.
This analysis also explains the main motivation for choosing to consider most specific patterns at the price of greater reduction coefficient (see Section 2.4): specific patterns are more likely to match type-related terms used in an intuitive conceptualization of a query, such as “country”, “town”, while references to specific types would be lost in the most general patterns.
Answering to the why question, users failed to find the correct classes and properties because, they did not explore the patterns that describe the relationship between classes, but rather translate the question in natural language “as-is” into SPARQL query. Such problem is more evident to non-native English speakers. A native speaker will, to a significant degree, ignore the syntax of the question and focus on the intention and the meaning it represents [32]. For the second query, errors could be categorised into two types: logical and semantic errors. Logical errors are those errors caused by the use of the wrong syntax in executing the query. Semantic errors instead are those errors which do not cause query failure, as they are semantically correct predicates and classes, but that are not correct with respect to what is asked by the query. For example, a logical error is when users used classes instead of properties and vice versa (dbo:City as predicate). As an example of semantic errors, users used semantically similar properties and classes with respect to the correct answer (dbo:Location instead of dbo:City). Table 8 shows the mistakes done by both groups for Query 2. Most of the users from both groups failed to give the right class/es. Still, most of them were semantic errors. Users mostly choose a similar concept to the right one for answering the query, for example, dbo:Place or dbo:PopulatedPlace. Both groups could find the correct answer for one class (e.g., dbo:City) but failed to find the second one (dbo:Town). In the hierarchy of concepts, City and Town are siblings of Settlement. However, finding the second concept for such query is a problem that is more observable for Protégé users even though they could visualise the hierarchy of concepts of DBpedia ontology in WebProtégé. Users could take advantage of such opportunity in order to find the right concepts (the union between two siblings), but most of them chose a more generic concept or even distinct concepts. While ABSTAT users, even though could not visualise the hierarchy of concepts, could find the right answer because in the profile of DBpedia, users could see two patterns, one for <dbo:City dbo:populationTotal xmls:nonNegativeInteger >and <dbo:Town dbo:populationTotal xmls:nonNegativeInteger>that use populationTotal as predicate. Of course, there are also other patterns, but because of their similar meaning, ABSTAT users choose City and Town as concepts to complete and answer Query 2. Protégé users did not have the possibility to explore the relations between concepts. In fact, when Protégé users were asked to explain the steps they took to answer the query, they made several exploratory queries such as first they found a German city, e.g., Berlin and explored the relative predicates. Many users have reported that initially, they chose the predicate dbo:population, but after exploring all the predicates of the entities of type City, they could change to the correct predicate dbo:populationTotal. A lot of users reported that they choose a superclass to City such as PopulatedPlace or even Place to complete the query as it was very difficult for them to find the right answer. All users tried to explore the query by first accessing the webpage in DBpedia of a German city so they could explore its predicates or relative concepts. Moreover, there were users who searched for such information on Google. Such approach can work only with indexed data sets such as DBpedia. For the same query, ABSTAT users who failed to give the correct answer said that they chose Settlement but they could use also Town. Some said that they were searching for specific entities in ABSTAT’ profiles such as for example “...I tried to put res:Germany in the ‘object type (occurrences)’ section, but I did not get anything...” or “used the full-text search to search for German somewhere and to verify that there are no instances related to cities in German..”. However, also several ABSTAT users failed to find the right predicate (dbo:populationTotal) as they did not use exploratory queries. ABSTAT users took advantage of ABSTAT search and browser interface, something that is not possible to do in Protégé. Despite the errors, still ABSTAT users achieve higher accuracy and better query completion time. To summarize, ABSTAT profiles support users in understanding better the data by: (i) allowing the visualisation and exploration of patterns, (ii) adopting faceted search over the patterns, and (iii) enabling full-text search over a single summary or over several summaries.
Table 8
Errors from two groups for Query 2
| ABSTAT | Protégé | Total | |
| Wrong 1 class | 25 | 34 | 59 |
| Wrong 2 classes | 0 | 3 | 3 |
| Wrong 1 predicate | 1 | 0 | 1 |
| Wrong 2 predicates | 0 | 1 | 1 |
| Wrong 1 class and 1 predicate | 5 | 0 | 5 |
| Wrong 1 class and 2 predicates | 0 | 1 | 1 |
| Wrong 2 classes and 2 predicates | 1 | 2 | 3 |
| Total | 32 | 41 | 73 |
4.4.Lessons learned and limitations
In this section we summarize lessons learned and limitations that we observed during the realisation of the experiments.
Usefulness of ABSTAT. We received positive feedback from the participants of the user study with respect to the necessity of having an up and running profiling tool. The appreciation regarded the usefulness of ABSTAT in finding right objects and predicates and especially the autocompletion suggestions, which are found particularly helpful. Moreover, users stated that it was easier to learn the tool while using.
ABSTAT limitations: tool. Feedback from the user experiment enlighten us in different directions for improving our tool. First, users report that even though statistics about the usage of the types and predicates are very useful, their presentation is a bit difficult for humans to process. Thus, ABSTAT profiles would be more easy and readable if the statistics reported for each pattern would be represented by e.g., a graphical pie chart. Second, that was mostly suggested by the participants is the inclusion of labels or other human-readable description for classes and predicates. Third, users suggested to include in the profile a list of synonyms used to describe a concept or a property. ABSTAT improvement could benefit a lot from such suggestions, thus they are considered for future work.
ABSTAT limitations: approach. Some limitations or features of the ABSTAT summarization approach can also affect its effectiveness in supporting data understanding. First, more compact profiles might be generated. For example, by considering equivalent classes or properties, the number of patterns in the profile would be lower, reducing the number of patterns that user have to explore. Equivalent classes and properties could be discovered using well-known lexical ontology matching methods [13,18,19], but the ABSTAT summarization approach must be adapted to handle equivalence properly. Second, being a schema-pattern profiling tool, ABSTAT profiles do not include information about entities. Thus, ABSTAT supports users only on writing queries regarding the structure of the KG. Often, users need to have “templates” of how entities are modelled so that they can start their exploration. Third, a limitation that was highlighted also from our first experiment lies in representing concepts that are used as entities (e.g., Surfing, CEO, etc. [64,65]). Such issues might be solved by applying state-of-the-art approaches for type inference on RDF data, or by including in the profiles, values for concepts that are defined by closed and relatively small instance sets.
User study limitations: user expertise. The user study highlights the valuable support that ABSTAT provides in writing SPARQL queries, but has also one limitation. When designing the experimental setup, the assignment of the tool used as a support for completing the query is left to the user choice. For this reason, the distribution of the self-reported SPARQL-related competency is not equally distributed between the two groups. More precisely, ABSTAT group includes two self-reported expert users, while no self-reported expert used Protégé. However, one of the experts could only answer to first query and quit the survey while the other expert completed the survey and answered correctly to the first and third query while giving the wrong answer to the second query. In order to verify if the statistical significance is influenced by these two experts, we remove them from the analysis and run again the Chi-Square test. Even removing the expert users from the evaluation, the significance is maintained, meaning that all non expert users took advantage of using ABSTAT in completing the queries faster and more accurately.
User study limitations: introductory videos. Another limitation regards the possibility to watch an introductory video only for users who decided to answer queries using ABSTAT. We run a statistical test to verify if such video has influenced the performance of the users. Indeed, the statistical test showed that there is no statistical differences between users who answered to the queries correctly and the fact that they watched the introductory video or not.
User study limitations: direct comparison with Loupe. We do not provide a direct experimental comparison with Loupe, the most similar profiling approach to ours, for the reasons discussed in Section 4.1. However, based on the feedback collected in the surveys, we perform a qualitative analysis of the representative exploration patterns that users applied with the Browse UI to collect evidence about potential effects of minimalization (the difference between ABSTAT and Loupe more relevant for this experiment) in reducing the exploration effort. The analysis is included in the Appendix.
5.Related work
In this section, we first discuss the related work on supporting data set understanding (Section 5.1) and second, we discuss approaches that support Knowledge Graph Profiling (Section 5.2). Although the number of works on data understanding is high (as will be described in the following), we have not found an agreed data protocol for data understanding.
5.1.Understanding unknown data
Several approaches, categorised as in the following, have been proposed to support users understand the content of a data set.
Data Visualization is an effective way of gaining insights into data [14,31] as it improves interpretability and understanding of the data at hand, facilitating exploration. There exist two paradigms for sensemaking of the data by visualization: global views (top-down) and local views (bottom-up). Approaches based on the global views follow Shneiderman’s mantra “overview, zoom & filter, details-on-demand” pattern [61], and provide the users a big picture of the data, and let them focus on a particular area of the data as the individual zooms and filters [9]. However, such approaches have several challenges when applied to graphs with millions or billions of nodes and edges [44]: (i) such graph overviews are time-consuming to generate, and (ii) there are no perfect overviews. Approaches based on local views aim to support users to identify the nodes to explore at a low level of abstraction, followed by the generation of an overall visualization [52]. The challenges of such approaches are: (i) difficulty to identify the node from which to start the exploration [3], (ii) difficulty to decide which path to follow because nodes have many neighbours [66], and (iii) no users support to write SPARQL queries and understand the relations among types in the graph.
Exploring the data by using faceted search is an effective way as they are intuitive to understand and use [30,54]. However, although facets are very useful to reduce the search space, a large number of facets and facet values might become misleading for users with choice overload and visual clutter. There exist some user studies on how people use facets; e.g., what components of the interface searchers looked at, for how long, and in what order, etc., and they also provide qualitative summaries of users’ comments on how facets help their searches [35,54].
Another direction towards data understanding is to automatically construct SPARQL queries based on user-provided examples known as query-by-example approaches [25,47]. To understand the data users need to interactively execute many queries using different predicates aiming to balance the trade-off between collecting all relevant information and reducing the size of returned data [25].
However, such approaches (i) focus on simple inputs; e.g., a single entity or a pair of entities, but with the increase of the data available in KGs, one or two entities are not satisfactory anymore, (ii) might have different ways on how to expand a given query, thus not all expansions may be of interest to the user, and a large number of expansions may overload the user, (iii) allow to query the graph locally, and thus, do not provide a general overview of the relations among types used in the graph.
Ontologies are considered to be the pillar of the Semantic Web and help users to understand the data [27]. The user, through the support of a tool such as Protégé (implements an “overview first, details-on-demand” approach), accesses first the entire taxonomy, which the individual might expand, and then explore properties, check their domain and range, etc. Understanding the data by looking only at the ontology is complicated; (i) sometimes they do not even exist, (ii) sometimes they are unspecified, and (iii) it may happen that data uses multiple ontologies.
Profiles generated by ABSTAT implement some of the above features. ABSTAT profiles support users in understanding better the data by: (i) allowing the visualisation and exploration of patterns, (ii) adopting faceted search over the patterns, and (iii) enabling full-text search over a single summary or over several summaries.
5.2.Knowledge graph profiling
There exist several works on data profiling as it is reviewed in this section and in another recent work [4]. However, to the best of our knowledge, none of the existing profiling approaches have evaluated their ability to produce concise and meaningful profiles from a user perspective. Therefore, in the following, we review related work only considering the algorithm of the profiling approach.
RDF graph profiling has been intensively studied, and various approaches and techniques have been proposed to provide a concise and meaningful representation of an RDF KG.
Inspired by the work in [11], we use the same classification of the related works on KGs profilings. However, the works discussed in each group are different as we focus not only on the summarization approaches but also on the profiling ones.
– Structural summarization approaches: These approaches aim to create a summary to support data understanding and visualisation of complex graphs: (i) by considering a set of rules that extract subtypes and subproperties to represent many nodes and edges, or (ii) by extracting clusters to group a set of similar concepts and properties.
A formal model for a data graph summary that considers vocabulary usage to assist users in formulating queries across multiple data sources is proposed in [10]. The authors define the concept of node collections which is a set of nodes sharing similar characteristics and develop an Assisted SPARQL , which is an application that leverages the data graph summary to help users into effectively formulating complex SPARQL queries.
S + EPPS is a system that supports users by providing summaries based on bisimilarity notion and SPARQL engines to support summary-based exploration [16]. Summaries are constructed by blocks where each block represents a non-overlapping subset of the original data set.
ExpLOD is used to summarize a data set based on a mechanism that combines text labels and bisimulation contractions [40].
SchemEX is a stream-based approach used to provide a summary of triples that can be found in a data source [41].
Given a SPARQL query, SchemEX performs a lookup in the index structure to find which data sets contain instances of a specific RDF schema concept that can contribute to answering the query. Our work differs from these works since we introduce concise profiles thanks to the minimalization technique and do not cluster nodes with similar characteristics. Moreover, ABSTAT does not have an interface to help users formulate SPARQL queries instead patterns are used to support users writing SPARQL queries into the KG endpoint.
– Pattern mining methods: are used to extract patterns from the RDF graph that “best” represent the input graph.
The algorithm of approximate graph pattern matching [63] produces summaries that are capable of summarizing entities in terms of their neighborhood similarity up to a certain distance and a specified bound to indicate the maximum number of the desired patterns. The summaries/patterns are chosen to satisfy and maximize informativeness (which should capture the total amount of information; entities and their relationships in a knowledge graph) and diversity (which should cover diverse concepts with informative summaries).
A scalable lossless compression approach for RDF data sets is presented in [37]. Such an approach uses the automatic generation of decompression rules and removes triples that can be inferred from these rules.
In [50] authors propose a summarization technique called k-SNAP that integrates an interactive querying scheme by allowing users to customize the summaries based on user-selected node attributes and relationships.
Such method allows users to select node attributes and relationships that are of interest and to fix a priori the size of the graph.
An approach that includes in the summary a weighted graph composed of supernodes connected by superedges as a result of the partitioning of the original set of vertices in the graph is proposed in [59]. The superedge weights are the edge densities between vertices in the corresponding supernodes. A reconstruction error is proposed to introduce the error for the dissimilarity between the original graph and the summary.
Differently from the above approaches, ABSTAT does not partition the data set based on rules, but instead processes the whole data set and only the final summary is presented to the user. Further, ABSTAT uses a different approach to summarize data and does not consider edge densities. Finally, the ABSTAT profiles provide a one-time profile and does not generate personalized profiles according to a user query.
– Statistical methods: In this class are classified all approaches that aim to produce summaries that quantitatively represent the content of the RDF graph. Quantitative information might be used by users to decide if the data set is useful for them or not. LODSight [28] is a web-based tool that displays a summary of classes, datatypes and predicates used in the data set. The visualization allows to quickly and easily find out what kind of data the data set contains and its structure. It also shows how vocabularies are used in the data set.
Another tool that tackles data exploration-based aggregation is SPADE [24]. Spade uses OLAP-style aggregation to provide users with meaningful content of an RDF graph. It chooses aggregates that are visually interesting, a property formally based on statistic properties of the aggregation query results. Users may refine a given aggregate, by selecting and exploring its subclasses. The aggregation is centered around a set of facts, which are nodes of the RDF graph.
RDFStats generates statistics for data sets behind SPARQL endpoint and RDF documents [45]. These statistics include the number of anonymous subjects and different types of histograms; URIHistogram for URI subject and histograms for each property and the associated range(s). It also uses methods to fetch the total number of instances for a given class, or a set of classes and methods to obtain the URIs of instances. LODStats is a profiling tool which can be used to obtain 32 different statistical criteria for RDF data sets [7]. These statistics describe the data set and its schema and include statistics about the number of triples, triples with blank nodes, labeled subjects, number of owl:sameAs links, class and property usage, class hierarchy depth, cardinalities etc. These statistics are then represented using Vocabulary of Interlinked Datasets (VOID) and Data Cube Vocabulary.3131 LODOP is a framework for executing, optimizing and benchmarking profiling tasks in Linked Data [29].
ProLOD + + is a web browser tool that implements several algorithms with the aim to compute different profiling, mining or cleansing tasks [2].
ProLOD + + can also identify predicates combinations that contain only unique values as key candidates to distinctly identify entities.
Differently from the above approaches, ABSTAT provides not only statistics on the use of the vocabulary (classes and properties) but also represents KGs content by representing patterns and their respective frequency. ABSTAT does not use aggregation methods for different summary resolutions, but instead, it produces only one summary by making use of a terminology graph to extract only patterns that describe relationships between instances of the most specific types.
–Hybrid methods: Most of the approaches developed so far combine methods from the structural, statistical and pattern-mining classes in order to provide meaningful summaries. The approach most similar to ABSTAT is Loupe [53]. Loupe extracts types, properties and namespaces, along with a rich set of statistics about their use within the data set. It offers a triple inspection functionality, which provides information about triple patterns that appear in the data set and their frequency. Triple patterns have the form < subjectType, property, objectType >. RDF graphs might be more comprehensible by reducing their size as proposed by [6]. Size reduction is a result of bisimulation and agglomerative clustering (one of the most common types of hierarchical clustering) which discovers subgraphs that are similar with respect to their structure. The semi-structured data summarization approach proposed in [12] is query-oriented. The summary enables static analysis and helps formulate and optimise queries. The scope of such summaries is to reflect whether the query has some answers against this graph, or finding a simpler way to formulate the query. In summary, information that can be easily inferred is excluded. Such approach has a very high computational complexity.
Differently from the above approaches, ABSTAT does not use clustering but instead reduces the number of patterns based on the minimalisation technique producing profiles that are more concise. In this way, ABSTAT excludes the summary patterns that can be easily inferred by the subtype graph.
6.Conclusions
Understanding big knowledge graphs can be a complex and challenging task. In this paper, we present a method to evaluate data profiling tools from a user perspective related to data understanding. Based on the experimentation we show that our profiling framework is able to provide both concise and informative profiles for a given data set. Ontology-based ABSTAT profiles are more concise than similar pattern-based profiles that do not apply ABSTAT’s minimalization mechanism. ABSTAT profiles are also informative as they help users understand the structure of complex KGs like DBpedia.
The latter feature has been measured in a user study where 113 participants had the task to complete a set of queries in SPARQL using ABSTAT profiles and WebProtégé. The analysis showed that all users, independently of their proficiency in Semantic Web technologies could gain advantage of ABSTAT profiles: on average, they completed the queries more accurately and in less time than users that used WebProtégé as a baseline method for exploring the structure of the KG. Statistical evidence suggests that ABSTAT is significantly more helpful for queries of medium-high difficulty, and as much helpful for simple queries. An interesting phenomenon that emerged in our study concerns the users’ perception on the difficulty of the queries: users that performed the task using ABSTAT seem to have perceived queries as less difficult.
Moreover, ABSTAT users had to make fewer attempts to submit their queries and resorted much less frequently to alternative methods, such as trying exploratory queries over search engines and exploring pages of DBpedia entities, used by many users from the WebProtégé group. It is particularly remarkable because these alternative methods are not available for most of the KG available on the web, which cannot be reached effectively via web searches. Otherwise, only a few users from the ABSTAT group accessed the DBpedia web page and none of the users made a complementary web search.
Finally, ABSTAT interface is easy to be used even for users who are not trained before. The statistical test showed that there is no statistical difference between users who are trained before performing the task and the ones who use ABSTAT for the first time while performing the task.
We plan to extend ABSTAT profiles with other relevant statistics that might help users in understanding better the data such as the general information about the usage of classes and properties (object / datatype) and value distributions for numerical properties. Moreover, we plan to use such statistics to capture also quality errors in the data. Inspired by the outcomes of the user survey we are planning to apply type inference on RDF data to infer types for entities that are not specified. Moreover, we plan to apply schema-matching techniques on types and predicates in order to have even more compact summaries.
Notes
4 Entity types are usually referred to as classes; in this paper, we prefer to use the term “entity type” to refer to classes, so that we can use the broader term “type” to refer to entity and data types.
6 Schema.org has a semantic that many regards as even more intuitive than RDFS, especially in relation to modeling the usage of properties; however, Schema.org constructs’, e.g., domainInclude, do not introduce any constraints on the domain and thus any kind of inference. For this reason we do not consider it as a full-fledged ontology language.
11 Underspecification is often well justified and not imputable to quality issues.
15 In case an entity has more than one specific type (formally, more minimal types), e.g., two types that belong to different branches of a type hierarchy, a pattern is added for each pair of subject-object types. We remind that the sub-type graph is organized in ABSTAT as a poset, which obviously covers the possibility that one type is a subclass of different types. In particular for a triple
16 performances has been tested on a virtual machine server with 4 virtual CPUs and 12GiB of RAM.
Acknowledgements
This research has been supported in part by EU H2020 projects EW-Shopp – Grant n. 732590, EuBusinessGraph – Grant n. 732003, FoodNET and enRichMyData – Grant HE 101070284.
Appendices
Appendix
Table 9
The number of patterns users should explore for ABSTAT and Loupe (Query 1)
| Query 1: Which is the second highest mountain on Earth? | ||
| ABSTAT | LOUPE | |
| Predicate first (dbo:elevation) | 9 | 16 |
| Class first (dbo:Mountain) | 5 | 8 |
Table 10
The number of patterns users should explore for ABSTAT and Loupe (Query 2)
| Query 2: Which German cities have more than 250000 inhabitants? | ||||
| Description | Query elements to find | Nr of patterns | ||
| ABSTAT | LOUPE | |||
| I | Users search for dbo:Country in the object position of the patterns. With this exploration, users should find patterns that have dbo:Town and dbo:City in the subject position | dbo:Town | 35 | 52 |
| dbo:City | 62 | 98 | ||
| II | Users search for the predicate dbo:populationTotal. With this exploration, users should identify how such predicate is used in the data set and with what classes | dbo:Town | 5 | 9 |
| dbo:City | 6 | 10 | ||
| III | Users search for dbo:City in the subject position of the patterns. With this exploration, users should find how entities of type City are described in the data set to find the predicate used to represent the population. | dbo:populationTotal | 14 | 18 |
| IV | Users search for dbo:Town in the subject position of the patterns. With this exploration, users should find how entities of type Town are described in the data set to find the predicate used to represent the population | dbo:populationTotal | 20 | 28 |
| V | Users search for the predicate dbo:country and for the type dbo:Country in the object position of the patterns to determine what type of places are present in entities of type Country. | dbo:Town | 15 | 24 |
| dbo:City | 25 | 40 | ||
As we could not evaluate in a direct experimental settings ABSTAT and Loupe, here, we provide an analysis about the exploration process of patterns to answer to the queries of the survey. For our experiments we reconstructed Loupe’s summary for DBpedia 2014 with ABSTAT. Loupe adapts the same principle as ABSTAT, instead it does not use minimalisation, meaning that it extracts from the data all patterns of the form s_type, p, o_type. This is equivalent to what is achieved with ABSTAT in the absence of the ontology (which is used for constructing the subtype graph to extract minimal types).
Table 11
The number of patterns users should explore for ABSTAT and Loupe (Query 3)
| Query 3: Who is the Formula 1 race driver with the most races? | ||
| ABSTAT | LOUPE | |
| Predicate first (dbo:races) | 5 | 10 |
| Class first (dbo:FormulaOneRacer) | 4 | 6 |
Table 9 gives an overview of the number of patterns ABSTAT and Loupe users have to explore in order to find the possible solutions to complete Query 1. We started exploring the summaries by searching for the predicate elevation. Using ABSTAT the right class is placed in the 9th row of the summary while in Loupe such pattern is placed on the 16th row of the summary. Despite the fact that users could start the exploration guessing either the right predicate or the right class, the number of patterns users have to explore is greater for Loupe. This is also reflected in all the other queries as in Table 10 and in Table 11. In conclusion, users could also profit from Loupe’ profiles to correctly answer to the queries of the survey, however, they would need more time to find the right classes and predicates as a result of the number of patterns that they have to load and explore. ABSTAT users instead could benefit from the minimalization technique and explore less patterns in order to come to the right answer.
Two versions of profiles were then created: (i) using minimalization, and (ii) without minimalization (Loupe approach). For each query in the survey we counted the number of patterns that users had to explore in order to find the right predicates / types / patterns to correctly complete and answer them. For the first query Which is the second highest mountain on Earth? user should explore patterns that relate the predicate elevation and the class Mountain. Here we identify two cases: (i) users could guess at first the predicate and search for the class, and (ii) users could guess first the class and search for the predicate.
References
[1] | Z. Abedjan, Data profiling, in: Encyclopedia of Big Data Technologies, S. Sakr and A.Y. Zomaya, eds, Springer, (2019) . doi:10.1007/978-3-319-63962-8_8-1. |
[2] | Z. Abedjan, T. Grütze, A. Jentzsch and F. Naumann, Profiling and mining RDF data with prolod + +, in: IEEE 30th International Conference on Data Engineering, ICDE 2014, Chicago, IL, USA, March 31–April 4, 2014, I.F. Cruz, E. Ferrari, Y. i Tao, E. Bertino and G. Trajcevski, eds, IEEE Computer Society, (2014) , pp. 1198–1201. doi:10.1109/ICDE.2014.6816740. |
[3] | L. Akoglu, D.H. Chau, U. Kang, D. Koutra and C. Faloutsos, Opavion: Mining and visualization in large graphs, in: Proceedings of the ACM SIGMOD International Conference on Management of Data, SIGMOD 2012, Scottsdale, AZ, USA, May 20–24, 2012, K. Selçuk Candan, Y. Chen, R.T. Snodgrass, L. Gravano and A. Fuxman, eds, ACM, (2012) , pp. 717–720. doi:10.1145/2213836.2213941. |
[4] | R.A. Alva Principe, A. Maurino, M. Palmonari, M. Ciavotta and B. Spahiu, ABSTAT-HD: A scalable tool for profiling very large knowledge graphs, VLDB J. 31: (5) ((2022) ), 851–876. doi:10.1007/s00778-021-00704-2. |
[5] | R.A. Alva Principe, B. Spahiu, M. Palmonari, A. Rula, F. De Paoli and A. Maurino, ABSTAT 1.0: Compute, manage and share semantic profiles of RDF knowledge graphs, in: The Semantic Web: ESWC 2018 Satellite Events – ESWC 2018 Satellite Events, Revised Selected Papers, Heraklion, Crete, Greece, June 3–7, 2018, A. Gangemi, A.L. Gentile, A. Giovanni Nuzzolese, S. Rudolph, M. Maleshkova, H. Paulheim, J.Z. Pan and M. Alam, eds, Lecture Notes in Computer Science, Vol. 11155: , Springer, (2018) , pp. 170–175. doi:10.1007/978-3-319-98192-5_32. |
[6] | A. Alzogbi and G. Lausen, Similar structures inside rdf-graphs, in: Proceedings of the WWW2013 Workshop on Linked Data on the Web, Rio de Janeiro, Brazil, 14 May, 2013, C. Bizer, T. Heath, T. Berners-Lee, M. Hausenblas and S. Auer, eds, CEUR Workshop Proceedings, Vol. 996: , CEUR-WS.org, (2013) . |
[7] | S. Auer, J. Demter, M. Martin and J. Lehmann, LODStats – an extensible framework for high-performance dataset analytics, in: Proceedings, Knowledge Engineering and Knowledge Management – 18th International Conference, EKAW 2012, Galway City, Ireland, October 8–12, 2012, A. ten Teije, J. Völker, S. Handschuh, H. Stuckenschmidt, M. d’Aquin, A. Nikolov, N. Aussenac-Gilles and N. Hernandez, eds, Lecture Notes in Computer Science, Vol. 7603: , Springer, (2012) , pp. 353–362. doi:10.1007/978-3-642-33876-2_31. |
[8] | N. Bikakis and T.K. Sellis, Exploration and visualization in the web of big linked data: A survey of the state of the art, 2016, CoRR arXiv:1601.08059. |
[9] | K. Börner, C. Chen and K.W. Boyack, Visualizing knowledge domains, Annu. Rev. Inf. Sci. Technol. 37: (1) ((2003) ), 179–255. doi:10.1002/aris.1440370106. |
[10] | S. Campinas, T. Perry, D. Ceccarelli, R. Delbru and G. Tummarello, Introducing RDF graph summary with application to assisted SPARQL formulation, in: 23rd International Workshop on Database and Expert Systems Applications, DEXA 2012, Vienna, Austria, September 3–7, 2012, A. Hameurlain, A.M. Tjoa and R.R. Wagner, eds, IEEE Computer Society, (2012) , pp. 261–266. doi:10.1109/DEXA.2012.38. |
[11] | S. Cebiric, F. Goasdoué, H. Kondylakis, D. Kotzinos, I. Manolescu, G. Troullinou and M. Zneika, Summarizing semantic graphs: A survey, VLDB J. 28: (3) ((2019) ), 295–327. doi:10.1007/s00778-018-0528-3. |
[12] | S. Cebiric, F. Goasdoué and I. Manolescu, Query-oriented summarization of RDF graphs, Proc. VLDB Endow. 8: (12) ((2015) ), 2012–2015. doi:10.14778/2824032.2824124. |
[13] | M. Cheatham, C. Pesquita, D. Oliveira and H.B. McCurdy, The properties of property alignment on the semantic web, Int. J. Metadata Semant. Ontologies 13: (1) ((2018) ), 42–56. doi:10.1504/IJMSO.2018.096452. |
[14] | M. Chen, D.S. Ebert, H. Hagen, R.S. Laramee, R. van Liere, K.-L. Ma, W. Ribarsky, G. Scheuermann and D. Silver, Data, information, and knowledge in visualization, IEEE Computer Graphics and Applications 29: (1) ((2009) ), 12–19. doi:10.1109/MCG.2009.6. |
[15] | M. Ciavotta, V. Cutrona, F. De Paoli, N. Nikolov, M. Palmonari and D. Roman, Supporting semantic data enrichment at scale, in: Technologies and Applications for Big Data Value, E. Curry, S. Auer, A.J. Berre, A. Metzger, M.S. Pérez and S. Zillner, eds, Springer, (2022) , pp. 19–39. doi:10.1007/978-3-030-78307-5_2. |
[16] | M.P. Consens, V. Fionda, S. Khatchadourian and G. Pirrò, S + EPPs: Construct and explore bisimulation summaries, plus optimize navigational queries; all on existing SPARQL systems, Proc. VLDB Endow. 8: (12) ((2015) ), 2028–2031. doi:10.14778/2824032.2824128. |
[17] | M. Cremaschi, F. De Paoli, A. Rula and B. Spahiu, A fully automated approach to a complete semantic table interpretation, Future Gener. Comput. Syst. 112: ((2020) ), 478–500. doi:10.1016/j.future.2020.05.019. |
[18] | I.F. Cruz, M. Palmonari, F. Caimi and C. Stroe, Towards “on the go” matching of linked open data ontologies, in: Workshop on Discovering Meaning on the Go in Large Heterogeneous Data 2011 (LHD-11), Barcelona, Spain, July 16, 2011, (2011) , pp. 37–42. |
[19] | I.F. Cruz, M. Palmonari, F. Caimi and C. Stroe, Building linked ontologies with high precision using subclass mapping discovery, Artif. Intell. Rev. 40: (2) ((2013) ), 127–145. doi:10.1007/s10462-012-9363-x. |
[20] | V. Cutrona, F. Bianchi, E. Jiménez-Ruiz and M. Palmonari, Tough tables: Carefully evaluating entity linking for tabular data, in: Proceedings, Part II, the Semantic Web – ISWC 2020 – 19th International Semantic Web Conference, Athens, Greece, November 2–6, 2020, J.Z. Pan, V.A.M. Tamma, C. d’Amato, K. Janowicz, B. Fu, A. Polleres, O. Seneviratne and L. Kagal, eds, Lecture Notes in Computer Science, Vol. 12507: , Springer, (2020) , pp. 328–343. doi:10.1007/978-3-030-62466-8_21. |
[21] | V. Cutrona, M. Ciavotta, F. De Paoli and M. Palmonari, ASIA: A tool for assisted semantic interpretation and annotation of tabular data, in: Proceedings of the ISWC 2019 Satellite Tracks (Posters & Demonstrations, Industry, and Outrageous Ideas) co-located with 18th International Semantic Web Conference (ISWC 2019), Auckland, New Zealand, October 26–30, 2019, M.C. Suárez-Figueroa, G. Cheng, A.L. Gentile, C. Guéret, C.M. Keet and A. Bernstein, eds, CEUR Workshop Proceedings, Vol. 2456: , CEUR-WS.org, (2019) , pp. 209–212. |
[22] | V. Cutrona, F. De Paoli, A. Kosmerlj, N. Nikolov, M. Palmonari, F. Perales and D. Roman, Semantically-enabled optimization of digital marketing campaigns, in: Proceedings, Part II, the Semantic Web – ISWC 2019 – 18th International Semantic Web Conference, Auckland, New Zealand, October 26–30, 2019, C. Ghidini, O. Hartig, M. Maleshkova, V. Svátek, I.F. Cruz, A. Hogan, J. Song, M. Lefrançois and F. Gandon, eds, Lecture Notes in Computer Science, Vol. 11779: , Springer, (2019) , pp. 345–362. doi:10.1007/978-3-030-30796-7_22. |
[23] | T. Di Noia, C. Magarelli, A. Maurino, M. Palmonari and A. Rula, Using ontology-based data summarization to develop semantics-aware recommender systems, in: The Semantic Web – 15th International Conference, ESWC 2018, Proceedings, Heraklion, Crete, Greece, June 3–7, 2018, A. Gangemi, R. Navigli, M.-E. Vidal, P. Hitzler, R. Troncy, L. Hollink, A. Tordai and M. Alam, eds, Lecture Notes in Computer Science, Vol. 10843: , Springer, (2018) , pp. 128–144. doi:10.1007/978-3-319-93417-4_9. |
[24] | Y. Diao, P. Guzewicz, I. Manolescu and M.M. Spade, A modular framework for analytical exploration of RDF graphs, Proc. VLDB Endow. 12: (12) ((2019) ), 1926–1929. doi:10.14778/3352063.3352101. |
[25] | K. Dimitriadou, O. Papaemmanouil and Y. Diao, Explore-by-example: An automatic query steering framework for interactive data exploration, in: International Conference on Management of Data, SIGMOD 2014, Snowbird, UT, USA, June 22–27, 2014, C.E. Dyreson, F. Li and M. Tamer Özsu, eds, ACM, (2014) , pp. 517–528. doi:10.1145/2588555.2610523. |
[26] | J. Dokulil and J. Katreniaková, Visual exploration of RDF data, in: SOFSEM 2008: Theory and Practice of Computer Science, 34th Conference on Current Trends in Theory and Practice of Computer Science, Nový Smokovec, Slovakia, January 19–25, 2008, V. Geffert, J. Karhumäki, A. Bertoni, B. Preneel, P. Návrat and M. Bieliková, eds, Lecture Notes in Computer Science, Vol. 4910: , Springer, (2008) , pp. 672–683. doi:10.1007/978-3-540-77566-9_58. |
[27] | J. Domingue, D. Fensel and J.A. Hendler (eds), Handbook of Semantic Web Technologies, Springer, (2011) . doi:10.1007/978-3-540-92913-0. |
[28] | M. Dudás, V. Svátek and J. Mynarz, Dataset summary visualization with LODSight, in: The Semantic Web: ESWC 2015 Satellite Events – ESWC 2015 Satellite Events Portorož, Revised Selected Papers, Slovenia, May 31–June 4, 2015, F. Gandon, C. Guéret, S. Villata, J.G. Breslin, C. Faron-Zucker and A. Zimmermann, eds, Lecture Notes in Computer Science, Vol. 9341: , Springer, (2015) , pp. 36–40. doi:10.1007/978-3-319-25639-9_7. |
[29] | B. Forchhammer, A. Jentzsch and F. Naumann, LODOP – multi-query optimization for linked data profiling queries, in: Proceedings of the 1st International Workshop on Dataset PROFIling & fEderated Search for Linked Data co-located with the 11th Extended Semantic Web Conference, PROFILES@ESWC 2014, Anissaras, Crete, Greece, May 26, 2014, E. Demidova, S. Dietze, J. Szymanski and J.G. Breslin, eds, CEUR Workshop Proceedings, Vol. 1151: , CEUR-WS.org, (2014) . |
[30] | L. Fuenmayor, D. Collarana, S. Lohmann and S.A. Farbie, A faceted reactive browsing interface for multi RDF knowledge graph exploration, in: Proceedings of the Third International Workshop on Visualization and Interaction for Ontologies and Linked Data co-located with the 16th International Semantic Web Conference (ISWC 2017), Vienna, Austria, October 22, 2017, V. Ivanova, P. Lambrix, S. Lohmann and C. Pesquita, eds, CEUR Workshop Proceedings, Vol. 1947: , CEUR-WS.org, (2017) , pp. 111–122. |
[31] | J. Gómez-Romero, M. Molina-Solana, A. Oehmichen and Y. Guo, Visualizing large knowledge graphs: A performance analysis, Future Gener. Comput. Syst. 89: ((2018) ), 224–238. doi:10.1016/j.future.2018.06.015. |
[32] | J. Gracia, E. Montiel-Ponsoda, P. Cimiano, A. Gómez-Pérez, P. Buitelaar and J.P. McCrae, Challenges for the multilingual web of data, J. Web Semant. 11: ((2012) ), 63–71. doi:10.1016/j.websem.2011.09.001. |
[33] | A. Hart, Mann-Whitney test is not just a test of medians: Differences in spread can be important, Bmj 323: (7309) ((2001) ), 391–393. doi:10.1136/bmj.323.7309.391. |
[34] | P. He, Towards profiling knowledge graphs, in: Proceedings of the 4th International Workshop on Dataset PROFIling and fEderated Search for Web Data (PROFILES 2017) co-located with The 16th International Semantic Web Conference (ISWC 2017), Vienna, Austria, October 22, 2017, E. Demidova, S. Dietze, J. Szymanski and J.G. Breslin, eds, CEUR Workshop Proceedings, Vol. 1927: , CEUR-WS.org, (2017) . |
[35] | P. Heim and J. Ziegler, Faceted visual exploration of semantic data, in: Human Aspects of Visualization – Second IFIP WG 13.7 Workshop on Human-Computer Interaction and Visualization, HCIV (INTERACT) 2009, Revised Selected Papers, Uppsala, Sweden, August 24, 2009, A. Ebert, A.J. Dix, N.D. Gershon and M. Pohl, eds, Lecture Notes in Computer Science, Vol. 6431: , Springer, (2009) , pp. 58–75. doi:10.1007/978-3-642-19641-6_5. |
[36] | A. Hogan, E. Blomqvist, M. Cochez, C. d’Amato, G. de Melo, C. Gutierrez, S. Kirrane, J.E. Labra Gayo, R. Navigli, S. Neumaier, A.-C. Ngonga Ngomo, A. Polleres, S.M. Rashid, A. Rula, L. Schmelzeisen, J.F. Sequeda, S. Staab and A. Zimmermann, Knowledge graphs, ACM Comput. Surv. 54: (4) ((2022) ), 71:1–71:37. doi:10.1145/3447772. |
[37] | A.K. Joshi, P. Hitzler and G. Dong, Logical linked data compression, in: The Semantic Web: Semantics and Big Data, 10th International Conference, ESWC 2013, Proceedings, Montpellier, France, May 26–30, 2013, P. Cimiano, Ó. Corcho, V. Presutti, L. Hollink and S. Rudolph, eds, Lecture Notes in Computer Science, Vol. 7882: , Springer, (2013) , pp. 170–184. doi:10.1007/978-3-642-38288-8_12. |
[38] | Md. Kamruzzaman Sarker, A. Krisnadhi, D. Carral and P. Hitzler, Rule-based OWL modeling with rowltab protégé plugin, in: Proceedings, Part I, The Semantic Web – 14th International Conference, ESWC 2017, Portorož, Slovenia, May 28–June 1, 2017, E. Blomqvist, D. Maynard, A. Gangemi, R. Hoekstra, P. Hitzler and O. Hartig, eds, Lecture Notes in Computer Science, Vol. 10249: , (2017) , pp. 419–433. doi:10.1007/978-3-319-58068-5_26. |
[39] | A. Katifori, C. Halatsis, G. Lepouras, C. Vassilakis and E.G. Giannopoulou, Ontology visualization methods – a survey, ACM Comput. Surv. 39: (4) ((2007) ), 10. doi:10.1145/1287620.1287621. |
[40] | S. Khatchadourian and M.P.C. Explod, Summary-based exploration of interlinking and RDF usage in the linked open data cloud, in: Proceedings, Part II, The Semantic Web: Research and Applications, 7th Extended Semantic Web Conference, ESWC 2010, Heraklion, Crete, Greece, May 30–June 3, 2010, L. Aroyo, G. Antoniou, E. Hyvönen, A. ten Teije, H. Stuckenschmidt, L. Cabral and T. Tudorache, eds, Lecture Notes in Computer Science, Vol. 6089: , Springer, (2010) , pp. 272–287. doi:10.1007/978-3-642-13489-0_19. |
[41] | M. Konrath, T. Gottron, S. Staab and A. Scherp, Schemex – efficient construction of a data catalogue by stream-based indexing of linked data, J. Web Semant. 16: ((2012) ), 52–58. doi:10.1016/j.websem.2012.06.002. |
[42] | D. Koutra, U. Kang, J. Vreeken and C. Faloutsos, Summarizing and understanding large graphs, Stat. Anal. Data Min. 8: (3) ((2015) ), 183–202. doi:10.1002/sam.11267. |
[43] | S. Kumar and V. Singh, Understanding data exploration search a brief study of user’s exploratory search facets, in: 2018 4th International Conference on Computing Communication and Automation (ICCCA), IEEE, (2018) , pp. 1–6. |
[44] | V. Kwatra, A. Schödl, I.A. Essa, G. Turk and A.F. Bobick, Graphcut textures: Image and video synthesis using graph cuts, ACM Trans. Graph. 22: (3) ((2003) ), 277–286. doi:10.1145/882262.882264. |
[45] | A. Langegger and W. Wöß, RDFStats – an extensible RDF statistics generator and library, in: Database and Expert Systems Applications, DEXA, International Workshops, Proceedings, Linz, Austria, August 31–September 4, 2009, A.M. Tjoa and R.R. Wagner, eds, IEEE Computer Society, (2009) , pp. 79–83. doi:10.1109/DEXA.2009.25. |
[46] | H. Li, Data profiling for semantic web data, in: Proceedings, Web Information Systems and Mining – International Conference, WISM 2012, Chengdu, China, October 26–28, 2012, F.L. Wang, J. Lei, Z. Gong and X. Luo, eds, Lecture Notes in Computer Science, Vol. 7529: , Springer, (2012) , pp. 472–479. doi:10.1007/978-3-642-33469-6_59. |
[47] | M. Lissandrini, D. Mottin, T. Palpanas and Y. Velegrakis, Graph-query suggestions for knowledge graph exploration, in: WWW’20: The Web Conference 2020, IW3C2, Taipei, Taiwan, April 20–24, 2020, Y. Huang, I. King, T.-Y. Liu and M. van Steen, eds, ACM, (2020) , pp. 2549–2555. doi:10.1145/3366423.3380005. |
[48] | M. Lissandrini, D. Mottin, T. Palpanas and Y. Velegrakis, Multi-example search in rich information graphs, in: 34th IEEE International Conference on Data Engineering, ICDE 2018, Paris, France, April 16–19, 2018, IEEE Computer Society, pp. 809–820. doi:10.1109/ICDE.2018.00078. |
[49] | V. López, C. Unger, P. Cimiano and E. Motta, Evaluating question answering over linked data, J. Web Semant. 21: ((2013) ), 3–13. doi:10.1016/j.websem.2013.05.006. |
[50] | A. Louati, M.-A. Aufaure and Y. Lechevallier, Graph aggregation: Application to social networks, in: Advances in Theory and Applications of High Dimensional and Symbolic Data Analysis, HDSDA 2011, Beijing, China, October 27–30, 2011, Y. Lechevallier, G. Saporta, R. Guan and H. Wang, eds, RNTI, Vols E-25: , Beihang University, (2011) , pp. 157–177, Hermann-Éditions. |
[51] | N. Marie and F. Gandon, Survey of linked data based exploration systems, in: Proceedings of the 3rd International Workshop on Intelligent Exploration of Semantic Data (IESD 2014) co-located with the 13th International Semantic Web Conference (ISWC 2014), Riva del Garda, Italy, October 20, 2014, D. Thakker, D. Schwabe, K. Kozaki, R. García, C. Dijkshoorn and R. Mizoguchi, eds, CEUR Workshop Proceedings, Vol. 1279: , CEUR-WS.org, (2014) . |
[52] | G.G. Méndez, U. Hinrichs and M.A. Nacenta, Bottom-up vs. top-down: Trade-offs in efficiency, understanding, freedom and creativity with infovis tools, in: Proceedings of the 2017 CHI Conference on Human Factors in Computing Systems, Denver, CO, USA, May 06–11, 2017, G. Mark, S.R. Fussell, C. Lampe, M.C. Schraefel, J.P. Hourcade, C. Appert and D. Wigdor, eds, ACM, (2017) , pp. 841–852. doi:10.1145/3025453.3025942. |
[53] | N. Mihindukulasooriya, M. Poveda-Villalón, R. García-Castro and A. Gómez-Pérez, Loupe – an online tool for inspecting datasets in the linked data cloud, in: Proceedings of the ISWC 2015 Posters & Demonstrations Track co-located with the 14th International Semantic Web Conference (ISWC-2015), Bethlehem, PA, USA, October 11, 2015, S. Villata, J.Z. Pan and M. Dragoni, eds, CEUR Workshop Proceedings, Vol. 1486: , CEUR-WS.org, (2015) . |
[54] | X. Niu, X. Fan and T. Zhang, Understanding faceted search from data science and human factor perspectives, ACM Trans. Inf. Syst. 37: (2) ((2019) ), 14:1–14:27. doi:10.1145/3284101. |
[55] | N.F. Noy, M. Sintek, S. Decker, M. Crubézy, R.W. Fergerson and M.A. Musen, Creating semantic web contents with protégé-2000, IEEE Intell. Syst. 16: (2) ((2001) ), 60–71. doi:10.1109/5254.920601. |
[56] | A. Perer and B. Shneiderman, Integrating statistics and visualization: Case studies of gaining clarity during exploratory data analysis, in: Proceedings of the 2008 Conference on Human Factors in Computing Systems, CHI 2008, Florence, Italy, April 5–10, 2008, M. Czerwinski, A.M. Lund and D.S. Tan, eds, ACM, (2008) , pp. 265–274. doi:10.1145/1357054.1357101. |
[57] | I.O. Popov, M.M.C. Schraefel, W. Hall and N. Shadbolt, Connecting the dots: A multi-pivot approach to data exploration, in: Proceedings, Part I, the Semantic Web – ISWC 2011 – 10th International Semantic Web Conference, Bonn, Germany, October 23–27, 2011, L. Aroyo, C. Welty, H. Alani, J. Taylor, A. Bernstein, L. Kagal, N.F. Noy and E. Blomqvist, eds, Lecture Notes in Computer Science, Vol. 7031: , Springer, (2011) , pp. 553–568. doi:10.1007/978-3-642-25073-6_35. |
[58] | A. Ragone, P. Tomeo, C. Magarelli, T. Di Noia, M. Palmonari, A. Maurino and E. Di Sciascio, Schema-summarization in linked-data-based feature selection for recommender systems, in: Proceedings of the Symposium on Applied Computing, SAC 2017, Marrakech, Morocco, April 3–7, 2017, A. Seffah, B. Penzenstadler, C. Alves and X. Peng, eds, ACM, (2017) , pp. 330–335. doi:10.1145/3019612.3019837. |
[59] | M. Riondato, D. García-Soriano and F. Bonchi, Graph summarization with quality guarantees, Data Min. Knowl. Discov. 31: (2) ((2017) ), 314–349. doi:10.1007/s10618-016-0468-8. |
[60] | J. Sauro and J.R. Lewis, Quantifying the User Experience: Practical Statistics for User Research, Morgan Kaufmann, (2016) . |
[61] | B. Shneiderman, The eyes have it: A task by data type taxonomy for information visualizations, in: Proceedings of the 1996 IEEE Symposium on Visual Languages, Boulder, Colorado, USA, September 3–6, 1996, IEEE Computer Society, (1996) , pp. 336–343. doi:10.1109/VL.1996.545307. |
[62] | B. Shneiderman and C. Plaisant, Strategies for evaluating information visualization tools: Multi-dimensional in-depth long-term case studies, in: Proceedings of the 2006 AVI Workshop on BEyond Time and Errors: Novel Evaluation Methods for Information Visualization, BELIV 2006, Venice, Italy, May 23, 2006, E. Bertini, C. Plaisant and G. Santucci, eds, Vol. 23: , ACM Press, (2006) , pp. 1–7. doi:10.1145/1168149.1168158. |
[63] | Q. Song, Y. Wu, P. Lin, X. Dong and H. Sun, Mining summaries for knowledge graph search, IEEE Trans. Knowl. Data Eng. 30: (10) ((2018) ), 1887–1900. doi:10.1109/TKDE.2018.2807442. |
[64] | B. Spahiu, A. Maurino and M. Palmonari, Towards improving the quality of knowledge graphs with data-driven ontology patterns and SHACL, in: Emerging Topics in Semantic Technologies – ISWC 2018 Satellite Events [Best Papers from 13 of the Workshops Co-Located with the ISWC 2018 Conference], E. Demidova, A. Zaveri and E. Simperl, eds, Studies on the Semantic Web, Vol. 36: , IOS Press, (2018) , pp. 103–117. doi:10.3233/978-1-61499-894-5-103. |
[65] | B. Spahiu, R. Porrini, M. Palmonari, A. Rula and A. Maurino, ABSTAT: Ontology-driven linked data summaries with pattern minimalization, in: The Semantic Web – ESWC 2016 Satellite Events, Revised Selected, Heraklion, Crete, Greece, May 29–June 2, 2016, H. Sack, G. Rizzo, N. Steinmetz, D. Mladenic, S. Auer and C. Lange, eds, Lecture Notes in Computer Science, Vol. 9989: , (2016) , pp. 381–395. doi:10.1007/978-3-319-47602-5_51. |
[66] | J. Zhao, C. Collins, F. Chevalier and R. Balakrishnan, Interactive exploration of implicit and explicit relations in faceted datasets, IEEE Trans. Vis. Comput. Graph. 19: (12) ((2013) ), 2080–2089. doi:10.1109/TVCG.2013.167. |


