
TheyBuyForYou platform and knowledge graph: Expanding horizons in public procurement with open linked data
Abstract
Public procurement is a large market affecting almost every organisation and individual; therefore, governments need to ensure its efficiency, transparency, and accountability, while creating healthy, competitive, and vibrant economies. In this context, open data initiatives and integration of data from multiple sources across national borders could transform the procurement market by such as lowering the barriers of entry for smaller suppliers and encouraging healthier competition, in particular by enabling cross-border bids. Increasingly more open data is published in the public sector; however, these are created and maintained in siloes and are not straightforward to reuse or maintain because of technical heterogeneity, lack of quality, insufficient metadata, or missing links to related domains. To this end, we developed an open linked data platform, called TheyBuyForYou, consisting of a set of modular APIs and ontologies to publish, curate, integrate, analyse, and visualise an EU-wide, cross-border, and cross-lingual procurement knowledge graph. We developed advanced tools and services on top of the knowledge graph for anomaly detection, cross-lingual document search, and data storytelling. This article describes the TheyBuyForYou platform and knowledge graph, reports their adoption by different stakeholders and challenges and experiences we went through while creating them, and demonstrates the usefulness of Semantic Web and Linked Data technologies for enhancing public procurement.
1.Introduction
The market around public procurement is large enough so as to affect almost every single citizen and organisation across a variety of sectors. For this reason, public spending has always been a matter of interest at local, regional, and national levels, and even more so, in times of great austerity and increased public scrutiny. Primarily, governments need to be efficient in delivering services, ensure transparency, prevent fraud and corruption, and build healthy and sustainable economies [4,20]. For example, in the European Union (EU), every year, over 250.000 public authorities spend around 2 trillion euros (about 14% of GDP) on the purchase of services, works, and supplies;11 while the Organisation for Economic Co-operation and Development (OECD) estimates that more than 82% of fraud and corruption cases remain undetected across all OECD countries [27] costing as high as 990 billion euros a year in the EU alone [40]. Moreover, small and medium-sized enterprises (SMEs) are often locked out of markets and restricted by borders due to the high cost of obtaining the required information, where larger companies can absorb the cost. This leads to a tendency for governments to rely on monolithic suppliers without adequate competition to deliver good value for the taxpayers.
The availability of good quality, open, and integrated procurement data, coming from multiple sources across national borders, could alleviate the aforementioned challenges [16]. This includes government agencies assessing purchasing options, companies exploring new business contracts and placing cross-border bids, and other parties (such as journalists, researchers, local communities, business associations, transparency activists, and individual citizens) looking for a better understanding of the intricacies of the public procurement landscape through decision-making and analytic tools. Free access to public sector information is now a human right, recognised by many developed and developing countries [2]. Projects such as the UK’s GCloud (Government Cloud)22 have already shown that small businesses can compete effectively with their larger counterparts, given the right environment. However, managing these competing priorities at a national level and coordinating them across different states and many disparate agencies is notoriously difficult. There are several directives put forward by the European Commission (e.g., Directive 2003/98/EC and Directive 2014/24/EU8) for improving public procurement practices. These led to the emergence of national public procurement portals living together with regional, local as well as EU-wide public portals [15]. Yet, due the lack of common agreement across the EU on the data formats for exposing such data sources and on the data models for representing such data, this resulted in a highly heterogeneous technical landscape. As a result, increasingly more open data is being published in the public sector; however, these are created and maintained in siloes and are not straightforward to reuse or maintain due to lack of quality, insufficient metadata, missing links to related domains, as well as the technical heterogeneity.
To this end, in order to deal with the aforementioned challenges, we built a platform, called TheyBuyForYou [36], consisting of a set of modular REST APIs and ontologies, to publish, curate, integrate, analyse, and visualise an EU-wide, cross-border, and cross-lingual procurement knowledge graph (KG) [31,32,36,37]. The KG includes procurement and company data gathered from multiple disparate sources across the EU and integrated through a common ontology network using an extract, transform, load (ETL) approach [6]. We developed and used a set of advanced end-user tools and services including machine learning (ML) algorithms on top of the resulting knowledge graph, so as to find anomalies in data, enable searching across documents in different languages, and create stories from the data. This article describes the TheyBuyForYou platform and knowledge graph, reports their adoption by different stakeholders and challenges and experiences we went through while creating them, and demonstrates the usefulness of Semantic Web and Linked Data technologies for enhancing public procurement.
The rest of the article is structured as follows. Section 2 motivates the overall work presented, while Section 3 presents the related work. Section 4 describes the platform including the data sets underlying the KG, an ontology network for representing the data, and the platform architecture. Section 5 presents the KG ingestion and publication processes, while Section 6 describes the advanced services and tools for anomaly detection, cross-lingual search, and storytelling with data. Section 7 reports on uptake and adoption of the KG, platform, and advanced services and tools. Section 8 presents an evaluation, while Section 9 provides a discussion on the lessons learned. Finally, Section 10 concludes the article.
2.Motivation
Public sector procurement platforms have largely been transferred from private sector tools that were deployed in the manufacturing sector. During this transfer, very little consideration has been given to aspects such as software integration and interoperability, transparency, or the specific needs of governments. As a result, many of the tools in use by governments are often not optimised for government use or are subject to restrictive contracts which unnecessarily complicate publishing open data. For example, for the management of UK’s and Germany’s procurement data, the business intelligence supplier Dun & Bradstreet includes proprietary identifiers (DUNS ID) for all government suppliers in their spend analysis tools – which means that the data cannot be reused without a subscription to Dun & Bradstreet.33
Tender advertising portals are also hampering the progress of transparency because the portals are claiming copyright over all data published in the portals, even though their public-sector clients are the authors and the data on tender opportunities are required to be published openly by law. The technical landscape for managing such contracts is very heterogeneous: for example, even in medium-sized cities, contracts are handled using different tools and formats across departments, including relational databases, Excel spreadsheets, and Lotus Notes. This makes it difficult to have a high-level overview of processes and decisions. Furthermore, proprietary data formats and restrictive contracts also create supplier tie-in, making it difficult for governments to take their custom to rival suppliers or to create their solutions. This raises costs, disenfranchises citizens and makes it harder to compare the value for money delivered by different suppliers.
These solutions have important limitations: relevant data is missing, of sub-par quality or hardly accessible, and the technology and tools used by decision makers to explore and engage with it are rudimentary in the level of detail and actionable insight they offer. In this respect, open data initiatives and a standard based approach for sharing and integrating procurement related data could transform the public procurement, notably in terms of:
(i) economic development by delivering better economic outcomes from public spending, in particular for SMEs (to get better access to public tenders, competing with more established players etc.);
(ii) demand management by spotting trends in spending and supplier management to achieve long-term goals such as cost savings and efficiency gains;
(iii) competitive markets by identifying areas for cost cuts through healthier competition;
(iv) and, procurement intelligence by producing advanced analytics to inform decision support, risk monitoring and supply market analysis for procurement managers.
To manage its spending, governments on both local and European level produce a constant stream of documents (e.g., tender notices and award notices) of overwhelming volume as part of each contracting process. A typical process is composed of several stages such as tender, award, and contract with associated relevant notices, which are commonly published in the official language of the respective country. To facilitate a global overview of spending activity, automatic means for integrating and analysing this data stream are necessary. In TheyBuyForYou, we use a knowledge graph based approach built on Semantic Web and Linked Data technologies and principles [19]. A knowledge graph is an interconnected knowledge organisation structure, i.e., it represents a collection of interlinked entities, used primarily for data integration, sharing, and analytics [17,43]. Semantic Web is a set of technologies and standards to give information available on the Web a well defined meaning through specifying ontologies (i.e., shared formal conceptualisations describing a domain of interest), vocabularies, and rules. In the core of Semantic Web is Linked Data referring to the large scale integration of interrelated data sets.44
TheyBuyForYou platform specifically contributes the transformation in public procurement through:
(i) a combination of open procurement APIs, and online services and tools, to be used by different stakeholders for various data management processes;
(ii) making existing data more useful by adding more structure to it, linking it to various sources and vocabularies, resolving heterogeneity, and turning it into a knowledge graph that could be systematically analysed;
(iii) cross-lingual search and anomaly detection techniques to search and discover patterns and anomalies across multiple data sets and languages;
(iv) data storytelling techniques for generating informative summaries of the analysis results to aid decision making.
3.Related work
We focus on procurement data, related to tenders, awards, and contracts, and basic company data. In the followings, we analyse relevant related work from the perspective of such types of data. Procurement and company data are fundamental to realising many key business scenarios and may be extended with additional data sources.
Public procurement notices play two important roles for the public procurement process: as a resource for improving competitive tendering, and as an instrument for transparency and accountability [23]. With the progress of eGovernment initiatives, the publication of information on contracting procedures is increasingly being done using electronic means. In return, a growing amount of open procurement data is being released leading to various standardisation initiatives like OpenPEPPOL,55 CENBII,66 TED eSenders,77 CODICE,88 and Open Contracting Data Standard (OCDS).99 Data formats and file templates were defined within these standards to structure the messages being exchanged by the various agents involved in the procurement process. These standards primarily focus on the type of information that is transmitted between the various organisations involved in the process, aiming to achieve certain interoperability in the structure and semantics of data. The structure of the information is commonly provided by the content of the documents that are exchanged. However, these initiatives still generate a lot of heterogeneity. In order to alleviate these problems, several ontologies including PPROC [24], LOTED2 [14], MOLDEAS [28], or PCO [25], as well as the upcoming eProcurement ontology1010 emerged, with different levels of detail and focus (e.g., legal and process-oriented). So far, however, none of them has reached a wide adoption mainly due to their limited practical value.
Corporate information, including basic company information, financial as well as contextual data, are highly relevant in the procurement context, not only for enabling many data value chains, but also for transparency and accountability. Recently, a number of initiatives have been established to harmonise and increase the interoperability of corporate and financial data. These include public initiatives such as the Global Legal Entity Identification System—GLEIS,1111 Bloomberg’s open FIGI system for securities,1212 as well as long-established proprietary initiatives such as the Dun & Bradstreet DUNS number.1313 Other notable initiatives include the European Business Register (EBR),1414 Business Register Exchange (BREX),1515 and the eXtensible Business Reporting Language (XBRL) format.1616 However, these are mostly fragmented across borders, limited in scope and size, and siloed within specific business communities. There are also a number of ontologies developed for capturing company and company-related data including the W3C Organisation ontology (ORG),1717 some e-Government Core Vocabularies,1818 and the Financial Industry Business Ontology (FIBO) [7]. They have varying focuses (e.g., organisational and financial), do not cover sufficiently the basic company information, or are too complex due to many ontological commitments [30].
To date, no platform or KG exists (in whatever form), linking and provisioning cross-border and cross-language procurement and company data and allowing advanced decision making, analytics, and visualisation.
4.TheyBuyForYou platform
The TheyBuyForYou platform is mainly composed of components for ingesting, integrating, curating, and publishing procurement and supplier (i.e., company) data. The relevant data sets are reconciled and mapped into RDF with respect to an ontology network in order to create a knowledge graph [34]. In the followings, we describe the main ingredients of the platform.
4.1.Data providers
The content of our KG is based on the procurement and company data that is provided by two main data providers extracting and aggregating data from multiple sources. The first one is OpenOpps,1919 which is sourcing procurement data primarily from the Tenders Electronic Daily (TED)2020 data feed and from the procurement transparency initiatives of individual countries. TED is dedicated to European public procurement and publishes 520 thousand procurement notices a year. The second provider is OpenCorporates,2121 which is collecting company data from national company registers and other regulatory sources. OpenOpps is the largest data source of European tenders and contracts, while OpenCorporates is the largest open database of companies in the world. Both OpenOpps and OpenCorporates gather relevant data using a range of tools, including processing API calls and Web scraping and data extraction.
Regarding the procurement data, in the context of this work, OpenOpps provides gathered, extracted, pre-processed, and normalised data from hundreds of data sources completely openly through an API that can be used for research purposes. OpenOpps currently handles 685 data sources, with 569 of these being from Europe. This totals over 3 million documents dating back to 2010. All of the data for OpenOpps is gathered using a series of over 400 different scripts configured to collect data from each source. Each script is triggered daily and runs to gather all of the documents published in the last twenty-four hours. Each script is deployed on a monitored platform, giving the ability to check which scripts have failed, or which sources have published fewer than expected. Data is collected in the raw form and then mapped to the OCDS format after being cleansed. Where necessary, the data is processed, e.g., splitting single records into several fields, to comply with the data standard. Regarding the company data, OpenCorporates provides more than 140 million company records from a large number of jurisdictions.2222 OpenCorporates pre-processes and normalises data collected, maps collected data to its own data model, and makes data available through an API.
The data collected from OpenOpps and OpenCorporates is openly available under the Open Database License (ODbl).2323 It is available on GitHub2424 in JSON format and is updated on a monthly basis. The data is also made available through Zenodo2525 with a digital object identifier (DOI) [39]. As of May 2021, the size of released data amounts to 4.4 GBs and dates back to January 2019.
4.2.Ontology network
We developed two ontologies, one for representing procurement data and one for company data, using common techniques recommended by well-established ontology development methods [12,26]. A bottom-up approach was used, including identifying the scope and user group of the ontology, requirements, and ontological and non-ontological resources. We address suppliers, buyers, data journalists, data analysts, control authorities and regular citizens to explore and understand how public procurement decisions affect economic development, efficiencies, competitiveness, and supply chains. This includes providing better access to public tenders; spotting trends in spending and supplier management; identifying areas for cost cuts; and producing advanced analytics.
Regarding the procurement data, we developed an ontology based on OCDS [35] – a relevant data model getting important traction worldwide, used for representing our underlying procurement data. The OCDS’ data model is organised around the concept of a contracting process, which gathers all the relevant information associated with a single initiation process in a structured form. Phases of this process include mainly planning, tender, award, contract, and implementation. An OCDS document may be one of two kinds: a release or a record. A release is basically associated to an event in the lifetime of a contracting process and presents related information, while a record compiles all the known information about a contracting process. A contracting process may have many releases associated but only one record. We went through the reference specification of OCDS release and interpreted each of the sections and extensions (i.e., structured and unstructured). In total, there are currently 25 classes, 69 object properties, and 81 datatype properties created from the four main OCDS sections and 11 extensions (see Fig. 1 for a fragment of the ontology). The core classes are:
– ContractingProcess,
– Plan,
– Tender,
– Award, and
– Contract.
Fig. 1.
A fragment of the OCDS ontology for representing procurement data centred around the concept of contracting process.
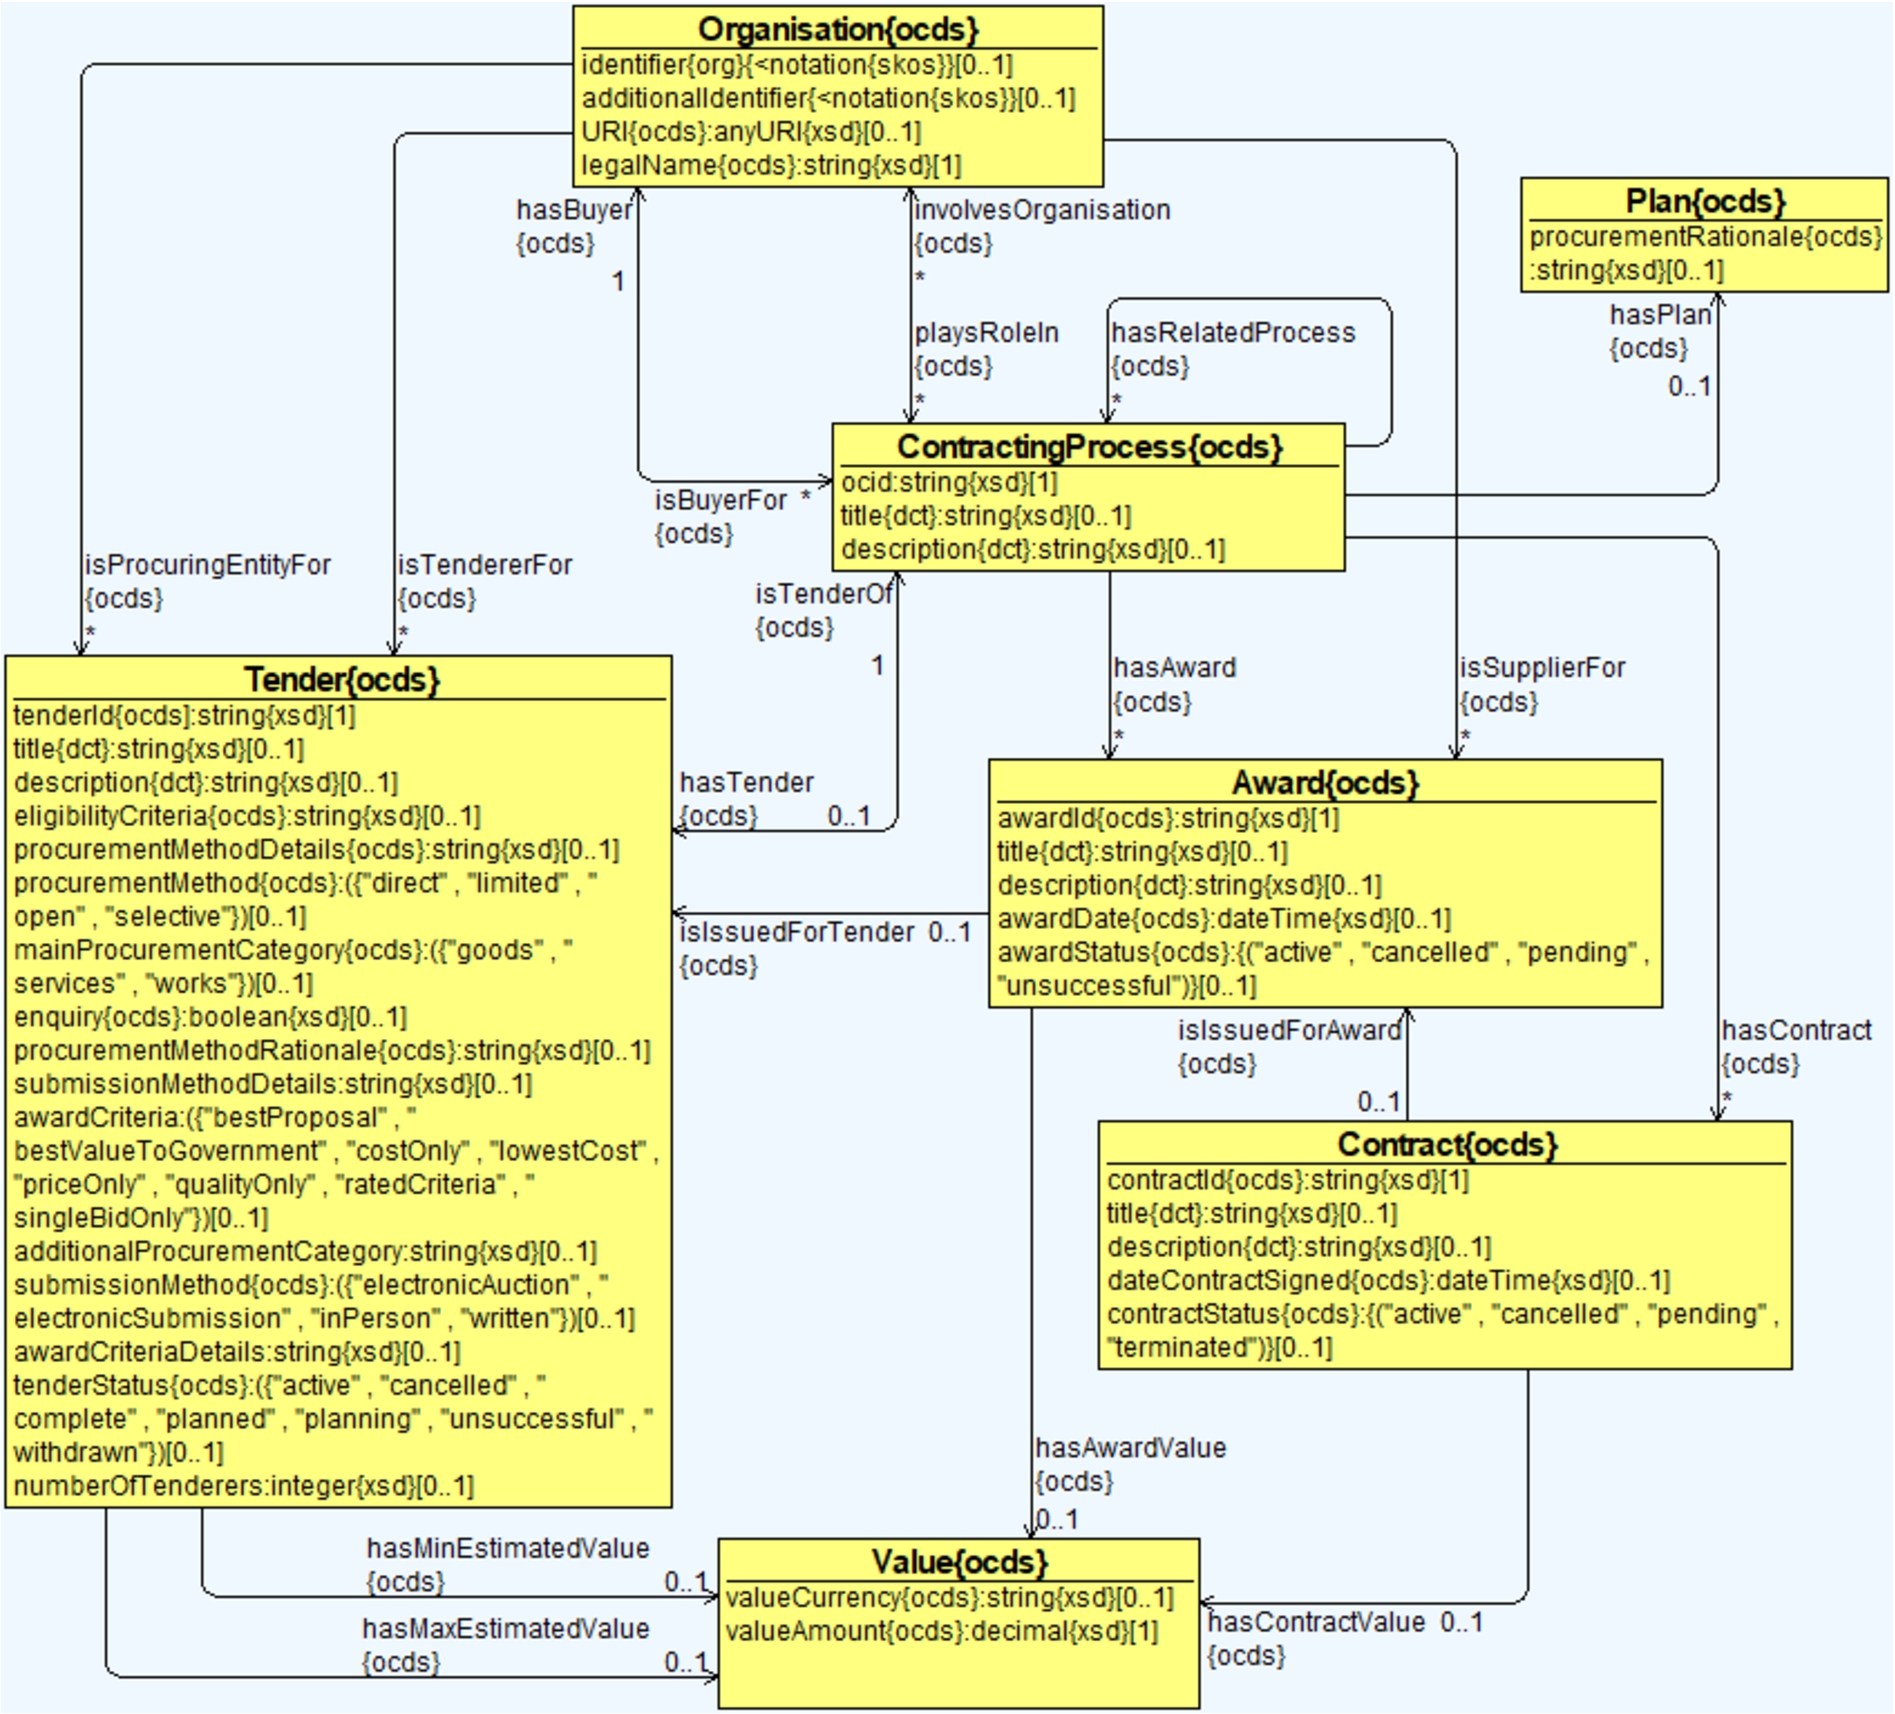
A contracting process may have one planning and one tender stage. Each tender may have multiple awards issued, while there may be only one contract issued for each award. Other ontology classes include Item, Lot, Bid, Organisation, and Transaction. We reused terms from external vocabularies and ontologies where appropriate by considering their level of standardisation, adoption, and match with the modelling requirements of the target domain and our scope. These include Dublin Core,2626 FOAF,2727 Schema.org,2828 SKOS,2929 and the W3C Organisation ontology.3030 The OCDS ontology is available on GitHub in two versions:3131 one with the core OCDS terms and another with the extensions.
Regarding the company data, one of the main resources used during the ontology development was data models provided by four company data providers: OpenCorporates, SpazioDati,3232 Brønnøysund Register Centre,3333 and Ontotext.3434 The data supplied by these data providers originally came from both official sources and unofficial sources. The need for harmonising and integrating data sets was a guiding factor for the ontology development process, since data sets have different sets of attributes and different representations with similar semantics. The resulting ontology, called euBusinessGraph ontology [29,30], is composed of 20 classes, 33 object properties, and 57 data properties allowing us to represent basic company-related data. The ontology covers registered organisations (i.e., companies that are registered as legal entities), identifier systems (i.e., a company can have several identifiers), officers (i.e., associated officers and their roles), and data sets (i.e., capturing information about data sets that are offered by company data providers). Registered organisations are the main entities for which information is captured in the ontology (see Fig. 2 for a fragment of the ontology). The main classes include:
– RegisteredOrganisation,
– Identifier,
– IdentifierSystem,
– Person,
– and Dataset.
Fig. 2.
A fragment of the euBusinessGraph ontology for representing company data, such as basic company information, identifiers, and people.
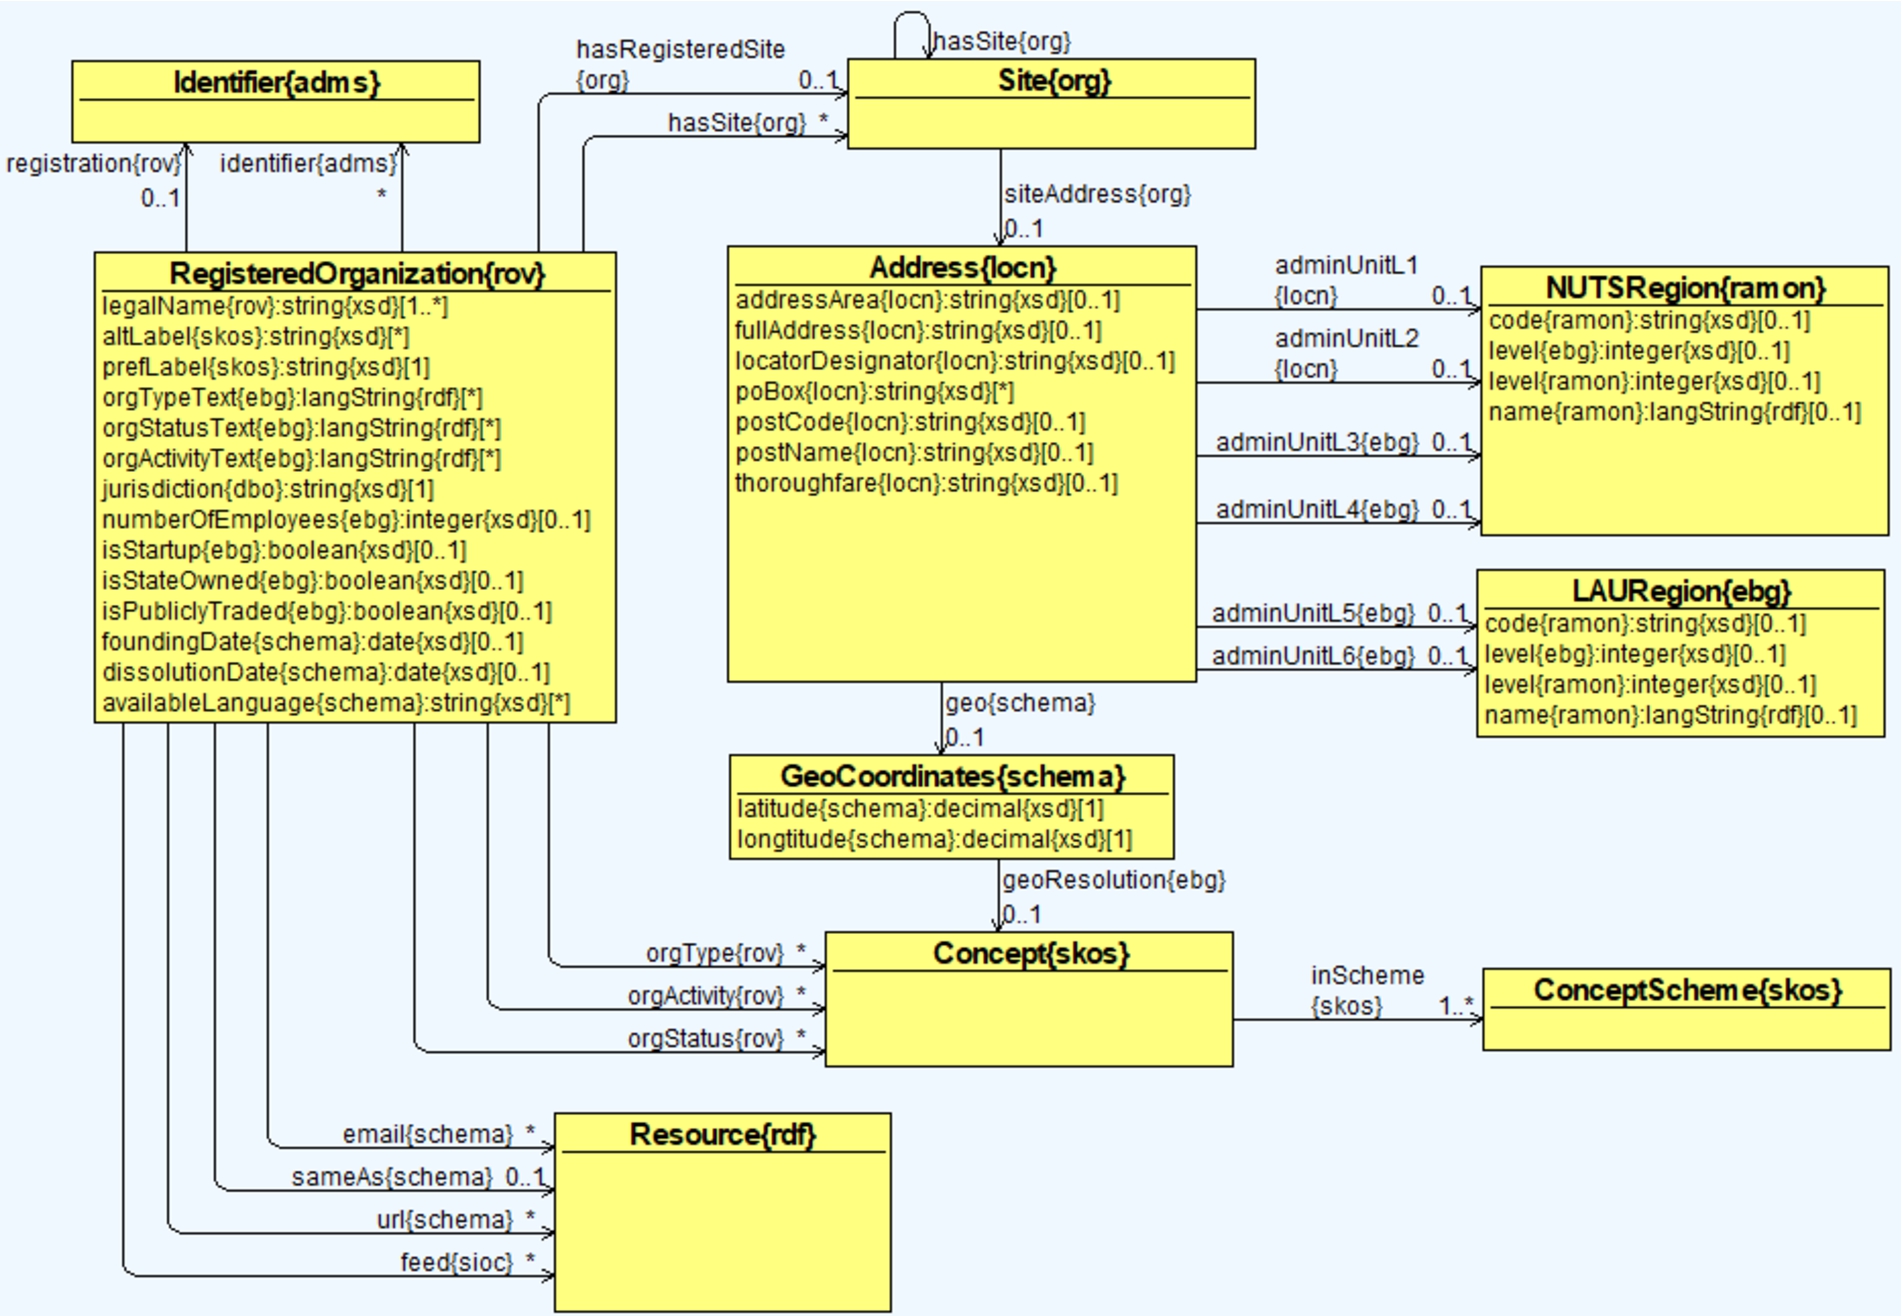
Three types of classifications are defined in the ontology for representing the company type, company status, and company activity. These are modelled as SKOS concept schemes. Some of the other external vocabularies and ontologies used are W3C Organisation ontology, W3C Registered Organisation Vocabulary (RegOrg),3535 SKOS, Schema.org, and Asset Description Metadata Schema (ADMS).3636 The ontology, data sets and some examples are released as open source on GitHub.3737
4.3.Platform architecture
TheyBuyForYou platform follows the state-of-the-art principles in software development, considering a low decoupling amongst all the software components. Figure 3 provides a high-level overview of the architecture.
Fig. 3.
The high-level architecture for the TheyBuyForYou platform.
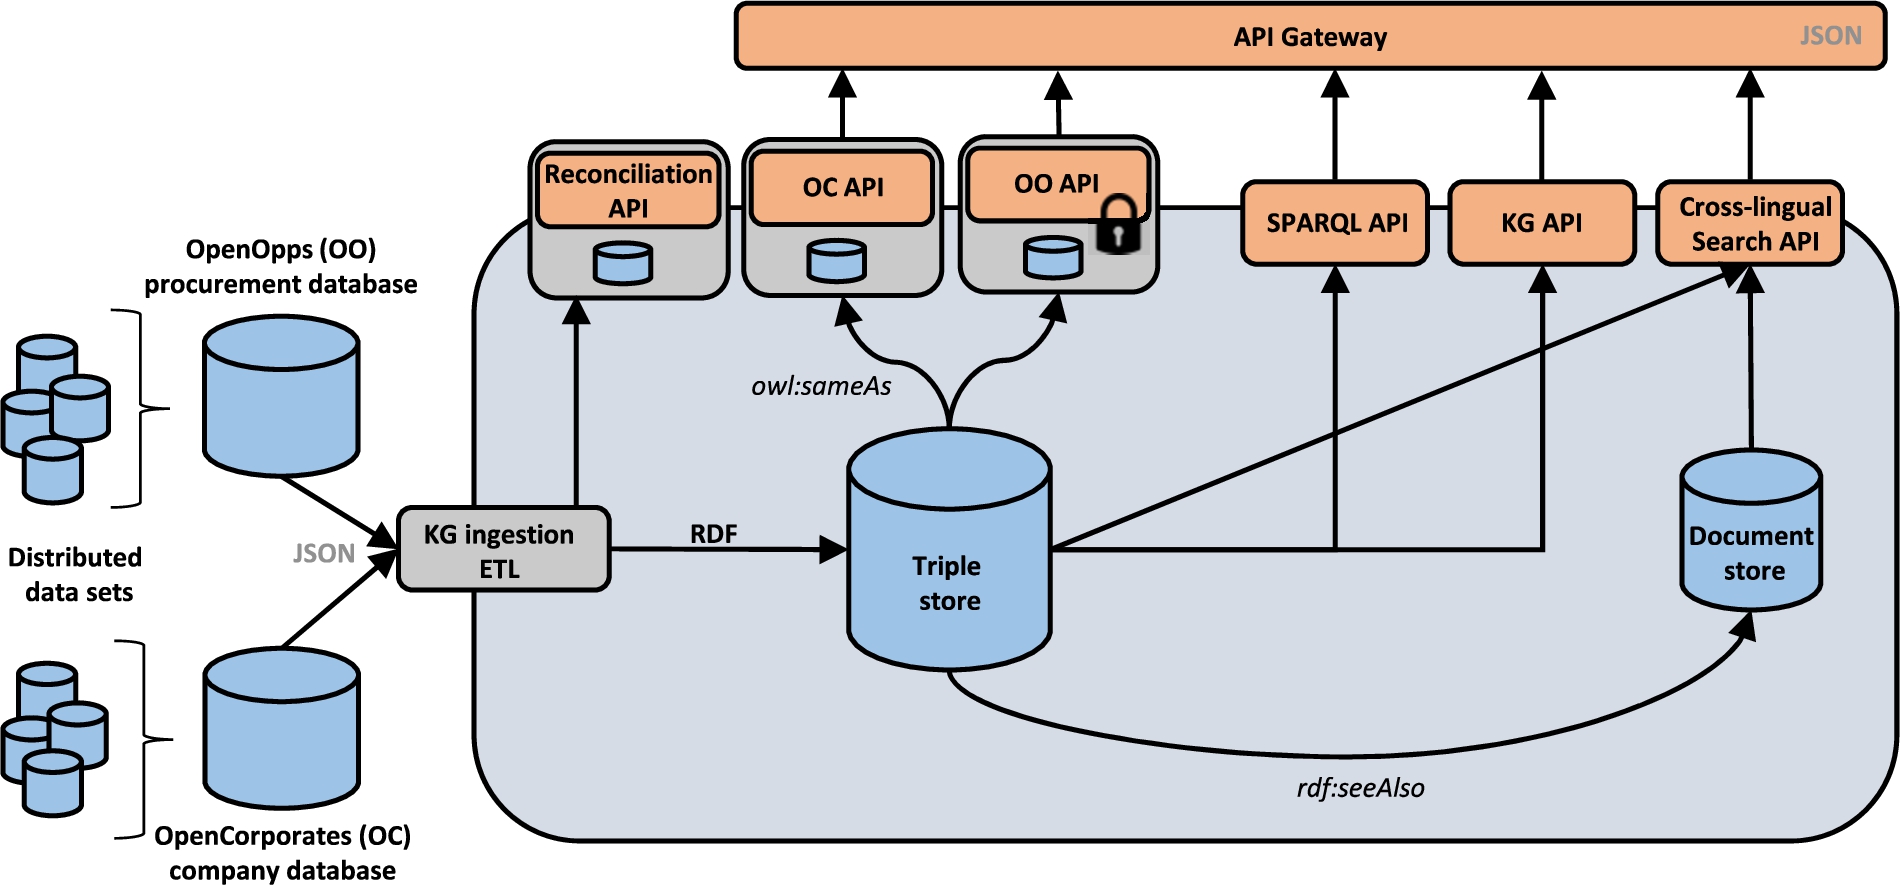
On the left-hand side, we include the ETL processes that are being used to incorporate the data sources into the KG. On the right-hand side, we provide an overview of the main data storage mechanisms, including a triple store for the generated RDF-based data and a document store for the documents associated to public procurement (tender notices, award notices, etc.), whose URLs are accessible via specific properties of the KG (using rdfs:seeAlso). OpenOpps and OpenCorporates provides APIs for accessing procurement and company data from their databases; these are OO API and OC API respectively. For those specific cases where a URI is also available in the original data sources (from OpenOpps and OpenCorporates), such URI is provided in the KG using a statement with owl:sameAs. This would allow our data providers to provide additional information about tenders or companies with a different license or access rights (e.g., commercial use). OpenCorporates also provides an API for reconciliation (i.e., Reconciliation API) matching a given company information (e.g., name and address; mostly imperfect and not universally identified) to a legal corporate entity in OpenCorporates’ database.
The KG is accessible via a core REST API. Our API catalogue is mostly focused on providing access mechanisms to those who want to make use of the knowledge graph, particularly software developers. Therefore, they are mostly focused on providing access to the KG through the HTTP GET verb and the API catalogue is organised around the main entities that are relevant for public procurement, such as contracting processes, awards, and contracts. Since the KG is stored as RDF in a triple store, there is also a SPARQL endpoint for executing ad-hoc queries. Finally, there is also a cross-lingual search API for searching across documents in various languages and an API Gateway providing a single-entry point to the APIs provided by the platform.
5.KG provisioning
The KG provisioning encompasses processes for reconciling and linking the two aforementioned and originally disconnected data sets, mapping and translating them into Linked Data with respect to an ontology network, and publishing the resulting knowledge graph through several APIs and endpoints. We describe the ingestion and publication processes in what follows.
5.1.Data ingestion
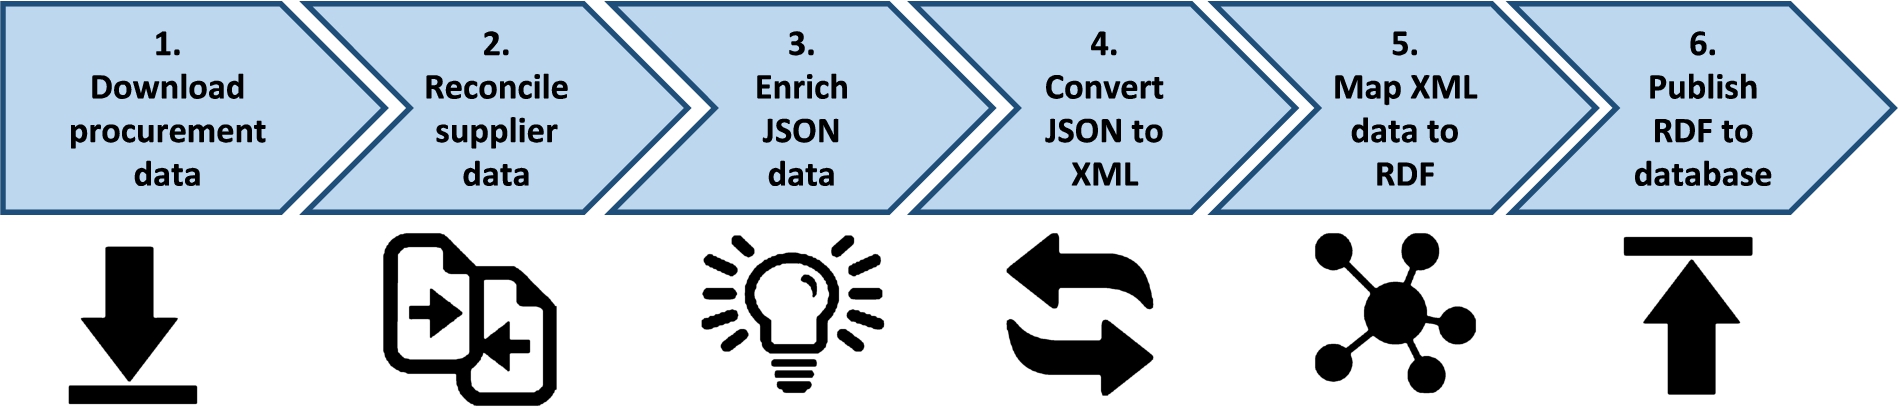
The ingestion process extracts procurement and company data from the data providers, matches suppliers appearing in procurement data provided by OpenOpps against legal corporate entities (i.e., reconciliation) provided by OpenCorporates, and translates the data sets into RDF using RML.3838 The daily ingestion is an automated process with usual maintenance and monitoring activities. The ingestion pipeline is implemented by a data engineer and is composed of the following steps (see Fig. 4):
(1) Download procurement data: Downloads procurement data from the OpenOpps OCDS API3939 as JSON data files.
(2) Reconcile suppliers: Matches supplier records found in procurement data (i.e., awards) using the OpenCorporates Reconciliation API.4040 The matching company data is downloaded using the OpenCorporates Company API4141 as JSON files.
(3) Enrich downloaded JSON data: Enriches the JSON data files downloaded in steps 1 and 2, e.g., adding new properties to support the mapping to RDF (e.g., fixing missing identifiers).
(4) Convert JSON to XML: Converts the JSON data files from step 3 into corresponding XML data files. Due to limitations in JSONPath, i.e., lack of operations for accessing parent or sibling nodes from a given node, we prefer to use XPath as the query language in RML.
(5) Map XML data to RDF: Runs RML Mapper on the enriched XML data files from step 4 and produces N-Triples files.
(6) Store and publish RDF: Stores the RDF (N-Triples) files from step 5 to Apache Jena Fuseki and Apache Jena TBD.
Fig. 4.
The daily data ingestion process for the KG.
Python was used as the primary scripting language, RMLMapper was used as the mapping tool to generate RDF, and finally Apache Jena Fuseki & TDB was chosen as the SPARQL engine and triple store. The Python scripts operate on files (output and input) and services were dockerised using Docker and made available on Docker Hub4242 to ease deployment. All development work and results towards the creation of the knowledge graph are published and maintained as open source software on GitHub.4343 The data dumps of the KG are available on Zenodo [39] and as of May 2021 includes:
– 189 million statements (triples),
– 1.92 million tenders,
– 2.51 million awards, and
– 133 thousand companies (reconciled suppliers).
The data in the knowledge graph is updated on a daily basis, while a new data dump is uploaded to Zenodo on a monthly basis.
5.2.KG publication
The KG is published through a SPARQL endpoint, a REST-based knowledge graph API (i.e., KG API), a cross-lingual search API, and an API gateway as a single access point for all. The SPARQL4444,4545 endpoint and API gateway4646 are accessible online. In this section, we focus on the knowledge graph API, while cross-lingual search API is covered in Section 6 as part of advanced services and tools.
Table 1
The knowledge graph API developed around the main resources
| /contractingProcess | Gets a list of contracting processes |
| /contractingProcess/{id} | Finds a contracting process by ID |
| /contractingProcess/{id}/award | Awards of a contracting process to return |
| /contractingProcess/{id}/buyer | Buyers of a contractingProcess to return |
| /contractingProcess/{id}/contract | Contracts of a contracting process to return |
| /contractingProcess/{id}/tender | Tender of a contracting process to return |
| /award | Gets a list of awards |
| /award/{id} | Finds an award by ID |
| /award/{id}/amendment | Amendments of an award to return |
| /award/{id}/document | Documents of an award to return |
| /award/{id}/item | Items of an award to return |
| /award/{id}/supplier | Suppliers of an award to return |
| /contract | Gets a list of contracts |
| /contract/{id} | Finds a contract by ID |
| /contract/{id}/amendment | Amendments of a contract to return |
| /contract/{id}/buyer | Buyers of a contract to return |
| /contract/{id}/document | Documents of a contract to return |
| /contract/{id}/item | Items of a contract to return |
| /tender | Gets a list of tenders |
| /tender/{id} | Finds a tender by ID |
| /tender/{id}/contractingProcess | Contracting processes of a tender to return |
| /tender/{id}/document | Documents of a tender to return |
| /tender/{id}/item | Items of a tender to return |
| /organisation | Gets a list of organisations |
| /organisation/{id} | Finds an organisation by ID |
| /organisation/{id}/award | Awards of an organisation to return |
| /organisation/{id}/contractingProcess | Contracting processes of an organisation to return |
The knowledge graph API4747 (see GitHub4848) was built using the R4R tool.4949 This tool uses Velocity templates5050 to allow specifying how the REST API will look like and is configured by means of SPARQL queries, similarly to what has been proposed in other state of the art tools like BASIL (Building Apis SImpLy) [13] or GRLC [22]. Beyond exposing URIs for the resources available in the KG (see Table 1), it also allows including authentication and authorisation, pagination, establishing sorting criteria over specific properties, nesting resources, and other typical functionalities normally available in REST APIs. The current implementation only returns JSON objects for the API calls and will be extended in the future to provide additional content negotiation capabilities and formats (JSON-LD, Turtle, HTML), which are common in Linked Data enabled APIs.
There is an online documentation,5151 which is continuously updated. It provides the details of the resources provided by our REST API in relation to the OCDS ontology. The core resources derived from the OCDS ontology are: (i) ContractingProcess, (ii) Award, (iii) Contract, (iv) Tender, and (v) Organisation. For all these resources, there is a possibility of paginating (e.g., GET /award?size=5&offset=1), sorting (e.g., GET /contract?sort=-startDate), and filtering (e.g., by the title of the award: GET /award?status=active).
6.Advanced services and tools
We implemented a number of advanced services and tools on top of the platform and KG: namely anomaly detection, cross-lingual document search, and storytelling tools.
6.1.Anomaly detection
Public procurement is particularly susceptible to corruption, which can impede economic development, create inefficiencies, and reduce competitiveness. At the same time, manually analysing a large volume of procurement cases for detecting possible frauds is not feasible. In this respect, using ML techniques for identifying patterns and anomalies, such as fraudulent behaviour or monopolies, in procurement processes and networks across data sets produced independently, is highly relevant [9]. For example, by building a network of entities (individuals, companies, governmental institutions, etc.) connected through public procurement events, one can discover exceptional cases as well as large and systematic patterns standing out from the norm, whether they represent examples of good procurement practice or possible cases of corruption. We applied several ML approaches towards the analysis of public procurement data: unsupervised, supervised, and statistical analysis [8,18].
Unsupervised learning is employed to look for previously undetected patterns in a data set with no pre-existing labels and with a minimum or no of human supervision. Our approach is to group the data into a set of clusters with k-Means method to identify commonalities in the data, and finally detect anomalous data points that do not fit into previous identified clusters. In the first step, every tender is transformed into a feature vector. The conversion retains numerical values, while categorical values are converted into numerical values. Then, in order to increase the ability of feature comparison, feature vectors are normalised. In order to determine optimal number of clusters, k-Means is run 20 times with an incremented number of clusters at every run. For each iteration, a point with value x, the number of clusters, and value y, the gain, are stored. The points are converted into a logarithmic scale, where the first and the last 5 points are taken for two separate linear regressions. The intersection of the two linear curves determines the optimal number of clusters. Once the optimal number of clusters is defined, a k-Means is run on the data set. Vectors deviating most from their centroids (i.e., Cartesian distance) are identified and ordered by the deviation value.
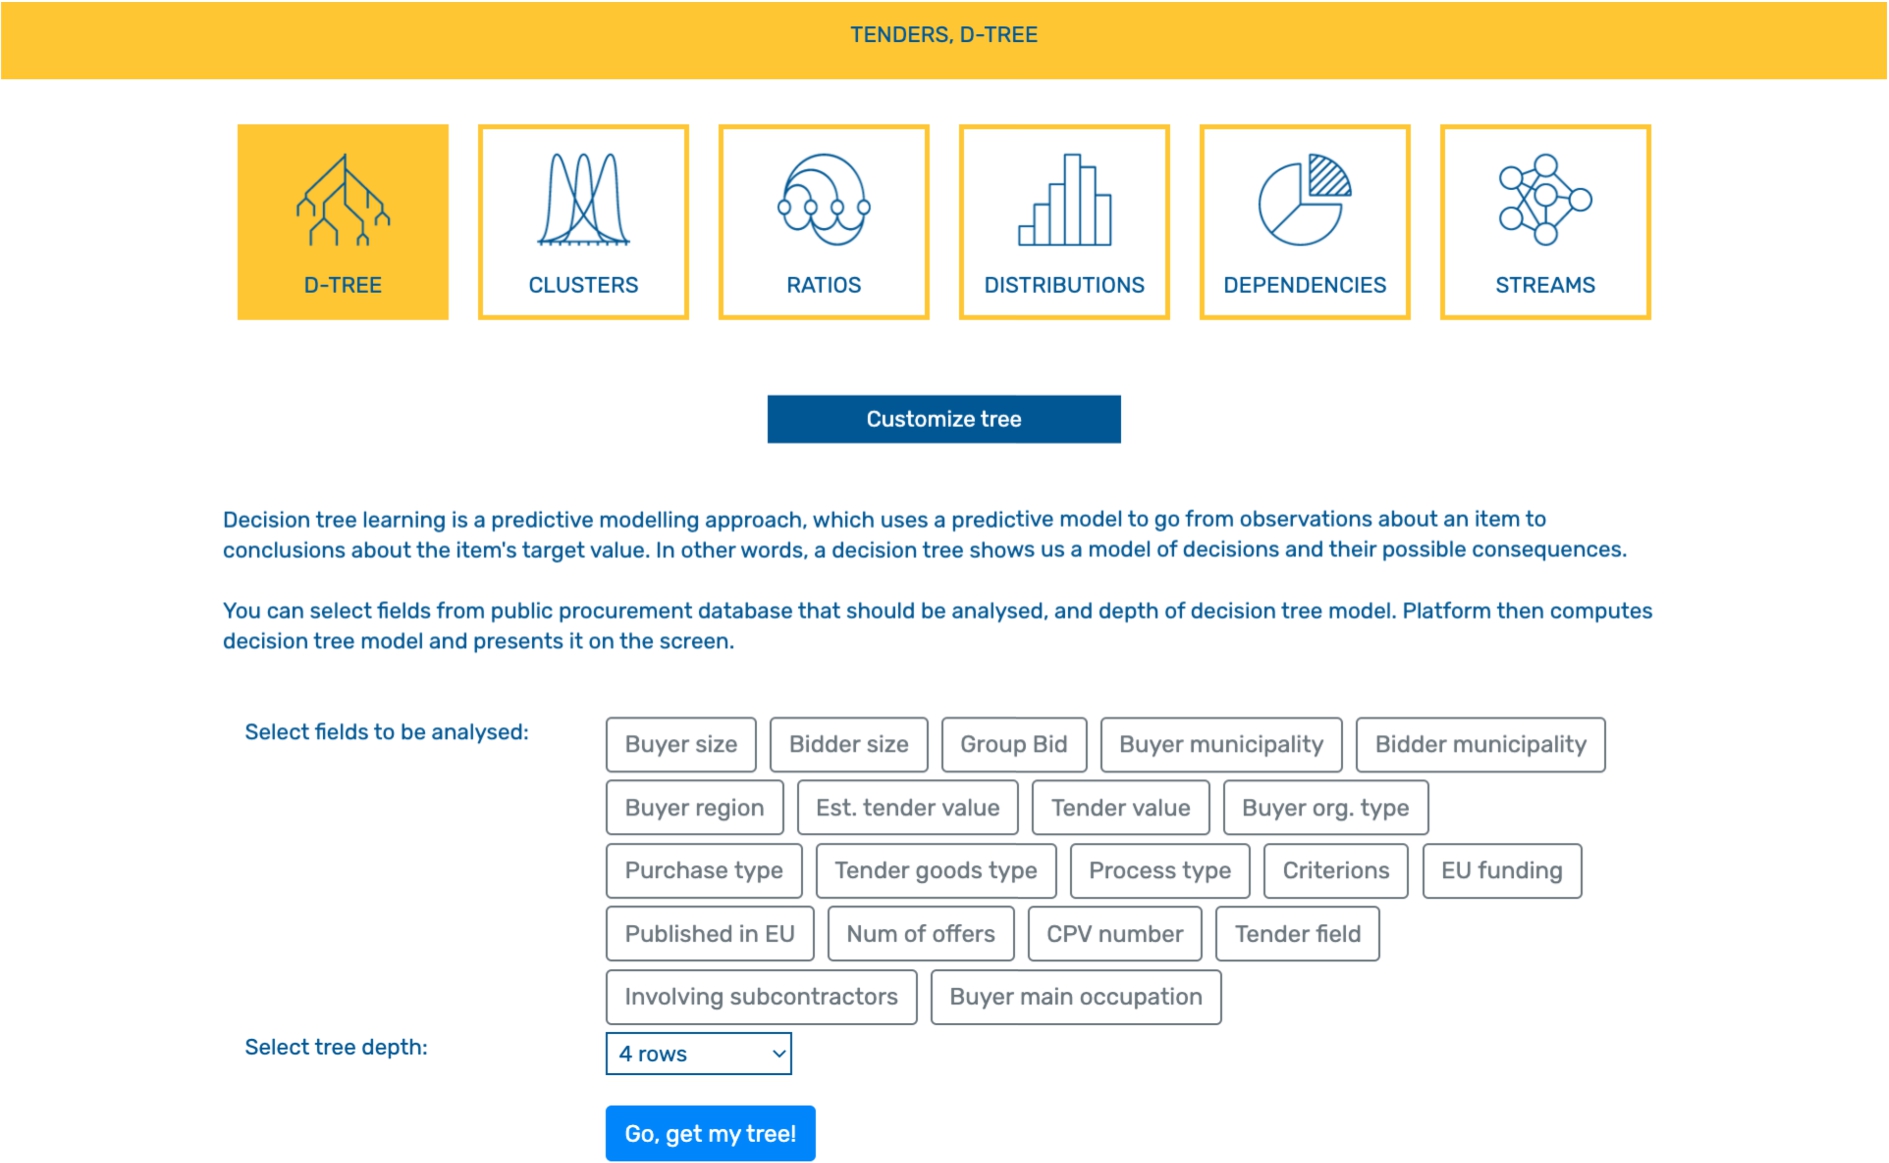
Supervised analysis approach implemented in our platform is based on a decision tree and is used to get additional insights into the public procurement decision-making process. Decision trees belong to class of non-parametric supervised learning algorithms and are used for classification and regression. Decision trees are employed for visual and explicit decision presentation and decision making with a tree-like model. The decision tree algorithm starts by finding the parameter yielding the highest amount of information and based on that it splits data into subgroups. It then iteratively continues the computation on smaller subgroups, until the data within a subgroup have all the same label. In order to retain a clearer overview, we use a binary decision tree, namely Classification and Regression Trees (CART). For the split criterion we use gini index as it usually performs better for large partitions than entropy. We allow users to select parameters by their own choice (for instance buyer size, bidder municipality, purchase type, number of offers, and the depth of decision tree model). This way, users can compare the importance of various parameter subsets contributing to the success of public tenders.
Finally, statistical approach is used to deal with various ratios between pre-selected parameters. Currently, the ratio between the tender value and the estimated number of employees for a bidder is examined. Bidders are then sorted by their ratio value and every bidder is turned into a point: the x value is a consecutive number and the y value is the ration. We developed a visual presentation of interdependence of tender value and the number of employees. As expected, the resulting graph shows deviating behaviour at the beginning of the list, that is big companies that won small tenders, as well as at the end of the list, that is companies with small number of employees that won big tenders. The y axis is then turned into a logarithmic scale and linear regression is performed. The first and the last 10% points are excluded from linear regression. The linear curve is a measure for a normal behaviour and anomaly is defined as any point that deviates from the linear curve by more than 20%.
We implemented and a deployed a system, see Fig. 5 for an example screen, capable of processing tens of millions of records, based on the techniques mentioned and made it available online.5252 The system allows successfully detecting a large class of anomalies in automatic mode or in exploratory mode (with human-machine interaction).
Fig. 5.
The system developed for anomaly detection: the configuration screen for the decision tree.
6.2.Cross-lingual search
Procurement processes are not only creating structured data, but also constantly creating additional documents (tender specifications, contract clauses, etc.). These are commonly published in the official language of the corresponding public administrations. Only some of these, for instance those published in TED, are multilingual, but the documents in the local language are typically longer and much more detailed than their translations into other languages. A civil servant working at a public administration on a contracting process may be interested in understanding how other public administrations in the same country or in different countries (and with different languages) have worked on similar contexts. Examples may include finding organisations related to a particular procurement process, or search for tenders related to given procurement text.
Fig. 6.
(a) Documents are represented in a unique space that relies on the latent layer of cross-lingual topics obtained by LDA and hash functions through hierarchies of synsets. (b) Theme-aligned topics described by top 5 words based on EUROVOC annotations.
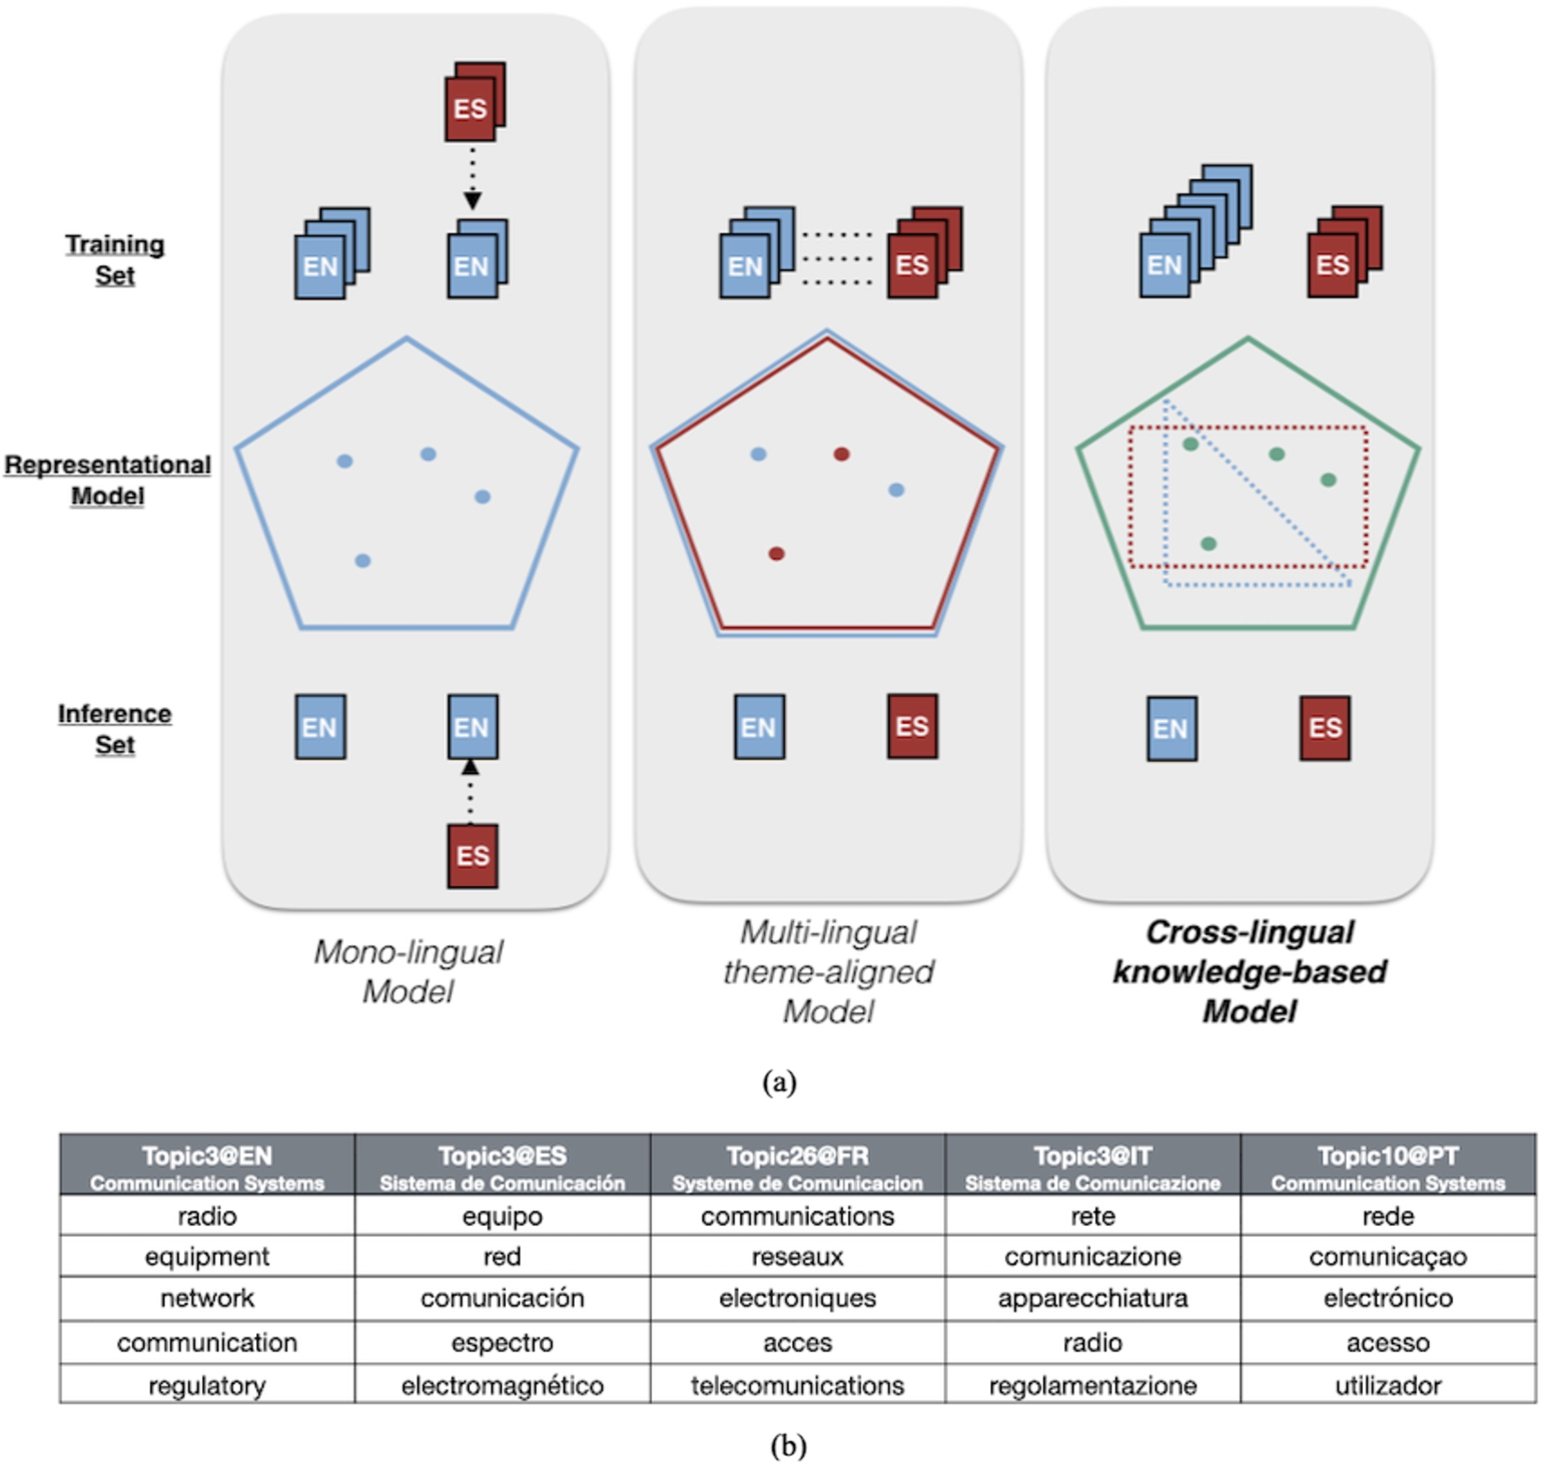
We worked on an added-value service5353 in order to provide support to these types of users, with the possibility of finding documents that are similar to a given one independently of the language in which it is made available. We also generated a Jupyter notebook with some representative examples, so as to facilitate its use.5454 This service is based on the use of cross-lingual labels created from sets of cognitive synonyms (synsets) and unsupervised probabilistic topic models [5]. The original low-dimensional latent space created by probabilistic topic models is extended with two new languages. In addition to the original English, French and Spanish models, we created Portuguese and Italian models to increase the common space shared by all languages. Topics are described by cross-lingual labels created from the list of concepts retrieved from the Open Multilingual WordNet. Each word is queried to retrieve its synsets. The final set of synsets for a topic is the union of the synsets from the individual top-words of a topic (top5 based on empirical evidence). Documents are then represented as data points and transformed from the original feature space based on mono-lingual topic distributions into a cross-lingual hierarchical-based space, so that similar data points share relevant cross-lingual concepts (see Fig. 6). Since topic models create latent themes from word co-occurrence statistics in a corpus, a cross-lingual topic specifies the knowledge about the word-word relations it contains for each language.
The JRC-Acquis data set5555 was used to build the model relating the documents. It is a collection of legislative texts written in 23 languages that were manually classified into subject domains according to the EUROVOC5656 thesaurus. The English, Spanish, French, Italian and Portuguese editions of the corpora were used for each language-specific model. The EUROVOC taxonomy was pre-processed to satisfy the topic independence assumption of probabilistic topic models, by using hierarchical relations. The initial 7.193 concepts from 21 domain areas such as politics, law or economics were reduced to 452 categories, that are independent and can be used to train the topic models. Documents were pre-processed (Part-of-Speech filtering and lemmatized format) by the librAIry NLP5757 service and projected into the previously created topic space.
6.3.Data storytelling
Buyers, suppliers, journalists, and citizens need to be provided with tools that allow them to understand and communicate the complex space of procurement at a high level without going through the complexity of general purpose data visualisation and analytics approaches. Therefore, there is a need for improved methods to create visualisations that communicate findings in an easy to understand way. Existing tools for interactive visualisations and infographics have improved considerably in the last years [44], but the story they are telling is often implicit and difficult to replicate or integrate with other analytics sources. In this respect, storytelling [42] is a viable approach, since it uses facts, statistical results, and data visualisations to convey information on a domain-space, to provide insights, to support arguments, and/or to present calls for action (i.e., data, visualisation, and narrative).
Automatic storytelling technology available so far is not only restricted to very narrow domains (e.g., financial news, weather, sports results), but the principles by which stories are generated are not aligned with more general data design frameworks, which in turn focus exclusively on visual components. To this end, we developed a data storytelling tool based on the basic design patterns that govern the organisation of procurement data sets. We use these design patterns, as well as the features of the data sets and the way they are visualised (e.g., type of data, type of data encoding, number of data points etc.), to create configurable, rich story templates, which can be filled in by the end users. The tool is designed as a client-side JavaScript framework that supports authors of data stories. This support includes configurable aspects (depending, among others, on the “shape” of the imported data and using pre-defined templates, and automation (e.g. to construct a particular story, suggest charts etc.). Story authors (such as data journalists, procurement analysists, or public-transparency enthusiasts) are able to import their own data sets (or use openly available ones), perform basic analyses to determine features of interest within the data, and then construct a report or slideshow style data story.
Fig. 7.
Data storytelling tool: feature-of-interest detection and visualisation based on automated data analysis and user suggested variables for a potential relationship; in the example user selects features of interest and corresponding visualisations for inclusion in their story.
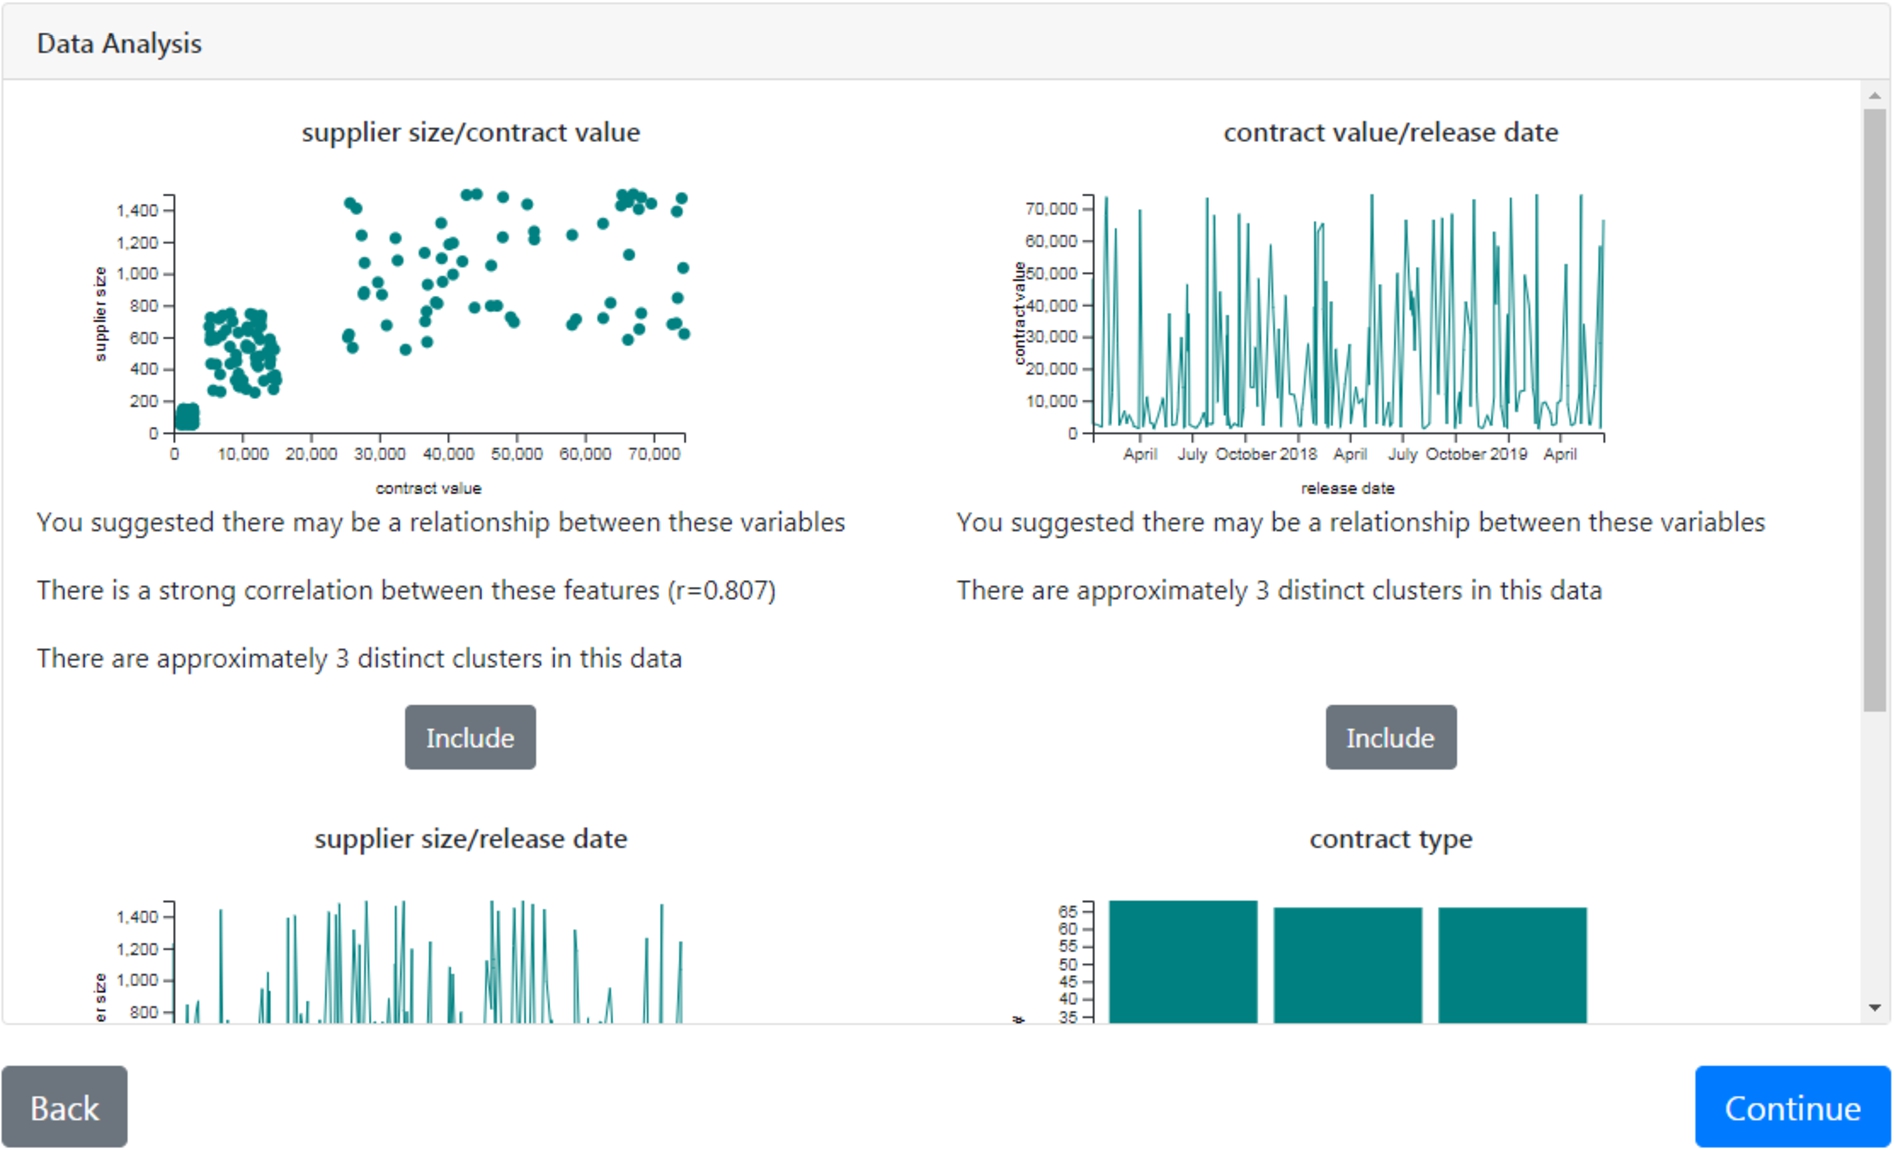
There are currently four major steps of the storytelling tool (see Fig. 7):
1. Import data: User imports data (in comma-separated-value format) to the tool and browses a high-level overview of it (including headers, data-type, example values, and, where appropriate, max/min values and value distributions). User’s data does not leave their client machine or is stored on external servers.
2. Analyse data: The tool detects and highlights to the user features of interest within the data (including trends and correlations), and suggest that the user include these in their story. It is possible for users to suggest potential relationships.
3. Create story: Users have the facility to create and edit sections of text, charts and images. Users are able to add annotations to charts (to highlight key regions of interest and add further context to visualisations). Tool uses a rule-based templating system to recommend additional sections to the story (based on analysis of data, and on currently included story-sections).
4. Export story: The user is able to export the created story to HTML format (multiple formats for different purposes, e.g., magazine-style and slide-style) and story format (a JSON-like format for saving/loading stories-inprogress).
The tool provides contextual information describing why features have been recommended, and it allows users to supplement the generated images with text to explicitly highlight regions of interest. Finally, the rule-based narrative flow generation mechanism, using pre-defined structures weighted based on the current state of the data story, recommends and classifies narrative blocks based on Kosara’s Claim-Fact-Conclusion pattern [21]. The tool is released as open source and is available on GitHub.5858
7.Uptake and adoption
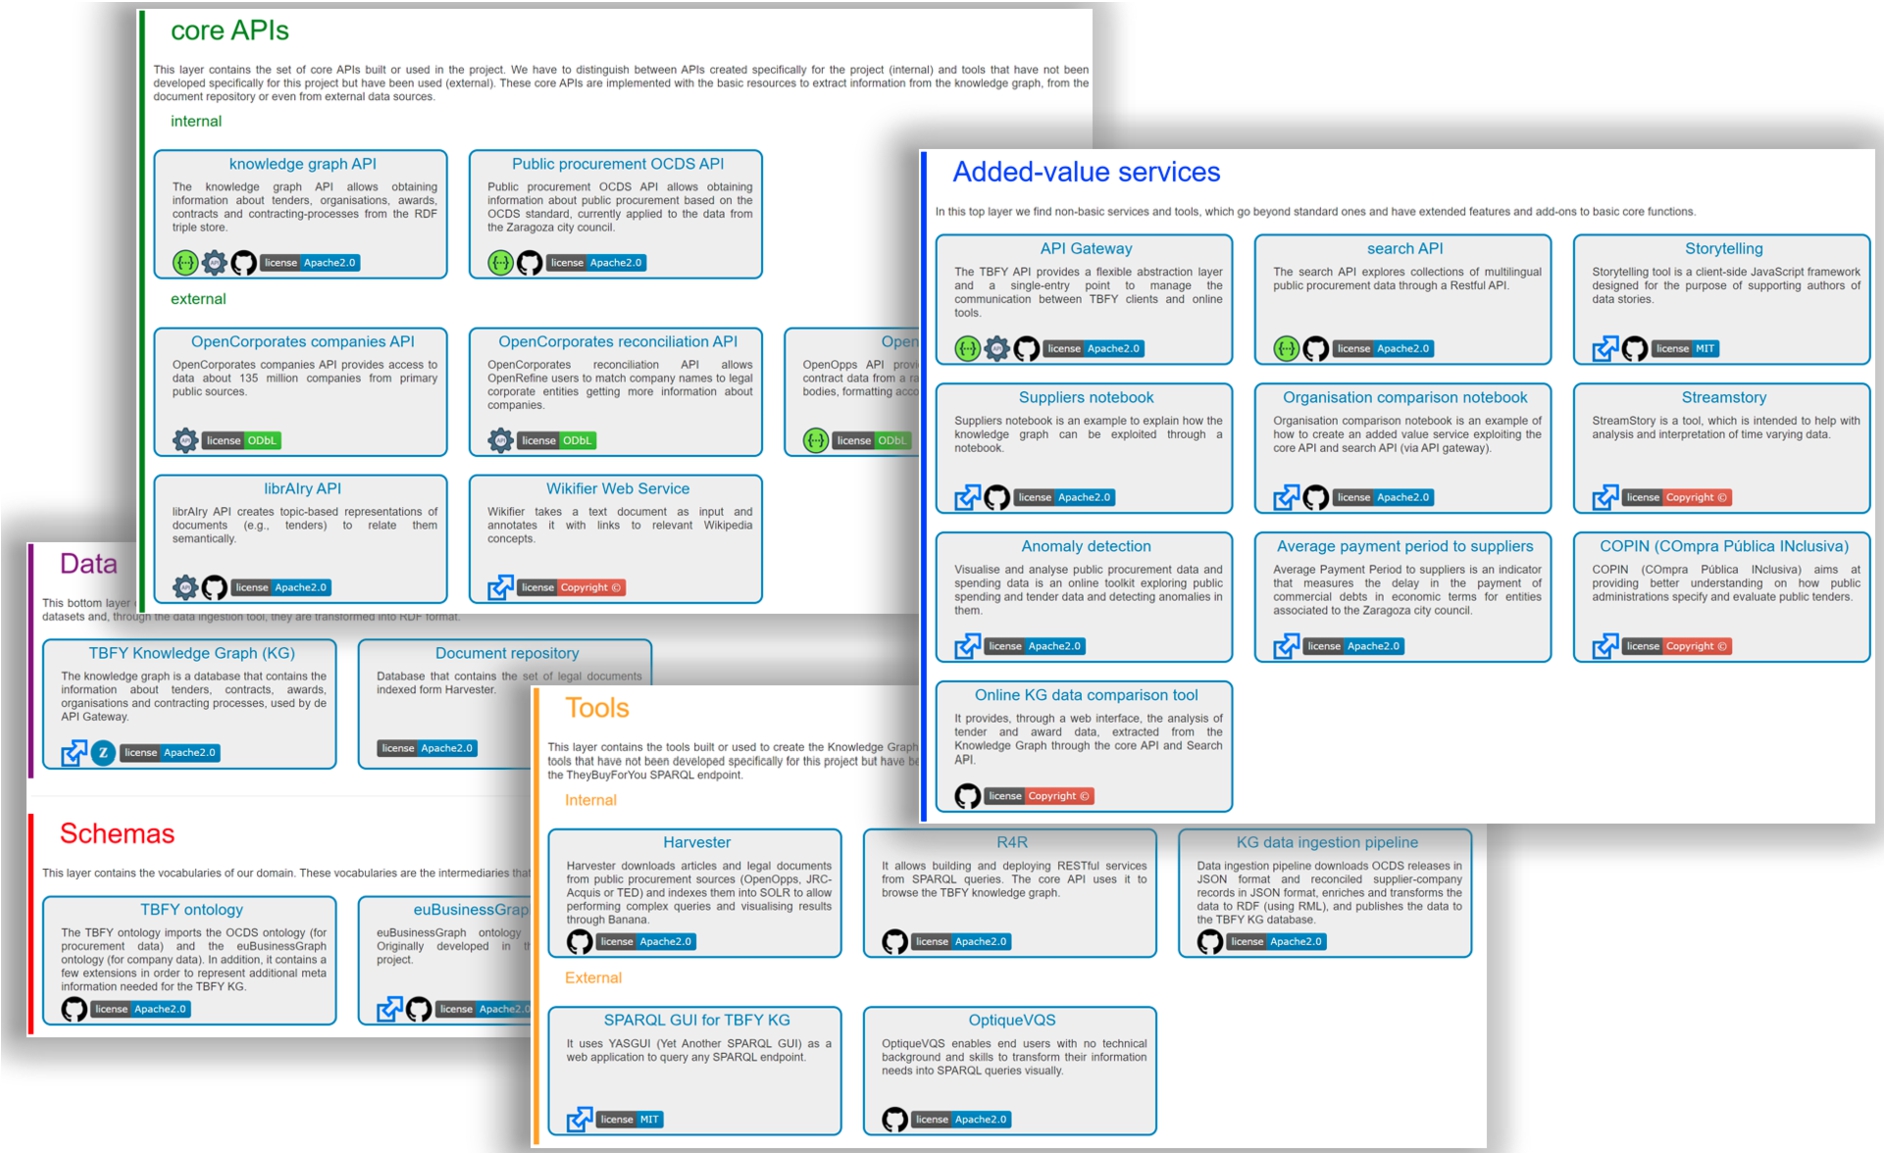
The data and platform components pointed out throughout the article are made available openly for the community to contribute and use; a catalogue is available online5959 with pointers to the code repositories, online versions of the artefacts, and relevant documentation (see Fig. 8).
Fig. 8.
TheyBuyForYou catalogue including data, ontologies, core APIs, tools, and added value services.
The uptake of our platform and KG has been exemplified in four different cases by four different stakeholders so far:
1. The Spanish company OESIA6060 aims at providing better understanding on how public administrations specify and evaluate public tenders, thus delivering the needed insights to improve the efficiency in procurement processes as well as lowering barriers to companies, mainly SMEs, the access to public tenders that will lead to a better internationalisation, and SMEs’ participation share on those tenders across Europe.
2. The city of Zaragoza, Spain, aims to respond to the needs of citizens, with new services for viewing economic information and contracting, favouring the understanding and knowledge of the data; reusers, generating their own services and developing an API based on common criteria to facilitate interoperability; and the institutions, working on tools to achieve a more transparent and efficient management of contracting processes.
3. The Italian company CERVED6161 aims to enable easier supplier selection by combining enriched company data with procurement contracts data with focus on the Italian market. It aims at addressing three main customer needs/problems: supplier analysis in terms of risk business information (default) and procurement risk (colluding); easing and speeding up the procurement decision process by supporting supplier scores and ranking; and, dealing with scarce offers/bidders through scouting for new suppliers.
4. The Ministry of Public Administration in Slovenia aims to spot potentially unwanted behaviour in public procurement. These findings could then be used to adjust legislation to curtail these unwanted actions or to direct the focus of the regulatory bodies to the discovered cases. The aim is to make public procurement even more transparent and generate new confidence, which would result in more offers being made in Slovenian public procurement and lead to rise in competition and better value for the taxpayers.
The knowledge graph API, KG, and the storytelling tool are being used by the OESIA and by the city of Zaragoza. OESIA created a commercial tool for tender analysis, which is offered to SMEs. Zaragoza includes economic information in their transparency portal,6262 including public procurement. Regarding advanced tools, the anomaly detection tool is being used by the Ministry of Public Administration in Slovenia for detecting procurement anomalies, while the cross-lingual similarity search is being used by CERVED for finding tenders in other countries/languages and offering this as part of their services. The categories of users using the system include civil servants (i.e., Zaragoza and Slovenia), citizens (i.e., Zaragoza), and companies, especially SMEs (i.e., CERVED and OESIA). As of May 2021, over 5.000 queries have been submitted to the system APIs.
Our ontology network is proposed as the way to publish open data about procurement by governments. An example is the case of Zaragoza, which already adopted our ontology network. We plan to maintain the KG in the context of already funded innovation projects. Maintenance will include ingesting new data and operating the system. Agreements with data providers, i.e., OpenOpps and OpenCorporates, have been established to provide the KG with data on a continuous basis.
8.Evaluation
A set of evaluations focusing on platform components and advanced services and tools were conducted. The results are presented in what follows. We note that advanced services described in this article, i.e., anomaly detection, cross-lingual search, and user storytelling, showcase the possibilities that come with a KG integrating heterogeneous procurement data and relevant data sets. There are various other approaches that could be built on such a KG, for example graph-based techniques for anomaly detection [3] and transformer architectures6363 for cross-lingual search.
8.1.Platform and KG
We justify the practical value of the platform and KG in terms of (i) the extent to which the KG is able to meet the key information needs, (ii) the computational requirements and characteristics of the data ingestion process, (iii) and the data access performance through the knowledge graph API.
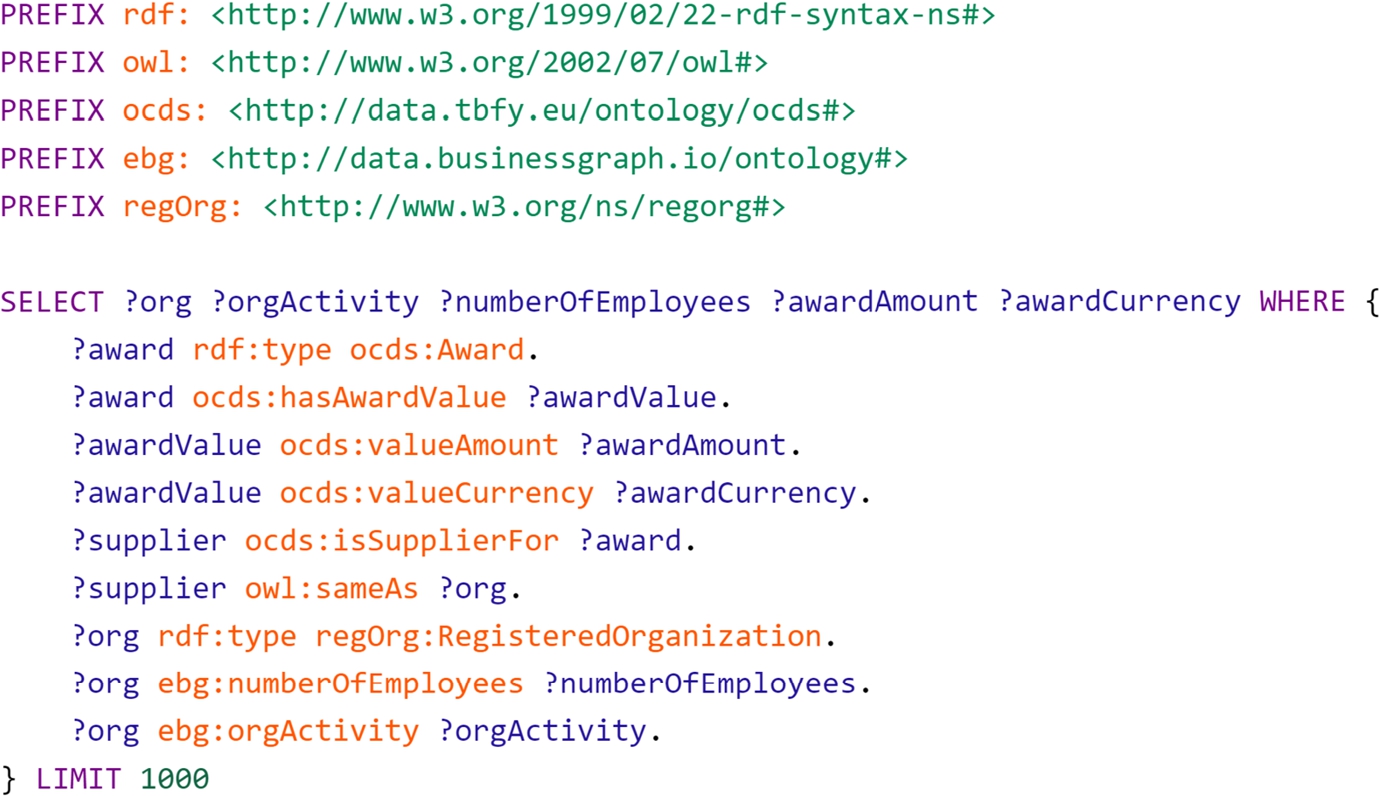
Regarding the KG and its ability to meet the key information requirements, the development of the ontologies underlying the KG followed established ontology development processes and the information needs specified earlier in their respective development processes are met [30,35]. A key indicator is the stakeholders adopting the KG and platform components based on KG. These include two public and two non-public organisations as described in Section 7. In Fig. 9, an example query, representing the value of the ontology network and the integrated data sets, is shown. The query gathers a list of organisations, their number of employees and activity categories, and the award amounts and currencies for the awards with which these companies are associated as suppliers. This query essentially brings together two key information pieces, that is the award amount and the number of employees from the procurement data set represented through the OCDS ontology and company data set represented through the euBusinessGraph ontology respectively. Such queries enable advanced analytics, such as anomaly detection approaches (e.g., statistical approach) presented in Section 6, over originally disconnected data sets.
Fig. 9.
A SPARQL query spanning over the integrated procurement and company data sets.
Regarding the data ingestion process, we are running the ingestion pipeline on a powerful server, with the following hardware specifications: 2× Xeon Gold 6126 (12 Cores, 2.4 GHz, HT) CPU, 512 GB main memory, 1× NVIDIA Tesla K40c GPU, and 15 TB HDD RAID10 & 800 GB SSD storage. We use a workload manager system to schedule daily ingestion jobs with 1 core and 16 GB of memory allocated. On average, 2500 OCDS releases are processed and 2400 suppliers (i.e., companies) are looked up per day. The average daily performance for each data ingestion step is given below:
– Step 1 (Download procurement data): around 1 minute per day.
– Step 2 (Reconcile supplier data): less than 20 minutes per day.
– Step 3 (Enrich JSON data): around 1 minute per day.
– Step 4 (Convert JSON to XML): less than 1 minute per day.
– Step 5 (Map XML data to RDF): less than 1 hour per day.
– Step 6 (Publish RDF to database): around 2 minutes per day.
The daily data ingestion process, as the figures provided suggest, could be executed a couple of times during the day or as one large batch process overnight without any computational problems.
Regarding the data access performance, we are running the knowledge graph storage and API services in Docker containers on an Amazon EC2 m5.2× large virtual machine with 8 vCPU and 32 GB memory.6464 The SPARQL query in Fig. 9 takes around 0.58 seconds to complete. We list performance figures for a few example knowledge graph API calls invoked by a Web client over the Internet (each executed 10 times and averaged):
– API calls of type “get a contracting process by id”, “get a tender by id”, “get an award by id”, and “get an organisation by id”: around 0.15 seconds,
– API calls of type “get 1000 contracting processes”, “get 1000 tenders”, “get 1000 awards”, “get 1000 organisations”: around 0.30 seconds,
– API calls of type “get 1000 contracting processes and associated awards”, “get 1000 contracting process and associated tenders”, “get 1000 contracting process and associated contracts”: around 0.40 seconds.
The API calls are answered in reasonable time intervals offering a feasible data access layer for end-user applications built on top.
8.2.Anomaly detection
We did an analysis of the Slovenian data together with the experts from Ministry of Public Administration in Slovenia using our anomaly detection system over the Slovenian procurement data in the KG. We report three example cases in order to provide an empirical evidence for the usefulness of the proposed anomaly detection solution.
Fig. 10.
(a) Anomaly detection in public procurement data with k-Means analysis. (b) The decision tree model for identifying successful tenders, (c) A graph showing interdependence between the tender value and the number of employees of bidders.
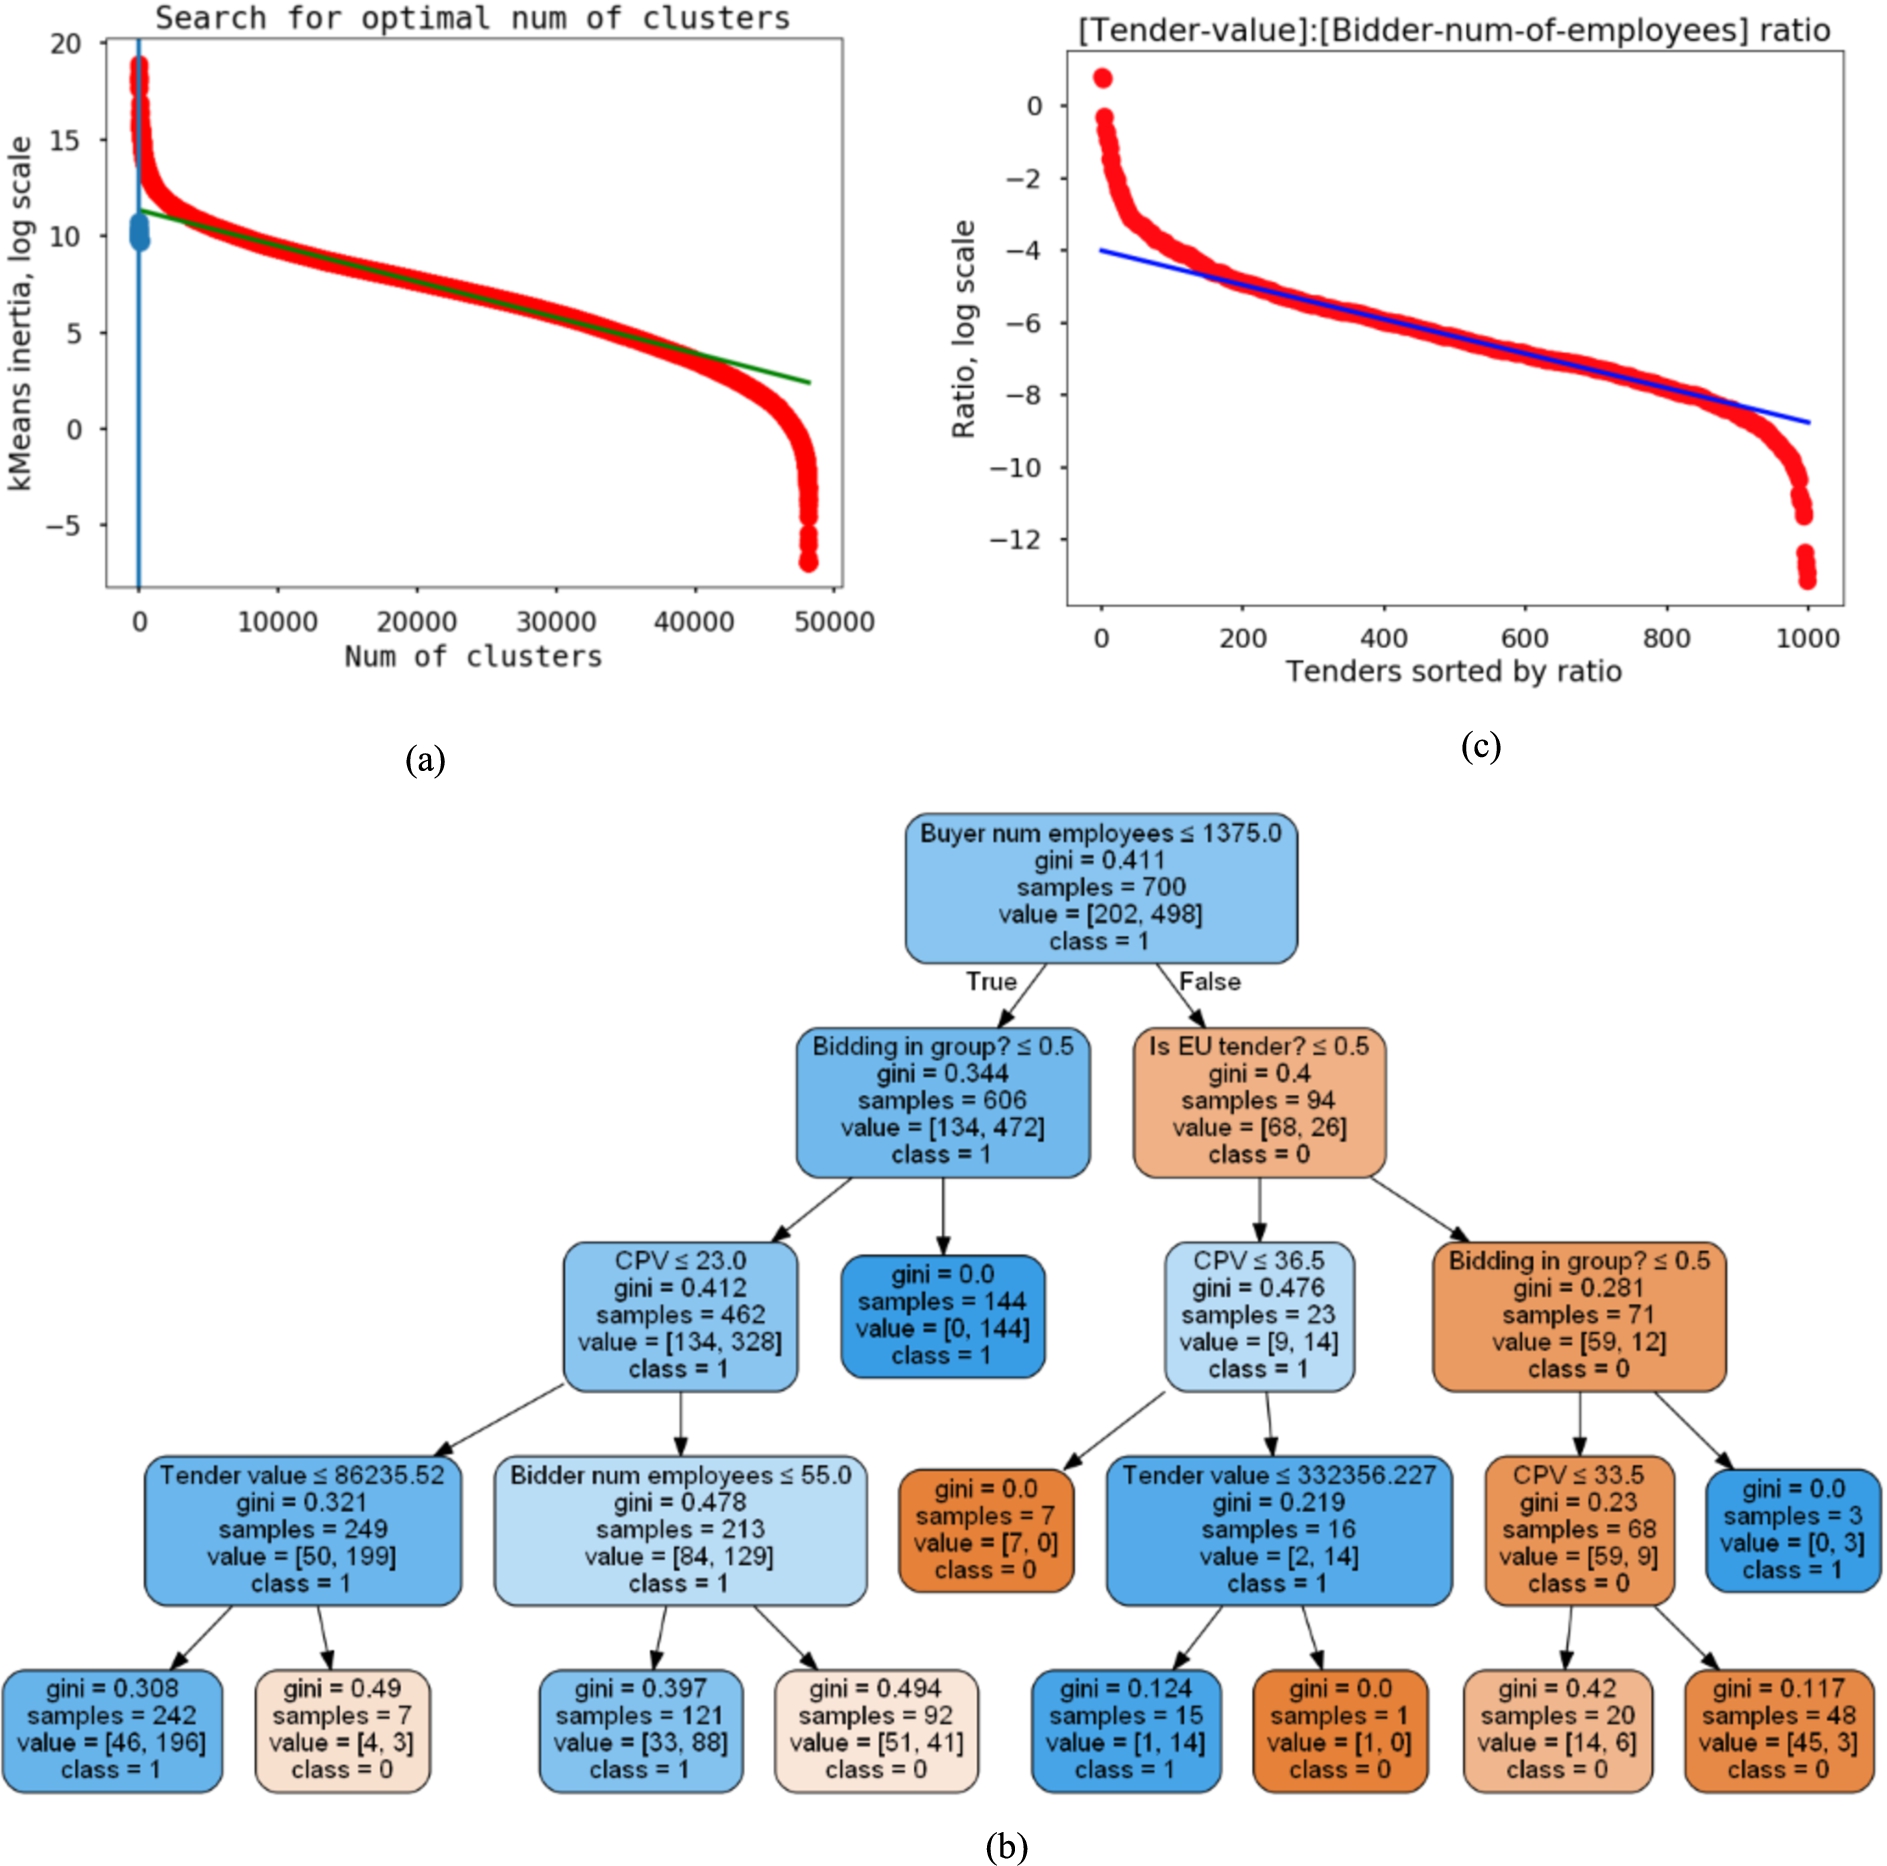
Case 1: The unsupervised learning approach is designed to identify tenders with highest deviations from the “baseline”. Figure 10 (a) depicts an example; in the interactive system it returns an ordered list when clicked. For example, our method identified a public procurement with tender value of 92 million EUR, which was won by the bidder named Telekom of Slovenia. It is the biggest telecommunication provider in Slovenia. The buyer is a public company, namely DARS d.d. Motorway Company in the Republic of Slovenia. A quick look into the public spending data Erar6565 shows that DARS Motorway Company in the Republic of Slovenia paid Telekom of Slovenia around 34.1 million EUR during October 2014, but there was one very large transaction in April 2018, 26.2 million EUR, while other transactions were much smaller. This example shows that users can quickly spot deviations and find hints on data that sticks out and are worth of more in-depth scrutiny.
Case 2: By using a decision tree, we identified criteria for successful tenders. Figure 10 (b) depicts an example and is set through the configuration screen exemplified in Fig. 5; in the interactive system it returns more details when clicked. We currently define a successful tender as a tender that received more than one bid (i.e., meaning that there is a competition, so we assume tender is successful). The success definition could be redefined by the decision makers. Our analysis showed that a tender is successful, if the public institution who opened the tender is small (less than 1375 employees) and if the bidding is done in group. In that case, the chance of having more than one provider is 70%. This analysis therefore shows that small buyers attract more competition than big ones, especially if they allow bidding in group. This can give decision makers a clear signal, that is small public institutions should be motivated to bid in groups.
Case 3: We developed a visual presentation for the interdependence of tender value and the number of employees of bidders using statistical analysis. This is exemplified in Fig. 10 (c); in the interactive system it returns an ordered list when clicked. On the upper left corner of the graph, we see big companies that won small tenders, while on a bottom right corner, there are companies with small number of employees that won big tenders. Based on this statistical analysis, we selected one bidder, who stands out on a positive deviations side. The bidder is a company registered for wholesale of pharmaceutical goods and medical supplies. It does not have any employees and a webpage, but won a tender of a value 9 million EUR. After checking the history of this bidder’s business with the Slovenian public sector, we found some interesting transactions from Slovenia Forest Service to this company. This gives a hint for some further manual investigation.
The findings presented here do not necessarily mean an illegal situation; however, they provide pointers for further investigation. The cases presented demonstrate that the system developed for anomaly detection could be useful for finding interesting patterns in large procurement data sets.
8.3.Cross-lingual search
The evaluation of cross-lingual document similarity through unsupervised probabilistic topic models described in [5] was extended to handle Portuguese and Italian texts, in addition to those already handled in English, Spanish and French. The method was evaluated in a document retrieval task by using a set of documents previously tagged with categories.
The JRC-Acquis6666 corpus [38] was used to create the cross-lingual topic models. More than 81k texts tagged into subject domains according to the EUROVOC6767 thesaurus [1] were included in the training-test package for each language-specific model. It is publicly available6868 for reuse.
A pre-processing of the documents was required to clean texts and to build a suitable data set for the model. Terms with high frequency were assumed not specific to a particular topic, so words present in more than 90% of the corpus were considered stopwords and removed from the model. Also, rare terms that occur infrequently were considered not representative of a single topic since they did not appear enough to infer that it is salient for a topic. Thus, words present in less than 0.5% of the corpus were also removed from the model. Lemmatized expressions of names, verbs and adjectives were used to create the bag-of-words, and documents with less than 100 characters were discarded since LDA has proven to has lower performance with these type of texts [10].
We followed some steps [5] to set the number of topics
We also used a supervised version of LDA to force the correspondence between the categories identified in the EUROVOC thesaurus and the latent topics of the model. Theme-aligned probabilistic topic models were created in Italian7171 and Portuguese.7272 They share the topics but not its definitions (i.e., vocabulary).
A simple way of looking at the output quality of the topic models is by simply inspecting top words associated with a particular topic learned during training. Samples of cross-lingual topics are provided in Fig. 6. We may consider this visual inspection of the top words associated with each topic as an initial qualitative evaluation, suitable for human judges.
A collection of 1k randomly selected documents (monolingual, bi-lingual and multi-lingual) were annotated by the category-based and synset-based topic alignment algorithms. Then, we randomly took articles to search for documents that share the same categories than the query document (i.e., the ground-truth set). Next, the query text was used to search for similar documents using category-based annotations and synset-based annotations. We evaluated the performance of the algorithms in terms of precision@3, precision@5 and precision@10.
Results, see Table 2, were quite promising across languages with a performance close to the supervised approach in terms of accuracy. A better performance is achieved with English texts as expected from the quality of the tools in those languages. This makes us think that the process of topic annotation by set of synonyms should be improved to filter those elements that are not sufficiently representative. Our future lines of work will go in that direction, incorporating context information to identify the most representative synset for each topic.
Table 2
Document retrieval performance (precision@3, precision@5 and precision@10) of the categories-based (cat) and synset-based (syn) topic alignment algorithms in multilingual document collections (en, es, fr, it, pt)
| JRC-Acquis Corpora | |||||||||||||
| en | pt | en-pt | es-pt | en-es-fr-pt | en-es-fr-pt-it | ||||||||
| cat | syn | cat | syn | cat | syn | cat | syn | cat | syn | cat | syn | ||
| p@3 | mean | 0.84 | 0.83 | 0.79 | 0.78 | 0.82 | 0.81 | 0.80 | 0.78 | 0.81 | 0.69 | 0.82 | 0.71 |
| dev | 0.26 | 0.26 | 0.27 | 0.29 | 0.23 | 0.29 | 0.23 | 0.26 | 0.23 | 0.29 | 0.25 | 0.29 | |
| p@5 | mean | 0.82 | 0.80 | 0.77 | 0.75 | 0.80 | 0.78 | 0.77 | 0.76 | 0.78 | 0.67 | 0.79 | 0.69 |
| dev | 0.25 | 0.25 | 0.25 | 0.27 | 0.23 | 0.25 | 0.22 | 0.24 | 0.24 | 0.25 | 0.21 | 0.26 | |
| p@10 | mean | 0.77 | 0.76 | 0.72 | 0.71 | 0.77 | 0.75 | 0.75 | 0.72 | 0.73 | 0.62 | 0.74 | 0.63 |
| dev | 0.23 | 0.25 | 0.25 | 0.27 | 0.22 | 0.21 | 0.22 | 0.24 | 0.22 | 0.24 | 0.23 | 0.24 | |
8.4.Data storytelling
To evaluate the tool, a targeted user-study was carried out. Participants were chosen as people who are familiar with creating data stories and work with data in a professional capacity. Five participants were involved in the study. This work was approved by the University of Southampton’s ethics board.7373
The evaluation process took the form of a contextual inquiry. Each participant was provided with a tutorial video explaining how the tool functioned and a sample data set. They were then asked to use the tool, and the provided data, to plan out a draft of a data story (with some guidance on aspects of the data that they should investigate) and were asked to talk through their actions and intentions as they progressed. Finally, they were asked to take part in a semi-structured interview exploring the full process.
During the data upload process, the primary observation made by participants was that they would, under normal circumstances, analyse the data in a stand-alone data analysis tool (for example Microsoft Excel or Google Sheets) to get a full overview of the data. Therefore, failing that, more ability to view and manipulate the raw data (for example, sorting by columns) would be required. In addition, the “dependencies” field (since renamed “Relationships”) often proved confusing to participants; a more thorough explanation (either in-tool or as part of the supplementary material) may be required to address this. However, once the concept (that this allowed them to examine suspected relationships in the data) was explained, they quickly understood and could utilise the feature. As such, there are two primary approaches that could be taken to address the observations described above; firstly, a small number of UI changes (for example, the ability to sort or filter columns) could be used to introduce (modestly) extended data analysis capability. Secondly, by simplifying the initial data interface and reframing the tool (and the supplementary material, such as documentation and tutorials) to emphasise the supportive nature of the tool and the fact that it should not be a replacement to more powerful data analysis packages, and to highlight that the tool’s primary purpose is (and/or, should be) narrative first and foremost, user expectations can be managed.
Participants frequently mentioned the tool’s ability to highlight possible features of interest within the data set as being a highly useful feature for their workflow. The key challenge participants faced with using this part of the tool was that, particularly with scatterplots and outliers, it is difficult to determine which row of the data set each point represents in the preview of the chart. The tool is unable to establish which is the key field being represented by the rows of the data set (e.g. “country”). Therefore, this would need to be manually determined by the user (possibly at the data upload stage) before relevant tooltips could be displayed to guide the process. Similar requests were made to enhance this part of the process to fully leverage the tool’s strengths, such as by visually highlighting the detected features (e.g. the trend, clusters, or outliers). One participant noted that the default values used by the tool to determine strength-of-correlation are subjective; depending on the domain, a correlation of for example
The narrative structure recommendations were a divisive element of the tool; some participants found that the extra structure it afforded was valuable (particularly in the context of semi-automated news and block-based reporting), while others felt that it may be too prescriptive and did not match their existing workflow. One key observation made that shed some light on this view was that the current narrative structure (based on the claim-fact-conclusion) structure is highly “academic” and, while suitable for creating formal reports, does not map to all domains (such as journalistic articles). As such, if the recommender supported other narrative structures such as the proverbial “inverted pyramid” (possibly chosen at story-creation time by the user), the tool would have wider reach and greater benefit across different domains.
The story export feature, perhaps surprisingly, proved to be the feature most difficult to integrate with the current data-story author workflow. This is due to the fact that many of the participants publishing workflows currently require proprietary in-house (or otherwise integration with third-party) tools. While there is little that can be done to shift industry workflows, some of these issues could be mitigated in future by providing non-web-based output formats (such as .odt or .pdf) and/or by developing closer integration with third-party tools (such as Wordpress). Another concern raised by participants was the need for the ability to provide simple formatting of the created stories. At present, the tool deliberately has minimal styling capability, such that this can be handled by the authors’ own house style (for example, their existing CSS templates). However, limited formatting (for example, in the form of section headers, semantic markup, and/or markdown) could be included in future iterations to support this further.
Overall, the tool provides a serviceable platform for developing data stories (particularly when used in concert with other tools) that can freely be iterated upon, developed, and extended by different communities that require domain specific functionalities. While the tool cannot replace the full storytelling pipeline, it does not set out to do so, and instead succeeds in supporting authors by providing an ability to highlight key features and recommend story structures.
9.Discussion
There are plenty of lessons learned in the context of this work, which may be applicable to the construction of other KGs in similar or different domains. In what follows, we discuss the business impact of our approach and solutions and lessons learned from Semantic Web and data quality perspectives.
9.1.Business impact
The availability of an EU-wide integrated procurement data and advanced tools built on top for data analytics and decision making have potential to:
(i) make it easier for buyers to award business to the right supplier and to engage smaller suppliers in the public-sector supply chain. These include identifying opportunities, mitigating risks, establishing procurement practices that engage SMEs, managing down the supply chain (i.e., subcontracting), and whole cost analysis (i.e., positive impact of a supplier).
(ii) enable identifying demand trends for specific services (e.g., health and social care) more accurately, determining whether a demand is sustainable, and identify ways to satisfy the demand. This could be realised through supply and demand visualisation to show where demand for private sector supply is becoming unsustainable and analytics algorithms to understand how to ameliorate demand.
(iii) make it possible to spot purchasing trends across Europe, and drive an understanding of where in Europe markets are operating most efficiently. Buyers can then use this data to either, seek to develop their own domestic market, broaden their trade, and identify bid rigging events, often thought of as the hardest type of procurement corruption to identify.
(iv) help procurement managers with advanced supplier analysis and bid rigging situations. This include aggregated, rich supplier profiles (e.g., identify financially sound and structurally stable suppliers), identifying supplier collusive tendering (e.g., hidden strong and weak connections between several participating companies), and locating and engaging potential suppliers.
Finally, the adoption of TheyBuyForYou approach, KG, tools, ontologies simplifies and gives ability to integrate and do analytics over data sets independently produced by different companies, hence shortening the time to market for new products and services; has potential to increase the data integration activities considerably both in terms of size and number; and catalyse activities in data integration leading to an increasing number of competitive services for data integration.7474
9.2.Semantic technologies
We used Semantic Web technologies to integrate disparate open data sources in a standardised way. We list a set of particular observations below:
(i) Semantic technologies enabled ingesting disparate data sources, integrating relevant data sets (e.g., company and procurement data), and publishing data in a uniform way by using existing tools and good practices. However, getting and pre-processing the data (e.g., mapping and curation) was a major time-consuming task.
(ii) The KG enabled easier and advanced analytics, which was otherwise not possible, by connecting suppliers appearing in the procurement data to companies in company data. However, the lack of identifiers or identifying information for key entities, such as companies, in original data sources hampers the reconciliation process.
(iii) The chosen Semantic Web technologies and tools scaled well for ingesting and provisioning large amounts of data and RESTful approach was useful for bringing the Linked Data to non-Semantic Web application developers. However, more support is required such as visual editors for specifying mapping and data transformations.
(iv) The process of building a high-quality KG that can be used extensively by users would be clearly improved if all data sources were providing their procurement data in a more structured manner. There are still many documents provided as PDFs (even scanned PDFs), hindering techniques like the ones described for cross-lingual search.
(v) Data quality, as described below, and the lack of data (currently, due to many types of regulations across countries, not all contracting processes, especially the smallest ones, are published) are still a relevant issue and reduce the result quality of ML processes such as anomaly detection, cross-lingual search, and reconciliation.
The main take away here is that data publishers should publish their data through standard vocabularies, ontologies, and APIs. This would, in the first place, save data consumers from ad-hoc data collection and integration efforts (e.g., Web scraping, data curation, reconciliation) and resources freed could be redeployed for value creation activities. Similar solutions could be provided using other technologies; however, without following the Linked Data and Semantic Web principles, they would rather remain ad-hoc, require major restructuring efforts with each new data set, and could not be easily scaled, given various independent data publishers and consumers.
9.3.Data quality
We faced a relatively large number of data quality issues, even though there are mandates in place for buyers to provide correct data. This particularly applies to procurement data sources. These data quality issues could be classified as:
(i) Missing data: It is frequent that data is missing. Among others, the least frequently completed field in the tender and contracting data is the value field; it is usually completed in less than 10% of tender notices. One item of data that is particularly important to procurement transparency is the reference data required to link a contract award to a tender notice (very common in the TED data). We found that just 9% of award notices had provided a clear link between tenders and contracts. Subsequently, the majority of contract award notices were orphaned and there was no link to the source tenders.
(ii) Duplicate data: Publishers frequently publish to multiple sources in order to meet the legal requirements of their host country and that of the European Union. This means that all over-threshold tenders are available at least twice. The task of managing duplicates is not always simple. It is common for different publishing platforms to have different data schemas and interoperability between schemas is not guaranteed.
(iii) Poorly formed data: Sources are frequently providing malformed data or data that cannot be reasonably parsed by code. The tender and contract value field can often include string values rather than numbers (same goes for the dates). Across the sources, the approach to using character delimiters in value data is frequently heterogeneous, with different nationalities using different delimiters to separate numbers and to indicate decimals.
(iv) Erroneous data: Structured data such as numeric and date records are frequently a problem. Buyers often submit zero value entries in order to comply with the mandate and the lack of validation on date related data has allowed buyers to record inconsistent date data. There are some contracts where the date of publication exceeds the end date of the contract or the start date of the contract is greater than the end date of the contract.
(v) Absent data fields: In some cases, the sources lack core pieces of information, for instance, there is no value field in a number of European sources. A large number of sites also fail to publish the currency of their monetary values. In all cases, if a publisher sought to add the additional information, such as a different currency, there would be no capacity in the system to provide the information required in a structured form.
Most of these problems could be resolved through the use of standards and validation at the point of data entry. Requiring buyers to publish records to a standard would, in turn, require the platform providers to both mandate the field format and validate data entries. The usage of an ontology network for the development of the KG allowed us to inform public administrations willing to provide data on the minimum set of data items that are needed, and some of them are already adapting their information systems for this purpose [15].
10.Conclusions
In this article, we presented an open linked data platform for constructing and publishing a KG for public procurement data through an ontology network and a set of APIs. We also presented a set of advanced services and tools for using and analysing these data including anomaly detection, cross-lingual search, and data storytelling. We provided evidence for adoption and a series of evaluations from various dimensions showing that a KG based approach based on Semantic Web and Linked Data principles and technologies is a viable solution for integrating and analysing large and disparate data sources. We released all the software components and data sets (both original and transformed) openly for the use of public.
The future work includes firstly integrating new related data sets, such as spending data (i.e., transactions) [41], for extracting more complicated insights through ML. Secondly, the use of non-ML techniques, such as crowd-sourcing [11], is to be explored in order to improve the data quality and data linking efforts. Finally, developing high level visual tools (e.g., [33]) for data mappings and transformations to aid the data integration process would be essential.
Notes
73 ERGO ID 53399
Acknowledgement
The work presented in this article was funded by the EC H2020 project TheyBuyForYou (grant 780247).
References
[1] | Eurovoc, Thesaurus EUROVOC – Volume 2: Subject-Oriented Version. Ed. 3/English Language. Annex to the index of the Official Journal of the EC, in: Luxembourg, Office for Official Publications of the European Communities, 1995. |
[2] | J.M. Ackerman and I.E. Sandoval-Ballesteros, The global explosion of freedom of information laws, Administrative Law Review 58: (1) ((2006) ), 85–130, www.jstor.org/stable/40712005. |
[3] | L. Akoglu, H. Tong and D. Koutra, Graph based anomaly detection and description: A survey, Data Mining and Knowledge Discovery 29: (3) ((2015) ), 626–688. doi:10.1007/s10618-014-0365-y. |
[4] | J.M. Alvarez-Rodríguez et al., New trends on e-Procurement applying semantic technologies, Computers in Industry 65: (5) ((2014) ), 797–799. doi:10.1016/j.compind.2014.04.002. |
[5] | C. Badenes-Olmedo et al., Scalable cross-lingual similarity through language-specific concept hierarchies, in: Proc. of K-CAP 2019, ACM, (2019) , pp. 147–153. doi:10.1145/3360901.3364444. |
[6] | S.K. Bansal and S. Kagemann, Integrating big data: A semantic extract-transform-load framework, Computer 48: (3) ((2015) ), 42–50. doi:10.1109/MC.2015.76. |
[7] | M. Bennett, The financial industry business ontology: Best practice for big data, Journal of Banking Regulation 14: (3) ((2013) ), 255–268. doi:10.1057/jbr.2013.13. |
[8] | R.A. Berk, Statistical Learning from a Regression Perspective, Springer, (2020) . doi:10.1007/978-3-030-40189-4. |
[9] | V. Chandola et al., Anomaly detection: A survey, ACM Computing Surveys 41: (3) ((2009) ). doi:10.1145/1541880.1541882. |
[10] | X. Cheng et al., BTM: Topic modeling over short texts, IEEE Transactions on Knowledge and Data Engineering 26: (12) ((2014) ), 2928–2941. doi:10.1109/TKDE.2014.2313872. |
[11] | E.H. Chi, Technical perspective: Humans and computers working together on hard tasks, Communications of the ACM 60: (9) ((2017) ), 92. doi:10.1145/3068614. |
[12] | O. Corcho et al., Ontological engineering: Principles, methods, tools and languages, in: Ontologies for Software Engineering and Software Technology, C. Calero, F. Ruiz and M. Piattini, eds, Springer, (2006) , pp. 1–48. |
[13] | E. Daga et al., A BASILar approach for building web APIs on top of SPARQL endpoints, in: Proc. of SALAD 2015, CEUR-WS.org, (2015) , http://ceur-ws.org/Vol-1359/paper4.pdf. |
[14] | I. Distinto et al., LOTED2: An ontology of European public procurement notices, Semantic Web 7: (3) ((2016) ), 267–293. doi:10.3233/SW-140151. |
[15] | P. Espinoza-Arias et al., The Zaragoza’s knowledge graph: Open data to harness the city knowledge, Information 11: (3) ((2020) ). doi:10.3390/info11030129. |
[16] | G. Futia et al., Removing barriers to transparency: A case study on the use of semantic technologies to tackle procurement data inconsistency, in: Proc. of ESWC 2017, Springer, (2017) , pp. 623–637. doi:10.1007/978-3-319-58068-5_38. |
[17] | M. Giese et al., Optique: Zooming in on big data, Computer 48: (3) ((2015) ), 60–67. doi:10.1109/MC.2015.82. |
[18] | P. Harrington, Machine Learning in Action, Manning Publications Co., (2012) . |
[19] | P. Hitzler, A review of the semantic web field, Communications of the ACM 64: (2) ((2021) ), 76–83. doi:10.1145/3397512. |
[20] | M. Janssen et al., Driving public sector innovation using big and open linked data (BOLD), Information Systems Frontiers 19: (2) ((2017) ), 189–195. doi:10.1007/s10796-017-9746-2. |
[21] | R. Kosara, An argument structure for data stories, in: Proc. of EuroVis 2017, (2017) , pp. 31–35. doi:10.2312/eurovisshort.20171129. |
[22] | A. Meroño-Peñuela et al., grlc makes GitHub taste like linked data APIs, in: Proc. of ESWC 2016, Springer, (2016) , pp. 342–353. doi:10.1007/978-3-319-47602-5_48. |
[23] | M. Miroslav et al., Semantic technologies on the mission: Preventing corruption in public procurement, Computers in Industry 65: (5) ((2014) ), 878–890. doi:10.1016/j.compind.2014.02.003. |
[24] | J. Muñoz-Soro et al., PPROC, an ontology for transparency in public procurement, Semantic Web 7: (3) ((2016) ), 295–309. doi:10.3233/SW-150195. |
[25] | M. Nečaský et al., Linked data support for filing public contracts, Computers in Industry 65: (5) ((2014) ), 862–877. doi:10.1016/j.compind.2013.12.006. |
[26] | N.F. Noy and D.L. McGuinness, Ontology development 101: A guide to creating your first ontology, Technical Report, Stanford Medical Informatics, 2001. |
[27] | OECD principles for integrity in public procurement, 2009, Technical Report, OECD, http://www.oecd.org/gov/ethics/48994520.pdf. |
[28] | J.M.Á. Rodríguez et al., Towards a pan-European E-procurement platform to aggregate, publish and search public procurement notices powered by linked open data: The moldeas approach, International Journal of Software Engineering and Knowledge Engineering 22: (3) ((2012) ), 365–384. doi:10.1142/S0218194012400086. |
[29] | D. Roman et al., A bird’s-eye view of euBusinessGraph: A business knowledge graph for company data, in: Proc. of the ISWC 2020 Posters, Demos, and Industry Tracks, CEUR-WS.org, (2020) , http://ceur-ws.org/Vol-2721/paper493.pdf. |
[30] | D. Roman et al., The euBusinessGraph ontology: A lightweight ontology for harmonizing basic company information, Semantic Web, in press ((2021) ). doi:10.3233/SW-210424. |
[31] | E. Simperl et al., Towards a knowledge graph based platform for public procurement, in: Proc. of MTSR 2018, Springer, (2018) , pp. 317–323. doi:10.1007/978-3-030-14401-2_29. |
[32] | A. Soylu et al., Towards integrating public procurement data into a semantic knowledge graph, in: Proc. of EKAW 2018 Poster and Demonstrations, CEUR-WS.org, (2018) , http://ceur-ws.org/Vol-2262/ekaw-poster-01.pdf. |
[33] | A. Soylu et al., OptiqueVQS: A visual query system over ontologies for industry, Semantic Web 9: (5) ((2018) ), 627–660. doi:10.3233/SW-180293. |
[34] | A. Soylu et al., An overview of the TBFY knowledge graph for public procurement, in: Proc. of ISWC 2019 Satellite Tracks, CEUR-WS.org, (2019) , http://ceur-ws.org/Vol-2456/paper14.pdf. |
[35] | A. Soylu et al., Towards an ontology for public procurement based on the open contracting data standard, in: Proc. of I3E 2019, Springer, (2019) , pp. 230–237. doi:10.1007/978-3-030-29374-1_19. |
[36] | A. Soylu et al., Enhancing public procurement in the European Union through constructing and exploiting an integrated knowledge graph, in: Proc. of ISWC 2020, Springer, (2020) , pp. 430–446. doi:10.1007/978-3-030-62466-8_27. |
[37] | A. Soylu et al., Integrating and analysing public procurement data through a knowledge graph: A demonstration in a nutshell, in: Proc. of the ISWC 2020 Posters, Demos, and Industry Tracks, CEUR-WS.org, (2020) , http://ceur-ws.org/Vol-2721/paper492.pdf. |
[38] | R. Steinberger et al., The JRC-Acquis: A multilingual aligned parallel corpus with 20+ languages, in: Proc. of LREC 2006, (2006) , pp. 2142–2147. |
[39] | TBFY, KG data dump, Zenodo, 2020. doi:10.5281/zenodo.3712323. |
[40] | The cost of non-Europe in the area of organised crime and corruption, 2016, Technical Report, European Parliament, https://www.europarl.europa.eu/RegData/etudes/STUD/2016/579319/EPRS_STU%282016%29579319_EN.pdf. |
[41] | K. Timo et al., Public procurement spend analysis at a national level in Finland, Journal of Public Procurement 19: (2) ((2019) ), 108–128. doi:10.1108/JOPP-06-2019-028. |
[42] | C. Tong et al., Storytelling and visualization: An extended survey, Information 9: (3) ((2018) ). doi:10.3390/info9030065. |
[43] | J. Yan et al., A retrospective of knowledge graphs, Frontiers of Computer Science 12: (1) ((2018) ), 55–74. doi:10.1007/s11704-016-5228-9. |
[44] | S. Zhu et al., A survey on automatic infographics and visualization recommendations, Visual Informatics 4: (3) ((2020) ), 24–40. doi:10.1016/j.visinf.2020.07.002. |


