
A closer look at the Semantic Web journal’s review process
1.Introduction
The Semantic Web journal adheres to a non-standard review process which is open and transparent. Submitted papers, after a light editorial review, get posted online for public access as soon as they enter the review process. The handling editor, whose name is visible on the paper’s page, then solicits reviewers. In addition, any researcher can provide an unsolicited review via the journal website. The name of an unsolicited reviewer is always known. Solicited reviewers (and in almost all cases we expect a paper to have at least three solicited reviews) are by default also non-anonymous, however the reviewers can opt for anonymity using a check-box.
When an editorial decision about the submission is made, all reviews get posted online on the paper’s page, with names of all reviewers shown who have not opted for anonymity. Accepted papers get printed with information about the handling editor(s), the number of solicited and unsolicited reviewers, and names of all those reviewers who have not opted for anonymity. All previous PDF versions, decisions, and so forth remain Web-available. Rejected papers can be depublished on author request after a certain period.
More details about the process, rationales, and experiences can be found in [3,5]. The Semantic Web journal is in the meantime, arguably, the most prominent journal in its field [1,2], thus providing empirical evidence that an open and transparent review process can be installed without jeopardizing quality.
In this editorial, we look at data about our review process, and in particular about the open and transparent aspect of it. Much of this data is public, of course, as explained above, and can be inspected via the journal’s website and SPARQL endpoint. However some meaningful data can only be cumulated by taking non-public information, e.g., reviewer identity for reviewers who wanted to remain anonymous, into account. Here we provide this cumulative data, and some statistics and figures – plus our own interpretation of some of the data. Looking at the data was very insightful for us, as we will discuss, and we hope that our readers will also find it interesting. Our data goes back as far as 2013, for which we have a complete year – earlier data is not available in a form in which we could compare it with newer data, as we changed to a different review management system in late 2012 [4]. The data we took into account runs until September 2018.11
2.Submission numbers and acceptance rate
We often get asked about the acceptance rate of the journal – in particular before it had an impact factor – presumably because it was taken as a proxy for quality. We didn’t even have an answer in the past, mainly because we believe that acceptance rate is a very unreliable measure for quality, both for journals and for conferences.
In our experience (as authors, reviewers, and editors or program chairs), authors often try to assess the quality of their contributions prior to submission, in order to decide to how prestigious an outlet the paper should be submitted. And indeed it is not uncommon to find, for example, two conferenced in the same field with similar acceptance rates (often at about 25%) which are viewed as significantly different in quality by the community, an assessment which can then sometimes also be confirmed by applying other quality measures, e.g., based on citation counts. In other words, outlets perceived as being of higher quality, or more selective, are expected to receive higher quality submissions in the first place, which explains overall higher quality of accepted papers despite similar acceptance rates.
For the Semantic Web journal and its non-standard review process, there is another important factor to be taken into account: Since submissions are put online for the public, it is reasonable to assume that authors would be more reluctant to submit papers which are likely (but not certain) to be rejected. We would also expect to get fewer papers which are clearly sub-standard for the journal.22
Table 1 shows, for each year since 2013, submission numbers and the acceptance rate for each year. For the acceptance rate in Table 1, we counted only the papers with “Accept” final decisions as accepted, i.e., after potentially several rounds of revisions, and all others as rejected. Note, however, that we also count editorials as accepted which are not peer-reviewed; we usually have about 4–6 editorials each year. We see that our acceptance rate fluctuates. Note that we are not monitoring our acceptance rate for the sake of achieving a certain number. We do calibrate acceptance decisions across all editors and guest editors, so that we maintain an even standard for the journal, but acceptance rate does not factor into our decisions.
A look at the “raw” data for the acceptance rate is given in Table 2, which lists for each submission what its eventual fate was. We first need to explain what we mean by “Year:” In the 2014 row, for example, are all papers listed whose first (original) submission was made in 2014. It is possible, that revised versions of such papers were submitted a year later, however the paper is still fully counted for 2014. We apply the same counting principle throughout this paper.
Table 1
Submission numbers for each year, counting only first-round submissions (i.e., no revisions). The acceptance rate shows how many of the submissions were eventually (i.e., possibly after revisions) accepted for publication
| Year | Submissions | Acceptance rate |
| 2013 | 80 | 55% |
| 2014 | 139 | 39% |
| 2015 | 101 | 48% |
| 2016 | 96 | 27% |
| 2017 | 126 | 34% |
Table 2
“Final fates” of submitted papers. See the main text for further explanations
| Year | Decision | n | n% |
| 2012 | Reject | 4 | 21% |
| Reject (Pre-Screening) | 2 | 11% | |
| Reject and Resubmit | 1 | 5% | |
| Accept | 12 | 63% | |
| 2013 | Reject | 25 | 31% |
| Reject (Pre-Screening) | 2 | 3% | |
| Reject and Resubmit | 3 | 4% | |
| Major Revision | 5 | 6% | |
| Minor Revision | 1 | 1% | |
| Accept | 44 | 55% | |
| 2014 | Reject | 30 | 22% |
| Reject (Pre-Screening) | 4 | 3% | |
| EKAW reject | 29 | 21% | |
| Major Revision | 12 | 9% | |
| Minor Revision | 1 | 1% | |
| EKAW conference only accept | 9 | 6% | |
| Accept | 54 | 39% | |
| 2015 | Reject | 31 | 31% |
| Reject (Pre-Screening) | 12 | 12% | |
| Major Revision | 9 | 9% | |
| Minor revision | 1 | 1% | |
| Accept | 48 | 48% | |
| 2016 | Reject | 28 | 29% |
| Reject (Pre-Screening) | 30 | 31% | |
| Reject (Two Strikes) | 8 | 8% | |
| Major Revision | 3 | 3% | |
| Minor Revision | 1 | 1% | |
| Accept | 26 | 27% | |
| 2017 | Reject | 39 | 31% |
| Reject (Pre-Screening) | 28 | 22% | |
| Reject (Two Strikes) | 7 | 6% | |
| Major Revision | 7 | 6% | |
| Minor Revision | 1 | 1% | |
| None | 1 | 1% | |
| Accept | 43 | 34% | |
| 2018 | Reject | 7 | 9% |
| Reject (Pre-Screening) | 13 | 17% | |
| Major Revision | 11 | 14% | |
| Minor Revision | 1 | 1% | |
| None | 39 | 50% | |
| Accept | 7 | 9% |
So, of the papers whose first-round submission happened in the year 2015, we had 48 submissions eventually accepted (i.e., possibly after revisions), while 9 papers eventually received a “Major Revision” decision but we never received a revision. Note that the 2012 data covers only part of that year. The same holds for 2018. Reject (Pre-Screening) refers to papers which have received an editorial reject right after submission through an assessment by the editors that the submission is clearly of too low quality for the journal. The “Reject and Resubmit” category was deprecated in 2013. In 2014, we ran a combined journal/conference review for the EKAW conference, i.e., with a somewhat different process, which is why they are listed separately. Reject (Two Strikes) is a decision category based on our two-strike rule, which states that if a manuscript first receives a “Major Revision”, and then subsequently would receive a “Major Revision” again, it is automatically rejected. This was introduced March 1, 2013, and applied only to papers whose original submission was received after that date. The “None” decisions listed indicate papers (or their revisions) which are still under review.
Table 2 shows that pre-screen rejects have gone up significantly since 2015, despite similar submission numbers. And some “Major Revision” papers never get resubmitted, which is not unexpected, as some revision requests by the reviewers ask for very substantial modifications.
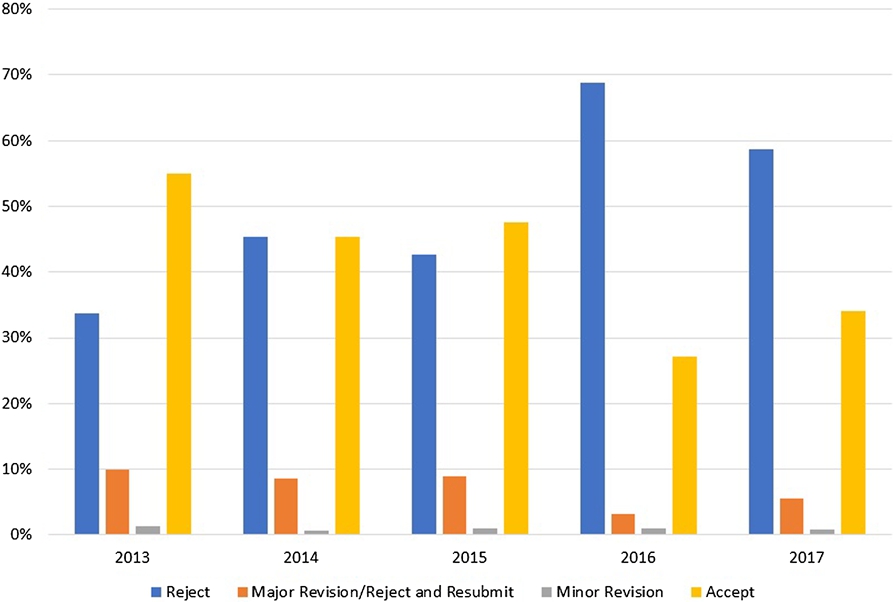
Figure 1 displays how the decision categories have developed over the years; in this case, we have accumulated the data from Table 2, by grouping “Reject and Resubmit” with “Major Revision,” and the different reject categories.
Table 3
Number of revisions each paper goes through before meeting its “final fate”
| Year | Revisions | Papers | n% |
| 2012 | 0 | 8 | 42% |
| 1 | 4 | 21% | |
| 2 | 4 | 21% | |
| 3 | 3 | 16% | |
| 2013 | 0 | 34 | 43% |
| 1 | 33 | 41% | |
| 2 | 10 | 13% | |
| 3 | 3 | 4% | |
| 2014 | 0 | 85 | 61% |
| 1 | 20 | 14% | |
| 2 | 25 | 18% | |
| 3 | 8 | 6% | |
| 4 | 1 | 1% | |
| 2015 | 0 | 50 | 50% |
| 1 | 27 | 27% | |
| 2 | 22 | 22% | |
| 3 | 1 | 1% | |
| 4 | 1 | 1% | |
| 2016 | 0 | 67 | 70% |
| 1 | 16 | 17% | |
| 2 | 10 | 10% | |
| 3 | 3 | 3% | |
| 2017 | 0 | 76 | 60% |
| 1 | 29 | 23% | |
| 2 | 19 | 15% | |
| 3 | 2 | 2% | |
| 2018 | 0 | 68 | 87% |
| 1 | 8 | 10% | |
| 2 | 2 | 3% |
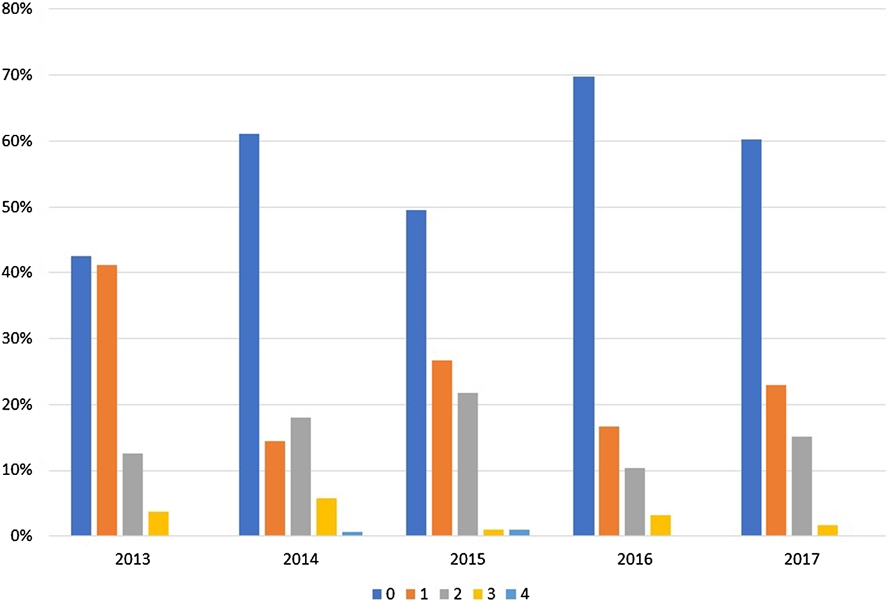
We also looked at the number of revisions a paper had before meeting its eventual fate. The data can be found in Table 3 and Fig. 2. Note that, because of the two-strike rule, in almost all cases since 2016 a manuscript in second revisions has received a “Minor Revision” previously, which in turn means that almost all of these papers are eventually accepted. We can also see from this data and the numbers from Table 2, that about half the papers (since the two-strike rule took effect) which are eventually accepted, need at least 2 revisions. In fact, it is rather rare that we receive a manuscript with can be accepted in the first round without revisions. Of the papers which advance into a second round of reviewing, a majority gets eventually accepted.
One may wonder at the rather high rate of submissions which never received a revision. Note, for example, that this includes accepted editorials, pre-screen rejects, outright rejects in the first round and first-round major revision decisions where the authors decide not to submit a revision. E.g., for the 2016 papers not receiving a revision, the breakdown is that these include 28 pre-screen rejects, 28 regular first-round rejects, 3 major revisions which did not receive a revision, and 7 accepts which were all editorials.
The mean review time over all revisions is 78 days. The median is 61 days. The standard deviation is 54 days. We feel that this needs improvement, but we also acknowledge that reviewing and being a handling editor is volunteer work and that carefully reviewing papers and proofs takes time.
3.Reviews and transparency
We had a total of 830 reviewers for the journal since late 2012, providing a total of 809 anonymous reviews and 1,344 non-anonymous reviews. This means that we have an average of 2.6 reviews per reviewer, and that 62% of our reviews are non-anonymous. Of the 830 reviewers, 389 reviewers always provide non-anonymous reviews, while 294 always provide anonymous ones. 147 reviewers sometimes provide anonymous, and sometimes provide non-anonymous reviews. This means that 47% of reviewers always provide non-anonymous reviews, 35% of reviewers always provide anonymous ones, and 18% are sometimes anonymous and sometimes not. The latter – switching – reviewers, however, tended to provide more non-anonymous than anonymous reviews: 40% of these 147 provided more non-anonymous than anonymous reviews, while only 25% of these 147 provided more anonymous than non-anonymous reviews.
Table 4
Reviews since late 2012, anonymous versus non-anonymous
| Year | Anon. | Non-anon. | Total | % Non-anon. |
| 2012 | 0 | 3 | 3 | 100% |
| 2013 | 50 | 206 | 256 | 80% |
| 2014 | 212 | 196 | 408 | 48% |
| 2015 | 116 | 308 | 424 | 73% |
| 2016 | 131 | 252 | 383 | 66% |
| 2017 | 170 | 219 | 389 | 56% |
| 2018 | 130 | 160 | 290 | 55% |
| Total | 809 | 1344 |
Over the years, the numbers changed somewhat, as can be seen from Table 4 and Fig. 3: We see that the percentage of non-anonymous reviews was rising slightly in recent years, in particular if we note that the higher number of non-anonymous reviews in 2014 was due to the mentioned EKAW papers which were all reviewed anonymously.
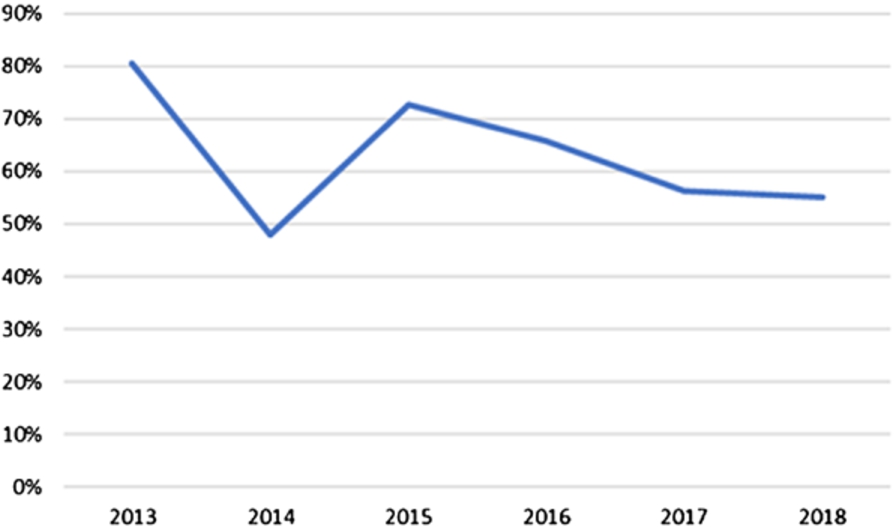
Table 5
How many reviews does each reviewer contribute? E.g., in 2015, 159 reviewers contributed exactly one review each, and 61 reviewers contributed exactly two reviews each
| Year | # Reviews | # Reviewers | n% |
| 2012 | 1 | 1 | 50% |
| 2 | 1 | 50% | |
| 2013 | 1 | 76 | 55% |
| 2 | 40 | 29% | |
| 3 | 4 | 3% | |
| 4 | 7 | 5% | |
| 5 | 5 | 4% | |
| 6 | 4 | 3% | |
| 11 | 1 | 1% | |
| 2014 | 1 | 145 | 58% |
| 2 | 73 | 29% | |
| 3 | 14 | 6% | |
| 4 | 9 | 4% | |
| 5 | 3 | 1% | |
| 6 | 4 | 2% | |
| 2015 | 1 | 159 | 63% |
| 2 | 61 | 24% | |
| 3 | 16 | 6% | |
| 4 | 8 | 3% | |
| 5 | 2 | 1% | |
| 6 | 3 | 1% | |
| 7 | 1 | 0% | |
| 8 | 1 | 0% | |
| 9 | 1 | 0% | |
| 11 | 1 | 0% | |
| 2016 | 1 | 150 | 62% |
| 2 | 61 | 25% | |
| 3 | 25 | 10% | |
| 4 | 2 | 1% | |
| 5 | 1 | 0% | |
| 6 | 1 | 0% | |
| 7 | 1 | 0% | |
| 10 | 1 | 0% | |
| 2017 | 1 | 161 | 63% |
| 2 | 73 | 29% | |
| 3 | 14 | 5% | |
| 4 | 5 | 2% | |
| 5 | 2 | 1% | |
| 10 | 1 | 0% | |
| 2018 | 1 | 167 | 76% |
| 2 | 41 | 19% | |
| 3 | 11 | 5% | |
| 4 | 2 | 1% |
We wanted to get a better understanding of this trend, and tried to find indications towards the cause of this in the data. Table 5 and Fig. 4 shows how many reviews were written by each reviewer, by year. We notice that there is a small trend towards having more reviewers who review exactly once per year for the journal. This may be explainable by the rising visibility, popularity, and community quality assessment of the journal – e.g., the journal did not receive an impact factor before 2016.
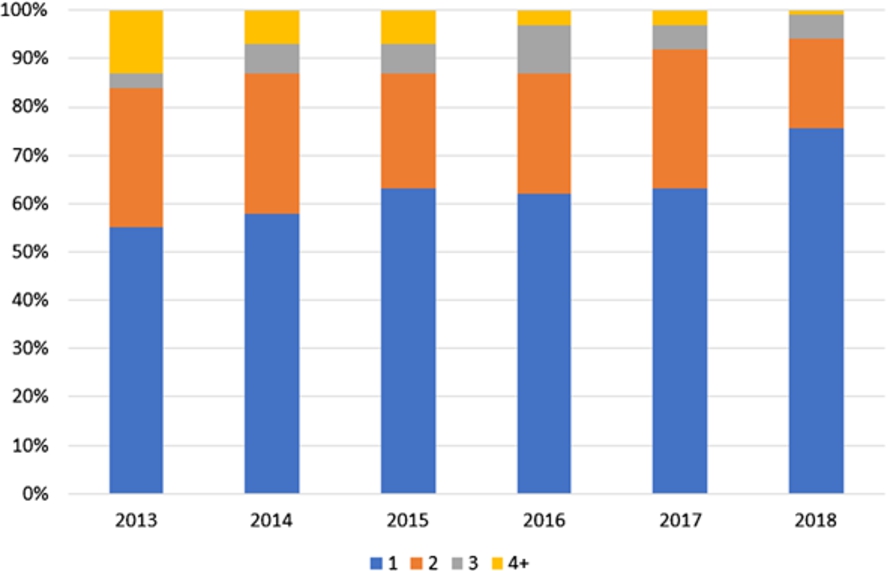
Table 6
Anonymity choice is dependent on how many reviews are contributed by each reviewer. We distinguish three types of reviewers: “Non-anonymous” always provided anonymous reviews; “Anonymous” always provided anonymous reviews, “Mixed” provided some anonymous and some non-anonymous reviews. E.g., for the 247 reviewers contributing exactly two reviews, 47.0% opted always for non-anonymity, 35.2% opted always for anonymity, and 17.8% provided a mix of anonymous and non-anonymous reviews. The last column takes a closer look at the “Mixed” reviewers, indicating the percentage of their reviews that were non-anonymous
| # Reviews | Non-anonymous | Anonymous | Mixed | # Reviewers | % Non-anonymous reviews of mixed reviewers |
| 1 | 52.9% | 47.1% | 0% | 340 | N/A |
| 2 | 47.0% | 35.2% | 17.8% | 247 | 50.0% |
| 3 | 46.0% | 25.3% | 28.7% | 87 | 47% |
| 4 | 38.6% | 18.2% | 43.2% | 44 | 49% |
| 5 | 35.1% | 29.7% | 35.1% | 37 | 55% |
| 6 | 33.3% | 19.1% | 47.6% | 21 | 52% |
| 7 | 33.3% | 0% | 66.7% | 12 | 59% |
| 8 | 38.5% | 7.7% | 53.9% | 13 | 59% |
| 9 | 20.0% | 0% | 80.0% | 5 | 67% |
| 10 | 33.3% | 33.3% | 33.3% | 3 | 90% |
| 11 | 28.6% | 0% | 71.4% | 7 | 73% |
| 12 | 25.0% | 0% | 75.0% | 4 | 78% |
| 13 | 0% | 0% | 100% | 3 | 85% |
| 15 | 50.0% | 0% | 50.0% | 2 | 87% |
| 16 | 0% | 0% | 100% | 1 | 81% |
| 20 | 0% | 0% | 100% | 1 | 95% |
| 22 | 0% | 0% | 100% | 1 | 86% |
| 27 | 0% | 0% | 100% | 1 | 93% |
| 29 | 100% | 0% | 0% | 1 | 100% |
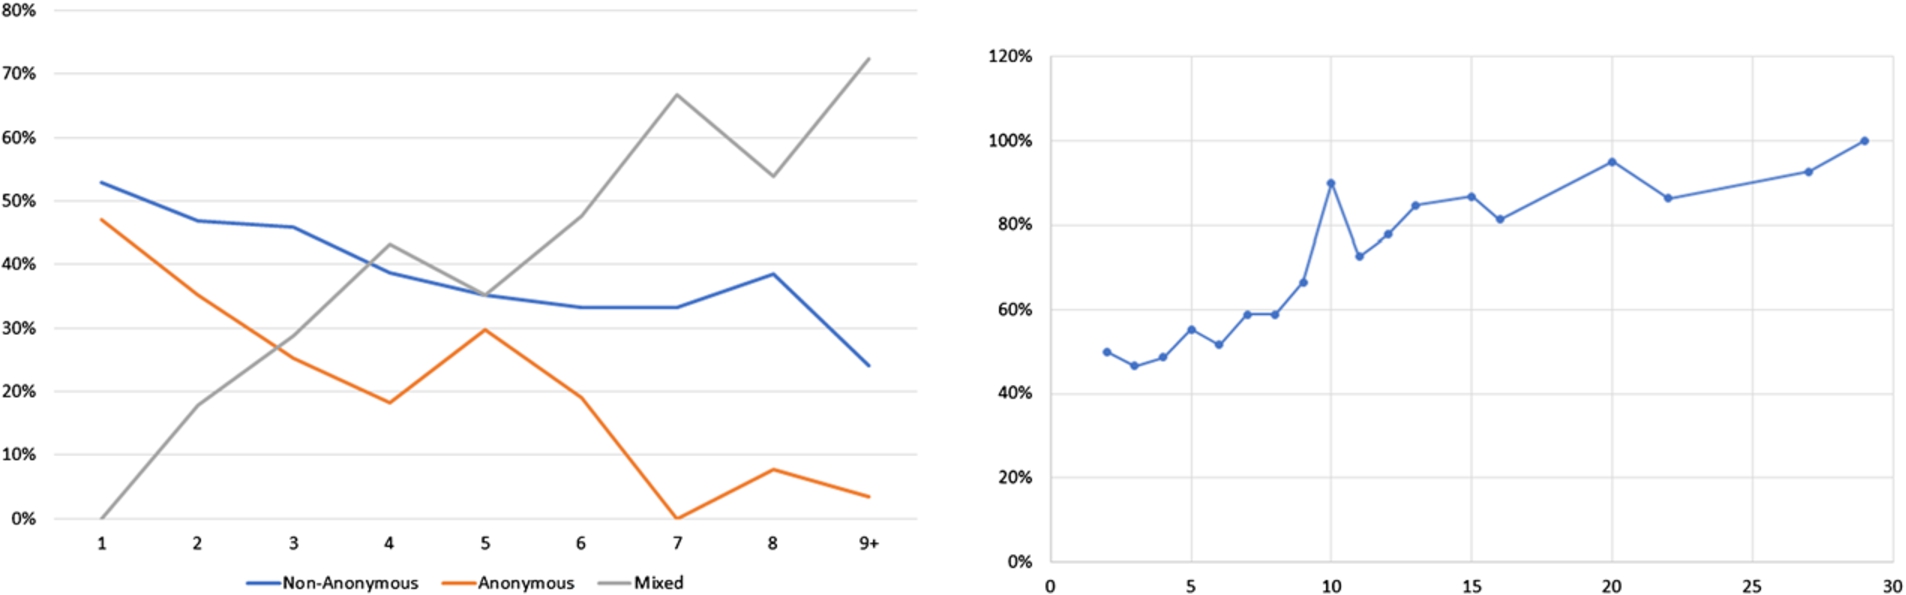
It is now conceivable, that regular reviewers for the journal, i.e., those which are reviewing often, are more likely to provide non-anonymous reviews. The corresponding data is shown in Table 6 and Fig. 5, and it indeed confirms this hypothesis: Among reviewers providing only one review, only slightly more than half are non-anonymous. With increasing number of reviews, though, it becomes much more likely that a reviewer will always provide anonymous reviews, versus always providing non-anonymous reviews. The last column in Table 6, as chart displayed on the right in Fig. 5, shows that among reviewers who sometimes, but not always, remain anonymous, the likelihood of providing a non-anonymous review rises with the number of reviews a reviewer contributed.
Fig. 5.
Anonymity choice dependent on how many reviews a reviewer contributed. Data from Table 6. The left chart shows reviewer types, categorized in those who always contribute non-anonymous reviews, those who always contribute anonymous reviews, and those who are sometimes anonymous and sometimes not (indicated as “Mixed”. The horizontal axis gives the number of reviews contributed by each of these reviewers, the vertical the percentage of the respective reviewer category. The right chart shows the percentage of non-anonymous reviews provided by the “Mixed” reviewers; the horizontal axis gives the number of reviews contributed per reviewer.
Of course, we can only speculate regarding the reasons for this. It may be that reviewers who are fond of the Semantic Web journal’s open and transparent review process are more likely to contribute reviews. But it may also be that reviewers who review regularly for the journal become more familiar with the format and become to understand through this that signing the review brings more benefits than harm. Finally, the Semantic Web journal runs several special issues per year. Topic-wise, these special issues are often at the intersection of the Semantic Web and other domains. The reviewers invited to such issues are usually not familiar with our review process and may opt for anonymity. This is in line with the number of reviewers that only provide one review or very few reviews.
Table 7
Anonymity choice versus suggested decision. EKAW papers were excluded, as all reviews were anonymous
| Suggestion | Non-anon. | Anon. | % Non-anon. |
| Reject | 165 | 160 | 51% |
| Major Revision | 391 | 225 | 63% |
| Minor Revision | 445 | 141 | 76% |
| Accept | 342 | 144 | 70% |
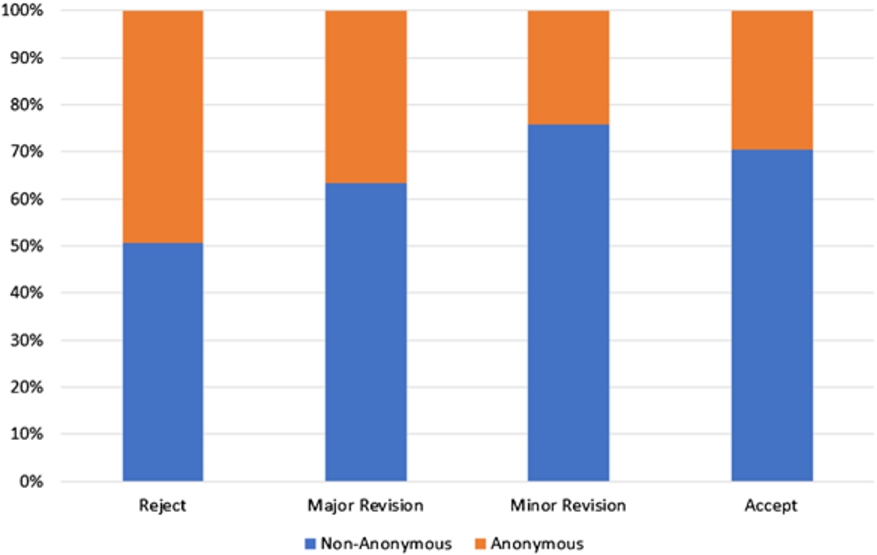
The data in Table 7 and Fig. 6 finally gives a look at decision categories suggested by a review, and the anonymity choice of the corresponding reviewer. We see that almost half of the reviewers giving a “Reject” opt for anonymity, while less than a third of those giving an “Accept” do. This is of course not a surprising result. It is reasonable to assume that reviewers sometimes seek anonymity in order to prevent negative repercussions by paper authors. However, this applies naturally more often to cases where the review is negative.
4.Conclusions
Let us recall some of the key insights we can gain from the data we presented.
– Submission numbers seem to have plateaued in recent years (Table 2).
– The relatively high acceptance rate of the Semantic Web journal (Table 1) is compatible with the fact that the journal has a high impact factor compared to other journals in its field.
– The percentage of non-anonymous reviews has recently dropped somewhat, and currently lies at about 55%, while in the past it was significantly higher.
– Reviewers whe review frequently for the journal are much less likely to opt for anonymity.
– Negative reviews are more likely to be anonymous.
We will continue to watch and analyze the developments. In particular, it would be interesting to investigate the exact reasons why a reviewer opts for anonymity. Finally, we hope that other journals would be more willing to share their statistics as well.
Notes
1 Some data may be slightly off since we may have some persons listed under two different accounts in our system; however we generally curate our accounts well, so that this should not significantly distort our analysis.
2 We do get such papers, and we reject them via an editorial pre-check. We assume that we get fewer such papers than other journals, but we simply do not have comparison data as other journals in our field do not share their data.
References
[1] | P. Hitzler, http://www.semantic-web-journal.net/blog/journal-impact-factors-2018, 10 July 2018. Retrieved 6 December 2018. |
[2] | P. Hitzler, http://www.semantic-web-journal.net/blog/2018-google-scholar-ranking, 4 August 2018. Retrieved 6 December 2018. |
[3] | P. Hitzler and K. Janowicz, The Semantic Web journal review process: Transparent and open, Science 2.0, IEEE Computer Society Special Technical Community on Social Networking E-Letter 3: (1) ((2015) ). |
[4] | P. Hitzler, K. Janowicz and K. Sengupta, The new manuscript review system for the Semantic Web journal, Semantic Web 4: (2) ((2013) ), 117. doi:10.3233/SW-130095. |
[5] | K. Janowicz and P. Hitzler, Open and transparent: The review process of the Semantic Web journal, Learned Publishing 25: (1) ((2012) ), 48–55. doi:10.1087/20120107. |


