
Intake of dark green vegetables may benefit specific cognitive domains in US men and women aged 60 years or older
Abstract
BACKGROUND:
The prevalence and relationship between dark green vegetables (DGV) and specific cognitive domains in the aging US population are not well-established for men and women.
OBJECTIVE:
To explore the associations between DGV, its bioactive nutrients, and cognitive function, including its specific domains, and whether they differ by sex
METHODS:
The study analyzed a cross-sectional sample of 2,793 US adults aged 60 or older from the 2011–2014 NHANES. DGV was dichotomized, and bioactive nutrients were divided into quartiles. Weighted linear regressions were used to analyze the association between DGV, bioactive nutrients, and standardized cognitive function scores, including specific domains (CERAD, DWR, AFT, DSST), while controlling for covariates. The study also tested for sex-based effect modification
RESULTS:
Overall, 61.7% of participants reported no DGV intake, and men reported no DGV intake more frequently than women (67.8 vs.56.5%, p < 0.001). DGV was associated with overall cognitive function(β= 0.10, p = 0.024) and by its specific domains: memory-related i.e., learning and remembering (CERAD:β= 0.10, p = 0.015; DWR:β= 0.10, p = 0.010), marginally associated with executive function (AFT:β= 0.10, p = 0.075), but not with problem-solving(DSST:β= 0.03, p = 0.587). Although the associations between bioactive nutrients and specific cognitive domains were mixed, a higher intake of these nutrients was still linked to higher overall cognitive function. Only β-carotene and its associations with overall cognitive and AFT were modified by sex.
CONCLUSION:
The majority of US older adults (>60%) lack DGV in their diet. Intake of DGV, which is rich in phylloquinone, β-carotene, and α-tocopherol, may benefit certain domains of cognition in men and women, such as learning and memory
1Introduction
Cognitive impairment hinders an individual’s ability to learn, remember, appropriate use of stored information, and solve problems - all of which are vital cognitive skills for healthy and successful aging [1]. Alzheimer’s disease and dementia are types of cognitive impairment, which affects around 6.7 million Americans. The costs of healthcare and long-term care for those with Alzheimer’s or other forms of dementia are significant and estimated at $345 billion annually in the US, not including the value of informal caregiving [2]. With an aging US population, the prevalence and economic burden of cognitive impairment and dementia are expected to increase. Identifying risk factors that can be modified to prevent or delay the onset of cognitive decline could be an effective strategy for reducing the burden of this rising issue.
An increasing body of evidence suggests that dietary modifications may help alleviate age-related cognitive decline [3–8]. Plant-based diets, in particular those rich in fruits and vegetables, have been associated with improved cognitive performance and a reduced risk of age-related dementia [3–6]. Certain phytochemicals found in plants have been shown to affect neuroplasticity, brain function, and cognitive processes in both healthy and diseased brains [4–6]. Although older adults in the US generally consume enough fruits and vegetables according to the Healthy Eating Index (HEI), their consumption of dark green and orange vegetables remains very low, highlighting the need for further investigation into their potential relationship with cognitive impairment [9].
Dark green vegetables (DGV), especially leafy greens, have been recognized as an important dietary component for maintaining good cognitive function and reducing the risk of age-related cognitive decline in some studies [7, 8]. However, the specific cognitive domains influenced by DGV have not yet been identified [6]. Previous research suggests that different dietary patterns and foods may have domain-specific effects on cognition [6], but more of research is needed to explore the specific effects of DGV. Phylloquinone (vitamin K1) is the nutrient most commonly associated with the prevention of cognitive decline and is found in DGV [8, 10–13]. DGV also contain other bioactive nutrients, such as β-carotene and α-tocopherol, but their association with cognitive function is less clear [14–17].
The relationship between DGV and specific cognitive domains in the aging US population is not well-understood. Additionally, research suggests sex differences in cognitive decline [18] that could be affected by diet and food. Therefore, this study aimed to address these knowledge gaps by investigating the association between DGV and cognitive function in a representative sample of US older adults, and to examine whether this association varies by sex. The study also explored the association of bioactive nutrients found in DGV, such as phylloquinone, β-carotene, and α-tocopherol, with cognitive function.
2Materials and methods
2.1Study population and sample
The data utilized was from the U.S. National Health and Nutrition Examination Surveys (NHANES), which were conducted by the National Center for Health Statistics (NCHS) at the Centers for Disease Control and Prevention (CDC) [19]. NHANES is a cross-sectional study employing a stratified multistage probability design. Data on the health and nutritional status of the non-institutionalized U.S. population are collected through a series of interviews, examinations, and laboratory measurements. The NCHS Research Ethics Review Board provided the following protocol approval numbers for the presented survey years: Continuation of Protocol #2011-17 (NHANES 2011–2012) and Protocol #2011-17 (NHANES 2013–2014) [20]. The present study combined two-cycle data from NHANES (2011–2012 and 2013–2014). Only participants aged 60 and over were eligible to participate in the cognitive assessment, and this included a total of 3,632 participants. Of these, participants with incomplete cognitive function screener questionnaire (n = 484), incompletion or unreliable of 24-hr recall (n = 275), and incomplete covariates (n = 80) were omitted. The missing values for two covariates, poverty income ratio (PIR) and elevated cholesterol (n = 214 and n = 138, respectively), were omitted when they were included in the final multivariable analysis model.
2.2Dietary Assessments
We used dietary data from two 24-hour dietary recall interviews. The NHANES employed the Automated Multiple Pass Method (AMPM), which is designed to provide an efficient and accurate means of collecting intakes for large-scale national surveys [21]. The AMPM uses a five-step interview: (1) quick list of all foods and beverages consumed the day before the interview (midnight to midnight); (2) list of consumption of foods commonly forgotten; (3) time and eating occasion of each reported food; (4) a detailed description, amount eaten, and additions to the food; (5) other foods not remembered. Based on the NHANES for reliable dietary data, only those participants are analyzed who completed the first four steps of the AMPM and had all consumed food/beverages identified [22]. The first interview was conducted in-person at the Mobile Examination Center by trained interviewers. The second interview was conducted over the telephone three to 10 days later. The response rate in both cycles ranged between 87% and 89%, which provided reliable dietary data for both interviews [23].
2.3Intake of dark green vegetables and associated bioactive nutrients
The intake of dark green vegetables (DGV) was identified according to the Food Patterns Equivalents Database (FPED) 2011-14, which was developed by the United States Department of Agriculture (USDA), Agricultural Research Service (ARS), Food Surveys Research Group (FSRG). The FPED converts foods from the Food and Nutrient Database for Dietary Studies (FNDDS) to the respective number of cups equivalents. Based on the FPED, we used their final DGV component (variable name: v_drkgr) which includes the sum of all DGV such as: arugula, basil, broccoli, Chinese cabbage, chard, cilantro, collards, cress, dandelion greens, endive, escarole greens, kale, lettuce, mustard cabbage/greens, parsley, poke greens, spinach, turnip greens, watercress and more [24]. The final DGV intake of each participant was calculated using two 24-hr dietary interviews, and the mean DGV intake in cups per day was obtained. Based on the distribution of DGV intake, where the majority (>60%) of participants did not report any DGV intake, we divided the intake into two categories: yes (DGV > 0) and no (DGV = 0). In addition, for each participant, the mean intake of dietary and nutritional supplements of DGV nutritional bioactive (phylloquinone, β-carotene, and α-tocopherol) was calculated from the two 24-hr dietary recalls, and the mean intake for each bioactive was divided into quartiles (Q1-Q4).
2.4Cognitive Function Assessments
Details of the cognitive function assessments have been described previously [25]. Briefly, four cognitive function tests were administered to study participants: (1) The Consortium to Establish a Registry for Alzheimer’s disease (CERAD), which measures participants’ ability to learn and remember new information, consisting of three consecutive learning trials. In each trial, participants are presented with a list of ten unrelated words and asked to recall as many words as possible immediately after the presentation (i.e., in the short term of learning and remembering). The sum of the 3 trials is scored on a scale of 0–30. (2) Delayed word recall (DWR) test, where participants are asked to recall words from the CERAD test after a completing the other two following tests (3 and 4). The DWR score is the number of words the participant was able to remember (0–10). (3) The Animal Fluency Test (AFT), which assesses verbal fluency and executive function while using appropriately stored information by asking participants to name as many animals as possible in one minute. (4) The Digit Symbol Substitution Test (DSST), measures problem-solving abilities, including processing speed, visual-motor coordination, sustained attention, and working memory. The DSST is a component of the Wechsler Adult Intelligence Scale where its total score ranges between 0–105. Finally, the creation of an overall cognitive function standardized score, which is calculated by averaging the standardized scores of all four tests. Creation of this score helps to minimize floor and ceiling effects across cognitive function tasks in a population of older adults.
2.5Statistical analysis
All analyses followed the NHANES guidelines considering sample weight, stratification, and clustering in the complex survey design due to unequal sample selection probability in NHANES 2011–2014. This was to account for stratification and clustering. For statistical analyses, STATA 15 was employed. Responses coded as ‘do not know’, ‘refused’, or ‘missing’ in the original NHANES surveys were treated as missing values. A type I error level of 0.05 was considered significant throughout the statistical tests. Descriptive statistics (sample sizes and weighted proportions and means) were used to summarize the characteristics of the study samples with respect to the primary exposure variable (i.e., DGV). P-values were generated from the crude weighted linear regression models for each covariate. For the multivariable analysis, weighted linear regression models were conducted to examine the crude and adjusted associations between primary exposure variables e.g., DGV, phylloquinone, β-carotene, and α-tocopherol with overall and by specific cognitive function scores while adjusting for study covariates as described in Table 1. Post-hoc Wald test was conducted to test the significance of each primary exposure on each outcome e.g., overall and specific cognitive function domain. Lastly, the effect of modification by sex on the primary exposure variables was examined for each final multivariable model using the adjusted Wald chi test with a significance level of p < 0.1. The results of all final multivariable models are presented as Least-Square Means (LSMs).
Table 1
Details of variables used as covariates in the study
| Study Covariates | Description |
| Total Energy Intake (kcal/day) | Mean energy intake was calculated from the two 24-hr dietary recalls and included only participants who met the inclusion criteria based on the NHANES for reliable dietary data [26]. Participants who reported below 500 kcal or above 5000 were excluded (n = 8). |
| Healthy Eating Index (HEI)-2015 | Diet quality was calculated using the HEI. More details about the HEI are provided [27–29]. When examining DGV in the multivariable analysis, DGV component from the HEI (variable name:v_drkgr) was not included in the calculation of total HEI-2015 score |
| Sex | Men/Women |
| Age | 60–69, 70–79, 80+ (years) |
| Race/Ethnicity | Non-Hispanic (NH) Whites, Hispanics, NH Blacks, Asians/ Other Race |
| Education | <High school; High school graduate/GED or equivalent; Some college or AA degree, College graduate or above |
| The Poverty Income Ratio (PIR) | PIR was presented in percentage with a higher number indicating higher socio-economic status: < 185%, 185–350%,>350% |
| Smoking Status | Never, Former, Current |
| Alcohol | Alcohol intake in the past 12 months: 0 (none), Low (had at least 12 alcohol drinks a year but less than one drink a day), Moderate/High (had at least one drink every day) |
| Physical Activity | Meeting the world health organization recommendations of 150 min of moderate and/or 75 min of vigorous weekly physical activity or combination [30] Active/Inactive |
| Body Mass Index (BMI) (kg/m2) | CDC classification for adults [31]: < 25, 25–29, 30–34,≥35 kg/m2 |
| Chronic Diseases | Hypertension (a) mean systolic blood pressure≥130 mmHg; (b) mean diastolic blood pressure≥80 mmHg; (c) self-reported physician diagnosis [32](Yes vs. No) |
| Elevated total cholesterol [33]>240 mg/dL | |
| ‘Has a doctor told you had Diabetes? (Yes vs. No) Has a doctor told you had Cardiovascular disease (CVD)? (Yes vs. No) Has a doctor told you had Stroke? (Yes vs. No) | |
| Antithrombotic Medication use in the past 30 days | Used the Anatomical Therapeutic Chemical (ATC) classification system. All antithrombotic agents (B01A), a potent vitamin K antagonist only (B01AA), or platelet aggregation inhibitor only (B01AC). Antithrombotic drugs include antiplatelet drugs (aspirin, clopidogrel, and glycoprotein IIb/IIIa receptor antagonists) and anticoagulants (unfractionated and low molecular weight heparin, warfarin, and direct thrombin inhibitors) [34, 35]. Yes vs. No |
3Results
The overall sample included 2,793 eligible participants. The characteristics of the study participants are described in Table 2, according to their DGV intake. The average age was 69±6.6 years, 54% female, and the race/ethnicity composition was non-Hispanic Whites (79.9%), non-Hispanic Blacks (7.0%). Hispanics (8.3%) and Asians/others (4.8%). Overall, 61.7% of the study sample did not report DGV intake and among those who did, the median intake was 0.3 cup/day with interquartile range (IQR) of 0.4 cup/day. Prevalence of DGV intake did not vary across age groups: 37.0% (60–69), 39.1% (70–79), and 36.8% (80+) (p-value = 0.569)
Table 2
Study characteristics were compared by intake of dark green vegetables (DGV) in U.S. older adults aged≥60 years, using NHANES 2011–2014
| Intake of Dark Green Vegetables N(%)/Mean±SD | ||||
| Study Variables | All N(%) | No | Yes | P-value |
| 2,793 | 1,742(61.7) | 1,051(38.3) | ||
| Dark green vegetables Median[IQR] cup/day | 0[0.2] | 0[0] | 0.3[0.40] | |
| Age(years) | 0.459 | |||
| 60–69 | 1,501(56.6) | 945(56.3) | 556(57.1) | |
| 70–79 | 836(29.6) | 509(29.1) | 327(30.3) | |
| 80+ | 456(13.8) | 288(14.6) | 168(12.6) | |
| Sex | <0.001 | |||
| Men | 1,366(46.0) | 919(50.6) | 447(38.7) | |
| Women | 1,427(54.0) | 823(49.4) | 604(61.3) | |
| Race/Ethnicity | 0.007 | |||
| NH Whites | 1,345(79.9) | 855(80.1) | 490(79.7) | |
| Hispanics | 534(7.0) | 350(7.3) | 184(6.4) | |
| NH Blacks | 668(8.3) | 440(8.8) | 228(7.5) | |
| Asians/ Others | 246(4.8) | 97(3.8) | 149(6.4) | |
| Education | <0.001 | |||
| <High school | 724(15.9) | 527(19.7) | 197(9.7) | |
| High school graduate | 644(21.8) | 423(24.1) | 221(18.3) | |
| Some college degree | 785(31.7) | 470(31.9) | 315(31.6) | |
| College graduate< | 640(30.6) | 322(24.4) | 318(40.5) | |
| Poverty Income Ratio (PIR)** | <0.001 | |||
| <185% | 1,116(28.8) | 767(32.6) | 349(22.8) | |
| 185–350% | 644(26.8) | 396(27.6) | 248(25.6) | |
| >350% | 819(44.4) | 441(39.8) | 378(51.6) | |
| Smoking Status | <0.001 | |||
| Never | 1,372(49.4) | 813(47.1) | 559(53.0) | |
| Former | 1,068(39.8) | 660(39.7) | 408(40.3) | |
| Current | 351(10.8) | 268(13.3) | 83(6.7) | |
| Alcohol use in the past years | <0.001 | |||
| None | 730(21.3) | 476(23.9) | 254(17.1) | |
| Low | 916(33.0) | 589(34.6) | 327(32.1) | |
| Moderate/High | 1,147(45.7) | 677(42.5) | 470(50.8) | |
| Physical Activity | <0.001 | |||
| Inactive | 2,060(69.7) | 1,350(75.1) | 710(61.0) | |
| Active | 733(30.3) | 392(24.9) | 241(31.0) | |
| BMI (kg/m2) | 29.2±6.3 | 29.7±6.4 | 28.3±6.1 | 0.002 |
| Energy Intake (kcal/day) | 1877±893 | 1858±684 | 1909±639 | 0.233 |
| Healthy Eating Index (HEI)* | 56.7±12.5 | 54.7±12.4 | 60.0±12.0 | <0.001 |
| Chronic Diseases | ||||
| Diabetes | 0.013 | |||
| No | 2,001(76.2) | 1,220(73.9) | 781(79.7) | |
| Yes | 792(23.8) | 522(26.1) | 270(20.3) | |
| Hypertension | 0.796 | |||
| No | 2,180(83.5) | 1,357(83.8) | 823(83.2) | |
| Yes | 500(16.5) | 318(16.3) | 182(16.8) | |
| Cardiovascular Disease | <0.001 | |||
| No | 2,516(90.3) | 1,554(88.8) | 962(92.9) | |
| Yes | 261(9.6) | 176(11.2) | 85(7.1) | |
| Stroke | 0.879 | |||
| No | 2,593(93.8) | 1,609(93.7) | 984(93.9) | |
| Yes | 196(6.2) | 131(6.3) | 65(6.1) | |
| Elevated Cholesterol** | 0.019 | |||
| No | 2,317(87.3) | 1,456(88.7) | 861(83.9) | |
| Yes | 338(12.7) | 185(11.3) | 153(16.1) | |
| Antithrombotic Medication | 0.007 | |||
| No | 2,512(90.9) | 1,558(89.3) | 954(93.4) | |
| Yes | 281(9.1) | 184(10.7) | 97(6.6) | |
*HEI does not include dark green vegetables. NH, Non-Hispanic; BMI, Body Mass Index; NHANES, National Health and Nutrition Examination Survey; IQR, interquartile range ** having missing values (PIR: n = 214; Elevated Cholesterol n = 138).
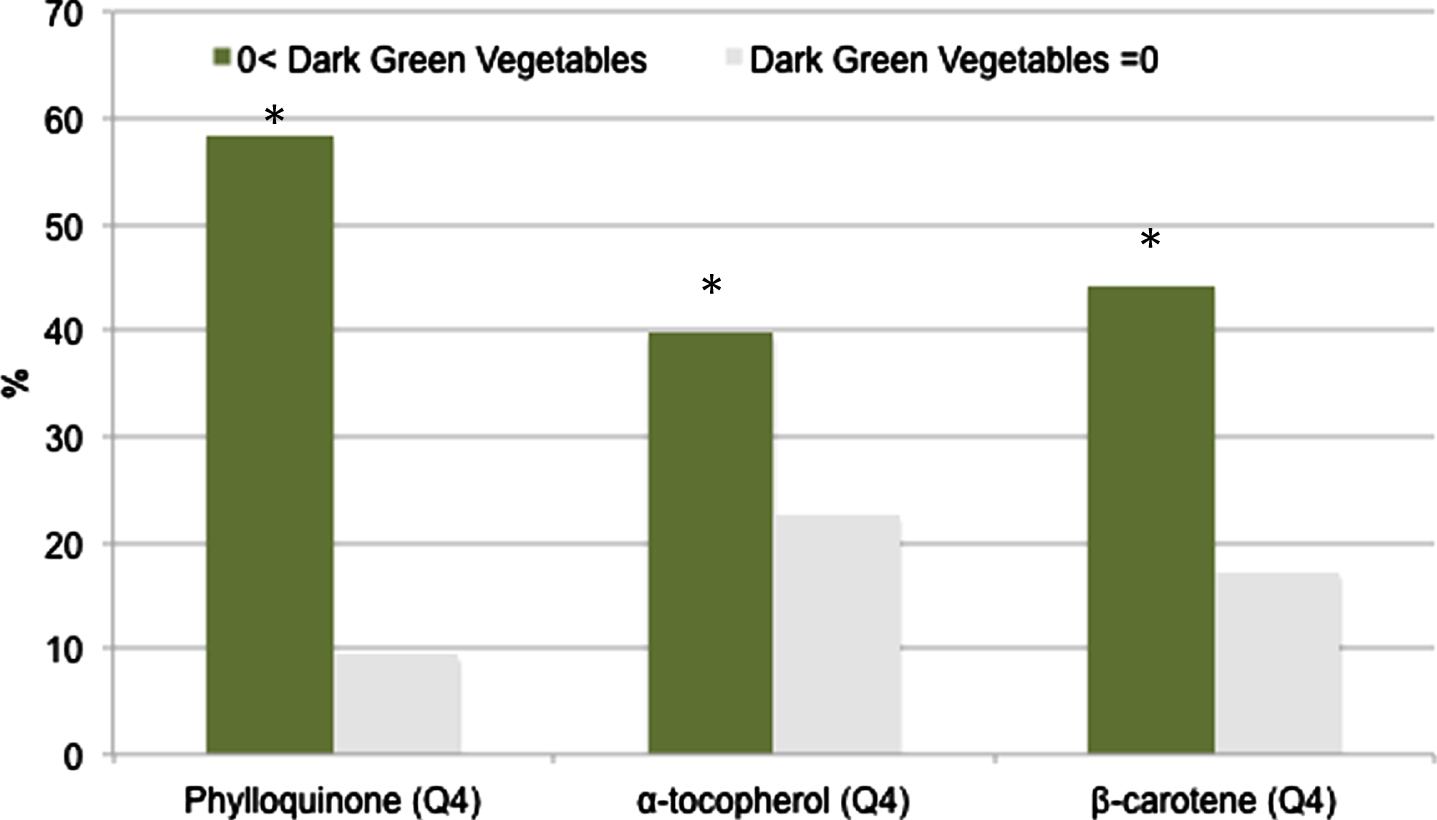
Compared to non-DGV consumers, DGV consumers (38.3%) were more likely to be women (61.3 vs. 49.4%, p < 0.001), had higher education (40.5 vs. 24.4%, p < 0.001) and income (PIR > 350%) (51.6 vs. 39.8%, p < 0.001). Those who consumed DGV also had healthier lifestyles, including less smoking (47.1 vs. 53.0%), more alcohol consumption (50.8 vs. 42.5%), more physical activity (31.0 vs. 24.9%), higher HEI (60.0±12.0 vs. 54.7±12.4), and were less likely to report chronic diseases such as diabetes (20.3 vs. 26.1%) and cardiovascular disease (7.1 vs. 11.2%). DGV consumers were also more likely to have higher intakes of phylloquinone, β-carotene, and α-tocopherol, with 58% of DGV consumers in the highest quartile of phylloquinone compared to 9% of non-DGV consumers (p-value < 0.001) (Fig. 1).
Fig. 1
Prevalence of dark green vegetable (DGV) consumers in the highest quartile(Q4) of phylloquinone, β-carotene, and α-tocopherol. *p < 0.001.
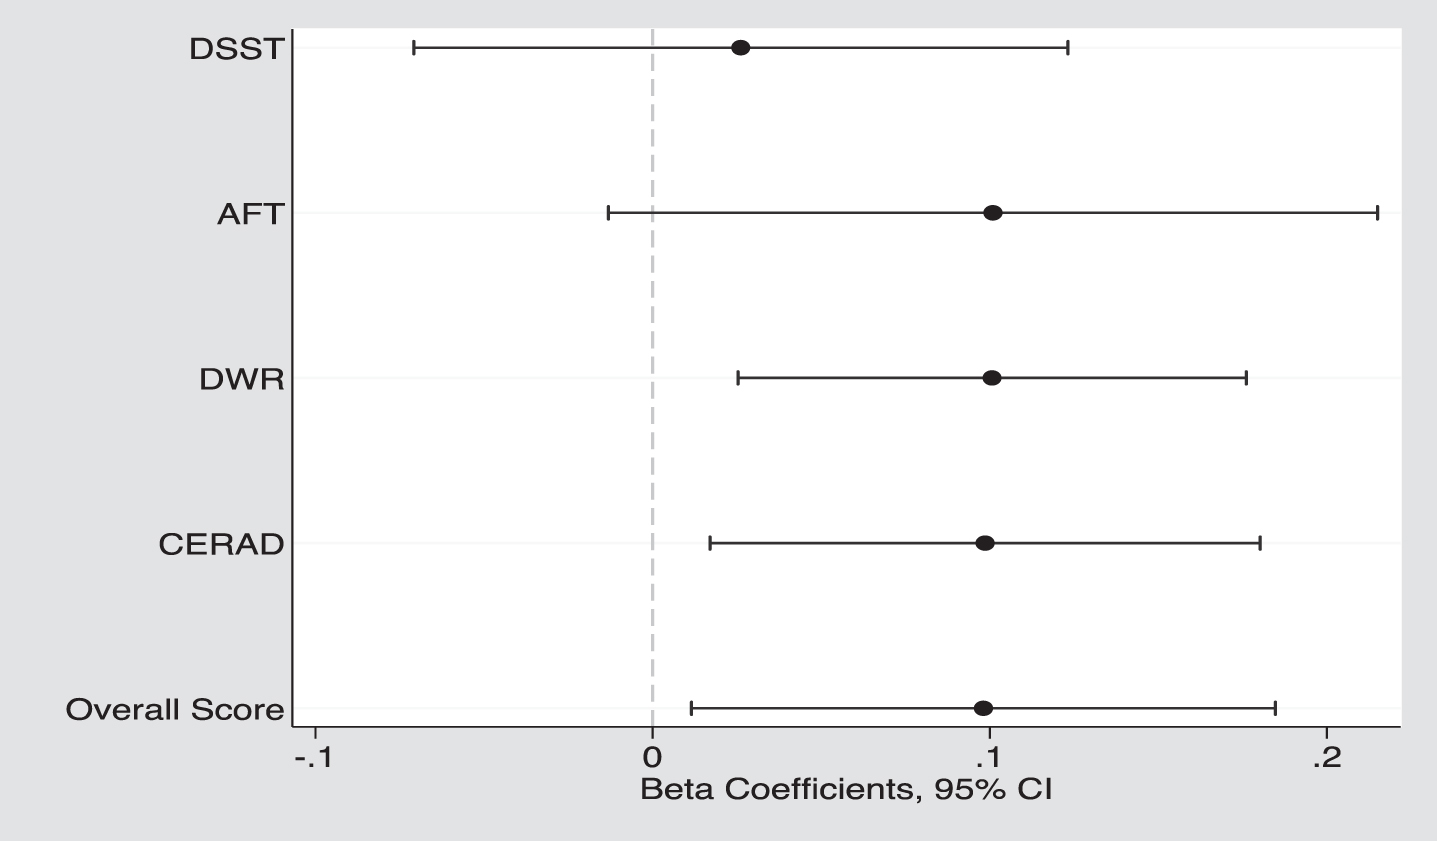
Participants who consumed DGV had higher overall cognitive function scores (–0.15±0.05 vs. –0.25±0.04, p = 0.024) and higher scores on memory tests (CERAD: 17.9 vs. 17.4, p = 0.015; DWR: 5.6 vs. 5.4, p = 0.010) and marginally significant higher score on AFT (p = 0.075), but no significant difference in DSST scores (p = 0.587) was found (Table 3, Fig. 2). Figure 2 displays the adjusted β-coefficients (95% CI) between DGV and the main standardized study outcome values ranged from β= 0.03 (DSST) up to β= 0.10 (CERAD, DWR, AFT, overall score).
Table 3
Crude and adjusted means, as well as least-square means (LSMs), were compared between the intake of dark green vegetables (DGV) and cognitive function in U.S. older adults aged≥60 years, using NHANES 2011–2014
| Word Learning (CERAD) (Range:0–30) | Delayed Word Recall (DWR) (Range:0–10) | Animal Fluency Test (AFT) (Range:0–40) | Digit Symbol Substitution Test (DSST) (Range: 0–105) | Overall Cognitive Function Standardized Score | |
| Intake of Dark Green Vegetables | |||||
| Crude Model | Means (SD) | ||||
| No | 19.2(4.5) | 6.0(2.3) | 17.6(5.5) | 51.0(16.7) | 0.19(0.94) |
| Yes | 20.4(4.7) | 6.6(2.3) | 19.2(5.9) | 56.6(16.2) | 0.57(0.94) |
| p-value* | <0.001 | <0.001 | <0.001 | <0.001 | <0.001 |
| Multivariable Model | LSMs (SE) | ||||
| No | 17.4(0.23) | 5.4(0.11) | 15.3(0.20) | 40.2(0.67) | –0.25(0.04) |
| Yes | 17.9(0.27) | 5.6(0.13) | 15.9(0.22) | 40.6(0.78) | –0.15(0.05) |
| p-value* | 0.015 | 0.010 | 0.075 | 0.587 | 0.024 |
Multivariable models were adjusted for age, sex, education, race/ethnicity, poverty income ratio, alcohol, smoking status, physical activity, energy intake, BMI, diet quality (HEI)**, diabetes, Hypertension, cardiovascular disease, stroke, elevated cholesterol, and antithrombotic medication use. **Dark green vegetable component was excluded from the HEI. Least-Square Means, LSMs. * Wald test p-value.
Fig. 2
The adjusted β coefficients (95% CIs) between dark green vegetable (DGV) and cognitive function, both standardized overall and specific domains: DSST, Digit Symbol Substitution Test; AFT, Animal Fluency Test; DWR, Delayed Word Recall, and CERAD, Word learning.
Intakes of phylloquinone, α-tocopherol, and β-carotene were associated with better overall cognitive function across all specific domains (Table 4), except for DSST that was not associated with β-carotene. For example, participants with the highest intakes of phylloquinone and α-tocopherol had a significantly higher overall cognitive function standardized score compared to those reporting the lowest intakes (phylloquinone intake Q4 vs Q1:–0.06±0.04 vs. –0.26±0.05, p≤0.001; α-tocopherol intake Q4 vs. Q1 : 0.04±0.06 vs. –0.35±0.06; p≤0.001).
Table 4
Crude and adjusted means, as well as least-square means (LSMs), were compared between the intake of bioactive nutrients such as phylloquinone, β-carotene, and α-tocopherol and cognitive function domains in U.S. older adults aged≥60 years using NHANES 2011–2014
| Word learning (CERAD) (Range:0–30) | Delayed Word Recall (DWR) (Range:0–10) | Animal Fluency Test (AFT) (Range:0–40) | Digit Symbol Substitution Test (DSST) (Range: 0–105) | Overall Cognitive Function Standardized Score | |
| Median[IQR] | |||||
| Crude Model | Means (SD) | ||||
| Phylloquinone (mcg) | |||||
| Q1 35[18] | 16.0(5.8) | 5.7(2.7) | 18.4(5.2) | 45.8(19.6) | –0.01(1.1) |
| Q2 68[18] | 17.5(5.5) | 6.1(2.2) | 19.2(4.4) | 51.7(15.9) | 0.27(0.9) |
| Q3 114[27] | 18.6(5.7) | 6.4(2.1) | 20.0(4.4) | 54.3(15.8) | 0.45(0.9) |
| Q4 223[156] | 19.8(5.3) | 6.6(2.2) | 20.6(4.5) | 57.0(14.0) | 0.65(0.8) |
| p-value* | <0.001 | <0.001 | <0.001 | <0.001 | <0.001 |
| β-carotene (mcg) | |||||
| Q1 237[225] | 18.7(5.0) | 5.8(2.5) | 16.5(5.4) | 47.5(18.3) | 0.07(1.0) |
| Q2 778[372] | 19.3(4.3) | 6.1(2.2) | 17.6(5.4) | 52.8(15.7) | 0.31(0.88) |
| Q3 1844[800] | 20.0(4.6) | 6.4(2.3) | 19.2(5.7) | 54.0(15.4) | 0.50(0.92) |
| Q4 5328[4400] | 20.4(4.5) | 6.6(2.2) | 19.0(5.7) | 55.8(15.9) | 0.55(0.90) |
| p-value* | <0.001 | <0.001 | <0.001 | <0.001 | <0.001 |
| α-tocopherol (mg) | |||||
| Q1 3.5[1.4] | 18.3(5.1) | 5.6(2.6) | 16.3(5.8) | 47.4(19.0) | 0.03(1.02) |
| Q2 5.9[1.0] | 19.5(4.9) | 6.2(2.4) | 17.5(5.7) | 51.3(16.6) | 0.30(0.95) |
| Q3 8.4[1.5] | 20.0(4.3) | 6.3(2.2) | 18.9(5.3) | 54.6(15.1) | 0.47(0.86) |
| Q4 14.0[7.4] | 20.7(3.9) | 6.8(1.9) | 19.7(5.3) | 57.2(14.0) | 0.67(0.77) |
| p-value* | <0.001 | <0.001 | <0.001 | <0.001 | <0.001 |
| Multivariable Model | LSMs (SE) | ||||
| Phylloquinone (mcg) | |||||
| Q1 35[18] | 17.5(0.29) | 5.2(0.13) | 15.3(0.29) | 38.8(0.85) | –0.26(0.05) |
| Q2 68[18] | 17.6(0.33) | 5.3(0.13) | 15.5(0.29) | 40.6(0.66) | –0.21(0.05) |
| Q3 114[27] | 18.2(0.29)a | 5.6(0.13)a | 16.2(0.26)b | 42.2(0.71)c | –0.07(0.04)b |
| Q4 223[156] | 18.3(0.24)a | 5.6(0.12)a | 16.5(0.28)c | 41.5(0.77)a | –0.06(0.04)b |
| p-value* | 0.042 | 0.005 | <0,001 | 0.005 | 0.001 |
| β-carotene (mcg) | |||||
| Q1 237[225] | 17.3(0.29) | 5.2(0.12) | 15.6(0.33) | 39.7(0.83) | –0.24(0.05) |
| Q2 778[372] | 17.4(0.24) | 5.3(0.11) | 15.5(0.26) | 41.0(0.68) | –0.21(0.04) |
| Q3 1844[800] | 18.0(0.32)a | 5.5(0.17)a | 16.5(0.32)a | 40.8(0.87) | –0.09(0.06)b |
| Q4 5328[4400] | 18.2(0.27)b | 5.6(0.13)c | 16.2(0.29) | 41.9(0.79) | –0.08(0.06)c |
| p-value* | 0.001 | 0.004 | 0.009 | 0.320 | <0.001 |
| α-tocopherol (mg) | |||||
| Q1 3.5[1.4] | 17.0(0.33) | 4.9(0.13) | 15.1(0.34) | 38.6(0.85) | –0.35(0.06) |
| Q2 5.9[1.0] | 18.0(0.32)b | 5.5(0.12)c | 15.7(0.28) | 40.0(0.76) | –0.17(0.04)c |
| Q3 8.4[1.5] | 18.2(0.30)c | 5.5(0.17)b | 16.3(0.32)b | 41.7(0.71)c | –0.09(0.05)c |
| Q4 14.0[7.4] | 18.7(0.31)c | 5.9(0.16)c | 16.6(0.27)c | 42.9(0.95)c | 0.04(0.06)c |
| p-value* | 0.002 | <0.001 | 0.002 | 0.002 | <0.001 |
Multivariable models were adjusted for age, sex, education, race/ethnicity, poverty income ratio, alcohol, smoking status, physical activity, energy intake, BMI, diet quality (HEI)**, diabetes, Hypertension, cardiovascular disease, stroke, elevated cholesterol, and antithrombotic medication use. **Dark green vegetable component was excluded from the HEI. Least-Square Means, LSMs; IQR, interquartile range. *p-value from the Post-hoc Wald test ap-value < 0.05 bp-value < 0.01 cp-value < 0.001.
Finally, the analysis showed that the relationship between DGV and cognitive function, regardless of whether the function was measured overall or through specific cognitive tests, did not differ by sex (p-value > 0.322). However, when considering the effects of individual bioactive compounds, sex did appear to modify the association between β-carotene and overall cognitive function score (p = 0.083), with women exhibiting a slightly stronger association (β= 0.07) than men (β= 0.05). Similarly, sex was found to have a potential modifying effect (p = 0.052) on the relationship between β-carotene and AFT, with men showing a stronger association (β= 0.75) than women (β= 0.12).
4Discussion
To the extent of our knowledge, this is the first study that focused on the relationship between DGV intake and overall cognitive function, including its specific domains, in a representative sample of US men and women aged 60 years or older. This study found 60% of adults 60 years and older did not report consuming dark green vegetable. It also showed that an intake of about a quarter to a third of a cup of DGV per day might improve overall cognitive function by approximately 10%. The study findings were adjusted for factors that might have an impact on cognitive function such as socio-demographics, lifestyle factors, chronic diseases, and diet quality where DGV was excluded from the HEI. Our findings are consistent with previous studies [7, 8]. For example, in a prospective analysis of the Rush MAP study that followed 960 older adults (average 81 years of age, 74% women) for 4.7 years, those in the highest vs. lowest quintiles of green leafy vegetable intake (median 1.3 servings/d) had a rate of overall cognitive impairment that was equivalent to being 11 years younger in age [7]. In a community-based cross-sectional study of 525 adults aged≥55 years old in Shanghai, those who consumed green vegetables every day had a significantly lower risk of mild overall cognitive impairment compared with those who did not [8].
Furthermore, as part of this study objective, specific domains of cognitive function were further investigated, and different relationships with DGV were found. This might reflect distinct effects of DGV on specific areas of cognitive function such that DGV have a stronger association with memory (i.e., in the short term of learning and remembering) as opposed to problem-solving. Thus, this study highlights the importance of assessing multiple cognitive domains in future studies on cognition to further understand DGV effect [6].
Based on the current literature, some of the mechanisms of DGV can be explained by the fact that they are packed with bioactive nutrients that have neuroprotective and anti-inflammatory effects linked to better brain health [36]. The current study showed that individual bioactive nutrients, such as phylloquinone, β-carotene, and α-tocopherol, were similarly associated with cognitive performance, indicating that the overall cognitive benefit of DGV is not isolated to a single micronutrient. DGV could have a beneficial effect on brain function because they are rich in vitamins, antioxidants, minerals, and phytochemicals that act as free radical scavengers, protecting the brain from neuronal damage [3–6, 37]. Therefore, DGV may help prevent cognitive decline caused by increased oxidative stress and inflammation, which are believed to contribute to age-related dementia.
Our finding that phylloquinone intake was positively associated with overall cognitive performance and in all its domains is consistent with findings from previous studies [10–12, 38–40]. For example, the Québec Longitudinal Study on Nutrition and Successful Aging included 320 elderly participants. This study showed that higher levels of phylloquinone in the serum were associated with better verbal episodic memory performance, though not with nonverbal episodic memory, executive function, or processing speed [38]. A cross-sectional analysis of older adults (N = 160, mean age 82.4 years) indicated that increased dietary vitamin K intake and serum phylloquinone are associated with less severe subjective memory complaints [39]. In the ELDERMET cohort of 500 older Irish adults, serum phylloquinone and phylloquinone intake were correlated with better performance on the mini-mental state examination [40].
Phylloquinone’s link to cognitive functioning is not fully understood. One explanation is that it may reduce cognitive decline by regulating sphingolipid metabolism [41, 42], which is essential for maintaining myelin surrounding nerve fibers and enabling fast signal transmission. Vitamin K is also required for the carboxylation of vitamin K dependent proteins, which are expressed in the central nervous system and have been linked to neuroinflammation [43].
β-carotene is a fat-soluble pigment with strong antioxidant properties that can combat free radicals, which are linked to cognitive impairment [10, 14–17]. It, along with other carotenoids, has been found in the human brain [16]. While carotenoids have been shown to benefit cognitive health [7, 14–17], this study specifically focuses on β-carotene due to its abundance in DGV. Our findings are consistent with several longitudinal observational studies [7, 14–17, 44]. For example, among 49,493 female registered nurses (mean age of 48 years) a higher intake of total carotenoids was associated with substantially lower odds of moderate or poor cognitive function after controlling for other dietary and non-dietary risk factors and total energy intake [14]. The current study findings suggest that men may need to consume more β-carotene than women to improve cognitive function, but more research is needed to confirm this due to the limitations of this study design.
Our study also showed that higher intake of α-tocopherol, a bioavailable form of vitamin E, is associated with better cognitive function. The brain prefers α-tocopherol, which is the most abundant antioxidant form of vitamin E [37, 45]. Studies have consistently linked higher dietary and serum vitamin E levels with lower risk of cognitive impairment and Alzheimer’s disease [45–49]. Other natural forms of vitamin E, including tocopherols and tocotrienols, also protect against cognitive decline and dementia [45–48]. A meta-analysis of case-control studies found that circulatory levels of α-tocopherol were significantly lower in Alzheimer’s patients compared to healthy controls [49].
The study has strengths and limitations. Strengths include the use of a representative sample of the US older adult population with equal representation of men and women, which enhances the generalizability of the findings. The NHANES employed standardized protocols and rigorous quality control in data collection, and the comprehensive database allowed for adjustment of significant covariates related to dietary intake and cognitive function, such as demographics, health behaviors, physical activity, and medical conditions.
Limitations include a cross-sectional study design, which do not allow for inferences of causality or temporality. There may be measurement errors due to recall bias in the 24-hour recall method used to obtain nutritional data. Recall bias may also be related to primary variables of interests. DGV consumers and those with better cognitive function may recall their intake more accurately. The 24-hour recall method, used in this study, may result in fewer errors than other methods, such as the FFQ, which requires recalling intake throughout the year, and may be more suitable for older adults with varying cognitive function levels. The research examined only three micronutrients present in DGV, while there are numerous other bioactive compounds in these vegetables that could potentially contribute to cognitive health, but were not included in the analysis. Future studies could use nutritional biomarkers to validate dietary intake in older adults. It is unclear whether long-term or earlier exposure to DGV would improve cognition. While the study sample was representative of US adults aged 60 and over, caution should be exercised when extrapolating the findings to other populations.
5Conclusion
The study suggests that DGV, which are rich in phylloquinone, β-carotene, and α-tocopherol, may benefit specific domains of cognition, particularly memory-related domains i.e., learning and remembering. Yet, the majority of US older adults (>60%) lack intake of DGV in their daily diet. Given the rising prevalence of cognitive decline and dementia in the US, and that intake of DGV is readily modifiable, prospective studies are necessary to assess the long-term effects of increasing intake of DGV on specific cognitive domains in older adults.
Funding
This study was supported by VA Advanced Special Fellowship in Geriatrics (G.B.), a VA RR&D Senior Research Career Scientist Award (A.S.R.), and the Department of Veterans. Affairs (VA) Medical Center Baltimore Geriatric Research, Education and Clinical Center (GRECC) and by the Claude D. Pepper Older Americans Independence Center/NIA P30AG028747, and the USDA Agricultural Research Service Cooperative Agreement 58-8050-9-004. The sponsors of this work had no role in the analysis or interpretation of results and no role in the decision to publish these data.
Authors’ Contributions
GB, MER, MKS and ASR designed the research; GB conducted the research and performed the statistical analysis; GB, MER, MKS and ASR wrote the paper. GB, MER, MKS and ASR had primary responsibility for final content. All authors have read and approved the final manuscript.
Funding disclosure
All the authors declare no funding disclosure.
Conflict of interest
The authors have no conflict of interest to report.
Abbreviations
AFT, Animal Fluency Test
AMPM, Automated Multiple Pass Method
ARS, Agricultural Research Service
ATC, Anatomical Therapeutic Chemical
CERAD, Consortium to Establish a Registry for Alzheimer’s Disease
DGV, Dark Green Vegetables
DSST, Digit Symbol Substitution Test
DWR, Delayed Word Recall
FNDDS, Food and Nutrient Database for Dietary Studies
FPED, Food Patterns Equivalents Database
FSRG, Food Surveys Research Group
LSMs, Least-Square Means
MAP, Memory and Aging Project
NCHS, National Center for Health Statistics
NHANES, National Health and Nutrition Examination Survey
USDA, United States Department of Agriculture
References
[1] | Morley JE , Morris JC , Berg-Weger M , et al. Brain health: the importance of recognizing cognitive impairment: an IAGG consensus conference. J Am Med Dir Assoc. (2015) ;16: (9):731–9. doi:10.1016/j.jamda.2015.06.017. |
[2] | Alzheimer’s Association. 2023 Alzheimer’s disease facts and figures [published online ahead of print, 2023 Mar 14]. Alzheimers Dement. 2023;10.1002/alz.13016. doi:10.1002/alz.13016. |
[3] | Zhou Y , Wang J , Cao L , Shi M , Liu H , Zhao Y , Xia Y . Fruit and vegetable consumption and cognitive disorders in older adults: a meta-analysis of observational studies. Front Nutr. (2022) ;9: :871061. doi:10.3389/fnut.2022.871061. PMID: 35795585; PMCID: PMC9251442. |
[4] | Ambrogini P , Betti M , Galati C , Di Palma M , Lattanzi D , Savelli D , Galli F , Cuppini R , Minelli A . α-Tocopherol and hippocampal neural plasticity in physiological and pathological conditions. Int J Mol Sci. (2016) ;17: (12):2107. doi:10.3390/ijms17122107. |
[5] | Loef M , Walach H . Fruit, vegetables and prevention of cognitive decline or dementia: a systematic review of cohort studies. J Nutr Health Aging. (2012) ;16: (7):626–30. doi:10.1007/s12603-012-0054-y. |
[6] | Rajaram S , Jones J , Lee GJ . Plant-based dietary patterns, plant foods, and age-related cognitive decline. Adv Nutr. (2019) ;10: (Suppl_4):S422–S436. doi:10.1093/advances/nmz081. |
[7] | Morris MC , Wang Y , Barnes LL , Bennett DA , Dawson-Hughes B , Booth SL . Nutrients and bioactives in green leafy vegetables and cognitive decline: prospective study. Neurology. (2018) ;90: (3):e214–e222. doi:10.1212/WNL.0000000000004815. |
[8] | Li W , Sun L , Yue L , Li G , Xiao S . The association between eating green vegetables every day and mild cognitive impairment: a community-based cross-sectional study in Shanghai. Neuropsychiatr Dis Treat. (2019) ;15: :3213–8. doi:10.2147/NDT.S228314. |
[9] | Nicklett EJ , Kadell AR . Fruit and vegetable intake among older adults: a scoping review. Maturitas. (2013) ;75: (4):305–12. doi:10.1016/j.maturitas.2013.05.005. |
[10] | Popa DS , Bigman G , Rusu ME . The role of vitamin K in humans: implication in aging and age-associated diseases. Antioxidants (Basel). (2021) ;10: (4):566. doi:10.3390/antiox10040566. |
[11] | Azuma K , Osuka Y , Kojima N , Sasai H , Kim H , Inoue S . Association of Vitamin K Insufficiency With Cognitive Dysfunction in Community-Dwelling Older Adults. Front Nutr. (2022) ;8: :811831. doi:10.3389/fnut.2021.811831. |
[12] | Wang A , Zhao M , Luo J , Zhang T , Zhang D . Association of DietaryVitamin K Intake With Cognition in the Elderly. Front Nutr. (2022) ;9: :900887. doi:10.3389/fnut.2022.900887. |
[13] | Alisi L , Cao R , De Angelis F , et al. The Relationships Between Vitamin K and Cognition: A Review of Current Evidence. Front Neurol. (2019) ;10: :239. doi:10.3389/fneur.2019.00239. |
[14] | Yuan C , Fondell E , Ascherio A , Okereke OI , Grodstein F , Hofman A , Willett WC . Long-Term Intake of Dietary Carotenoids Is Positively Associated with Late-Life Subjective Cognitive Function in a Prospective Study in US Women. J Nutr. (2020) ;150: (7):1871–9. doi:10.1093/jn/nxaa145. |
[15] | Christensen K , Gleason CE , Mares JA . Dietary Carotenoids and Cognitive Function Among US Adults, NHANES 2011-2014. Nutr Neurosci. (2020) ;23: (7):554–62. doi:10.1080/1028415X.2018.1557235. |
[16] | Craft NE , Haitema TB , Garnett KM , Fitch KA , Dorey CK . Carotenoid, Tocopherol, and Retinol Concentrations in Elderly Human Brain. J Nutr Health Aging. (2004) ;8: (3):156–62. |
[17] | Hira S , Saleem U , Anwar F , Sohail MF , Raza Z , Ahmad B . β-Carotene: A Natural Compound Improves Cognitive Impairment and Oxidative Stress in a Mouse Model of Streptozotocin-Induced Alzheimer’s Disease. Biomolecules. (2019) ;9: (9):441. doi:10.3390/biom9090441. |
[18] | Levine DA , Gross AL , Briceño EM , et al. Sex Differences in Cognitive Decline Among US Adults. JAMA Netw Open. (2021) ;4: (2):e210169. doi:10.1001/jamanetworkopen.2021.0169. |
[19] | National Center for Health Statistics. About the National Health and Nutrition Examination Survey. Available online: http://www.cdc.gov/nchs/nhanes/about_nhanes.htm (accessed on March 20, 2023). |
[20] | Centers for Disease Control and Prevention, National Center for Health Statistics. NHANES 2009-2010 Public Data General Release File Documentation. Published September 2011. http://www.cdc.gov/nchs/nhanes/nhanes2009-2010/generaldoc_f.htm Accessed March 6, 2023. |
[21] | Moshfegh AJ , Rhodes DG , Baer DJ , et al. The US Department of Agriculture Automated Multiple-Pass Method reduces bias in the collection of energy intakes. Am J Clin Nutr. (2008) ;88: (2):324–32. |
[22] | Analytic Notes for Dietary Interview—Total Nutrient Intakes, First Day Using NHANES 2013-2014. https://wwwn.cdc.gov/Nchs/Nhanes/2013-2014/DR1TOT_H.htm Accessed March 6, 2023 |
[23] | National Center for Health Statistics. National Health and Nutrition Examination Survey. Measuring Guides for the Dietary Recall Interview. https://www.cdc.gov/nchs/nhanes/measuring_guides_dri/measuringguides.htm Accessed March 6, 2023. |
[24] | USDA’s Food and Nutrient Database for Dietary Studies. https://data.nal.usda.gov/dataset/food-and-nutrient-database-dietary-studies-fndds Accessed March 6, 2023. |
[25] | Brody DJ , Kramarow EA , Taylor CA , McGuire LC . Cognitive Performance in Adults Aged 60 and Over: National Health and Nutrition Examination Survey, 2011-2014. Natl Health Stat Report. (2019) ;(126):1–23. PMID: 31751207. |
[26] | Moshfegh AJ , Rhodes DG , Baer DJ , et al. The US Department of Agriculture Automated Multiple-Pass Method reduces bias in the collection of energy intakes. Am J Clin Nutr. (2008) ;88: (2):324–32. |
[27] | Krebs-Smith SM , Pannucci TE , Subar AF , et al. Update of the Healthy Eating Index: HEI-2015. J Acad Nutr Diet. (2018) ;118: (9):1591–602. |
[28] | National Cancer Institute, Division of Cancer Control and Population Sciences. Epidemiology and Genomics Research Program. HEI Scoring Algorithm. https://epi.grants.cancer.gov/hei/calculating-hei-scores.html Accessed March 6, 2023. |
[29] | Bigman G , Ryan AS . Healthy Eating Index-Is Associated with Grip Strength among the US Adult Population. Nutrients. (2021) ;13: (10):3358. Published 2021 Sep 25. |
[30] | Bull FC , Al-Ansari SS , Biddle S , Borodulin K , Buman MP , Cardon G , Carty C , Chaput JP , Chastin S , Chou R , et al. World Health Organization guidelines on physical activity and sedentary behavior. Br J Sports Med. (2020) ;54: (24):1451–62. doi:10.1136/bjsports-2020-102955. Epub 2020 Nov 12. PMID: 33184198. |
[31] | Centers for Disease Control and Prevention. Adult Body Mass Index. https://www.cdc.gov/obesity/basics/adult-defining.html#:∼:text=Adult%20Body%20Mass%20Index&text=If%20your%20BMI%20is%20less,falls%20within%20the%20obesity%20range. Accessed March 6, 2023 |
[32] | Centers for Disease Control and Prevention. High Blood Pressure Symptoms and Causes. https://www.cdc.gov/bloodpressure/about.htm. Accessed March 6, 2023. |
[33] | National Heart, Lung, and Blood Institute. What is Heart Disease? https://www.nhlbi.nih.gov/files/docs/public/heart/wyntk.pdf. Accessed March 6, 2023. |
[34] | Ferland G , Bouchard B , Boutouyrie G , Kergoat MJ , Belleville S , Barberger-Gateau P , Rolland Y . Vitamin K Antagonists and Cognitive Function in Older Adults: The Three-City Cohort Study. J Gerontol A Biol Sci Med Sci. (2016) ;71: (10):1356–62. doi:10.1093/gerona/glw027. Epub 2016 Mar 23. PMID: 27005834. |
[35] | World Health Organization Collaborating Centre for Drug Statistics Methodology. Guidelines for ATC Classification and DDD Assignment. Geneva, Switzerland: WHO; 1996. |
[36] | Fenech M . Vitamins Associated with Brain Aging, Mild Cognitive Impairment, and Alzheimer Disease: Biomarkers, Epidemiological and Experimental Evidence, Plausible Mechanisms, and Knowledge Gaps. Adv Nutr. (2017) ;8: (6):958–70. doi:10.3945/an.117.015610. PMID: 29141977; PMCID: PMC5691711. |
[37] | La Fata G , Weber P , Mohajeri MH . Effects of vitamin E on cognitive performance during ageing and in Alzheimer’s disease. Nutrients. (2014) ;6: (12):5453–72. doi:10.3390/nu6125453. PMID: 25437209; PMCID: PMC4276978. |
[38] | Presse N , Belleville S , Gaudreau P , Greenwood CE , Kergoat MJ , Morais JA , Payette H , Shatenstein B , Ferland G . Vitamin K status and cognitive function in healthy older adults. Neurobiol Aging. (2013) ;34: (12):2777–83. doi:10.1016/j.neurobiolaging.2013.06.022. Epub 2013 Aug 1. PMID: 23916722. |
[39] | Soutif-Veillon A , Ferland G , Rolland Y , Presse N , Boucher K , Féart C , Annweiler C . Increased dietary vitamin K intake isassociated with less severe subjective memory complaint among olderadults. Maturitas. (2016) ;93: . |
[40] | Kiely A , Ferland G , Ouliass B , O’Toole PW , Purtill H , O’Connor EM . Vitamin K status and inflammation are associated with cognition in older Irish adults. Nutr Neurosci. (2020) ;23: (8):591–9. |
[41] | Bonica C , Miceli F , Iovino F , Riccio R , Zablocki K , Friscia M , Pirozzi M , Fusco C , Di Domenico G , Sala M , et al. Transcriptional Regulation of Sphingosine Kinase 1. Cells. (2020) ;9: (11):2437. doi:10.3390/cells9112437. |
[42] | Alaamery MA , Alsulami AF , Alqahtani FY , Alqahtani AM , Alkhodairy MA , Naserullah ZA , Algabri AA , Alghamdi AB , Alghamdi J , Aldossary SA , et al. Role of sphingolipid metabolism in neurodegeneration. J Neurochem. (2021) ;158: (1):25–35. doi:10.1111/jnc.15044. |
[43] | Shafit-Zagardo B , Gruber RC , DuBois JC . The role of TAM family receptors and ligands in the nervous system: From development to pathobiology. Pharmacol Ther. (2018) ;188: :97–117. doi:10.1016/j.pharmthera.2018.03.002. |
[44] | Yuan C , Chen H , Wang Y , Schneider JA , Willett WC , Morris MC . Dietary carotenoids related to risk of incident Alzheimer dementia (AD) and brain AD neuropathology: a community-based cohort of older adults. Am J Clin Nutr. (2021) ;113: (1):200–8. |
[45] | Grimm M , Mett J , Hartmann T . The Impact of Vitamin E and Other Fat-Soluble Vitamins on Alzheimer’s Disease. Int J Mol Sci. (2016) ;17: (11):1785. doi:10.3390/ijms17111785. PMID: 27801735. |
[46] | Li FJ , Shen L , Ji HF . Dietary intakes of vitamin E, vitamin C, and β-carotene and risk of Alzheimer’s disease: a meta-analysis. J Alzheimers Dis. (2012) ;31: (2):253–8. doi:10.3233/JAD-2012-120535. PMID: 22531410. |
[47] | Boccardi V , Baroni M , Mangialasche F , Mecocci P . Vitamin E family: Role in the pathogenesis and treatment of Alzheimer’s disease. Alzheimers Dement (N Y). (2016) ;2: (3):182–91. doi:10.1016/j.trci.2016.07.002. PMID: 29067325; PMCID: PMC5646666. |
[48] | Devore EE , Grodstein F , van Rooij FJ , Hofman A , Stampfer MJ , Witteman JC , Breteler MM . Dietary antioxidants and long-term risk of dementia. Arch Neurol. (2010) ;67: (7):819–25. doi:10.1001/archneurol.2010.130. PMID: 20625088; PMCID: PMC2913290. |
[49] | Ashley S , Bradburn S , Murgatroyd C . A meta-analysis of peripheral tocopherol levels in age-related cognitive decline and Alzheimer’s disease. Nutr Neurosci. (2021) ;24: (10):795–809. doi:10.1080/1028415X.2019.1686193. PMID: 31752687. |


