
Calorie restriction causes multiple beneficial metabolic adaptations linearly related with the degree of weight loss in non-obese individuals: Results of CALERIE, a multicenter randomised controlled trial
Abstract
BACKGROUND & AIMS:
Understanding the temporal association and relative power of anthropometric, body composition and energy metabolism measurements of calorie restriction (CR) in predicting metabolic and hormonal adaptations is important, given the clinical and public health implications of excess weight and adiposity.
METHODS:
Anthropometric (body weight, BMI, waist circumference), body composition (body fat and lean mass by DXA), energy metabolism (leptin and total daily energy intake by doubly labelled water [DLW]) markers and an extensive assessment of cardiometabolic, inflammatory and hormonal risk factors were obtained in 191, 21–50 year old non-obese (BMI 22·0–27·9 kg/m2) women and men, who participated in the 2-yr CALERIE randomized clinical trial. Pairwise correlations for each adiposity and energy metabolism measure were calculated against each other and against each metabolic parameter. In addition, spline and linear regression models were developed to determine a threshold effect of adiposity and energy metabolism measures to trigger changes in metabolic parameters.
RESULTS:
Among the progressively more sophisticated measures of adiposity, body weight is the variable that is most strongly correlated with cardiometabolic and inflammatory outcomes during CR-induced weight loss in young and middle-aged non-obese men and women. Waist circumference and DXA body fat are not superior to body weight or BMI in detecting these biological modifications. We did not find a specific threshold in weight loss to be exceeded for changes in metabolic and inflammatory adaptations to occur. Even small reductions in body weight cause a significant decline in serum T3 levels, a predictor of post-CR weight regain.
CONCLUSIONS:
Calorie restriction with adequate nutrition causes multiple beneficial cardiometabolic and hormonal adaptations that are linearly related with the degree of weight loss in non-obese individuals. Once a baseline has been established, tracking changes in body weight is sufficient to monitor improvements in metabolic health.
Doctors and other health professionals often do not pay attention to weight gain until a patient is at a much higher body mass index (BMI) than what is classically defined as obese, i.e. 30 kg/m2 [1]. However, a healthy college student with a BMI of 22 can easily gain 15-kg (mostly fat) over 20 years and still have a slightly elevated BMI of 26.5 kg/m2 in their late 40 s. This is unfortunately very common in our industrialized societies as many people gain 0.5 to 1.0 kg per year during early and middle adulthood. Epidemiologic studies suggest that small amounts of weight gain (≥2.5 kg to < 10 kg), even in lean people, are associated with a significantly increased risk of major chronic diseases, [2, 3] leading to the current epidemic of normal-weight and overweight metabolic-obesity [4]. Consistently, experimental preclinical and clinical studies have shown that weight loss is associated with major improvements in markers of chronic inflammation, insulin resistance, lipid metabolism and other hormonal and molecular alterations that are deeply implicated in the pathogenesis of type 2 diabetes, hypertension, fatty liver disease, cardiovascular disease, stroke, cancer, and in the accumulation of molecular damage with aging [5–7].
Changes in different anthropometric and DXA-derived direct measures of adiposity have been shown to be related to improvements in metabolic outcomes during calorie restriction (CR) induced weight loss [6, 8]. Of these measurements, body weight, body mass index (BMI), waist circumference and total body fat by DXA are amongst the most commonly used. In addition, serum leptin and urinary doubly labelled water (DLW) levels have been used to assess changes in the amount of energy stored in adipose tissue and total daily energy intake (TDEI), respectively [9, 10]. However, there is a lack of agreement regarding which measure has the best correlation with metabolic, inflammatory and hormonal biomarkers during the CR-induced weight loss and maintenance phase in non-obese individuals. Moreover, it is not known if a specific cutoff exists for metabolic improvements across different anthropometric, body composition and biochemical measurements of CR.
The NIA-funded multicenter, randomized controlled Comprehensive Assessment of Long-term Effects of Reducing Intake of Energy (CALERIE) trial offers an unique opportunity to address these questions. The overall aim of CALERIE was to test the hypothesis that two years of sustained CR, involving a reduction in energy intake to 75% of baseline, in healthy men and women aged 25 to 45, will result in the same adaptive changes that observed in long-lived CR rodents; findings of the trial have been previously reported [11]. Herein, our primary objective was to compare— in all individuals completing the 2-year CALERIE protocol, independently of randomization— the relative power of progressively more sophisticated and expensive adiposity measures from anthropometric (body weight, BMI, waist circumference), body composition (body fat and lean mass by DXA) to energy metabolism (leptin and TDEI) markers in detecting changes in a wide range of metabolic, hormonal, and inflammatory biomarkers during the active weight loss (0 to 12 months) and weight maintenance phase (12 to 24 months). Another objective was to evaluate whether or not a threshold (i.e., a minimum magnitude of change) in measures of adiposity and energy metabolism must be exceeded for changes in specific metabolic adaptations to occur.
1Methods
1.1Study population and design
CALERIE phase 2 was a multicentre, randomised controlled trial conducted at three American universities, aimed at evaluating the effects of 25% reduction in calorie intake in healthy, non-obese (BMI 22·0–27·9 kg/m2) men and premenopausal women (aged 21–50 years). All the participants signed the informed consent that was approved by the institutional review boards of Washington University in St. Louis, Tufts University and Pennington Biomedical Research Center. Extensive information of the study are provided in previous publications [11, 12]. In brief, 220 volunteers were randomized with a 1:2 ratio to control (no intervention) or a 25% restriction in calorie intake based on energy requirements determined as total daily energy expenditure (TDEE) that was estimated from DLW measurements over a four-week period at baseline. Blood and urinary samples, and body composition measurements were taken at baseline, 12-month and 24-month follow up. In the present analysis, data from participants in the intervention and control groups were combined and analyzed as one cohort.
1.2Anthropometric measurements
Participants were weighed in the morning after an overnight fast (Scale Tronix 5200, White Plains, NY) and height and waist circumference were measured twice using a wall-mounted stadiometer and tape measure. Fat mass (FM) and fat-free mass (FFM) were measured by dual-energy x-ray absorptiometry (DXA; Hologic 4500A, Delphi W or Discovery A scanners) with all scans analyzed by a single individual at University of California San Francisco. Scanner performance was monitored with baseline and longitudinal phantom cross calibrations.
1.3Measurements of energy balance
Serum leptin was measured on blood collected after a 12-hour fast using the multiplex immunoassay (Human Adipokine Panel B, Millipore, Billerica, MA; Bio-Plex 200, Bio-Rad Laboratories, Hercules, CA) with an inter-assay variation coefficient of 4.3±1.5%. Total daily energy intake (TDEI) was measured using DLW, as previously described [13]. Baseline ad libitum energy intake was calculated as the mean of two 14-day measurements of TDEE. Mean TDEI was then calculated across 3 intervals (baseline to month 12, baseline to month 24 and month 12 to month 24) as mean TDEE for the interval adjusted for changes in energy content of changes in fat mass (9,300 kcal/kg) and fat-free mass (1,100 kcal/kg).
1.4Cardiometabolic parameters
Venous blood was sampled for biomarker assay after an overnight fast; all the samples were analyzed at the University of Vermont. Serum lipid and lipoprotein-cholesterol concentrations were determined in the Laboratory for Clinical Biochemistry at the University of Vermont. Cholesterol and glycerol-blanked triglycerides were measured with automated enzymatic commercial kits (Miles-Technicon, Tarrytown, NY). HDL-cholesterol was measured in plasma after precipitation of apolipoprotein B-containing lipoproteins by dextran sulfate (50000 MW) and magnesium. LDL cholesterol was calculated using the Friedewald Equation [14]. Fasting serum T3 levels was measured using immunoassays (DPC 2000, Diagnostic Product Corporation, Los Angeles, Calif). Chemiluminescent immunoassay was used to measure cortisol (ADVIA Centaur, Malvem, PA) and insulin (Elecsys, Roche Diagnostics, Indianapolis, IN). Plasma glucose was measured by the glucose oxidase method (YSI Instruments, Fullerton, CA). Blood pressure was measured with an oscillometric blood pressure monitor (Dinamap Procare 200, GE Healthcare, Waukesha, WI, USA) in the morning after a 12-h fast in a seated position. Blood pressure was measured at rest in the morning according to a common procedure. Two readings were taken on each of two separate days during the clinic visit using an automated device (HEM-907XL, Omron Healthcare Inc, Palatine, IL) and a cuff determined on the basis of upper arm circumference.
Glucose Tolerance and insulin sensitivity. Two-hour, 75-gram oral glucose tolerance tests were performed at baseline and at 12 and 24 months with a baseline blood sample and blood collected at 30, 60, 90 and 120 minutes after the glucose consumption. Adequate carbohydrate intake over the prior three days (≥150 g/d) was ensured by an interview with a study dietician. Area under the curve insulin (AUC-insulin) and area under the curve glucose (AUC-glucose) values from the OGTT were determined using the trapezoidal method. HOMA-IR was calculated as (insulin [μU/mL) × fasting glucose [mg/dL)/405).
1.5Inflammatory biomarkers
Serum high-sensitive C-reactive protein (CRP) was measured using particle-enhanced immunonephelometric assay (BN II, Siemens, Deerfield, IL; CV = 3.2±2.5%); TNF-α, monocyte chemoattractant protein-1 (MCP-1), IL-1β, and IL-8 using the multiplex immunoassay (Human Adipokine Panel B, Millipore, Billerica, MA; Bio-Plex 200, Bio-Rad Laboratories, Hercules, CA; CV = 6.1±1.7%, 6.4±2.1%, 8.0±4.4% and 8.7±3.9%, respectively); and IL-6 and intracellular adhesion molecule-1 (ICAM-1) using ELISA (R&D Systems, Minneapolis, MN; CV = 7.9±3.1% and 8.2±1.2%, respectively). Complete blood count and WBC differential (CBC-Diff) were assayed using automated methods (Esoterix Inc., a LabCorp Company, Cranford, NJ).
1.6Hormones
Commercially available ELISA kits were used to measure IGF-1 and IGF-binding protein 1, (IGFBP-1) (DSL/Beckman Coulter, Brea, CA, USA), and PDGF-AB and TGFβ-1 (R&D Systems, Minneapolis, MN, USA). Serum triiodothyronine (T3) and cortisol was measured by chemiluminescent immunoassay (ADVIA Centaur, Bayer Health Care, Deerfield, IL).
1.7Statistical analyses
Participants in the intervention and control groups were combined and analyzed as one cohort because our main exposure is change in body weight and adiposity. Indeed, the control arm in any randomized controlled trial always contains a subset of participants who engage in an effective intervention since the process of recruitment to a weight management trial, and regular measurements of body weight, may motivate them to lose weight. Because our participants were all healthy, non-obese (BMI 22·0–27·9 kg/m2) men and women (aged 21–50 years), it is highly unlikely that weight loss in the control group was due to reverse causality (i.e., illness-related weight loss). Descriptive statistics were calculated for participant’s demographic information, measurements of adiposity, energy metabolism and metabolic biomarkers at baseline, and changes at 12- and 24-month follow-ups. Outliners were detected and removed using a z-score method (±3 Z-scores) from the metabolic biomarkers analyzed. Due to the non-normal distribution, log-transformed metabolic biomarkers were used in descriptive analyses.
Pairwise correlation coefficients were calculated between change scores of adiposity measures at 12- and 24-month follow-up, respectively. Then, pairwise correction coefficients were calculated and compared across adiposity and energy metabolism measures for the associations of their change scores with change in measures of metabolic biomarkers, at 12- and 24-month follow-up, respectively. Next, we determined whether a minimum magnitude of change in body composition and other energy metabolism biomarkers exist that triggers changes in metabolic biomarkers, i.e., whether or not this associations were linear. To achieve this, participants who gained weight were removed from the analyzed sample, spline (five knots) and linear regressions were both fitted for these associations and the model fitness were compared using model diagnostics and visual presentation of regression overlays. Basing upon identifying the linear nature of their association, categorical variables were created to classify participants to < 5%, 5–10% and 10+% weight loss. A cut off at 5% loss from initial weight was selected because previous studies found this degree of weight loss, although modest, to be associated with clinically meaningful improvement in metabolic and other risk factors for chronic diseases [13–15]. One-way ANOVA were used to examine the differences of each metabolic biomarkers between the three weight loss groups (<5%, 5–10% and 10+%). All statistical analyses were performed using Stata (v16.0). All statistical tests were 2-sided and statistical significance was set at P < 0.05.
2Results
Of the more than 10,000 men and women assessed for eligibility, the screening procedures excluded 45% due to age or BMI; 14% for health or medication reasons; and 30% refused to participate due to concerns about their ability to adhere to the protocol, personal, or other study-related issues [11, 12]. Of the 238 participants who began baseline assessments, 220 were randomized; 218 started the assigned intervention; 82% of CR and 95% of control, respectively, completed the study. Supplementary Table 1 presents the demographic characteristics of the 191 participants included in this analysis. Twenty-nine participants were excluded because they did not provide sufficient data on metabolic, hormonal, and inflammatory biomarkers, or excluded due to their biomarker data were identified as outliers using a z-score method (±3 Z-scores) (supplementary Table 2).
2.1Sample characteristics
Descriptive statistics for anthropometric (body weight, BMI, waist circumference), body composition (fat mass, fat-free mass and body fat percentage) and biochemical (leptin and TDEI) measurements of energy metabolism, and cardiometabolic, inflammatory and hormonal biomarkers are presented in Table 1, reporting values at baseline, and changes from baseline at 12 and 24 months, and changes from 12 to 24 months, respectively. During the negative energy balance phase (baseline to 12 months), significant declines in all measures of adiposity and favorable changes in most metabolic biomarkers were observed, with AUC glucose (p = 0.589), active and cortisol (p = 0.305) remained stable. During the weight maintenance phase (12 to 24 months), measures of metabolic, inflammatory, and hormonal biomarkers mostly remained stable with the exceptions of a further decline in TNF-α, T3, cortisol and IGFBP-1.
Table 1
Descriptive statistics (mean [standard deviation]) of adiposity and metabolic biomarkers (log transformed) at baseline and changes at 12 months and 24 months (n = 191)
| Baseline | 12 months | 24 months | ||||||||
| Change from baseline | % | P-Value | Change from baseline | % | P-Value | Change from 12 months | % | P-Value | ||
| Adiposity | ||||||||||
| Body weight (kg) | 72.13 (9.23) | –5.52 (4.91) | –7.65 | <0.001 | –4.62 (5.38) | –6.41 | <0.001 | 0.86 (2.54) | 1.29 | <0.001 |
| Body mass index (kg/m2) | 25.19 (1.70) | –1.77 (1.86) | –7.03 | <0.001 | –1.61 (1.88) | –6.39 | <0.001 | 0.16 (0.75) | 0.68 | 0.003 |
| Waist circumference (cm) | 81.13 (7.63) | –4.12 (4.94) | –5.08 | <0.001 | –3.52 (5.46) | –4.34 | <0.001 | 0.54 (3.27) | 0.70 | 0.025 |
| Fat mass (kg) | 23.77 (4.61) | –3.53 (3.30) | –14.8 | <0.001 | –3.19 (3.83) | –13.4 | <0.001 | 0.32 (1.86) | 1.58 | 0.020 |
| Fat-free mass (kg) | 48.32 (9.05) | –1.29 (1.47) | –2.67 | <0.001 | –1.07 (1.63) | –2.21 | <0.001 | 0.22 (0.85) | 0.47 | 0.001 |
| Leptin (pg/mL) | 17,429 (14,361) | –7,615 (9,431) | –43.7 | <0.001 | –6,172 (11,836) | –35.4 | <0.001 | 1,522 (6,013) | 15.5 | 0.001 |
| Total daily energy intake (kcal/day) | 2,438 (395) | –255 (268) | –10.47 | <0.001 | –199.6 (238) | –8.19 | <0.001 | 57.3 (95) | 2.62 | <0.001 |
| Body fat Percentage | 33.22 (6.28) | –2.77 (2.9) | –8.34 | <0.001 | –2.68 (3.46) | –8.07 | <0.001 | 0.07 (1.8) | 0.23 | 0.620 |
| Log-transformed metabolic biomarkers | ||||||||||
| LDL Cholesterol (mg/dL) | 4.58 (0.28) | –0.06 (0.19) | –1.31 | <0.001 | –0.05 (0.21) | –1.09 | 0.001 | 0.02 (0.19) | 0.44 | 0.251 |
| HDL Cholesterol (mg/dL) | 3.86 (0.24) | 0.04 (0.13) | 1.04 | <0.001 | 0.06 (0.15) | 1.55 | <0.001 | 0.01 (0.14) | 0.26 | 0.178 |
| Triglyceride (mg/dL) | 4.54 (0.48) | –0.15 (0.35) | –3.30 | <0.001 | –0.16 (0.35) | –3.52 | <0.001 | –0.01 (0.27) | –0.23 | 0.796 |
| Glucose, fasting (mg/dL) | 4.41 (0.07) | –0.01 (0.06) | –0.23 | 0.024 | –0.01 (0.07) | –0.23 | 0.033 | 0.00 (0.06) | 0.00 | 0.830 |
| Insulin, fasting (ulU/mL) | 1.61 (0.49) | –0.21 (0.50) | –13.04 | <0.001 | –0.20 (0.50) | –12.42 | <0.001 | 0.02 (0.44) | 1.43 | 0.581 |
| AUC Glucose (mg-hr/dL) | 5.55 (0.16) | –0.01 (0.15) | –0.18 | 0.589 | 0.00 (0.14) | 0.00 | 0.902 | 0.01 (0.15) | 0.18 | 0.466 |
| AUC Insulin (ulU-hr/mL) | 4.46 (0.49) | –0.15 (0.41) | –3.36 | <0.001 | –0.08 (0.39) | –1.79 | 0.026 | 0.07 (0.41) | 1.62 | 0.027 |
| C-Reactive Protein (ug/mL) | –0.49 (1.26) | –0.27 (1.18) | –55.1 | 0.002 | –0.26 (1.04) | –53.1 | 0.001 | 0.01 (1.11) | 1.32 | 0.857 |
| TNF-α (pg/mL) | 1.13 (0.38) | –0.12 (0.33) | –10.6 | <0.001 | –0.23 (0.39) | –20.35 | <0.001 | –0.12 (0.38) | –11.88 | <0.001 |
| T3 (Triiodothyronine) (ng/dL) | 4.72 (0.21) | –0.14 (0.21) | –2.97 | <0.001 | –0.20 (0.22) | –4.24 | <0.001 | –0.06 (0.17) | –1.31 | <0.001 |
| Cortisol (ug/dL) | 2.30 (0.44) | 0.03 (0.39) | 1.30 | 0.305 | –0.10 (0.48) | –4.35 | 0.006 | –0.13 (0.45) | –5.58 | <0.001 |
| IGF-1 (ng/mL) | 5.14 (0.27) | –0.06 (0.23) | –1.17 | 0.001 | –0.08 (0.23) | –1.56 | <0.001 | –0.02 (0.23) | –0.39 | 0.352 |
| IGFBP-1 (pg/mL) | 8.08 (0.94) | 0.40 (0.70) | 4.95 | <0.001 | 0.31 (0.83) | 3.84 | <0.001 | –0.11 (0.78) | –1.30 | 0.058 |
2.2Correlations among measures of adiposity and markers of energy balance
Across multiple measurements of adiposity employed in this study, changes in fat mass by DXA were highly correlated with changes in body weight and BMI, moderately correlated with changes in waist circumference and serum leptin, but less so with fat-free mass. In contrast, changes in TDEI by DLW had poor to moderate pairwise correlation coefficients with all other measures of adiposity, including leptin (Supplementary Tables 3.1 to 3.3).
Body weight, BMI, waist circumference and body fat and fat free mass by DXA were very similar in terms of relationships with metabolic biomarkers during the first 12 months (Table 2). However, while fat-free mass did correlate fairly strongly with fat mass, it was not anywhere near as strong in terms of its relationships with CR-induced metabolic adaptations at 24 months (supplementary Table 4.1). As shown in Table 2, TDEI by DLW provided very little information for any of the biomarkers assessed, with the exception of IGFBP-1, and AUC insulin and cortisol (0 to 12 months). Leptin seemed to be slightly better correlate with metabolic biomarkers only during the second year of this study, especially for fasting insulin, AUC insulin, and T3, but overall did not perform well with most of the other metabolic biomarkers (supplementary Table 4.2).
Table 2
Pairwise correlation matrix of Adiposity with Metabolic Biomarkers (log transformed), changes at 12 months from baseline (n = 191)
| Body weight (kg) | Weight loss (%) | BMI (kg/m2) | WC (cm) | Fat mass (kg) | Fat-free mass (kg) | Leptin (pg/ml) | TDEI (kcal/day) | Body fat (%) | ||
| LDL Cholesterol | r | 0.371 | 0.348 | 0.364 | 0.356 | 0.338 | 0.34 | 0.088 | 0.197 | 0.286 |
| p-value | <0.001 | <0.001 | <0.001 | <0.001 | <0.001 | <0.001 | 0.231 | 0.008 | <0.001 | |
| n | 187 | 187 | 187 | 186 | 187 | 187 | 187 | 181 | 187 | |
| HDL Cholesterol | r | –0.241 | –0.227 | –0.216 | –0.232 | –0.213 | –0.22 | 0.058 | –0.077 | –0.188 |
| p–value | 0.001 | 0.002 | 0.003 | 0.001 | 0.003 | 0.002 | 0.433 | 0.302 | 0.01 | |
| n | 188 | 188 | 188 | 187 | 188 | 188 | 188 | 182 | 188 | |
| Triglyceride | r | 0.43 | 0.403 | 0.381 | 0.447 | 0.353 | 0.372 | 0.081 | 0.179 | 0.258 |
| p-value | <0.001 | <0.001 | <0.001 | <0.001 | <0.001 | <0.001 | 0.268 | 0.016 | <0.001 | |
| n | 188 | 188 | 188 | 187 | 188 | 188 | 188 | 182 | 188 | |
| Glucose, fasting | r | 0.077 | 0.072 | 0.046 | 0.081 | 0.045 | 0.06 | –0.047 | –0.032 | 0.04 |
| p-value | 0.293 | 0.324 | 0.532 | 0.268 | 0.539 | 0.413 | 0.525 | 0.671 | 0.587 | |
| n | 188 | 188 | 188 | 187 | 188 | 188 | 188 | 182 | 188 | |
| Insulin, fasting | r | 0.324 | 0.315 | 0.279 | 0.318 | 0.28 | 0.309 | 0.139 | 0.163 | 0.217 |
| p–value | <0.001 | <0.001 | <0.001 | <0.001 | <0.001 | <0.001 | 0.058 | 0.028 | 0.003 | |
| n | 188 | 188 | 188 | 187 | 188 | 188 | 188 | 182 | 188 | |
| AUC Glucose | r | 0.261 | 0.233 | 0.257 | 0.252 | 0.232 | 0.249 | 0.056 | 0.159 | 0.162 |
| p-value | 0.002 | 0.005 | 0.002 | 0.002 | 0.005 | 0.003 | 0.501 | 0.058 | 0.051 | |
| n | 145 | 145 | 145 | 144 | 145 | 145 | 145 | 143 | 145 | |
| AUC Insulin | r | 0.523 | 0.48 | 0.473 | 0.513 | 0.469 | 0.503 | 0.19 | 0.287 | 0.389 |
| p-value | <0.001 | <0.001 | <0.001 | <0.001 | <0.001 | <0.001 | 0.051 | 0.003 | <0.001 | |
| n | 106 | 106 | 106 | 106 | 106 | 106 | 106 | 105 | 106 | |
| C-Reactive Protein | r | 0.186 | 0.171 | 0.172 | 0.114 | 0.21 | 0.162 | –0.044 | 0.077 | 0.23 |
| p-value | 0.011 | 0.019 | 0.018 | 0.119 | 0.004 | 0.027 | 0.546 | 0.304 | 0.002 | |
| n | 188 | 188 | 188 | 187 | 188 | 188 | 188 | 182 | 188 | |
| TNF-α(pg/mL) | r | 0.016 | 0.031 | 0.039 | 0.037 | 0.072 | –0.006 | 0.019 | 0.031 | 0.135 |
| p-value | 0.828 | 0.669 | 0.593 | 0.62 | 0.329 | 0.932 | 0.796 | 0.678 | 0.066 | |
| n | 188 | 188 | 188 | 187 | 188 | 188 | 188 | 182 | 188 | |
| T3 (Triiodothyronine) | r | 0.300 | 0.297 | 0.247 | 0.272 | 0.301 | 0.198 | 0.095 | 0.155 | 0.283 |
| p-value | <0.001 | <0.001 | 0.001 | <0.001 | <0.001 | 0.007 | 0.195 | 0.036 | <0.001 | |
| n | 188 | 188 | 188 | 187 | 188 | 188 | 188 | 182 | 188 | |
| Cortisol | r | –0.196 | –0.18 | –0.195 | –0.216 | –0.195 | –0.105 | –0.194 | –0.142 | –0.166 |
| p-value | 0.007 | 0.014 | 0.007 | 0.003 | 0.008 | 0.151 | 0.008 | 0.056 | 0.023 | |
| n | 188 | 188 | 188 | 187 | 188 | 188 | 188 | 182 | 188 | |
| IGF-1 | r | –0.113 | –0.122 | –0.152 | –0.081 | –0.14 | –0.003 | –0.039 | –0.121 | –0.146 |
| p-value | 0.124 | 0.098 | 0.038 | 0.271 | 0.055 | 0.966 | 0.596 | 0.104 | 0.046 | |
| n | 187 | 187 | 187 | 186 | 187 | 187 | 187 | 181 | 187 | |
| IGFBP-1 | r | –0.276 | –0.245 | –0.254 | –0.33 | –0.254 | –0.252 | –0.091 | –0.209 | –0.207 |
| p-value | <0.001 | 0.001 | <0.001 | <0.001 | <0.001 | 0.001 | 0.213 | 0.005 | 0.004 | |
| n | 188 | 188 | 188 | 187 | 188 | 188 | 188 | 182 | 188 |
1Values in cells are, in order: Pearson correlation coefficient (ρ), p-value of significance (where null hypothesis is H0: ρ = 0), number of observations with non-missing pairs of values. 2Cells are shaded based on the magnitude of the absolute value of the Pearson correlation coefficient (ρ), from weakest correlation (no highlight) and moderate correlation (yellow) to strongest correlation (orange).
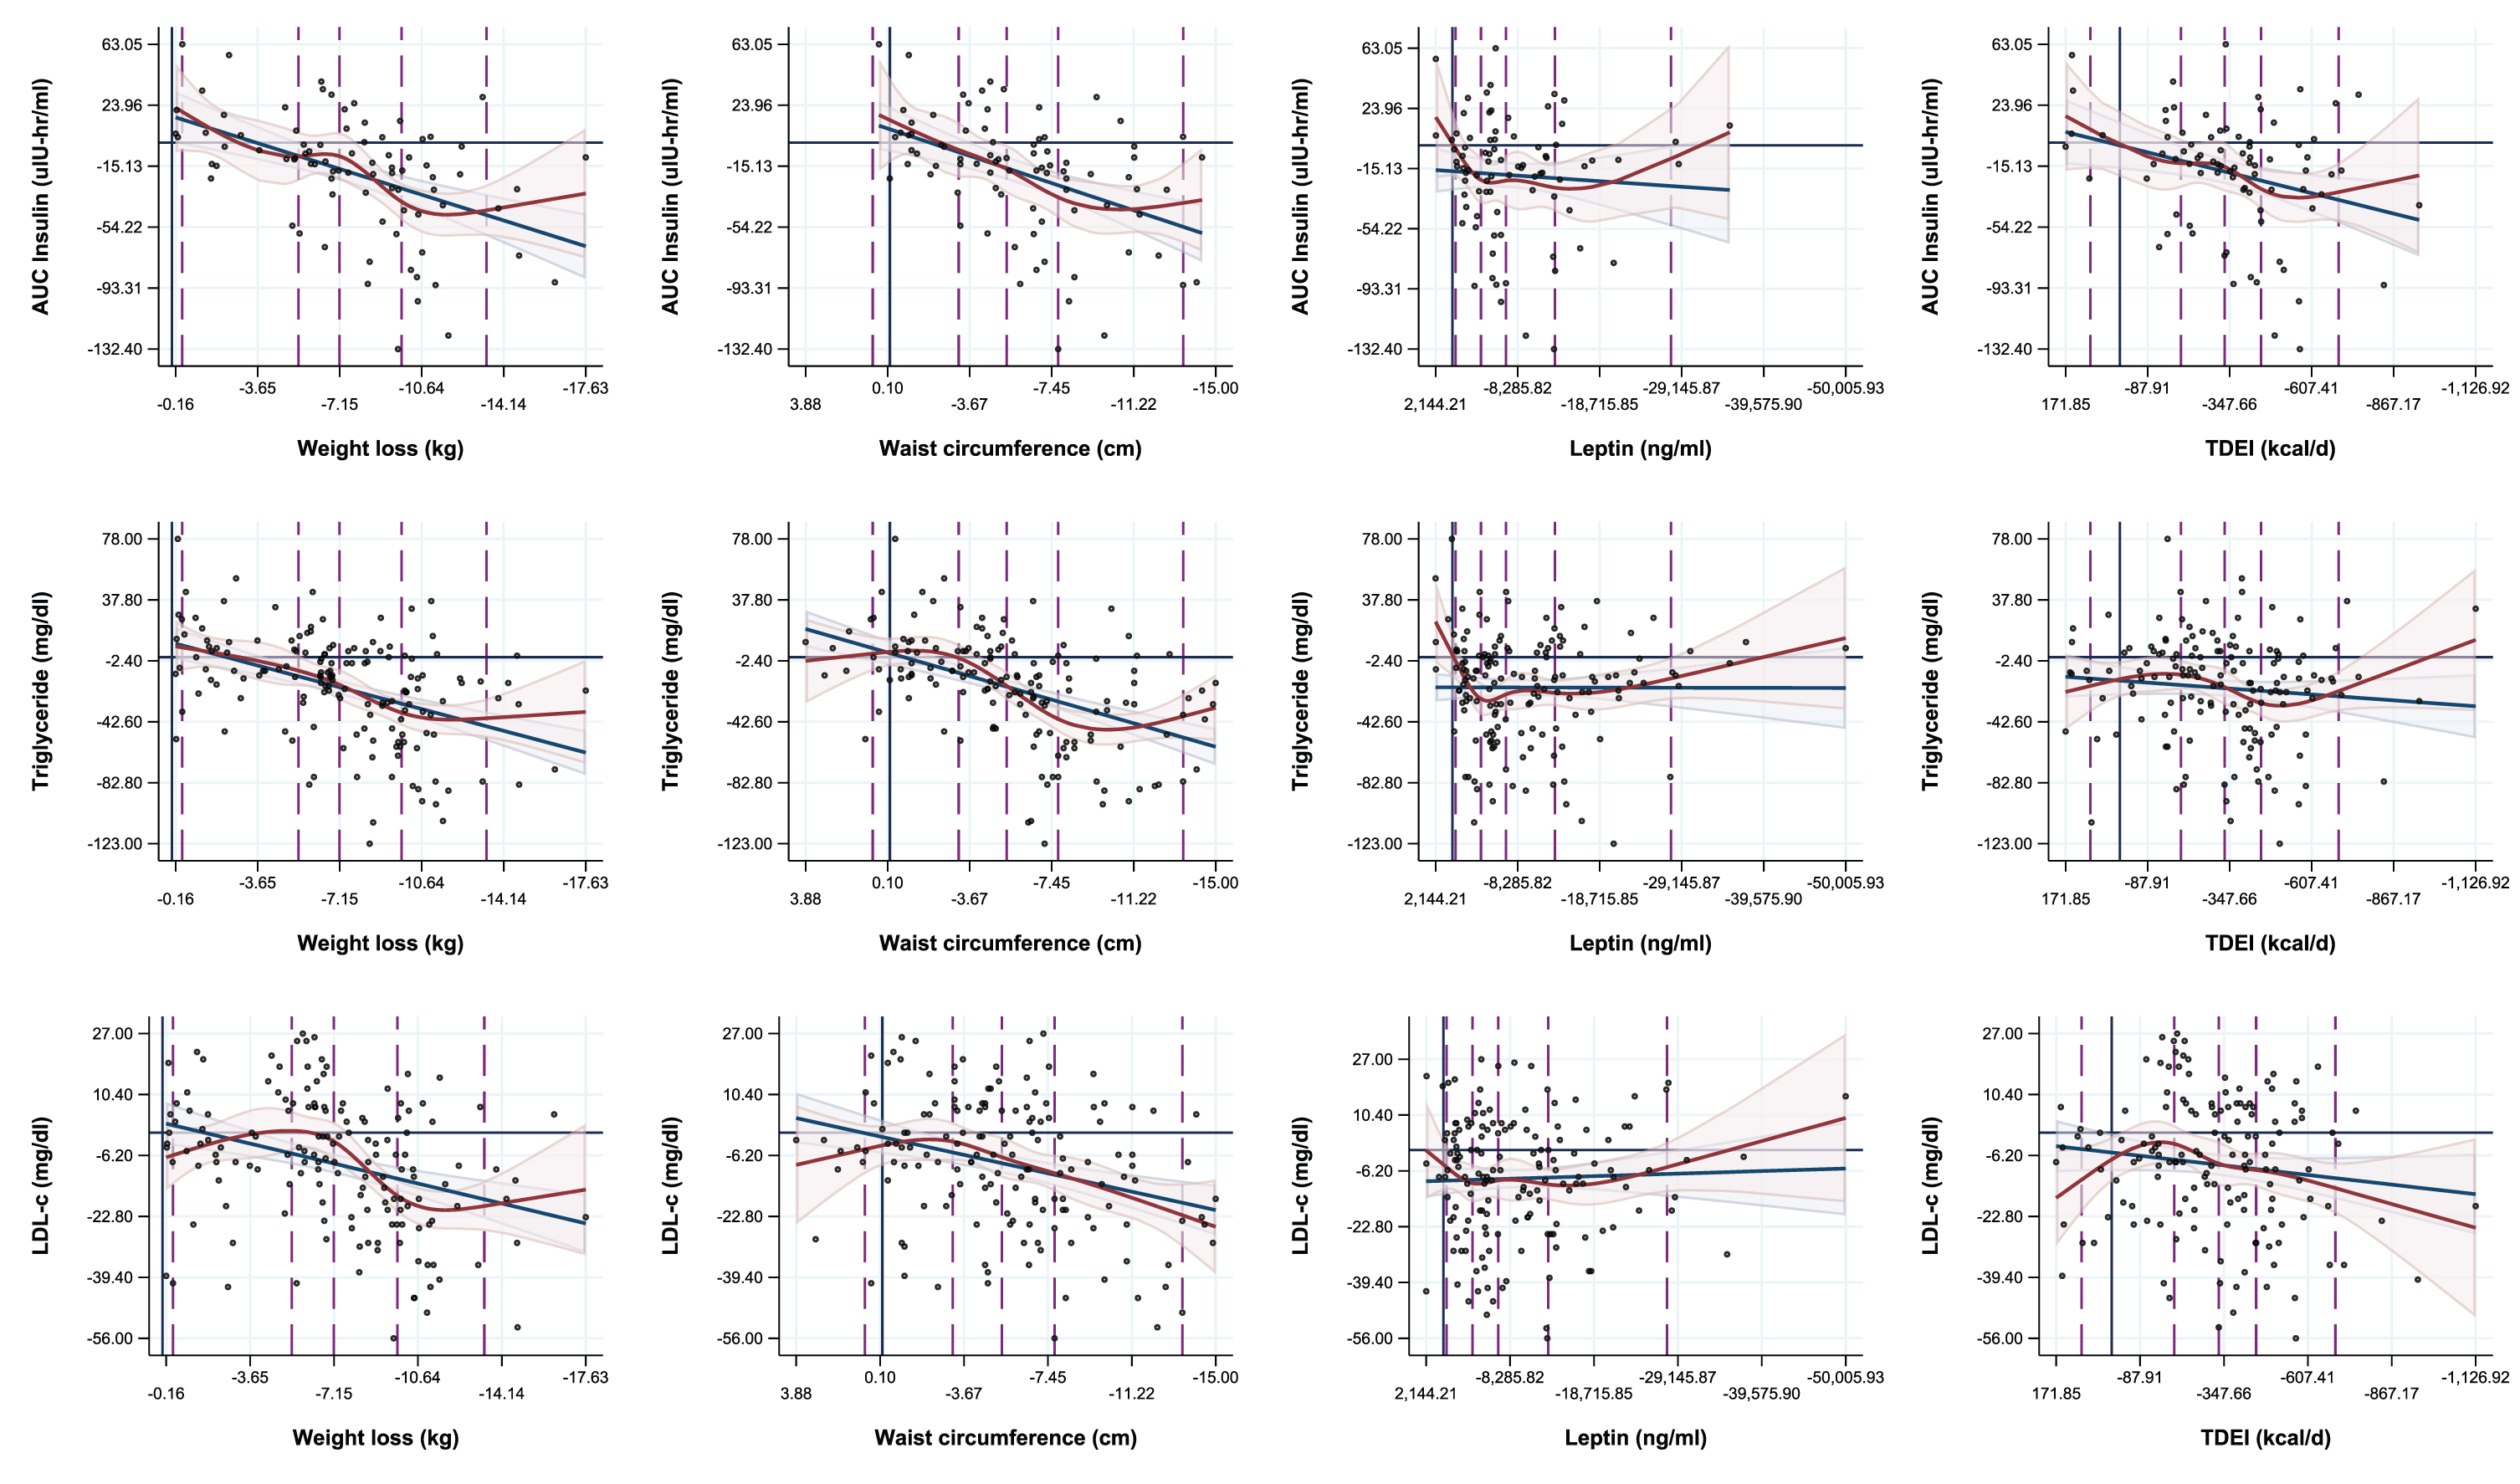
Fig. 1
Regression overlays of spline (five knots) and linear regressions on the associations between adiposity measures and metabolic biomarkers.
2.3Correlations between changes in adiposity and metabolic, inflammatory and hormonal parameters
The specific adiposity measurement that is “better” associated with metabolic biomarkers depends on the biomarker and the energy balance state. Adiposity measured by waist circumference was not superior to body weight with the exception of cortisol during the first 12 months (Table 2). Similarly, body fat mass measured by DXA was generally a poorer predictor of metabolic changes comparing to body weight, BMI or waist circumference, with the exception of change in C-reactive protein from baseline to 12 month and change in AUC Glucose from baseline to 24 months. Body weight and weight circumference were associated with a better model fit for changes of triglyceride during the first 12 months (Table 2), whereas fat mass and body fat percentage were associated with a better model fit for C-reactive protein at 12 months and for HDLc at 24 months (Supplementary Table 4.1).
2.4Body composition, adiposity and metabolic threshold effect
The model fits of spline regressions for the associations of change in measures of adiposity and changes in metabolic biomarkers did not statistically differ from that of linear regressions for any of the biomarkers measured in this study, including for three of the most highly correlated metabolic parameters (Fig. 1). The majority of threshold effects visible in the spline plots appear to be encapsulated by the linear regression confidence intervals, and these effects could also be both explained by variation in the data, and manipulated by changing the knot locations during spline analyses (supplementary Figures 1 and 2). Nevertheless, significant differences were observed in changes of most metabolic biomarkers when categorizing participants by levels of weight loss (<5%, 5– < 10%, 10+% weight loss) at 12 months and 24 months (Table 3.1 and 3.2), with the most favorable changes occurred especially in those who successfully lost≥10% body weight (Tables 3.1 and 3.2). However, the CR-induced lowering of serum T3 occurred already with a weight loss smaller than 5% (Tables 3.1 and 3.2), which was associated with significant weight regain in the following 12 months of the study (data not shown). Notably, serum cortisol increased only among participants who lost 10+% body weight at 12 months from baseline (1.16 [95% CI: 0.31, 2.01]).
Table 3.1
One-way ANOVA Results comparing Least-Squares Mean Metabolic Biomarker Changes by Percentage weight loss groups, 12 months from baseline (n = 191)
| <5% of weight lost | 5– < 10% of weight lost | 10+% of weight lost | P–Value | |||||||
| N | Mean | 95% CL | N | Mean | 95% CL | N | Mean | 95% CL | ||
| Metabolic biomarkers | ||||||||||
| LDL Cholesterol (mg/dL) | 64 | –1.72 | –5.91, 2.47 | 42 | 0.50 | –4.67, 5.67 | 81 | –14.09 | –17.81, –10.36 | <0.001 |
| HDL Cholesterol (mg/dL) | 65 | 0.35 | –1.17, 1.88 | 42 | 3.14 | 1.25, 5.04 | 80 | 2.84 | 1.46, 4.21 | 0.027 |
| Triglyceride (mg/dL) | 64 | 1.83 | –5.92, 9.58 | 41 | –11.90 | –21.58, 2.22 | 81 | –32.62 | –39.50, –25.73 | <0.001 |
| Glucose, fasting (mg/dL) | 64 | –0.20 | –1.32, 0.91 | 42 | –0.24 | –1.62, 1.15 | 81 | –1.37 | –2.37, –0.37 | 0.231 |
| Insulin, fasting (ulU/mL) | 64 | –0.12 | –0.65, 0.42 | 42 | –0.72 | –1.38, –0.06 | 80 | –1.79 | –2.27, –1.31 | <0.001 |
| AUC Glucose (mg-hr/dL) | 51 | 7.62 | –2.47, 17.70 | 31 | –2.35 | –15.28, 10.59 | 62 | –6.45 | –15.59, 2.70 | 0.122 |
| AUC Insulin (ulU-hr/mL) | 36 | 10.74 | –0.39, 21.87 | 20 | –10.92 | –25.85, 4.02 | 49 | –31.38 | –40.92, –21.83 | <0.001 |
| C-Reactive Protein (ug/mL) | 64 | 0.16 | –0.26, 0.57 | 40 | –0.22 | –0.75, 0.30 | 80 | –0.04 | –0.41, 0.33 | 0.527 |
| TNF-α (pg/mL) | 64 | –0.37 | –0.61, –0.13 | 42 | –0.30 | –0.60, 0.00 | 81 | –0.38 | –0.60, –0.17 | 0.897 |
| T3 (Triiodothyronine) (ng/dL) | 63 | –7.19 | –11.81, –2.57 | 41 | –17.12 | –22.84, –11.40 | 81 | –21.75 | –25.82, –17.68 | <0.001 |
| Cortisol (ug/dL) | 63 | –1.02 | –1.98, –0.06 | 42 | 0.67 | –0.51, 1.84 | 81 | 1.16 | 0.31, 2.01 | 0.003 |
| IGF-1 (ng/mL) | 65 | –20.95 | –30.72, –11.18 | 41 | –1.90 | –14.20, 10.41 | 80 | –5.46 | –14.27, 3.35 | 0.024 |
| IGFBP-1 (pg/mL) | 64 | 916.35 | –51.37, 1,884.07 | 41 | 987.82 | –221.24, 2,196.87 | 78 | 2,616.99 | 1,740.41, 3,493.57 | 0.019 |
Table 3.2
One-way ANOVA Results comparing Least-Squares Mean Metabolic Biomarker Changes by Percentage weight loss groups, 24 months from baseline (n = 191)
| <5% of weight lost | 5–10% of weight lost | 10+% of weight lost | P–Value | |||||||
| N | Mean | 95% CL | N | Mean | 95% CL | N | Mean | 95% CL | ||
| Metabolic biomarkers | ||||||||||
| LDL Cholesterol (mg/dL) | 66 | –0.35 | –4.51, 3.82 | 53 | –4.17 | –8.82, 0.48 | 68 | –14.50 | –18.60, –10.40 | <0.001 |
| HDL Cholesterol (mg/dL) | 67 | 0.61 | –0.89, 2.12 | 53 | 3.34 | 1.65, 5.03 | 67 | 2.45 | 0.94, 3.95 | 0.050 |
| Triglyceride (mg/dL) | 66 | –1.58 | –9.32, 6.16 | 52 | –10.96 | –19.68, –2.24 | 68 | –34.40 | –42.02, –26.77 | <0.001 |
| Glucose, fasting (mg/dL) | 66 | –0.30 | –1.41, 0.81 | 53 | –0.72 | –1.95, 0.52 | 68 | –1.12 | –2.21, –0.02 | 0.588 |
| Insulin, fasting (ulU/mL) | 66 | –0.44 | –0.98, 0.11 | 53 | –0.89 | –1.50, –0.28 | 67 | –1.56 | –2.10, –1.02 | 0.016 |
| AUC Glucose (mg-hr/dL) | 54 | 3.99 | –5.72, 13.70 | 40 | 6.73 | –4.55, 18.01 | 50 | –11.38 | –21.46, –1.29 | 0.033 |
| AUC Insulin (ulU-hr/mL) | 38 | 3.98 | –7.29, 15.25 | 29 | –8.53 | –21.42, 4.37 | 38 | –33.50 | –44.77, –22.23 | <0.001 |
| C-Reactive Protein (ug/mL) | 65 | 0.17 | –0.24, 0.59 | 52 | 0.05 | –0.41, 0.51 | 67 | –0.24 | –0.64, 0.17 | 0.355 |
| TNF-α (pg/mL) | 66 | –0.27 | –0.50, –0.03 | 53 | –0.30 | –0.56, –0.04 | 68 | –0.50 | –0.73, –0.27 | 0.330 |
| T3 (Triiodothyronine) (ng/dL) | 65 | –10.03 | –14.69, –5.37 | 52 | –15.58 | –20.79, –10.36 | 68 | –21.40 | –25.96, –16.84 | 0.003 |
| Cortisol (ug/dL) | 66 | –0.79 | –1.73, 0.16 | 52 | 1.29 | 0.22, 2.35 | 68 | 0.63 | –0.30, 1.56 | 0.012 |
| IGF-1 (ng/mL) | 66 | –17.43 | –27.23, –7.62 | 53 | –4.17 | –15.10, 6.77 | 67 | –7.54 | –17.27, 2.19 | 0.169 |
| IGFBP-1 (pg/mL) | 65 | 961.30 | –10.39, | 52 | 1,711.36 | 624.97, | 66 | 2,299.95 | 1,335.65, | 0.157 |
| 1,933.00 | 2,797.74 | 3,264.26 | ||||||||
3Discussion
One of the main findings of our study is that among the commonly used anthropometric, body composition and energy metabolism measurements, body weight is the variable that is most strongly and consistently correlated with metabolic, inflammatory and hormonal outcomes during CR-induced weight loss in non-obese men and women. Waist circumference and body fat measured by DXA were not superior to body weight or BMI in detecting these biological responses to weight loss or gain, while leptin (a hormonal biomarker of adiposity) and energy intake by DLW (an extremely expensive measure of calorie intake) correlated poorly. An additional relevant finding is the lack of a specific threshold in weight loss to be exceeded for changes in metabolic adaptations to occur.
Changes in body weight and BMI are thought to provide reasonable estimates of body fat in healthy adults, [15] with the exception for a limited number of people involved in muscle building [16]. However, BMI has limitations, including the inability to distinguish between fat and lean mass. In this sense, DXA imaging is one of the most commonly used and accurate methods to measure the amount of total body fat and lean mass [17]. Unfortunately, DXA tests are expensive, require sophisticated equipment and expose study participants to radiation. Contrary to our expectations, the findings of this large carefully conducted CR trial show that body fat and lean mass by DXA are not superior to body weight in estimating metabolic changes during weight loss. Moreover, while several studies have shown that many adiposity-related metabolic adaptations depend on the distribution of body fat rather than excess weight or the amount of lean mass, per se, [18] the result of our analysis show that even in middle-aged non-obese men and women, waist circumference, a surrogate for abdominal fat, [19, 20] is not superior to body weight in predicting weight-associated metabolic changes.
Our study confirms findings of many other trials in obese individuals demonstrating a weight loss induced coordinated improvement in multiple cardiometabolic and hormonal risk factors, [6, 21–24]. even in people with a BMI between 22 and 27.9 kg/m2. For many of these parameters, our analysis show that a linear relationship exists with changes in body weight, BMI and body fat, and no apparent threshold seems to be required for these metabolic adaptations to occur based on model fits of spline vs. linear regression analysis. Consistently with other studies in overweight and obese individuals with or without type 2 diabetes, when we categorized participants by previously considered clinically meaningful weight loss cutoffs (<5%, 5–10% and 10+%), [22–25] we found that in general the most favorable and extensive changes occurred in those who successfully lost more than 10% of their baseline body weight. In contrast, the great majority of these biomarkers did not change with weight loss smaller than 5%.
An important finding is the reduction in serum T3 that already occurred even with a weight loss smaller than 5%, which was associated with significant weight regain in the following 12 months of the study, consistently with what has been reported by others in obese individuals [26, 27]. We have previously shown that CR, but not exercise-induced weight loss, causes marked reductions in serum T3 levels [28, 29]. Therefore, these data strongly indicate that exercise training must be prescribed together with CR as a key early intervention to prevent excessive reduction in T3, resting metabolic rate and the typical “yo-yoing” weight cycling associated even with small amounts of food restriction. Another notable finding is the significant reduction in serum cortisol levels associated with moderate reduction in weight loss but not with higher degree of CR-induced weight loss. People who lost more than 10% of their baseline weight experienced an activation of the stress-responsive hypothalamic-pituitary-adrenocortical pathway as assessed by serum cortisol, which may play a role in mediating the CR-induced anti-inflammatory and anti-cancer effects observed in experimental animals and humans [30–33].
Major strengths of this study include the large sample size for an intensive CR trial conducted in relatively healthy young and middle-aged non-obese men and women; the long duration of the trial that was divided in a 12-mo weight loss and in 12-mo weight maintenance phase; the measurement of an extensive panel of metabolic, hormonal and inflammatory markers, body composition and energy metabolism parameters, including direct measure through DLW. Our study had a high retention rate of enrolled participants, and good adherence as shown by the successful weight reduction obtained in the first year that has been maintained for the following 12 months in the intervention arm. A major limitation of this study is the lack of a measurement of visceral and liver fat by MRI. It is important to underline that the current analysis differs from that used in previously published CALERIE manuscripts. Its main focus was to study: 1) the strength of the current evidence relating different anthropometric and energy metabolism measures to CR-induced weight loss metabolic outcomes; 2) the comparison of these measure’s effectiveness and validity, especially in relation to the investigators (accessibility, cost) and research volunteers (invasiveness and time) burden.
In conclusion, the results of this study analyzing data from a large trial provide evidence that CR-induced weight loss causes multiple cardiometabolic and hormonal adaptations that are, in general, linearly related with the degree of weight loss in non-obese men and women. Among the progressively more sophisticated and expensive anthropometric and energy metabolism markers assessed in this study, body weight and BMI are the strongest predictors of beneficial metabolic adaptations, while leptin and TDEI are the weakest. Waist circumference and body fat measured by DXA are not superior to body weight or BMI in detecting these biological modifications. We also found that there is not a minimum magnitude of change in body composition required for changes in most cardiometabolic markers to occur. These findings indicate that once a baseline clinical and metabolic assessment has been established, tracking changes in body weight is sufficient to monitor progresses in metabolic health. Physicians and health professionals should discuss the metabolic consequences of small amounts of weight gain (≥2.5 kg to < 10 kg) with their patients as a matter of routine well before their BMI spiral out of control, and they should advise them to maintain a healthy weight and waist circumference from early adulthood to maximize the probability of living a healthy life in older ages.
Conflict of interest
Luigi Fontana is Editor in Chief of this journal, but was not involved in the peer-review process nor had access to any information regarding its peer-review.
Nicola Veronese and Lin Yang are both member of the Editorial Board of this journal, but were not involved in the peer-review process nor had access to any information regarding its peer-review.
Funding
L.F. is supported by grants from the Australian NHMRC Investigator Grant (APP1177797), Australian Youth and Health Foundation, Philip Bushell Foundation, Bakewell Foundation. LP is supported by grant # R01 NS102633 from the NIH/NINDS, by the Office of the Assistant Secretary of Defense for Health Affairs, through the Multiple Sclerosis Research Program under Award No. W81XWH-14-1-0156., by Fondazione Italiana Sclerosi Multipla (FISM; 2014/R/15).
Supplementary material
The supplementary material is available in the electronic version of this article: https://dx.doi.org/10.3233/NHA-220180.
References
[1] | McLaughlin JC , Hamilton K , Kipping R . Epidemiology of adult overweight recording and management by UK GPs: a systematic review, The British journal of general practice: the journal of the Royal College of General Practitioners (2017) ;67: (663):e676–e83. |
[2] | Zheng Y , Manson JE , Yuan C , et al. Associations of Weight Gain From Early to Middle Adulthood With Major Health Outcomes Later in Life, Jama (2017) ;318: :255–69. |
[3] | Sun Q , Townsend MK , Okereke OI , Franco OH , Hu FB , Grodstein F . Adiposity and weight change in mid-life in relation to healthy survival after age 70 in women: prospective cohort study, BMJ (2009) ;339: :b3796. |
[4] | Adair KE , Padgett RN , von Waaden N , Wilson RL , Bowden RG . Metabolic Health, Obesity, and Cardiovascular Disease: -National Health and Nutrition Examination Survey, The American Journal of the Medical Sciences (2021) ;361: (2):244–52. |
[5] | Fontana L , Partridge L , Longo VD . Extending healthy life span–from yeast to humans, Science. (2010) ;328: (5976):321–6. |
[6] | Green CL , Lamming DW , Fontana L . Molecular mechanisms of dietary restriction promoting health and longevity, Nature Reviews Molecular Cell Biology (2022) ;23: :56–73. |
[7] | Clifton KK , Ma CX , Fontana L , Peterson LL . Intermittent fasting in the prevention and treatment of cancer, CA: A Cancer Journal for Clinicians (2021) ;71: :527–46. |
[8] | Cornier MA , Després JP , Davis N , et al . Assessing adiposity: a scientific statement from the American Heart Association, Circulation (2011) ;124: :1996–2019. |
[9] | Ostlund RE Jr , Yang JW , Klein S , Gingerich R , Relation between plasma leptin concentration and body fat, gender, diet, age, and metabolic covariates, The Journal of Clinical Endocrinology and Metabolism. (1996) ;81: :3909–13. |
[10] | Wong WW , Roberts SB , Racette SB , et al. The doubly labeled water method produces highly reproducible longitudinal results in nutrition studies, The Journal of Nutrition (2014) ;144: :777–83. |
[11] | Kraus WE , Bhapkar M , Huffman KM , et al. 2 years of calorie restriction and cardiometabolic risk (CALERIE): exploratory outcomes of a multicentre, phase 2, randomised controlled trial. The Lancet Diabetes & Endocrinology. 2019;7:673-683. |
[12] | Ravussin E , Redman LM , Rochon J , et al. A 2-Year Randomized Controlled Trial of Human Caloric Restriction: Feasibility and Effects on Predictors of Health Span and Longevity, J Gerontol A Biol Sci Med Sci (2015) ;70: :1097–104. |
[13] | Racette SB , Das SK , Bhapkar M , et al. Approaches for quantifying energy intake and % calorie restriction during calorie restriction interventions in humans: the multicenter CALERIE study, American Journal of Physiology Endocrinology and Metabolism (2012) ;302: :E441–8. |
[14] | Friedewald WT , Levy RI , Fredrickson DS . Estimation of the concentration of low-density lipoprotein cholesterol in plasma, without use of the preparative ultracentrifuge, Clinical Chemistry (1972) ;18: :499–502. |
[15] | Gallagher D , Heymsfield SB , Heo M , Jebb SA , Murgatroyd PR , Sakamoto Y . Healthy percentage body fat ranges: an approach for developing guidelines based on body mass index, The American Journal of Clinical Nutrition (2000) ;72: :694–701. |
[16] | Kalkhoff R , Ferrou C . Metabolic differences between obese overweight and muscular overweight men, The New England Journal of Medicine (1971) ;284: (22):1236–9. |
[17] | Svendsen OL , Haarbo J , Hassager C , Christiansen C . Accuracy of measurements of body-composition by dual-energy x-ray absorptiometry in vivo, American Journal of Clinical Nutrition (1993) ;57: (5):605–8. |
[18] | Tracy RP . Is visceral adiposity the “enemy within"? Arteriosclerosis, Thrombosis, and Vascular Biology (2001) ;21: (6):881–3. |
[19] | Carey VJ , Walters EE , Colditz GA , et al. Body fat distribution and risk of non-insulin-dependent diabetes mellitus in women - The Nurses’ Health Study, American Journal of Epidemiology (1997) ;145: (7):614–9. |
[20] | Pischon T , Boeing H , Hoffmann K , et al. General and abdominal adiposity and risk of death in Europe, The New England Journal of Medicine (2008) ;359: (20):2105–20. |
[21] | Fontana L , Villareal DT , Weiss EP , et al. Calorie restriction or exercise: effects on coronary heart disease risk factors, A randomized, controlled trial. American Journal of Physiology-Endocrinology and Metabolism (2007) ;293: (1):E197–E202. |
[22] | Goldstein DJ . Beneficial health effects of modest weight loss, International journal of obesity and related metabolic disorders: journal of the International Association for the Study of Obesity (1992) ;16: (6):397–415. |
[23] | Esposito K , Pontillo A , Di Palo C , et al. Effect of weight loss and lifestyle changes on vascular inflammatory markers in obese women: a randomized trial, Jama (2003) ;289: (14):1799–804. |
[24] | Ross R , Dagnone D , Jones PJ , et al. Reduction in obesity and related comorbid conditions after diet-induced weight loss or exercise-induced weight loss in men, A Randomized, Controlled Trial. Annals of Internal Medicine (2000) ;133: (2):92–103. |
[25] | Wing RR , Lang W , Wadden TA , et al. Benefits of modest weight loss in improving cardiovascular risk factors in overweight and obese individuals with type 2 diabetes, Diabetes Care (2011) ;34: (7):1481–6. |
[26] | Ortega E , Pannacciulli N , Bogardus C , Krakoff J . Plasma concentrations of free triiodothyronine predict weight change in euthyroid persons, The American Journal of Clinical Nutrition (2007) ;85: :440–5. |
[27] | Astrup A , Buemann B , Christensen NJ , et al. The contribution of body composition, substrates, and hormones to the variability in energy expenditure and substrate utilization in premenopausal women, The Journal of Clinical Endocrinology and Metabolism (1992) ;74: :279–86. |
[28] | Fontana L , Klein S , Holloszy JO , Premachandra BN . Effect of long-term calorie restriction with adequate protein and micronutrients on thyroid hormones, The Journal of Clinical Endocrinology & Metabolism (2006) ;91: (8):3232–5. |
[29] | Weiss EP , Villareal DT , Racette SB , et al. Caloric restriction but not exercise-induced reductions in fat mass decrease plasma triiodothyronine concentrations: a randomized controlled trial, Rejuvenation Research (2008) ;11: (3):605–9. |
[30] | Yang L , Licastro D , Cava E , et al. Long-term calorie restriction enhances cellular quality-control processes in human skeletal muscle, Cell Reports (2016) ;14: (3):422–8. |
[31] | Pashko LL , Schwartz AG . Reversal of food restriction-induced inhibition of mouse skin tumor promotion by adrenalectomy, Carcinogenesis (1992) ;13: (10):1925–8. |
[32] | Stewart JW , Koehler K , Jackson W , et al. Prevention of mouse skin tumor promotion by dietary energy restriction requires an intact adrenal gland and glucocorticoid supplementation restores inhibition, Carcinogenesis (2005) ;26: (6):1077–84. |
[33] | Munck A , Guyre PM , Holbrook NJ . Physiological Functions of Glucocorticoids in Stress and Their Relation to Pharmacological Actions, Endocrine Reviews (1984) ;5: (1):25–44. |


