
Protein intake, distribution, and sources in community-dwelling older adults living in Auckland, New Zealand
Abstract
BACKGROUND:
To maximally stimulate muscle protein synthesis (MPS), older adults should consume≥1.2 g/kg body weight (BW) of high-quality protein, evenly distributed across the day ( 0.4 g/kg BW per meal).
OBJECTIVES:
To investigate protein intake, distribution, and sources in community-dwelling older adults.
METHODS:
Data (including a 4-day food record) were obtained from the Researching Eating, Activity, and Cognitive Health (REACH) study, a cross-sectional study in adults aged 65 to 74 years.
RESULTS:
Participants (n = 327, 65.4% female) had a median daily protein intake of 1.16 g/kg BW (males) and 1.09 g/kg BW (females). Over half of participants consumed less than 1.2 g protein/kg BW/day (62% females, 57% males). Protein intake was unevenly distributed throughout the day (CV = 0.48 for males and females) and was inadequate for reaching 0.4 g/kg BW/meal at breakfast and at the mid-day meal (males only). The main sources of protein at breakfast were milk (28%), breakfast cereals (22%), and bread (12%); at the mid-day meal, bread (18%), cheese (10%) and milk (9%); and at the evening meal, meat provided over half the protein (56%).
CONCLUSIONS:
Protein intake for a high proportion of older adults was less than 1.2 g/kg BW/day, and unevenly distributed through the day. Protein was obtained mainly from cereals and dairy products at breakfast and the mid-day meal, and meat sources at the evening meal.
1Introduction
Globally, the population is getting older. In New Zealand, people aged 65 years and older currently constitute 15% of the population [1]. This is expected to increase to 20% by 2026 and to more than 26% by 2051 [2]. Muscle strength declines as people age [3–7], and low muscle strength has been found to be related to physical disability, poor physical performance, and increased mortality [8, 9]. We previously identified that higher muscle mass was associated with greater muscle strength in older adults in New Zealand [10].
The homeostasis of muscle mass is regulated by a dynamic turnover between muscle protein synthesis (MPS) and muscle protein breakdown [11–15]. Aging is accompanied by a blunted MPS response to protein ingestion, resulting in a decrease in muscle mass in older adults [16–21]. The impairment of age-related MPS can be reduced by the consumption of an adequate quantity of high-quality protein, which is distributed evenly throughout the day [22–24].
In Australia and New Zealand, the current recommended daily intake of protein is established as 0.9 g/kg body weight (BW)/day for females and 1.1 g/kg BW/day for males aged 70 years or older [25]. However, older adults may require≥1.2 g/kg BW/day of protein to maximally stimulate MPS [22, 23]. This amount of protein (1.2 g/kg BW/day) cannot be used by the human body all at one time and excess protein consumed at one time cannot be stored for later stimulation of MPS. A protein intake of 0.4 g/kg body weight (BW) per meal has been found to provide a pool of available amino acids that stimulates muscle protein maximally in older adults [26, 27]. Furthermore, Mamerow et al. demonstrated that, MPS was 25% higher in those with a protein intake evenly distributed across three meals (~0.4 g/kg BW per meal) compared to those with an uneven distribution [24].
Protein quality refers to the protein’s composition of essential amino acids and their ability to be digested, absorbed, and retained by the human body [28, 29]. Proteins from animal sources contain all the essential amino acids whereas plant proteins are often missing or have low amounts of one or more essential amino acids [30, 31]. Also, animal-based protein has a higher digestibility compared to plant-based protein [32, 33]. Therefore, animal-based protein sources such as meat, eggs and milk are considered to be of higher quality than plant-based protein sources such as cereals and legumes [30, 34].
In most Western countries, protein intake is unevenly distributed throughout the day, with a high proportion of older adults not reaching the threshold of three daily meals containing≥0.4 g/kg BW of protein per meal [35, 36]. Hung et al. found a lower protein intake was more common in people who did not consume certain sources of protein, such as dairy products [37]. Insight into the distribution and sources of protein throughout the day would yield valuable information for developing effective dietary protein interventions that enable maximal MPS and have the potential to increase and maintain muscle mass in older adults. In this study, we aim to investigate protein intake, distribution, and sources in community-dwelling older adults in New Zealand.
2Materials and methods
Data for this study were obtained from the Researching Eating, Activity and Cognitive Health (REACH) study. REACH was a cross-sectional study with a main objective of investigating dietary patterns and their associations with cognitive function and metabolic syndrome in older adults [38]. The study was granted ethical approval by the Massey University Human Ethics Committee (Southern A, Application 17/69), and all participants gave written informed consent.
2.1Study population
Participants were older adults aged between 65 and 74 years, proficient in English, and living independently (i.e., not in residential care) in Auckland, New Zealand. Participants were excluded if they had a diagnosis of dementia or any other condition which might impair cognitive function (e.g., head injury, stroke), were taking medication which may influence cognitive function, had colour blindness (due to cognitive testing requirements), or had experienced any other event in the last two years which may have had a substantial impact on dietary intake or on cognition. The details of the recruitment and assessment processes for the REACH study have been described elsewhere [38].
2.2Data collection
All participants visited the Human Nutrition Research Unit at Massey University in Auckland, New Zealand on one occasion for collection of data as part of the REACH study. Socio-demographic data (age, sex, ethnicity, level of education, and living situation) were collected by written questionnaire. Height and weight measurements were completed by trained researchers using standardised procedures from the protocol of the International Society for the Advancement of Kinanthropometry (ISAK) [39]. Body height (in cm, to the nearest 0.1 cm) was measured without shoes using a stadiometer (SECA). Body weight (in kg, to the nearest 0.1 kg) was assessed using floor scales (Wedderburn). Body Mass Index (BMI) was calculated using body weight in kilograms divided by height (in metres) squared.
Dietary intake was recorded using a food record completed in the week following the participant’s appointment. This included four consecutive assigned days, with at least one weekend day. Participants were given food record forms, a food portion guide [40], and watched a video explaining how to complete the food record. Participants were instructed to adhere to their usual dietary habits and provide a detailed description of all food and beverages consumed (food, beverage, name, brand, variety, and cooking method), portion sizes, and the time of intake. Participants were asked to send their completed food record back to the research team by post within one month of the study visit. In cases where data were unclear or missing, a follow-up phone call was conducted, in which participants gave verbal clarification.
2.3Data handling
The four-day food records were processed by trained nutritionists and dietitians using FoodWorks 10 [41]. FoodWorks 10 is based on the New Zealand Food Composition database [42]. A register of common food items was kept, ensuring consistency in data entry among the nutritionists. Where necessary, recipes (and the number of servings provided) were entered into FoodWorks 10. All food record entries were checked by a New Zealand registered dietitian for accurate data entry. Outliers identified using histograms were checked with the original food diaries to ensure accuracy.
Daily total energy and macronutrient intake data were generated. Average daily energy intake was considered implausible if energy intake was < 2100 kJ (500 kcal) or > 14 700 kJ (3500 kcal) for females and < 3360 kJ (800 kcal) or > 16 800 kJ (4000 kcal) for males [43]. Percentages of energy from carbohydrates, total fats, and proteins were calculated [25]. Relative protein intake in g/kg BW was calculated by dividing absolute protein intake per day by each participant’s body weight. To determine the percentage of participants who met dietary protein recommendations, relative protein intake were compared with the Australia and New Zealand estimated average requirements (EAR) for adults aged between 19 and 70 years (0.60 g/kg BW/day for females and 0.68 g/kg BW/day for males) and older adults aged 70 years or more (0.75 g/kg BW/day for females and 0.86 g/kg BW/day for males) [25]. Relative protein intake was also compared against a cut-off value of 1.2 g/kg BW/day [22, 23].
To define meals consumed by participants, time of intake was split into one-hour slots. The time of day at which protein was consumed was assessed. Days were divided into three meals, according to the peaks of protein consumption across the day [37]. Protein (in g/kg BW) was calculated at breakfast, the mid-day meal, and the evening meal. The distribution of protein across the three meals for each participant was expressed as the dimensionless coefficient of variation (CV) of protein intake at breakfast, the mid-day meal, and the evening meal (CV = standard deviation of protein intake of the three meals (g)/total protein intake for the three meals (g)). A CV of zero would indicate an even distribution of protein across the day [44].
All foods from the food records were allocated into one of 27 food groups based on the main sources of protein intake identified in the 2008/09 New Zealand Adults Nutrition Survey [45]. Each food group was classified as meat, plant, dairy, or egg protein according to the main type of protein it contained. For each meal, protein quantity (g/meal) was assessed for each food group and presented as a percentage of total protein for that meal.
2.4Statistical analysis
Statistical analysis was performed using IBM SPSS Statistics for Windows, version 27.0 (IBM SPSS, Armonk, NY, USA) [46]. Descriptive statistics were generated for participants’ characteristics and dietary intake data. Continuous data were assessed for normality using Shapiro Wilk tests and visual assessment of histograms. Data were reported as mean±standard deviation (SD) if normally distributed, or median and interquartile range (25th, 75th percentile) if non-normally distributed. Percentages were used for categorical data. Differences between groups were analysed using Mann–Whitney U tests for non-normally distributed scale data and a Chi-squared test of independence for categorical data. Results were considered significant at p < 0.05.
For assessment of food sources of protein that were predictors of high protein intake at each meal, we used logistic regression analysis due to the dichotomous nature of high protein intake define as≥0.4 g/kg BW protein per meal.
First, the association between high protein intake (≥0.4 g/kg BW per meal) and protein (g per meal) for each of the 27 food groups was examined for each meal using separate univariable logistic regression analyses. We applied a cut-off p-value of <0.01 to select the relevant food item for the multivariable model. Foods that were significant contributors to high protein intake in one meal (e.g, red meat at the lunch and the evening meal) were not further considered at other meals (e.g., breakfast) due to their low contribution of protein intake to that meal.
Following this initial screening, food groups which met the criteria described above (p-value of < 0.01) were entered into a logistic regression analysis generated using a manual backward stepwise selection approach for each meal. At each step, variables with a p-value≥0.05 were removed from the model until all remaining variables had p-values<0.001. Throughout this process, food groups were examined to ensure they were important contributors of protein intake. For example, the food group ‘alcoholic beverages’ was removed in the manual backward stepwise selection approach for the evening meal multivariable model as its contribution to protein intake was minimal.
3Results
Three hundred and seventy-one participants took part in this study. Forty-one participants did not provide food records, and three had incomplete food record data, leaving 327 participants to be included in the analysis (Table 1). The median age was 70 years (68, 72) and the median BMI 25.6 kg/m2 (23.0, 28.2), which fell in the overweight BMI category (BMI between 25–29.9 kg/m2). The majority of participants were of New Zealand European or European ethnicity (94.8%). Males were more likely to have a university education (p < 0.01) and to live with others (p < 0.01).
Table 1
Characteristics of Participantsa,b
| Characteristics | Total | Males | Females | p-value |
| n (%) | 327 | 113 (34.6%) | 214 (65.4%) | |
| Age, years | 69.66 (67.90, 71.56) | 70.26 (68.45, 71.94) | 69.27 (67.50, 71.42) | 0.01* |
| Ethnicity, n (%) | 0.98 | |||
| NZ European/other | 310 (94.8) | 107 (94.7) | 203 (94.9) | |
| Māori/Pacific | 8 (2.4) | 3 (2.7) | 5 (2.3) | |
| Asian | 9 (2.8) | 3 (2.7) | 6 (2.8) | |
| Height, cm | 166.70 (160.20, 173.00) | 176.90 (171.90, 180.90) | 163.40 (158.50, 167.50) | <0.01** |
| Body weight, kg | 71.10 (63.20, 81.45) | 81.45 (73.70, 89.30) | 66.95 (59.52, 74.60) | <0.01** |
| Body mass index, kg/m2 | 25.62 (23.05, 28.18) | 26.35 (24.32, 28.27) | 25.26 (22.69, 28.08) | 0.02* |
| Highest level of education, n (%) | <0.01** | |||
| No qualification | 6 (1.8) | 1 (0.9) | 5 (2.3) | |
| Secondary | 68 (20.8) | 14 (12.4) | 54 (25.2) | |
| Post-secondary | 136 (41.6) | 44 (38.9) | 92 (43.0) | |
| University | 117 (35.8) | 54 (47.8) | 63 (29.4) | |
| Living situation, n (%) | <0.01** | |||
| Alone | 97 (29.7) | 14 (12.4) | 83 (38.8) | |
| With others | 230 (70.3) | 99 (87.6) | 131 (61.2) |
aContinuous values are expressed as median (25th, 75th percentile). bCategorical values are expressed as frequency (percentage). Sex difference at **p < 0.01, *p < 0.05.
Daily energy, macronutrient, and protein intake in older adults are shown in Table 2. In terms of percentage of energy intake (EI), females consumed significantly less carbohydrate (p = 0.01) but more total fats (p = 0.04) than males. Absolute protein intake per day was lower for females (74.71 g/day) than for males (95.86 g/day) (p < 0.01) and accounted for 16.9% and 16.7% of their energy intakes, respectively (p = 0.45). Median (25th, 75th percentile) relative protein intake was 1.2 (0.9, 1.4) g/kg BW in males and 1.1 (0.9, 1.3) g/kg BW in females (p = 0.37). Two (3.7%) males and no females aged 65 to 70 years consumed less than the EAR for protein, while 13 (22%) males and 8 (8.9%) females older than 70 years consumed less than the EAR (25). Over half of the participants did not meet the intake of≥1.2 g/kg BW to maximally stimulate MPS (61.7% females and 56.6% males) (Table 2).
Table 2
Median daily energy, macronutrient, and protein intake in older adults by sexa,b
| Nutrient | Total | Males | Females | p-value |
| Energy intake, kJ/day | 7911 (6717, 9271) | 9239 (7920, 10730) | 7434 (6344, 8460) | <0.01** |
| Carbohydrate, g/day | 186.9 (147.1, 225.9) | 222.9 (185.2, 262.6) | 173.1 (136.4, 201.4) | <0.01** |
| Carbohydrate % EI | 39.38 (34.34, 44.39) | 41.61 (35.11, 45.62) | 38.60 (34.03, 43.57) | 0.01* |
| Total fat, g/day | 76.67 (63.60, 94.12) | 90.84 (69.45, 107.71) | 72.91 (61.71, 86.36) | <0.01** |
| Total fat % EI | 36.71 (32.93, 40.89) | 35.69 (31.38, 40.11) | 37.41 (33.89, 41.13) | 0.04* |
| Protein intake, g/day | 79.21 (67.26, 97.19) | 95.86 (77.52, 107.16) | 74.71 (63.41, 87.86) | <0.01** |
| Protein % EI | 16.83 (15.12, 18.99) | 16.68 (14.89, 18.76) | 16.89 (15.28, 19.09) | 0.45 |
| Protein intake, g/kg BW/day | 1.12 (0.94, 1.35) | 1.16 (0.94, 1.40) | 1.09 (0.94, 1.32) | 0.37 |
| Protein intakec<0.60 g/kg BW for females or<0.68 g/kg BW for males, n (%) | 2 (1.1) | 2 (3.7) | 0 (0.0) | <0.01** |
| Protein intaked<0.75 g/kg BW for females or<0.86 g/kg BW for males, n (%) | 21 (14.1) | 13 (22) | 8 (8.9) | <0.01** |
| Protein intake < 1.2 g/kg BW, n (%) | 196 (59.9) | 64 (56.6) | 132 (61.7) | <0.01** |
aContinuous values are expressed as median (25th, 75th percentile). bCategorical values are expressed as frequency (percentage). cThe Australia and New Zealand estimated average requirements (EAR) for adults aged between 65 and 70 years (n = 178). dThe Australia and New Zealand estimated average requirements (EAR) for older adults aged 70 years or more (n = 149). Sex difference at **p < 0.01, *p < 0.05. Abbreviations: Body weight (BW), energy intake (EI).
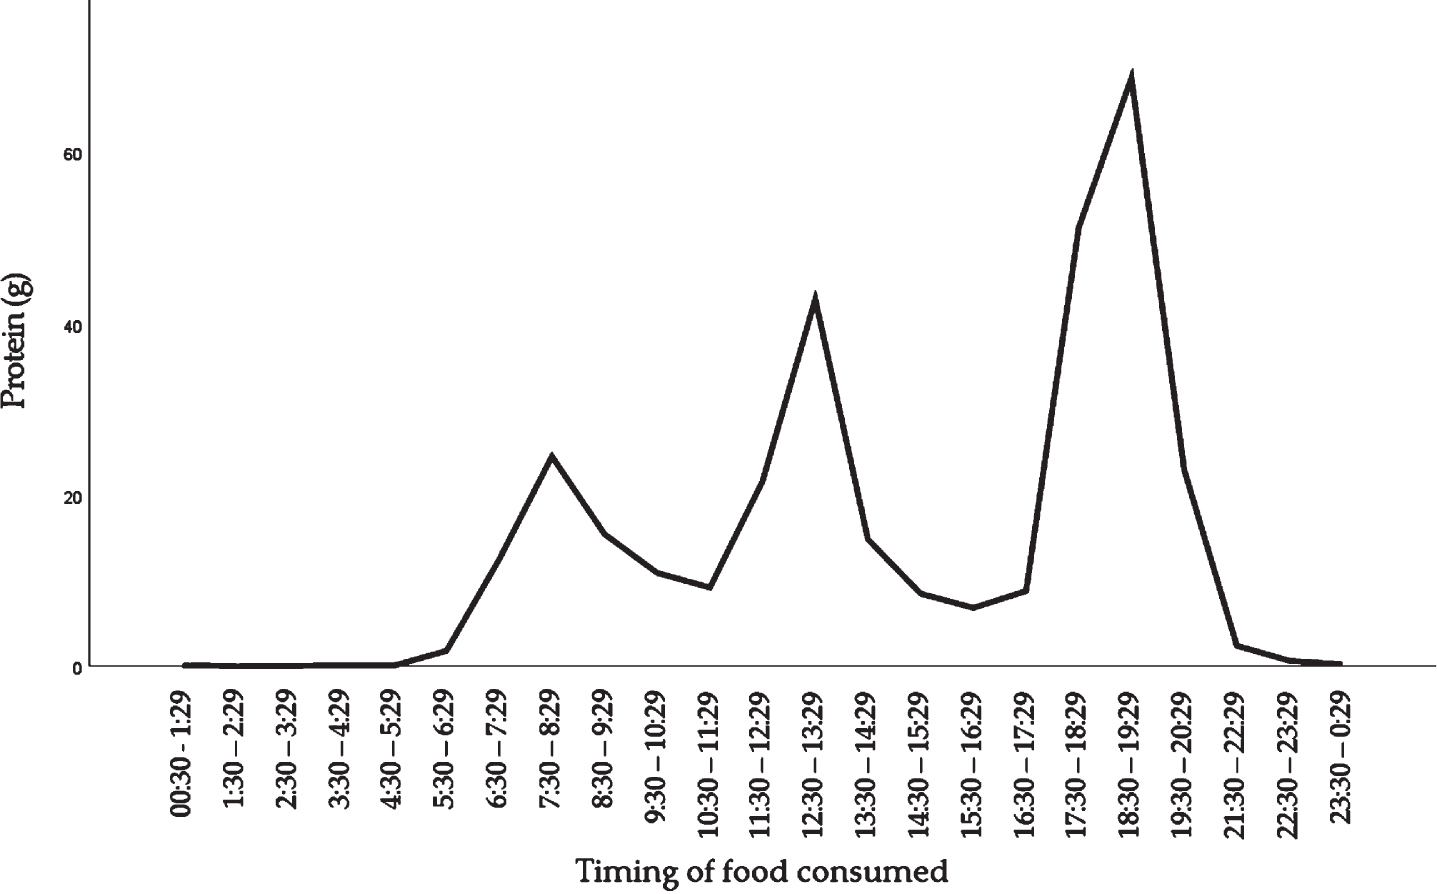
The time of day at which protein was consumed is shown in Fig. 1. The amount of protein consumed differed across hours of the day, with peaks between 05 : 30 and 11 : 29 hours (mostly breakfast), 11 : 30 and 16 : 29 (mostly the mid-day meal) and 16 : 30 and 21 : 29 (mostly the evening meal).
Fig. 1
Distribution of dietary protein intake across the day in community-dwelling older adults.
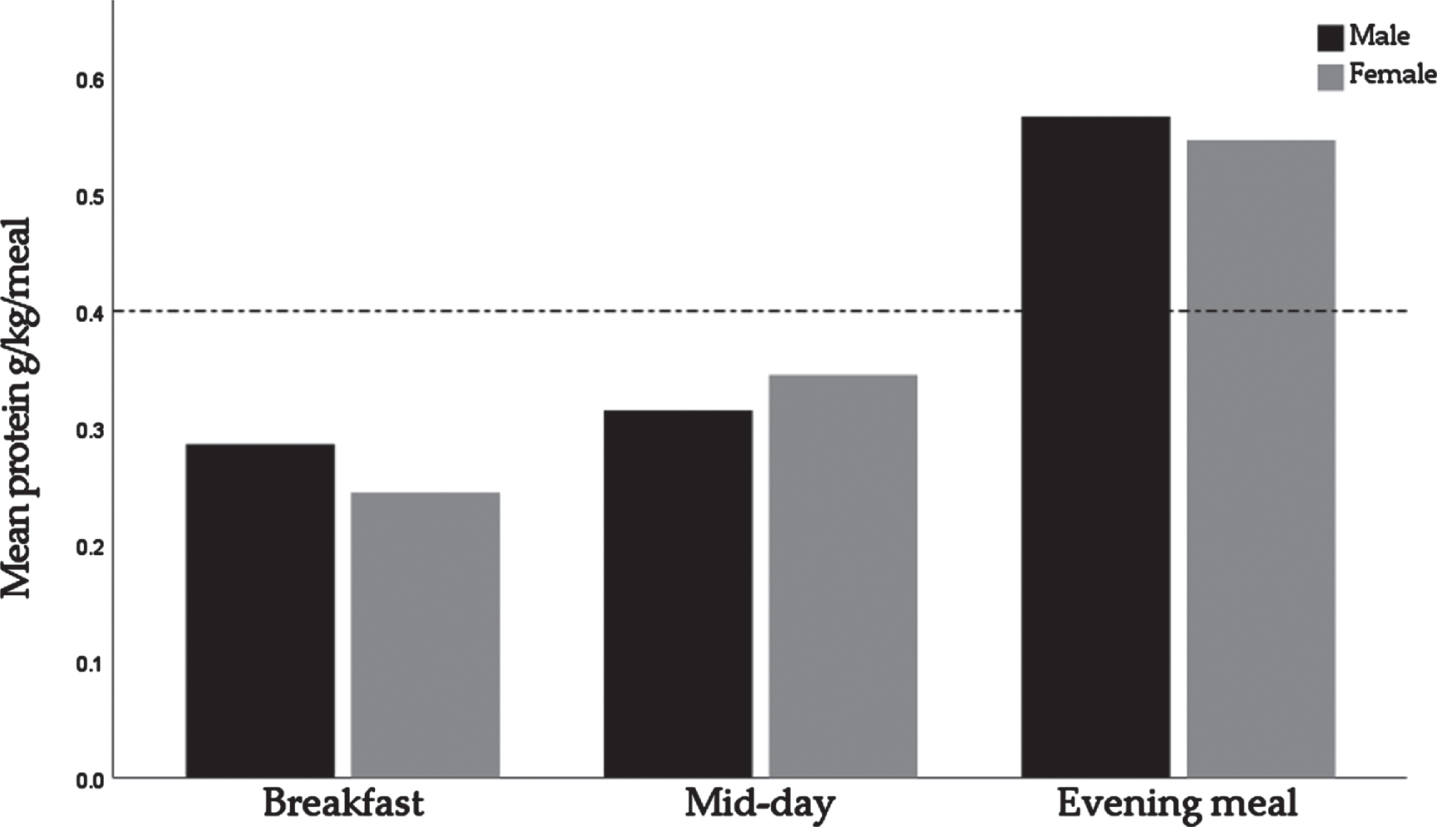
Protein intake was unevenly distributed across the day, as indicated by a mean CV of 0.48±0.22 in males and 0.48±0.23 in females. For males, the mean±SD protein intakes at breakfast, the mid-day meal, and the evening meal were 0.29±0.14 g/kg BW, 0.31±0.13 g/kg BW, and 0.57±0.20 g/kg BW, respectively. For females, the mean±SD protein intakes were 0.24±0.12 g/kg BW, 0.35±0.14 g/kg BW, and 0.55±0.18 g/kg BW respectively (Fig. 2).
Fig. 2
Relative protein intakes for breakfast, the mid-day meal, and the evening meal, by sex. The dotted line represents the suggested protein intake for maximal muscle protein synthesis stimulation of 0.4 g/kg BW/day.
Intake and relative contribution of protein from different food sources at each meal are shown in Table 3. Plant proteins were the main proteins at breakfast and the mid-day meal (53% and 49%, respectively), while meat was the main proteins at the evening meal (56%). At breakfast, participants primarily consumed protein from milk (5 g), breakfast cereal (4 g), and bread (2 g). Protein intake at the mid-day meal was mainly from bread (4 g), cheese (2 g), and milk (2 g). At the evening meal, the main sources of protein were red meat, poultry, and fish and shellfish (9 g, 6 g, and 6 g, respectively).
Table 3
Average intake and relative contribution of protein from different food sources at each meal
| Sources of protein | Breakfast | Mid-day meal | Evening meal | |||
| Protein | Relative | Protein | Relative | Protein | Relative | |
| intake, | contribution | intake, | contribution | intake, | contribution | |
| g/meal | of protein, % | g/meal | of protein, % | g/meal | of protein, % | |
| Meat | 0.70 ± 1.93 | 3.07 ± 7.80 | 6.88 ± 7.01 | 25.73 ± 21.22 | 23.13 ± 11.98 | 55.99 ± 19.18 |
| Red meat | 0.06±0.54 | 0.28±2.72 | 1.62±4.11 | 5.27±11.65 | 8.96±9.07 | 21.22±19.50 |
| Poultry | 0.04±0.55 | 0.13±1.38 | 1.46±3.42 | 5.18±11.49 | 6.26±7.48 | 15.15±16.89 |
| Fish and shellfish | 0.07±0.49 | 0.39±3.12 | 1.97±3.32 | 7.73±13.13 | 5.53±6.70 | 13.58±15.03 |
| Processed meat | 0.50±1.62 | 2.13±6.60 | 1.78±3.11 | 7.30±12.41 | 2.32±3.92 | 5.88±9.74 |
| Animal fat | 0.03±0.96 | 0.15±0.57 | 0.05±0.15 | 0.22±0.78 | 0.06±0.16 | 0.16±0.49 |
| Dairy and eggs | 8.33 ± 5.70 | 44.05 ± 20.78 | 5.90±4.46 | 25.40 ± 17.72 | 4.69±4.03 | 12.54 ± 11.11 |
| Milk | 5.31±4.80 | 28.06±20.08 | 2.05±2.23 | 9.24±10.68 | 1.28±1.75 | 3.35±4.78 |
| Cheese | 0.34±1.00 | 1.79±5.26 | 2.30±3.10 | 9.49±11.27 | 1.81±2.59 | 4.59±6.47 |
| Yoghurt | 1.22±2.28 | 6.60±10.73 | 0.21±0.82 | 0.99±3.73 | 0.36±1.02 | 1.02±3.10 |
| Eggs and egg products | 1.46±2.79 | 7.60±14.28 | 1.33±2.28 | 5.69±9.61 | 1.25±2.07 | 3.57±5.98 |
| Plant | 9.52 ± 5.46 | 52.88 ± 21.10 | 10.84±5.27 | 48.87 ± 20.68 | 11.75±5.38 | 31.48 ± 15.49 |
| Bread | 2.12±2.71 | 12.15±16.09 | 3.92±3.05 | 17.46±14.42 | 1.23±2.04 | 3.39±5.76 |
| Breakfast cereal | 4.25±4.40 | 21.61±19.46 | 0.17±1.53 | 0.70±5.83 | 0.06±0.35 | 0.15±0.85 |
| Vegetables | 0.18±0.88 | 0.90±3.65 | 1.14±1.71 | 4.93±7.35 | 3.45±2.64 | 9.30±7.38 |
| Soups, bouillon | 0.02±0.27 | 0.08±1.14 | 0.93±3.00 | 3.84±10.50 | 0.46±1.47 | 1.38±4.65 |
| Fruits | 0.83±0.87 | 5.75±9.01 | 0.74±0.76 | 4.03±8.24 | 0.47±0.60 | 1.33±1.86 |
| Potato, kumara, taro, and | 0.03±1.17 | 0.13±0.69 | 0.26±0.73 | 1.21±4.87 | 1.34±1.35 | 3.41±3.28 |
| other root vegetables | ||||||
| Pasta, rice, other grains | 0.06±0.45 | 0.36±2.43 | 0.40±1.23 | 1.74±6.00 | 1.41±1.98 | 3.60±5.02 |
| Plant-based milks and cream | 0.14±0.60 | 0.97±4.22 | 0.02±0.14 | 0.08±0.51 | 0.03±0.20 | 0.10±0.76 |
| Soy products | 0.00±0.00 | 0.00±0.00 | 0.04±0.38 | 0.17±1.62 | 0.21±1.10 | 0.69±4.26 |
| Nuts and seeds | 0.85±1.72 | 4.91±9.91 | 0.89±2.08 | 3.66±7.48 | 0.81±1.72 | 2.10±4.36 |
| Biscuits | 0.10±0.29 | 0.61±1.75 | 0.18±0.37 | 0.83±1.79 | 0.18±0.42 | 0.48±1.13 |
| Cakes and desserts | 0.50±1.14 | 2.93±7.63 | 1.16±1.80 | 5.64±9.90 | 0.43±0.86 | 1.22±2.67 |
| Snacks | 0.16±0.83 | 0.76±3.01 | 0.53±1.05 | 2.56±6.05 | 0.50±0.88 | 1.35±2.57 |
| Sugar and confectionery | 0.17±0.51 | 0.95±2.64 | 0.18±0.42 | 0.74±1.74 | 0.37±0.78 | 0.97±2.13 |
| Alcoholic beverages | 0.00±0.02 | 0.004±0.06 | 0.05±0.19 | 0.25±1.05 | 0.26±0.44 | 0.64±0.98 |
| Non-alcoholic beverages | 0.08±0.27 | 0.66±3.50 | 0.09±0.32 | 0.38±1.19 | 0.06±0.19 | 0.16±0.48 |
| Vegetable oils | 0.01±0.03 | 0.04±0.22 | 0.02±0.11 | 0.09±0.74 | 0.04±0.25 | 0.10±0.65 |
| Sauces and spices | 0.01±0.04 | 0.08±2.29 | 0.13±0.54 | 0.57±2.52 | 0.44±1.04 | 1.12±2.53 |
Values are expressed as mean±SD.
Table 4 shows the results of the multivariable logistic regression models for prediction of protein intake≥0.4 g/kg BW at breakfast (n = 39), the mid-day meal (n = 87), and the evening meal (n = 266). Of the 27 food groups, bread, breakfast cereal, milk, and yoghurt were predictors of having a protein intake≥0.4 g/kg BW at breakfast. At the mid-day meal cheese, eggs and egg products, fish and shellfish, milk, nuts and seeds, poultry, red meat, and vegetables were significantly associated with high protein intake (≥0.4 g/kg BW/meal). The multivariable logistic regression model for prediction of protein intake≥0.4 g/kg BW at the evening meal included poultry, red meat, fish and shellfish, and processed meat.
Table 4
Final model for prediction of protein intake≥0.4 g/kg BW at each meal
| β a | S.E. | Wald | Sig.b | Exp (β)c | |
| Model Breakfast | |||||
| Constant | –6.161 | 0.724 | 72.415 | <0.0001 | 0.002 |
| Food group (g/day)d | |||||
| Bread | 0.339 | 0.079 | 18.215 | <0.0001 | 1.403 |
| Breakfast cereals | 0.219 | 0.045 | 23.370 | <0.0001 | 1.245 |
| Milk | 0.214 | 0.045 | 22.510 | <0.0001 | 1.239 |
| Yoghurt | 0.289 | 0.076 | 14.478 | <0.0001 | 1.336 |
| Model Mid-day meal | |||||
| Constant | –4.475 | 0.486 | 84.610 | <0.0001 | 0.011 |
| Food group (g/day)d | |||||
| Cheese | 0.210 | 0.055 | 14.586 | <0.0001 | 1.234 |
| Eggs and egg products | 0.268 | 0.069 | 14.920 | <0.0001 | 1.308 |
| Fish and shellfish | 0.195 | 0.048 | 16.450 | <0.0001 | 1.215 |
| Milk | 0.266 | 0.071 | 13.819 | <0.0001 | 1.304 |
| Nuts and seeds | 0.335 | 0.081 | 16.945 | <0.0001 | 1.399 |
| Poultry | 0.244 | 0.051 | 22.521 | <0.0001 | 1.276 |
| Red meat | 0.174 | 0.043 | 16.546 | <0.0001 | 1.190 |
| Vegetables | 0.294 | 0.086 | 11.831 | 0.001 | 1.342 |
| Model Evening meal | |||||
| Constant | –1.127 | 0.355 | 10.096 | 0.001 | 0.324 |
| Food group (g/day)d | |||||
| Red meat | 0.117 | 0.025 | 22.657 | <0.0001 | 1.124 |
| Processed meat | 0.207 | 0.060 | 11.750 | 0.001 | 1.229 |
| Poultry | 0.129 | 0.030 | 18.188 | <0.0001 | 1.138 |
| Fish and shellfish | 0.166 | 0.037 | 19.999 | <0.0001 | 1.180 |
a β, unstandardised regression coefficient. b P-value <0.01 considered significant. cExp (β), exponentiation of the β coefficient, an odds ratio. S.E., standard error; Wald, Wald statistic. dFood items from the four-day food record were collapsed into 27 food groups.
4Discussion
This study aimed to investigate protein intake, distribution, and sources in community-dwelling older adults living in New Zealand. The current EAR for protein in Australia and New Zealand was met by most participants, whereas a high proportion of older adults did not meet the protein threshold of≥1.2 g/kg BW/day. As expected, an uneven distribution of protein intake was observed, which was insufficient to reach 0.4 g/kg BW/meal at breakfast (for both males and females) and at the mid-day meal for males. We found milk, breakfast cereals, and bread were the main sources of proteins at breakfast; bread, cheese, and milk at the mid-day meal, with meat providing over half the protein at the evening meal. In addition, we revealed that the probability of having a high protein intake at meal times increased with the consumption of bread, breakfast cereal, milk, and yoghurt at breakfast; cheese, eggs and egg products, fish and shellfish, milk, nuts and seeds, poultry, red meat, and vegetables at the mid-day meal; and poultry, red meat, fish and shellfish, and processed meat at the evening meal.
4.1Prevalence of low protein intake
Protein intake can be presented as absolute grams (g), grams per kilogram body weight (g/kg BW), grams per kilogram of ideal body weight (g/kg IBW), or as a percentage of total energy (% EI). Recommended intakes for protein in older adults differ between the USA [47], Japan [48], Nordic countries [49], Australia and New Zealand [25], which limits the interpretation of findings in the current study. A study conducted in age-advanced M
We found 62% of females and 57% of males had a low protein intake of < 1.2 g/kg BW. We also showed that protein intake was inadequate for reaching 0.4 g/kg BW/meal at breakfast for both males and females and at the mid-day meal for males. These findings suggest that a high proportion of older adults are at a potential risk of insufficient protein for optimal MPS stimulation through the day.
4.2Distribution of protein intake
Different approaches have been used to define meals [52]. In this study, we used a time-of-day approach, using the time of intake provided by participants. We found that the highest peaks for eating protein occurred between 05 : 30 and 11 : 29, 11 : 30 and 16 : 29, and 16 : 30 and 21 : 29 hours, which we defined as breakfast, the mid-day meal, and the evening meal, respectively. Using the same approach, Cardon-Thomas et al. found that similar peaks for eating protein occurred between 05 : 00 and 11 : 00 (breakfast), 11 : 00 and 16 : 00 (lunch), and 16 : 00 and 23 : 59 (dinner) [36].
When we analysed the distribution of protein intake across breakfast, the mid-day meal, and the evening meal, we found an uneven distribution of protein intake (CV = 0.48 in both males and females), with the highest amount of protein being consumed at the evening meal and the lowest at breakfast. This finding is consistent with observations from British [36], Dutch [53], and USA [54] studies of older adults. Studies from Mexico [55], Germany [35], and France [56] in older adults also found an uneven distribution of protein intake, but with the highest amount of protein being consumed at the mid-day meal. Variation can be explained by the cultural and eating habits of each country.
4.3Relative contribution of protein from different food sources
Within five hours of eating a meal containing protein, approximately 55% of dietary protein-derived amino acids of that protein circulate in blood [57]. About 20% of these amino acids will be absorbed in muscle tissue to stimulate MPS and/or provide the precursors for de novo MPS [58–60]. There are key amino acids more available in animal-based proteins that are crucial to healthier aging, and are known to enhance MPS simulation in older adults compared with plant proteins [30, 34, 61]. Identifying dietary protein sources at each meal could be an important step towards novel strategies to increase MPS at each meal in older adults. In the present study, participants primarily consumed protein from milk, breakfast cereal, and bread at breakfast; bread, cheese, and milk at mid-day; and meat-derived proteins (red meat, poultry, and fish and shellfish) at the evening meal. Breakfast cereals and most cereal based products are low quality proteins due to their low digestibility-corrected amino acid score [62–64]. The addition of dairy products such as milk to the breakfast meal results in a meal that contains high-quality proteins, which might enhance MPS in older adults [63].
4.4Sources of protein determining high protein intake
Mendonça et al. demonstrated that the sources that contributed to protein intake differ between the low and the high protein intake group. Those with a low protein intake obtained relatively less protein from meat, but more from cereals than those with a high protein intake [65]. The same differences in meat and cereal consumption were found in the Newcastle 85 + Study [66]. These findings suggested that higher protein intake across the day may be associated with the consumption of certain sources of protein.
To our knowledge, this is the first study investigating the association between sources of protein and high protein intake (≥0.4 g/kg BW/meal) at each meal. Our study found the consumption of bread, breakfast cereal, milk, and yoghurt were associated with high protein intake at breakfast; cheese, eggs and egg products, fish and shellfish, milk, nuts and seeds, poultry, red meat, and vegetables were associated with high protein intake at the mid-day meal; and poultry, red meat, fish and shellfish, and processed meat were associated with high protein intake at the evening meal. The food groups and meals highlighted in the current study can be targeted in future interventions or recommendations to help increase protein intake.
5Strengths and limitations
There were significant strengths to our study. One of the main strengths was the use of food records, which are considered to be the gold standard of dietary assessment methods and are the most accurate in estimating actual habitual dietary intakes [67]. Our study also used the time-of-day approach to define the three meals in our population, as timing of meals is potentially influenced by local or cultural factors. The inclusion of community-dwelling healthy older adults in this study provided the opportunity to identify inadequate protein intake, which may help promote preventive action in early old age. However, the findings of this study also have various limitations. Firstly, our study population was not representative of the New Zealand population as a whole, therefore the results cannot be generalised to the rest of to the New Zealand population. Our findings are representative of healthy, community-dwelling older adults, and so provide little insight into the dietary protein requirements of sub-populations of older adults, such as frail older adults, those in residential care, or those who are hospitalised. Finally, as with all dietary assessment instruments, food records are restricted to participant self-report. Although self-reported and subjective opinions provide valuable insights, they may be affected by social desirability bias and hypothetical bias, and, hence, may not accurately represent actual behaviour.
6Conclusion
In this study, the protein intake for a high proportion of older adults was less than 1.2 g/kg BW, and was unevenly distributed through the day, being obtained from cereals and dairy products at breakfast and the mid-day meal, and meat sources at the evening meal. Identifying which sources of protein are associated with meeting a protein intake of 0.4 g/kg BW/meal has the potential to facilitate targeted dietary advice for older adults. Future research should focus on the sources and timing of protein intake, so as to develop effective protein dietary interventions that enable maximal MPS across the day, with the potential to increase muscle mass in older adults.
Conflict of interest
The authors have no conflicts of interest to report.
Acknowledgments
We thank the REACH team, including Owen Mugridge and Cassie Slade for managing the recruitment of participants and data collection; and Cherise Pendergrast, Kimberley Brown, Harriet Guy, Angela Yu, and Nicola Gillies for assistance with data collection and data entry.
Funding
Funding was provided by a Health Research Council of New Zealand Emerging Researcher Grant: 17/566 –Beck: Optimising cognitive function: The role of dietary and lifestyle patterns.
References
[1] | Statistics New Zealand. Population projection tables. Wellington, New Zealand: New Zealand Government. Available from: https://www.stats.govt.nz; 2019. |
[2] | Statistics New Zealand. New Zealand’s 65+ population. A statistical volume, Wellington. 2007. |
[3] | Schlussel MM , dos Anjos LA , de Vasconcellos MT , Kac G . Reference values of handgrip dynamometry of healthy adults: a population-based study. Clinical Nutrition. (2008) ;27: (4):601–7. |
[4] | Al-Abdulwahab SS . The effects of aging on muscle strength and functional ability of healthy Saudi Arabian males. Annals of Saudi Medicine. (1999) ;19: (3):211–5. |
[5] | Granic A , Davies K , Jagger C , Kirkwood TB , Syddall HE , Sayer AA . Grip strength decline and its determinants in the very old: longitudinal findings from the Newcastle 85+study. PLoS One. (2016) ;11: (9):e0163183. |
[6] | Bassey EJ , Harries UJ . Normal values for handgrip strength in 920 men and women aged over 65 years, and longitudinal changes over 4 years in 620 survivors. Clinical Science. (1993) ;84: (3):331–7. |
[7] | Aniansson A , Hedberg M , Henning GB , Grimby G . Muscle morphology, enzymatic activity, and muscle strength in elderly men: a follow-up study. Muscle Nerve. (1986) ;9: (7):585–91. |
[8] | Batsis JA , Germain CM , Vásquez E , Bartels SJ . Prevalence of weakness and its relationship with limitations based on the Foundations for the National Institutes for Health project: data from the Health and Retirement Study. European Journal of Clinical Nutrition. (2016) ;70: (10):1168–73. |
[9] | Duchowny KA , Clarke PJ , Peterson MD . Muscle weakness and physical disability in older Americans: longitudinal findings from the U.S. Health and Retirement study. The Journal of Nutrition, Health & Aging. (2018) ;22: (4):501–7. |
[10] | Hiol AN , von Hurst PR , Conlon CA , Mugridge O , Beck KL . Body composition associations with muscle strength in older adults living in Auckland, New Zealand. PLoS One. (2021) ;16: (5):e0250439. |
[11] | Bohé J , Low A , Wolfe RR , Rennie MJ . Human muscle protein synthesis is modulated by extracellular, not intramuscular amino acid availability: a dose-response study. The Journal of Physiology. (2003) ;552: (Pt 1):315–24. |
[12] | Bohé J , Low JF , Wolfe RR , Rennie MJ . Latency and duration of stimulation of human muscle protein synthesis during continuous infusion of amino acids. The Journal of Physiology. (2001) ;532: (Pt 2):575–9. |
[13] | Fujita S , Dreyer HC , Drummond MJ , Glynn EL , Cadenas JG , Yoshizawa F , et al. Nutrient signalling in the regulation of human muscle protein synthesis. The Journal of Physiology. (2007) ;582: (Pt 2):813–23. |
[14] | Bennet WM , Connacher AA , Scrimgeour CM , Smith K , Rennie MJ . Increase in anterior tibialis muscle protein synthesis in healthy man during mixed amino acid infusion: studies of incorporation of [1-13C]leucine. Clinical Science. (1979) ;76: (4):447–54. |
[15] | Burd NA , West DW , Rerecich T , Prior T , Baker SK , Phillips SM . Validation of a single biopsy approach and bolus protein feeding to determine myofibrillar protein synthesis in stable isotope tracer studies in humans. Nutrition & Metabolism. (2011) ;8: :15. |
[16] | Yarasheski KE , Zachwieja JJ , Bier DM . Acute effects of resistance exercise on muscle protein synthesis rate in young and elderly men and women. The American Journal of Physiology. (1993) ;265: (2 Pt 1):E210–4. |
[17] | Rooyackers OE , Adey DB , Ades PA , Nair KS . Effect of age on in vivo rates of mitochondrial protein synthesis in human skeletal muscle. Proceedings of the National Academy of Sciences of the United States of America. (1996) ;93: (26):15364–9. |
[18] | Welle S , Thornton C , Jozefowicz R , Statt M . Myofibrillar protein synthesis in young and old men. The American Journal of Physiology. (1993) ;264: (5 Pt 1):E693–8. |
[19] | Colley RC , Garriguet D , Janssen I , Craig CL , Clarke J , Tremblay MS . Physical activity of Canadian adults: accelerometer results from the to Canadian Health Measures Survey. Health Reports. (2011) ;22: (1):7–14. |
[20] | Fujita S , Rasmussen BB , Cadenas JG , Drummond MJ , Glynn EL , Sattler FR , Volpi E . Aerobic exercise overcomes the age-related insulin resistance of muscle protein metabolism by improving endothelial function and Akt/mammalian target of rapamycin signaling. Diabetes. (2007) ;56: (6):1615–22. |
[21] | Volpi E , Sheffield-Moore M , Rasmussen BB , Wolfe RR . Basal muscle amino acid kinetics and protein synthesis in healthy young and older men. Journal of the American Medical Association. (2001) ;286: (10):1206–12. |
[22] | Rafii M , Chapman K , Elango R , Campbell WW , Ball RO , Pencharz PB , et al. Dietary protein requirement of men >65 years old determined by the indicator amino acid oxidation technique is higher than the current estimated average requirement. The Journal of Nutrition. (2015) ;146: (4):681–7. |
[23] | Traylor DA , Gorissen SHM , Phillips SM . Perspective: protein requirements and optimal intakes in aging: are we ready to recommend more than the Recommended Dietary Allowance?. Advances in Nutrition. (2018) ;9: (3):171–82. |
[24] | Mamerow MM , Mettler JA , English KL , Casperson SL , Arentson-Lantz E , Sheffield-Moore M , et al. Dietary protein distribution positively influences 24-h muscle protein synthesis in healthy adults. The Journal of Nutrition. (2014) ;144: (6):876–80. |
[25] | National Health and Medical Research Council Australian Government Department of Health and Ageing. Nutrient Reference Values for Australia and New Zealand. National Health and Medical Research Council. 2006. |
[26] | Moore DR , Churchward-Venne TA , Witard O , Breen L , Burd NA , Tipton KD , et al. Protein ingestion to stimulate myofibrillar protein synthesis requires greater relative protein intakes in healthy older versus younger men. Journals of Gerontology: Series A. (2015) ;70: (1):57–62. |
[27] | Paddon-Jones D , Rasmussen BB . Dietary protein recommendations and the prevention of sarcopenia. Current Opinion in Clinical Nutrition and Metabolic Care. (2009) ;12: (1):86–90. |
[28] | Moore DR , Soeters PB . The biological value of protein. Nestle Nutrition Institute Workshop Series. (2015) ;82: :39–51. |
[29] | Wolfe RR , Rutherfurd SM , Kim IY , Moughan PJ . Protein quality as determined by the Digestible Indispensable Amino Acid Score: evaluation of factors underlying the calculation. Nutrition Reviews. (2016) ;74: (9):584–99. |
[30] | Scherz H , Senser F , Souchi SW , Germany Bundesministerium für Ernährung, Landwirtschaft und Forsten, Deutsche Forschungsanstalt für Lebensmittelchemie. Food composition and nutrition tables. Boca Raton, FL: CRC Press/Medpharm; (2000) . |
[31] | Gilbert JA , Bendsen NT , Tremblay A , Astrup A . Effect of proteins from different sources on body composition. Nutrition, Metabolism, and Cardiovascular Diseases. (2011) ;21 Suppl 2: :B16–31. |
[32] | Berrazaga I , Micard V , Gueugneau M , Walrand S . The role of the anabolic properties of plant-versus animal-based protein sources in supporting muscle mass maintenance: A critical review. Nutrients. (2019) ;11: (8):1825. |
[33] | Gilani G , Tomé D , Moughan P , Burlingame B . The assessment of amino acid digestibility in foods for humans and including a collation of published ileal amino acid digestibility data for human foods. 2011 FAO Expert Consultation Sub-Committee; 2015. |
[34] | van Vliet S , Burd NA , van Loon LJC . The skeletal muscle anabolic response to plant- versus animal-based protein consumption. The Journal of Nutrition. (2015) ;145: (9):1981–91. |
[35] | Gingrich A , Spiegel A , Kob R , Schoene D , Skurk T , Hauner H , et al. Amount, distribution, and quality of protein intake are not associated with muscle mass, strength, and power in healthy older adults without functional limitations-an enable study. Nutrients. (2017) ;9: (12):1358. |
[36] | Cardon-Thomas DK , Riviere T , Tieges Z , Greig CA . Dietary protein in older adults: adequate daily intake but potential for improved distribution. Nutrients. (2017) ;9: (3):184. |
[37] | Hung Y , Wijnhoven HAH , Visser M , Verbeke W . Appetite and protein intake strata of older adults in the European Union: socio-demographic and health characteristics, diet-related and physical activity behaviours. Nutrients. (2019) ;11: (4). |
[38] | Mumme KD , von Hurst PR , Conlon CA , Jones B , Haskell-Ramsay CF , Stonehouse W , et al. Study protocol: associations between dietary patterns, cognitive function and metabolic syndrome in older adults - a cross-sectional study. BMC Public Health. (2019) ;19: (1):535. |
[39] | Marfell-Jones M , Stewart A , De Ridder J . International standards for anthropometric assessment, Wellington, New Zealand. International Society for the Advancement of Kinanthropometry. 2012. |
[40] | Nelson M , Atkinson M , Meyer J . A photographic atlas of food portion sizes: MAFF Publications London; (1997) . |
[41] | Xyris Pty Ltd. FoodWorks 10 Premium. Brisbane, QLD, Australia: Xyris Pty Ltd. 2019;10.0 ed. |
[42] | Sivakumaran S , Huffman L , Gilmore Z . New Zealand FOODfiles 2016 manual. The New Zealand Institute for Plant & Food Research Limited and Ministry of Health. 2017. |
[43] | Willett W . Issues in analysis and presentation of dietary data, NY: Oxford University Press; (2012) :306–333. |
[44] | Bollwein J , Diekmann R , Kaiser MJ , Bauer JM , Uter W , Sieber CC , et al. Distribution but not amount of protein intake is associated with frailty: a cross-sectional investigation in the region of Nürnberg. Nutrition Journal. (2013) ;12: :109. |
[45] | University of Otago and Ministry of Health. A Focus on nutrition: key findings of the 2008/09 New Zealand Adult Nutrition survey. Wellington: Ministry of Health. 2011. |
[46] | IBM Corp (2020). IBM SPSS Statistics for Macintosh VA, NY, IBM Corp. |
[47] | Trumbo P , Schlicker S , Yates AA , Poos M . Dietary reference intakes for energy, carbohydrate, fiber, fat, fatty acids, cholesterol, protein and amino acids. Journal of the American Dietetic Association. (2002) ;102: (11):1621–30. |
[48] | Tsuboyama-Kasaoka N , Takizawa A , Tsubota-Utsugi M , Nakade M , Imai E , Kondo A , et al. Dietary intake of nutrients with adequate intake values in the dietary reference intakes for Japanese. Journal of Nutritional Science and Vitaminology. (2013) ;59: (6):584–95. |
[49] | Nordic Nutrition Recommendations 2012: Integrating nutrition and physical activity. Nordic Nutrition Recommendations. 1-627. |
[50] |
Ram A
,
Kerse N
,
Moyes SA
,
Muru-Lanning M
,
Wham C
. Dietary protein intake and determinants in Máori and Non-M
|
[51] | Takehara S , Hirani V , Wright FAC , Naganathan V , Blyth FM , Le Couteur DG , et al. Appetite, oral health and weight loss in community-dwelling older men: an observational study from the Concord Health and Ageing in Men Project (CHAMP). BMC Geriatrics. (2021) ;21: (1):255. |
[52] | Leech RM , Worsley A , Timperio A , McNaughton SA . Understanding meal patterns: definitions, methodology and impact on nutrient intake and diet quality. Nutrition Research Reviews. (2015) ;28: (1):1–21. |
[53] | Tieland M , Borgonjen-Van den Berg KJ , Van Loon LJ , de Groot LC . Dietary protein intake in Dutch elderly people: a focus on protein sources. Nutrients. (2015) ;7: (12):9697–706. |
[54] | Paddon-Jones D , Campbell WW , Jacques PF , Kritchevsky SB , Moore LL , Rodriguez NR , et al. Protein and healthy aging. The American Journal of Clinical Nutrition. (2015) ;101: (6):1339s–45s. |
[55] | Gaytán-González A , Ocampo-Alfaro MJ , Torres-Naranjo F , Arroniz-Rivera M , González-Mendoza RG , Gil-Barreiro M , et al. The consumption of two or three meals per day with adequate protein content is associated with lower risk of physical disability in Mexican adults aged 60 years and older. Geriatrics (Basel). (2020) ;5: (1). |
[56] | Rousset S , Patureau Mirand P , Brandolini M , Martin JF , Boirie Y . Daily protein intakes and eating patterns in young and elderly French. British Journal of Nutrition. (2003) ;90: (6):1107–15. |
[57] | Groen BB , Horstman AM , Hamer HM , de Haan M , van Kranenburg J , Bierau J , et al. Post-prandial protein handling: you are what you just ate. PLoS One. (2015) ;10: (11):e0141582. |
[58] | Volpi E , Kobayashi H , Sheffield-Moore M , Mittendorfer B , Wolfe RR . Essential amino acids are primarily responsible for the amino acid stimulation of muscle protein anabolism in healthy elderly adults. The American Journal of Clinical Nutrition. (2003) ;78: (2):250–8. |
[59] | Volpi E , Ferrando AA , Yeckel CW , Tipton KD , Wolfe RR . Exogenous amino acids stimulate net muscle protein synthesis in the elderly. Journal of Clinical Investigation. (1998) ;101: (9):2000–7. |
[60] | Pennings B , Koopman R , Beelen M , Senden JM , Saris WH , van Loon LJ . Exercising before protein intake allows for greater use of dietary protein-derived amino acids for de novo muscle protein synthesis in both young and elderly men. The American Journal of Clinical Nutrition. (2011) ;93: (2):322–31. |
[61] | Gorissen SH , Horstman AM , Franssen R , Crombag JJ , Langer H , Bierau J , et al. Ingestion of wheat protein increases in vivo muscle protein synthesis rates in healthy older men in a randomized trial. The Journal of Nutrition. (2016) ;146: (9):1651–9. |
[62] | Shewry PR . Improving the protein content and composition of cereal grain. Journal of Cereal Science. (2007) ;46: (3):239–50. |
[63] | Fanelli NS , Bailey HM , Guardiola LV , Stein HH . Values for Digestible Indispensable Amino Acid Score (DIAAS) determined in pigs are greater for milk than for breakfast cereals, but DIAAS values for individual ingredients are additive in combined meals. The Journal of Nutrition. (2021) ;151: (3):540–7. |
[64] | Adhikari S , Schop M , de Boer IJM , Huppertz T . Protein quality in perspective: a review of protein quality metrics and their applications. Nutrients. (2022) ;14: (5). |
[65] | Hengeveld LM , Pelgröm ADA , Visser M , Boer JMA , Haveman-Nies A , Wijnhoven HAH . Comparison of protein intake per eating occasion, food sources of protein and general characteristics between community-dwelling older adults with a low and high protein intake. Clinical Nutrition ESPEN. (2019) ;29: :165–74. |
[66] | Mendonca N , Granic A , Mathers JC , Hill TR , Siervo M , Adamson AJ , et al. Prevalence and determinants of low protein intake in very old adults: insights from the Newcastle 85+ Study. European Journal of Nutrition. (2018) ;57: (8):2713–22. |
[67] | Gibson RS . Principles of nutritional assessment: Oxford University Press, USA; (2005) . |


