
Western-style diet does not negatively affect the healthy aging benefits of lifelong restrictive feeding
Abstract
BACKGROUND:
Lifelong consumption of a Western-style diet is a risk factor for developing metabolic disorders and therefore impairs healthy aging. Dietary restriction (DR) could delay the onset of age-related diseases and prolong life span, however, the extent to which this depends on diet type is poorly understood.
OBJECTIVE:
To study whether feeding a Western-style diet affects the healthy aging benefits of DR.
METHODS:
Mice fed a Western-style diet (ad libitum and DR) were compared to those fed a standard healthy diet (ad libitum and DR). Survival and several metabolic and endocrine parameters were analyzed.
RESULTS:
Lifelong consumption of a Western-style diet resulted in increased adiposity, elevated triglyceride levels in plasma, higher homeostatic model assessment-insulin resistance and higher resting metabolic rate in mice compared to the standard diet group. This was accompanied by reduced survival in the Western-style diet group. DR irrespective of diet type improved abovementioned parameters.
CONCLUSIONS:
Lifelong restricted consumption of Western-style diet led to improved metabolic and endocrine parameters, and increased survival compared to the ad libitum Western-style diet group. Interestingly, the survival was comparable in restricted Western-style and standard diet groups, suggesting that reduced food intake rather than diet composition play more important role in promoting longevity/survival.
1Introduction
Aging and obesity are worldwide health issues affecting millions of people [1]. It is known that lifestyle can considerably impact aging phenotypes [2, 3]. Overconsumption of an unhealthy diet, including fat and sugar (known as a Western-style diet), is a major risk factor for development of metabolic disorders and known to reduce sustainable health in humans [4] and rodent models [5–7]. Being accustomed to such a diet clearly advances aging and mortality [8–10] compared to eating a diet low in saturated fat and refined sugar and high in fiber content. At present, however, it is not clear whether the negative effects of a chronic intake of a Western-style diet would also occur if the daily amount eaten would be restricted. It is well established that daily dietary restriction (DR) without undernutrition extends life span and delays the onset of age-related diseases in a wide range of animal models [11–14], but the dependency on dietary nutrient composition has not been studied extensively.
It has been hypothesized that the life-prolonging effect of DR is due to growth retardation with maintenance of growth potential [15], prevention of excess body fat accumulation [16], and/or a shift in biological state from cell proliferation and reproduction to maintenance pathways [17]. In addition, DR may prevent or delay metabolic changes [18]. For instance, DR improves insulin sensitivity during aging [19, 20], which may be linked to lower age-dependent fat accumulation [21, 22]. DR also up-regulates some metabolic pathways in the liver, including gluconeogenesis, fatty acid β-oxidation, and ketogenesis [23].
Metabolic flexibility, the ability to efficiently adapt metabolism depending on demand or supply [24], is essential to maintain energy homeostasis in times of DR [25]. DR induces a new state of energy balance where the metabolic rate has been adapted to the lower intake and stored lipids inside adipocytes are more rapidly used as substrates [26]. DR has proven to be effective in augmenting metabolic flexibility in animal studies [27] and major regulators of metabolic flexibility play dominant roles in aging [28]. In addition, metabolic flexibility is inversely related to age [29].
Only a few studies focused on whether effects of DR depend on feeding a Western-style diet, which is in fact more relevant to the current dietary status in most developed countries. These studies were all relatively short-term studies (8 to 14 weeks), and resulted in an improvement of metabolic health at younger age [30, 31], as measured by fasting plasma insulin, glucose tolerance, serum cholesterol, leptin, triglyceride (TG), and adiponectin levels. At older age (11-months old rats [18]), DR of a Western-style diet resulted in lower weight gain but this effect did not result in a decrease in lipid accumulation in plasma and skeletal muscle, systemic insulin resistance, or changes in plasma and skeletal muscle metabolites.
In the present study we investigated if the impaired longevity (i.e., survival) of mice with lifelong consumption of a Western-style diet rich in saturated fat and refined sugar and low in fiber density could be counteracted by lifelong restricting the amount of dietary intake and compared this with the longevity of mice on a standard diet. We studied the effects of the Western-style diet and DR on body composition, energy expenditure and intake, metabolic flexibility, and several endocrine and metabolic healthparameters.
2Materials and methods
2.1Animals and experimental protocol
Male C57BL6/JOlaHsd mice (n = 495 at start of the study) (Harlan Netherlands BV, Horst, NL) were housed individually from weaning onwards (between postnatal days 21 and 28) on a 12 hours:12 hours light:dark cycle in a temperature-controlled environment (22±1°C) with access to standard low fat (LF) lab chow (LF, 6% fat, AMII 2141, 17.5 kJ/gram, HopeFarms BV, Woerden, NL) or high fat diet with lard and refined sugars (HFS, 45% fat, 4031.09, 19.1 kJ/gram, HopeFarms BV, Woerden, NL) and water. Each diet group was further subdivided into an ad libitum group (AL) or a dietary restricted group (DR). The HFS DR group received 60% of the metabolizable caloric intake of the HFS AL group. The LF DR group was split in two subgroups where one subgroup (LF DR I) received 60% of the metabolizable caloric intake of the LF AL group. The other subgroup (LF DR II) was provided with the same amount of metabolizable calories as the HFS DR group, which was about 70% of the metabolizable caloric intake of the LF AL group. The DR groups received their pre-weighted amount of food between circadian time (CT)9 and CT10 (CT12 was the beginning of the dark phase), and consumed their ‘meal’ directly after receiving it. The mice received their specific diets from weaning onwards. All methods were approved by, and in agreement with the regulations of the Institutional Animal Use and Care Committee of the University of Groningen. These regulations are consistent with the guidelines for the care and use of laboratory animals as described by the US National Institutes of Health.
Sample sizes at the beginning of the study were LF AL: n = 119, LF DR I: n = 74, LF DR II: n = 62, HFS AL: n = 118 and HFS DR: n = 122. These numbers declined during the study because of planned sacrifices of cohorts at different life stages (n = 64). Body weight and energy intake were assessed every 3 weeks, at this time point also the food intake of the DR groups was reassessed. At 6, 12, 18 and 24 months, subgroups of mice were analyzed by indirect calorimetry and/or sacrificed to analyze body composition, plasma content of endocrine and metabolic parameters, and TG content of liver. For the remaining mice, age was recorded at spontaneous death or age at sacrifice due to humane endpoints. With respect to the latter, regulations of the Institutional Animal Use and Care Committee of the University of Groningen require that animals should be sacrificed when they show signs of poor general health, including sudden and severe weight loss (≥15% within two to three days), in combination with either bad appearance, severe scratching, eye/teeth/anal problems, evident cancer, or vestibular deficit/tilted head. These indicators are predictors of death within a few days and as such shifted survival curves to the left (i.e., compared to the situation in which animals would die naturally) by at most a few days.
2.2Indirect calorimetry measurements
About two weeks before intended sacrifice at 6, 12, 18 and 24 months, sub-cohorts of mice were placed in a respirometry chamber where oxygen consumption (VO2, ml/hr) and carbon dioxide production (VCO2, ml/hr) were recorded for each individual mouse for ~2 days, starting at lights on (CT0).
The eight-channel open circuit indirect calorimetry system has been described earlier by Oklejewicz and colleagues [32]. Briefly, O2 and CO2 concentrations of dried inlet and outlet air from each chamber were measured. O2 was measured using paramagnetic O2 analyzer (Servomex Xentra 4100, Crowborough, UK) and CO2 by an infrared gas analyzer (Servomex 1440, Crowborough, UK). The system recorded the differential in O2 and CO2 between dried reference air and dried air from metabolic chambers. O2 and CO2 analyzers were calibrated using two gas mixtures with known concentrations of O2 and CO2 prior to each measurement. Flow rate of inlet air was measured with a mass flow controller (Type 5850; Brooks, Rijswijk, NL) and set at 20 l/hr. A subsample of the respiration air was passed at a rate of 6 l/hr through the drying system (3 Å molecular sieve drying beads; Merck, Darmstadt, DE) and subsequently through the gas analyzers. Data were collected every 10 minutes for each animal and automatically stored on a computer.
Energy expenditure (EE, kJ/hr, corrected for bodyweight0.75 ([33, 34]) was calculated according to the equation of Ferrannini [35]:
Resting metabolic rate (RMR) was measured as the lowest EE during the total 24 hours of measurement under normal conditions. During the first day of indirect calorimetry (which started at CT0), all mice were fed according to their regular regimens. For that purpose the respirometry boxes were opened shortly between CT9 and CT10 to measure the bodyweights of the mice and to deliver the restricted amounts of food (for DR mice) or measure the food taken from the hoppers (of the AL mice). During the second day, a starvation challenge was imposed on the AL mice. For that purpose, the respirometry box was opened again at CT9, and after bodyweights were assessed, food of the AL mice was removed, while the DR mice received their normal restricted amount. Metabolic flexibility of DR mice and AL mice (the latter both under fasted and non-fasted conditions) was calculated as the difference in EE in the hour after CT21 (i.e., towards the end of the dark phase) relative to the EE in the hour after CT12 (i.e., start of the dark phase), as well as average RQ differences between these two hours. After CT22 on the second day, all mice returned to their home cages, where their normal food regimens were reinstated.
2.3Bomb calorimetry measurements
The feces of mice were collected from the saw-dust bedding and weighed for 48 hours. The caloric content of the feces was measured by bomb calorimetry. A known amount of benzoic acid (energy content of 26.44 kJ/gram) was combusted in the bomb calorimeter. Following, samples of the feces were combusted and compared to the heat production of the reference to determine the energy content of the samples. These data, combined with the assessed energy intake, enabled us to estimate the absorption efficiency.
2.4Determination of body composition
Mice sacrificed at 6 (n = 16), 12 (n = 16), 18 (n = 16) and 24 (n = 16) months were assessed for determination of body composition. Dry and dry lean organ masses were determined by drying organs to a constant mass for 14 days at 60°C followed by fat extraction with petroleum ether (Boom BC, Meppel, NL) in a custom made soxhlet apparatus. Pieces of deeply frozen liver were weighed. For TG determination 10% homogenates (weight/volume) were prepared in ice-cold PBS (pH 7.4). Lipids were extracted according to Bligh and Dyer [36]. TG content was determined with a commercial kit (Roche Diagnostics, Mannheim, DE) according to manufacturer’s recommendations.
2.5Plasma analysis
At 4, 9, 15 and 21 months mice were fasted for 6 hours. Blood glucose concentrations, sampled by tail bleeding, were measured using a EuroFlash meter (Lifescan Benelux, Beerse, BE). Additionally, blood samples were drawn by tail bleeding into heparinized tubes, then centrifuged (4000 g for 10 minutes), and plasma was stored at –80°C. Plasma insulin values were determined using Enzyme Linked ImmunoSorbent Assay (ELISA, ALPCO Diagnostics, Salem, US) and homeostatic model assessment (HOMA) for insulin resistance (IR) was calculated according to (fasting insulin (mU/L)×fasting glucose (mM))/14.1) [37].
At different ages of sacrifice (6, 12, 18 and 24 months) a blood sample was taken by heart puncture. The mice were not fasted prior to blood sampling and all mice were under anesthesia when the blood sample was taken. Blood was collected in tubes with anti-coagulant (ethylenediaminetetraacetic acid (EDTA)). Samples were spun down at 26000 g for 15 minutes at 4°C. Plasma was collected and stored at –80°C until further analysis.
Plasma concentrations of leptin, gastric inhibitory polypeptide (GIP) and resistin were measured using Multiplex Biomarker Immunoassays for Luminex xMAP technology (Millipore, Billerica, MA, US; cat. no. MMHMAG-44K). A commercially available kit was used to measure plasma levels of total and free cholesterol (Diasys, Holzheim, DE). Cholesteryl esters were calculated from the difference between total and free cholesterol.
2.6Statistical analysis
Survival curves were generated using the product limit method of Kaplan and Meier [38]. Mice were censored at the time point of their planned sacrifice. Statistical differences between the curves were assessed using the log-rank test.
All data (with the exception of the survival curves) is expressed as averages±standard error of the mean (SEM) and were tested for normal distribution. For the evaluation of body weight and energy intake the overall statistical significance of age and treatment (diet and/or DR) was assessed using a diagonal mixed model analysis. If significant effects were found, a Bonferroni corrected mixed model analysis per time point wasperformed.
For absorption efficiency, EE, dry lean mass, fat masses of the mice, liver TG, hormones, cholesterol and glucose data the statistical significance of age and treatment (diet and/or DR) effects were assessed using two-way analysis of variance (ANOVA) with three between-subjects factors (age, diet, and restriction). Only if an interaction term between the factors was found to be significant, the effect of each factor was analyzed separately using Tukey post hoc test and indicated in the figure when significant. For EE during fasting the statistical significance of age and treatment (diet and/or DR) effects were assessed using two-way repeated measures analysis with two between-subjects factors (diet and/or DR).
Significant differences, including p-values, are indicated in the legends of the figures. If a post-hoc test was allowed, the significant differences within an age group are indicated with asterisks (*p < 0.05, **p≤0.01, ***p≤0.001).
All analyses were performed using SPSS 26.0 (SPSS Inc., Chicago, IL, US). Level of statistical significance was set at p < 0.05.
3Results
The survival characteristics of the different diet groups are shown in Fig. 1, where either survival of all mice was taken into account (Fig. 1A), or only mice that died spontaneously and not because of sacrifice due to humane endpoints (Fig. 1B). For more information on the survival characteristics, see the supplemental table (https://doi.org/10.34894/IRXDXH). In Fig. 1A and 1B, the HFS AL condition reduced survival compared to the LF AL condition irrespective of whether cases of sacrifice by humane endpoints were taken into account (p < 0.001). With respect to DR, however, a different pattern emerged. There was a significant increase in survival in DR mice compared to AL mice independent of diet (Fig. 1A LF p < 0.01, HFS p < 0.001; Fig. 1B LF and HFS p < 0.001)). In Fig. 1A, HFS DR mice had increased survival versus LF DR mice (p < 0.001). In Fig. 1B, however, this effect was lost and both LF DR and HFS DR mice had improved survival relative to AL mice (p < 0.001) and both DR groups had non-distinguishable survival levels.
Fig. 1
Kaplan-Meier survival curves of the five different experimental groups; three LF groups, one LF AL and two DR groups (LF DR I (60% restriction)) and LF DR II (same amount of Joules as HFS DR); and two HFS groups, one HFS AL and one HFS DR. Samples sizes were LF AL n = 119, LF DR I n = 74, LF DR II n = 62, HFS AL n = 118 and HFS DR n = 122. Significant differences, including p-values, are indicated in the legend. (A) includes the mice that were sacrificed because of humane endpoints, see Table 1. There was a significant reduction in survival in AL mice on an HFS diet compared to LF diet (p < 0.001, log-rank test) and there was a significant increase in survival in DR mice independent of diet (p < 0.01, log-rank test for LF; p < 0.001, log-rank test for HFS). Under DR conditions, mice on a HFS diet had a better survival compared with mice on a LF diet (p < 0.001). (B) excludes mice that were sacrificed because of humane end points (except humane endpoint which were considered to be deadly: severe weight loss/general bad appearance). There was a significant reduction in survival in AL mice on an HFS diet compared to LF diet (p < 0.001, log-rank test) and there was a significant increase in survival in DR mice compared to AL mice independent of diet (p < 0.001). The table below the figure indicates the survival proportions for the three different percentiles (25%, 50%, and 75%) of the five different experimental groups.
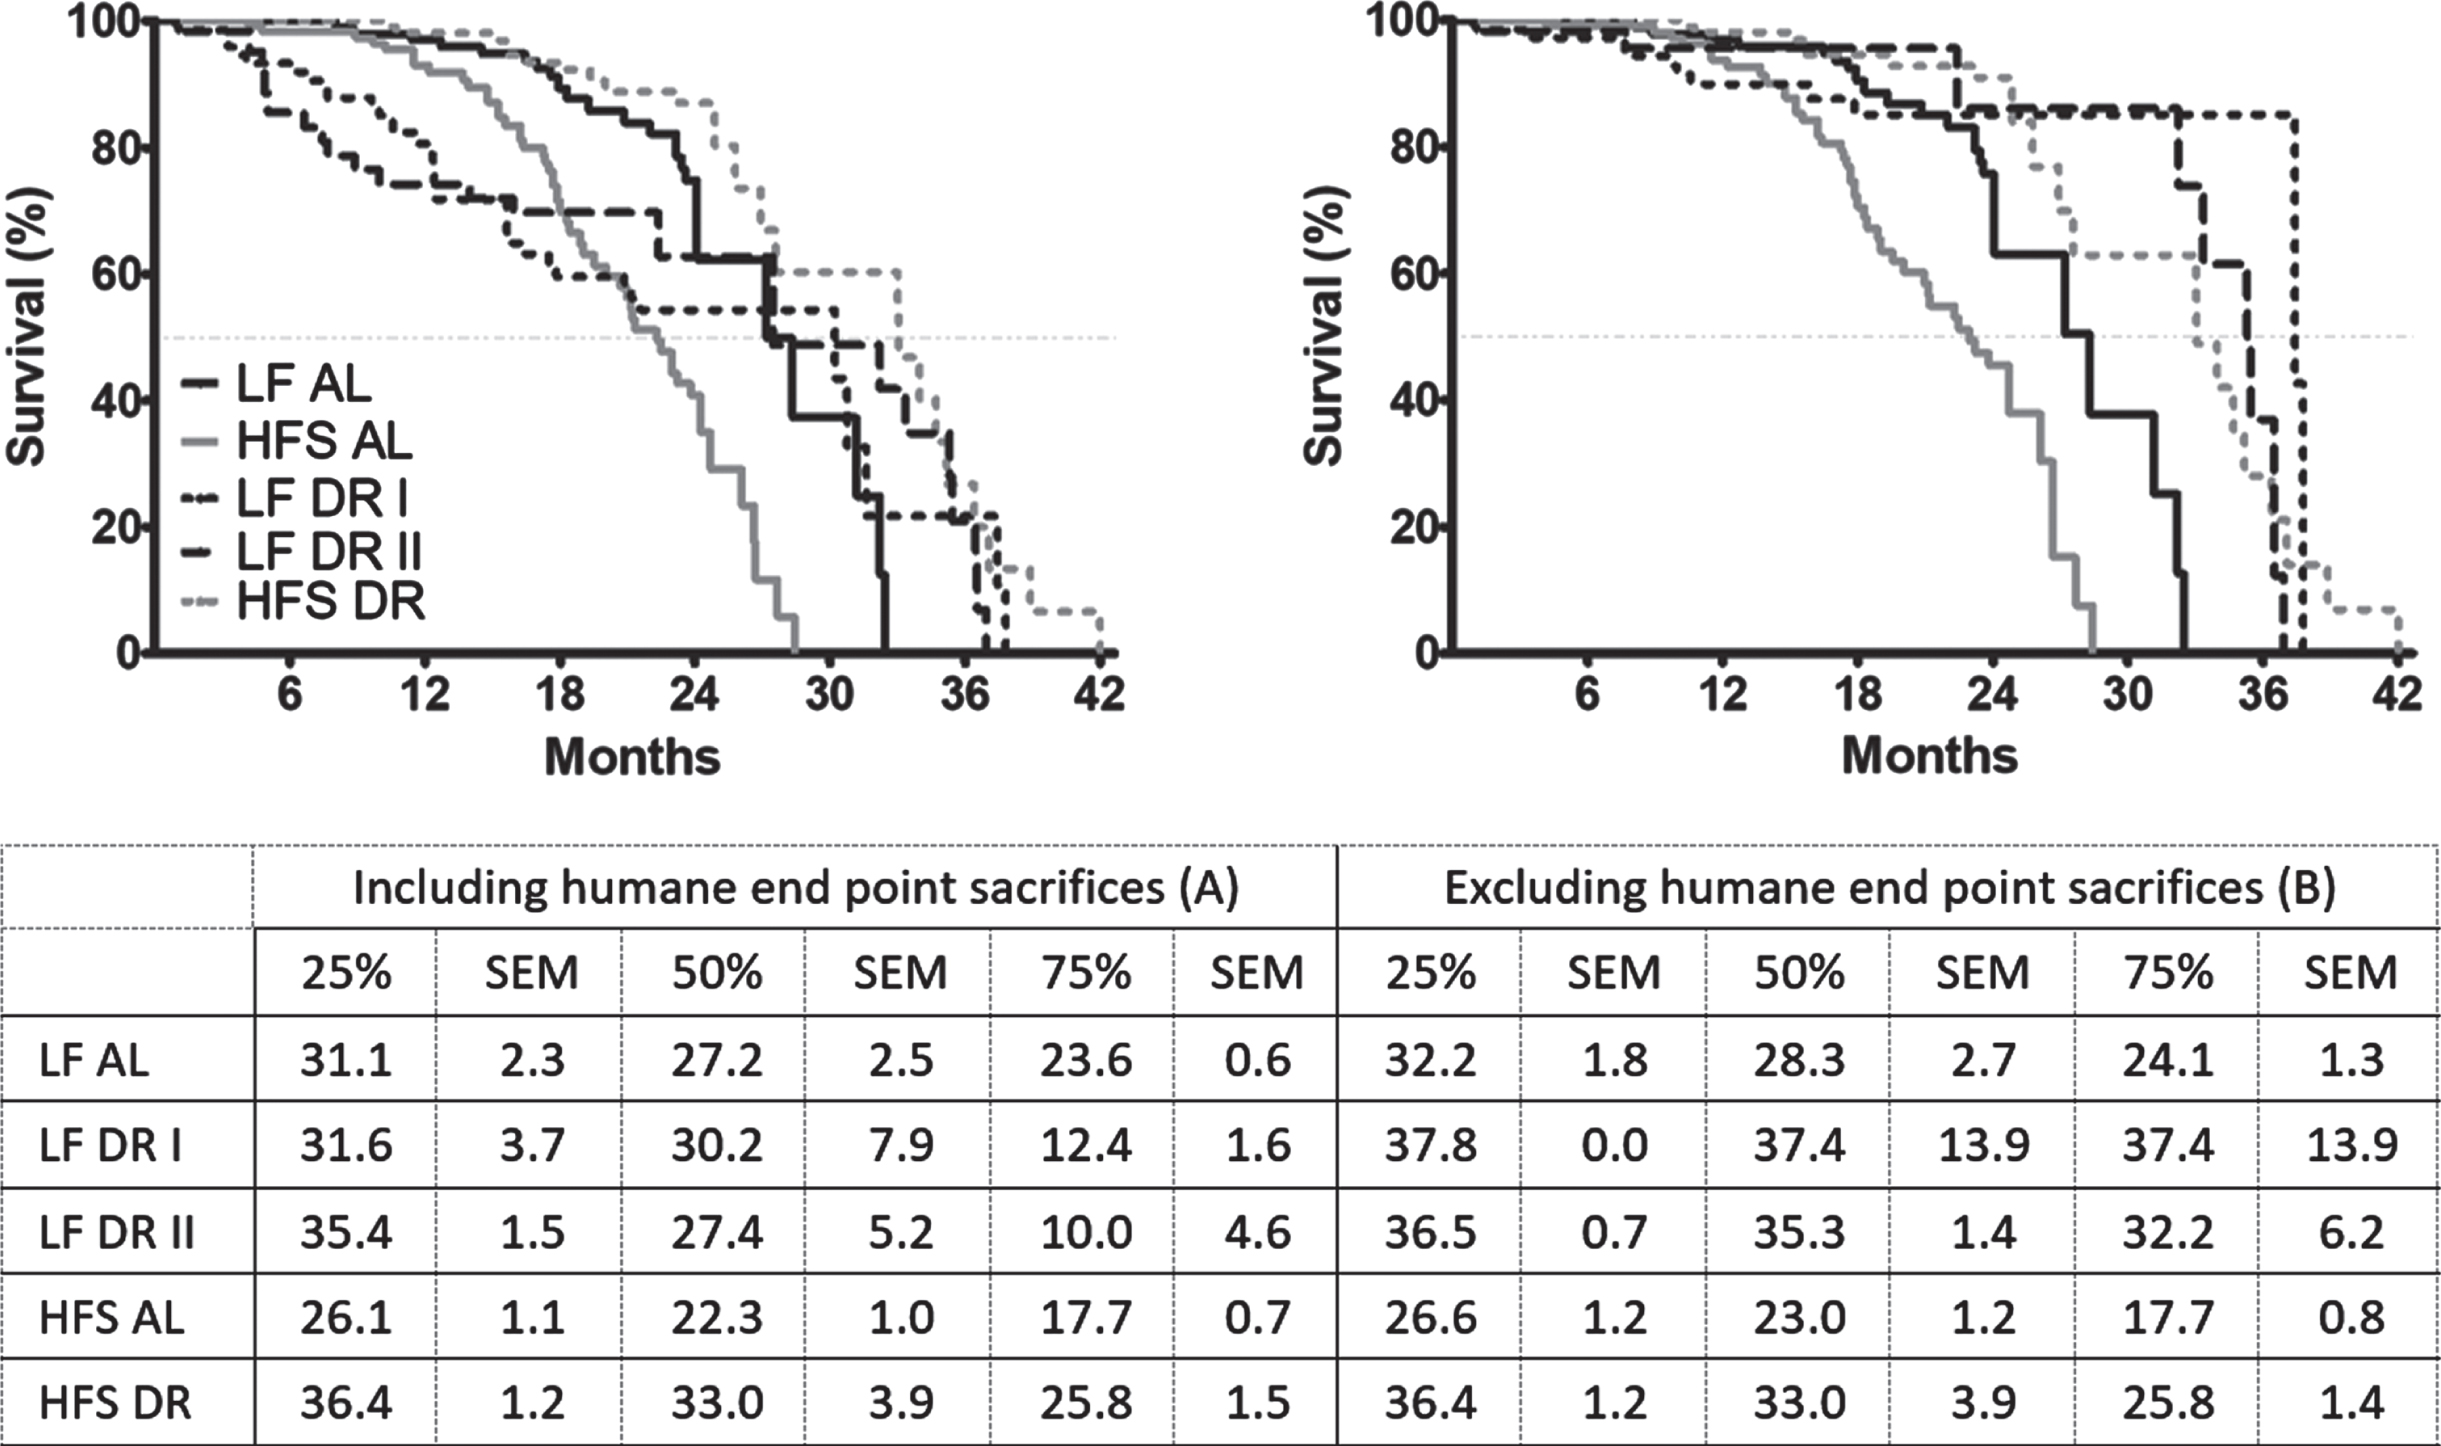
In essence, inclusion of mice sacrificed due to humane endpoints in Fig. 1A caused an unevenly strong left-shift specifically in the LF DR groups relatively to the levels seen in Fig. 1B. This was caused by a much larger proportion in the LF DR groups of mice with rectal prolapse (which was considered as one of the humane endpoints for sacrifice although rectal prolapse by itself is not deadly) relative to the HFS DR group (p < 0.001; see Table 1). Other causes of sacrifice based on humane endpoints were sudden weight loss, which was more pronounced in HFS diet groups compared to LF diet groups (p < 0.001) and more in AL groups compared to DR groups (p < 0.001). Scratching as cause of death was more pronounced in AL groups compared to DR groups (p < 0.01).
Table 1
On the rows the different experimental groups are indicated, in the columns the sacrifice reasons or cause of death
| Severe weight loss/bad appearance (%) | Scratching wounds (%) | Rectal prolapse (%) | Eye infection (%) | Breathing problems (%) | Tilted head (%) | Experimental reasons (%) | Penile prolapse (%) | Death in cage (%) | Total | |
| LF AL (n = 119) | 7 (6%) | 4 (3%) | 1 (1%) | 11 (9%) | 23 | |||||
| LF DR I (n = 74) | 9 (12%) | 22 (30%) | 1 (1%) | 2 (3%) | 34 | |||||
| LF DR II (n = 62) | 5 (8%) | 16 (26%) | 5 (8%) | 26 | ||||||
| HFS AL (n = 118) | 32 (27%) | 6 (5%) | 1 (1%) | 2 (2%) | 1 (1%) | 1 (1%) | 5 (4%) | 48 | ||
| HFS DR (n = 122) | 10 (8%) | 2 (2%) | 1 (1%) | 1 (1%) | 7 (6%) | 21 | ||||
| Total n | 63 | 12 | 38 | 1 | 3 | 2 | 2 | 1 | 30 | 152 |
Weight loss as cause of death was more pronounced in HFS groups compared to LF groups (p < 0.001) and more in AL groups versus DR groups (p < 0.001). Rectal prolapse as cause of death was more pronounced in LF groups compared to HFS groups (p < 0.001) and more in DR groups compared to AL groups (p < 0.001). Scratching as reason for sacrifice was more pronounced in AL groups versus DR groups (p < 0.01). Planned sacrifices (6, 12, 18 and 24 months) are excluded from these results.
There were no differences in body weight at weaning between groups (data not shown). Thereafter, AL groups had a higher body weight compared to DR groups irrespective of diet (p < 0.001, Fig. 2A). HFS DR mice had a higher body weight compared to LF DR mice (p < 0.001), LF DR I (p < 0.001) and LF DR II (p < 0.001) mice had a lower body weight compared to the HFS DR mice, although the LF DR II mice caught up to the same weight as HFS DR mice by the age of 12 months (Bonferonni corrected time point analysis). Although the number of mice per group was smaller after 24 months, there is an indication that the body weight of the HFS AL group returned to a comparable body weight as the LF AL group at 27 months of age. The body weight of the LF AL group also decreased, but not as steep as that of the HFS AL group (data not shown). The energy intake for the different experimental groups can be found in Fig. 2B.
Fig. 2
(A) Body weight development measured over life time and indicated every 1.5 months. Significant differences, including p-values, are indicated in the legend. If a post hoc test was allowed, the significant differences within an age group are indicated with asterisks (*p < 0.05, **p≤0.01, ***p≤0.001). LF DR at 6 and 18 months is LF DR II and at 12 and 24 months is LF DR I. There was a significant reduction of body weight in DR mice, in AL mice body weight was lower in mice on a LF diet compared to mice on a HFS diet. DR mice with comparable calories (LF DR II and HFS DR) had comparable body weights at the end of their first year, before and after that body weight was higher in the HFS DR group. Data are averages from n = 12-104 mice per group; +SEM (B) Average 3 or 6 months energy intake. Energy intake was higher in HFS mice compared to LF mice (p < 0.001); energy intake of LF DR I was 60% of the LF AL group; energy intake of HFS DR group was 60% of the HFS AL group; energy intake of LF DR II was comparable with the HFS DR group. Data are averages from n = 12-104 mice per group; +SEM (C) Absorption efficiencies for the experimental groups at four different time points (LF DR at 6 and 18 months is LF DR II and at 12 and 24 months is LF DR I). Absorption efficiencies were higher in mice on HFS diet compared to mice on a LF diet and lower in DR mice versus AL mice. Data are averages from n = 2-3 mice per group; +SEM. (D) Average EE corrected for body weight0.75 over 24 hours. Overall there were diet×restriction (p < 0.001), diet×age (p = 0.001), restriction×age (p < 0.001), and diet×restriction×age (p < 0.001) interactions. (E) RMR corrected for body weigth0.75. Overall there were diet×restriction (p = 0.001), diet×age (p = 0.001), restriction×age (p < 0.001), and diet×restriction×age (p < 0.001). Data are averages from n = 3–8 mice per group; +SEM.
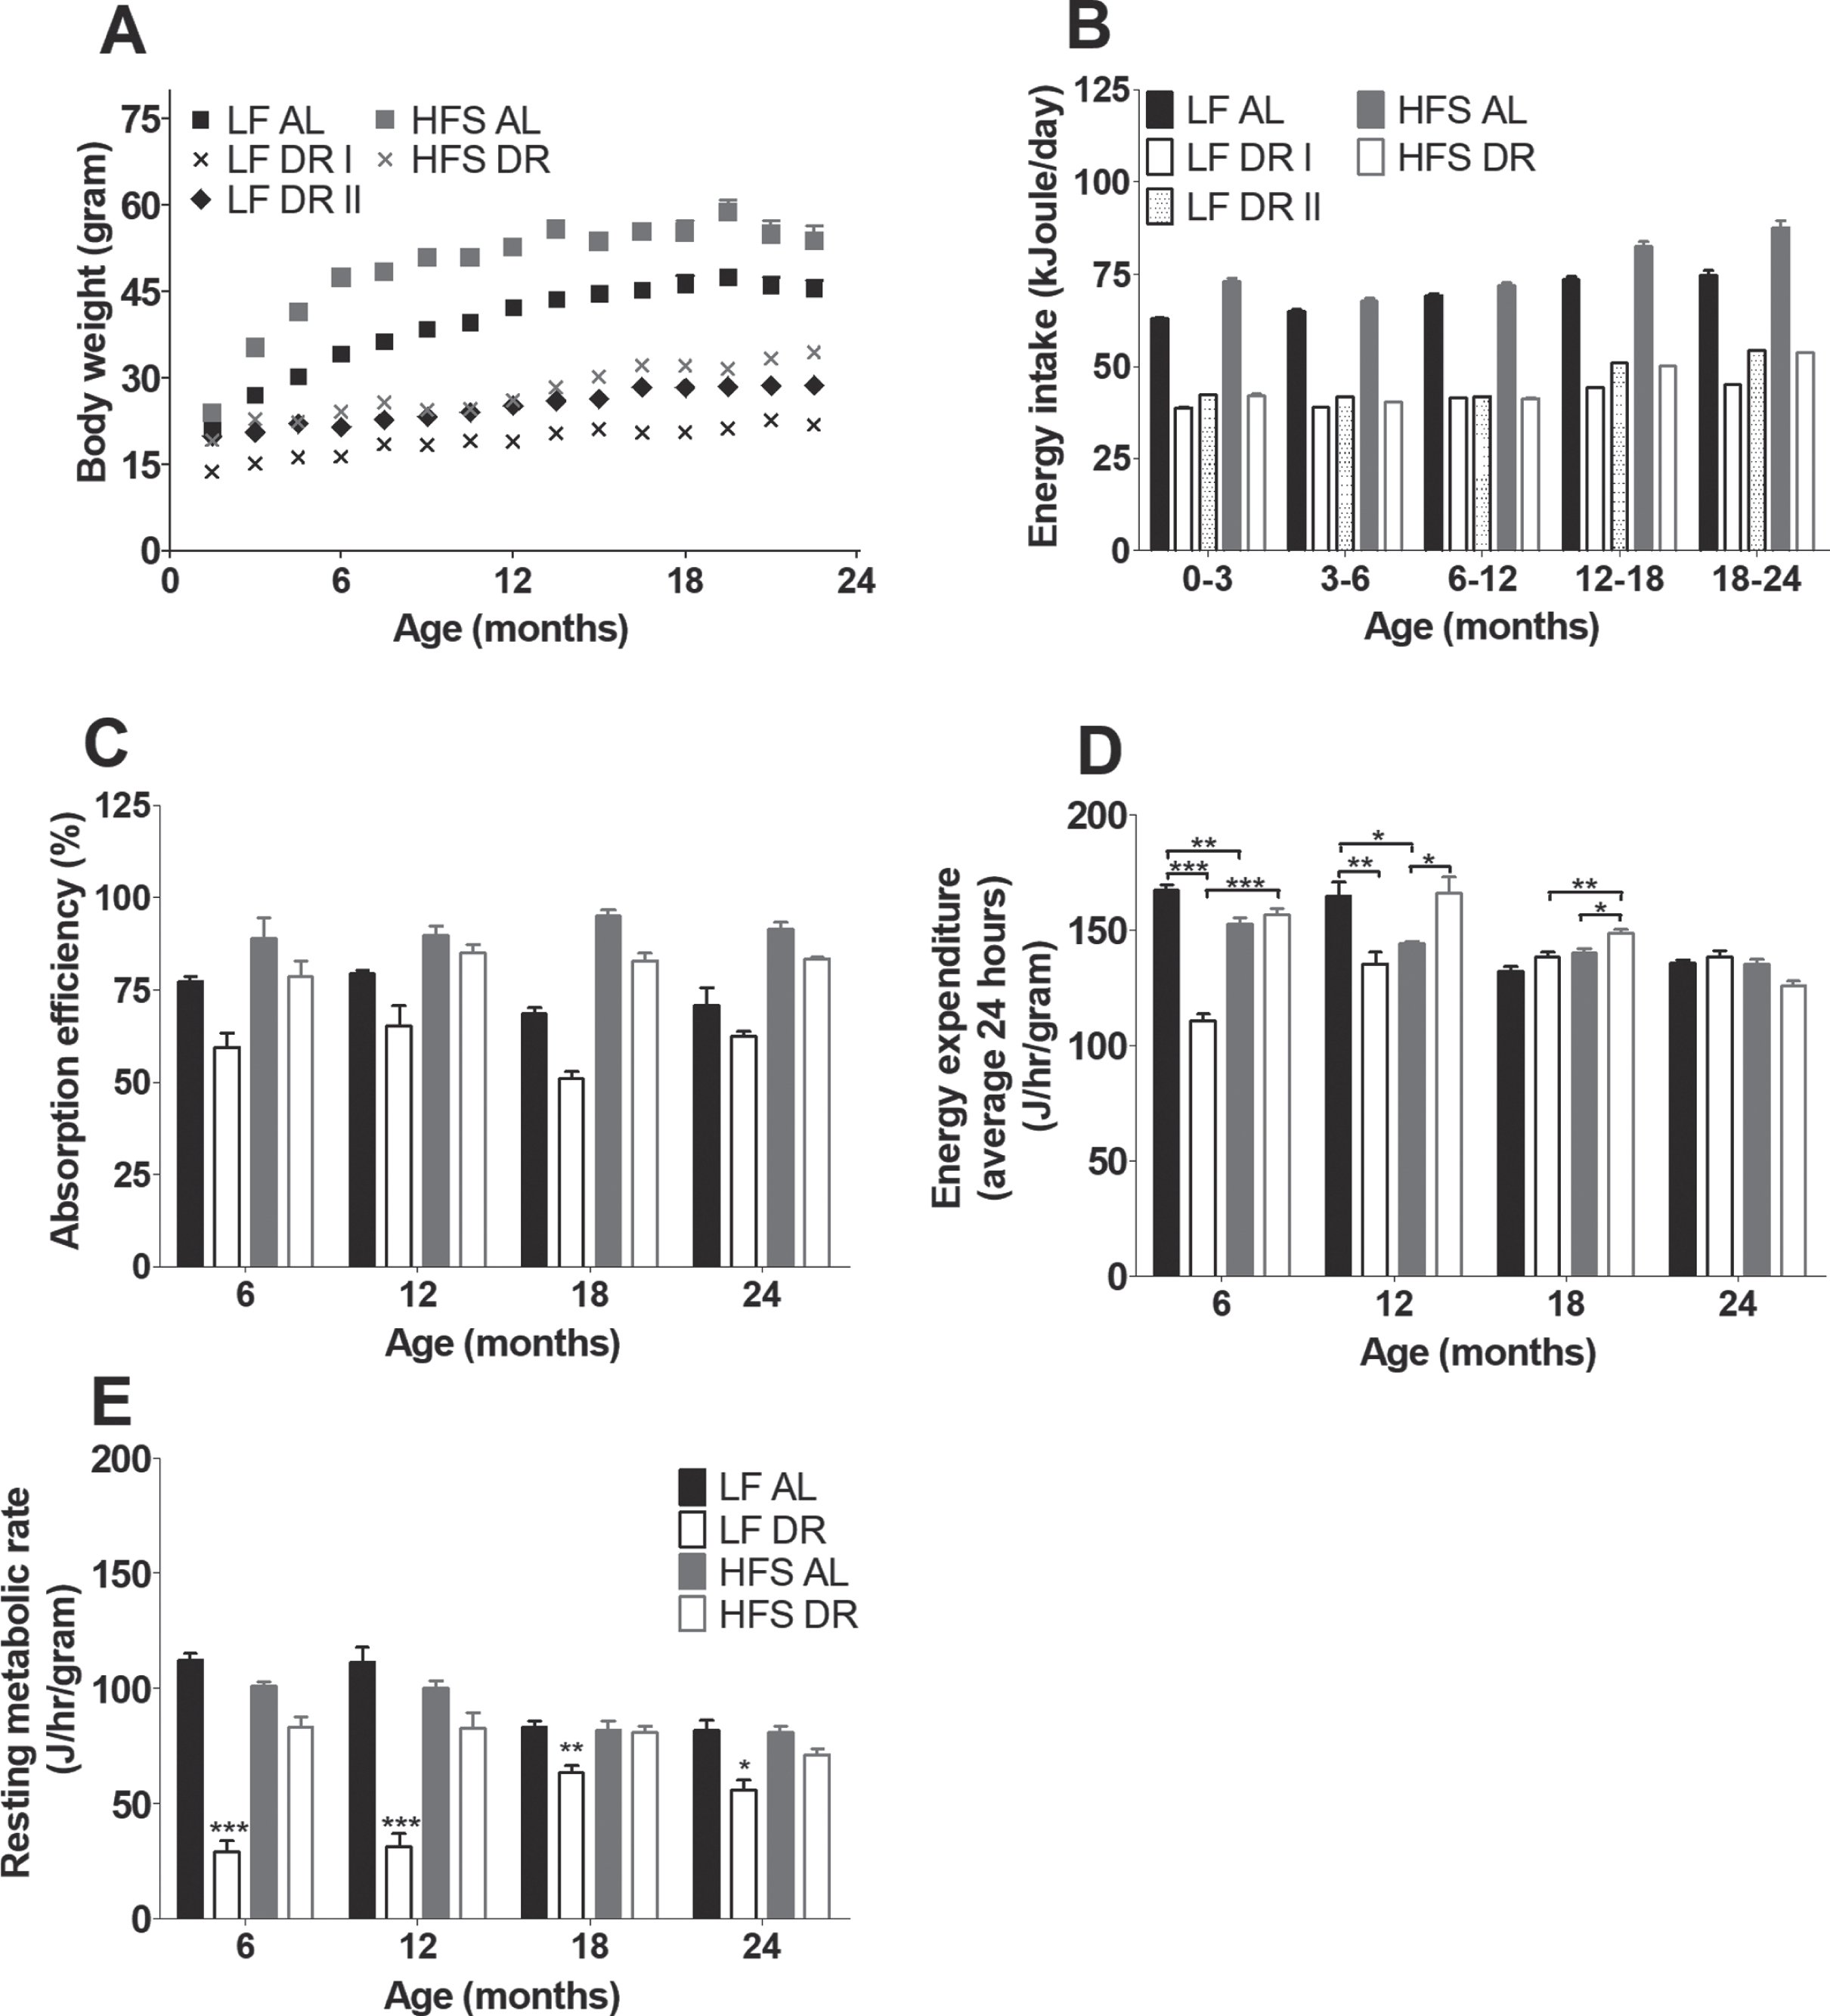
For the metabolic parameters that were assessed in both LF DR groups there were no differences found between both (LF DR I and LF DR II) groups. For that reason the DR groups are combined from Fig. 2C onwards in one figure; time points 6 and 18 months consist of LF DR I, time points 12 and 24 months consist of LF DR II. Energy absorption (Fig. 2C) at four different time points (6, 12, 18, and 24 months) was higher in HFS groups than in LF groups irrespective of DR (p < 0.001). DR mice were overall less efficient independent of type of diet (p < 0.001).
Average EE at 6, 12, 18, and 24 months (Fig. 2D) was lower in DR groups under LF conditions while it was higher under HFS conditions (diet×restriction interaction, p < 0.001) compared to the corresponding AL groups. EE decreased with age under AL conditions, while under DR conditions EE decreased under HFS conditions but increased under LF conditions (restriction×age (p < 0.001) and diet×age (p = 0.001)). RMR was lower in mice under DR conditions than in mice under AL conditions (p = 0.001). Comparing RMR (Fig. 2E) in both DR groups results in a higher RMR under HFS conditions (diet×restriction, p = 0.001). In addition, RMR decreased with age under AL conditions while in the DR groups, RMR increased with age under LF conditions and it was stable with age under HFS conditions (restriction×age p < 0.001, diet×age p < 0.001, and restriction diet age p < 0.001).
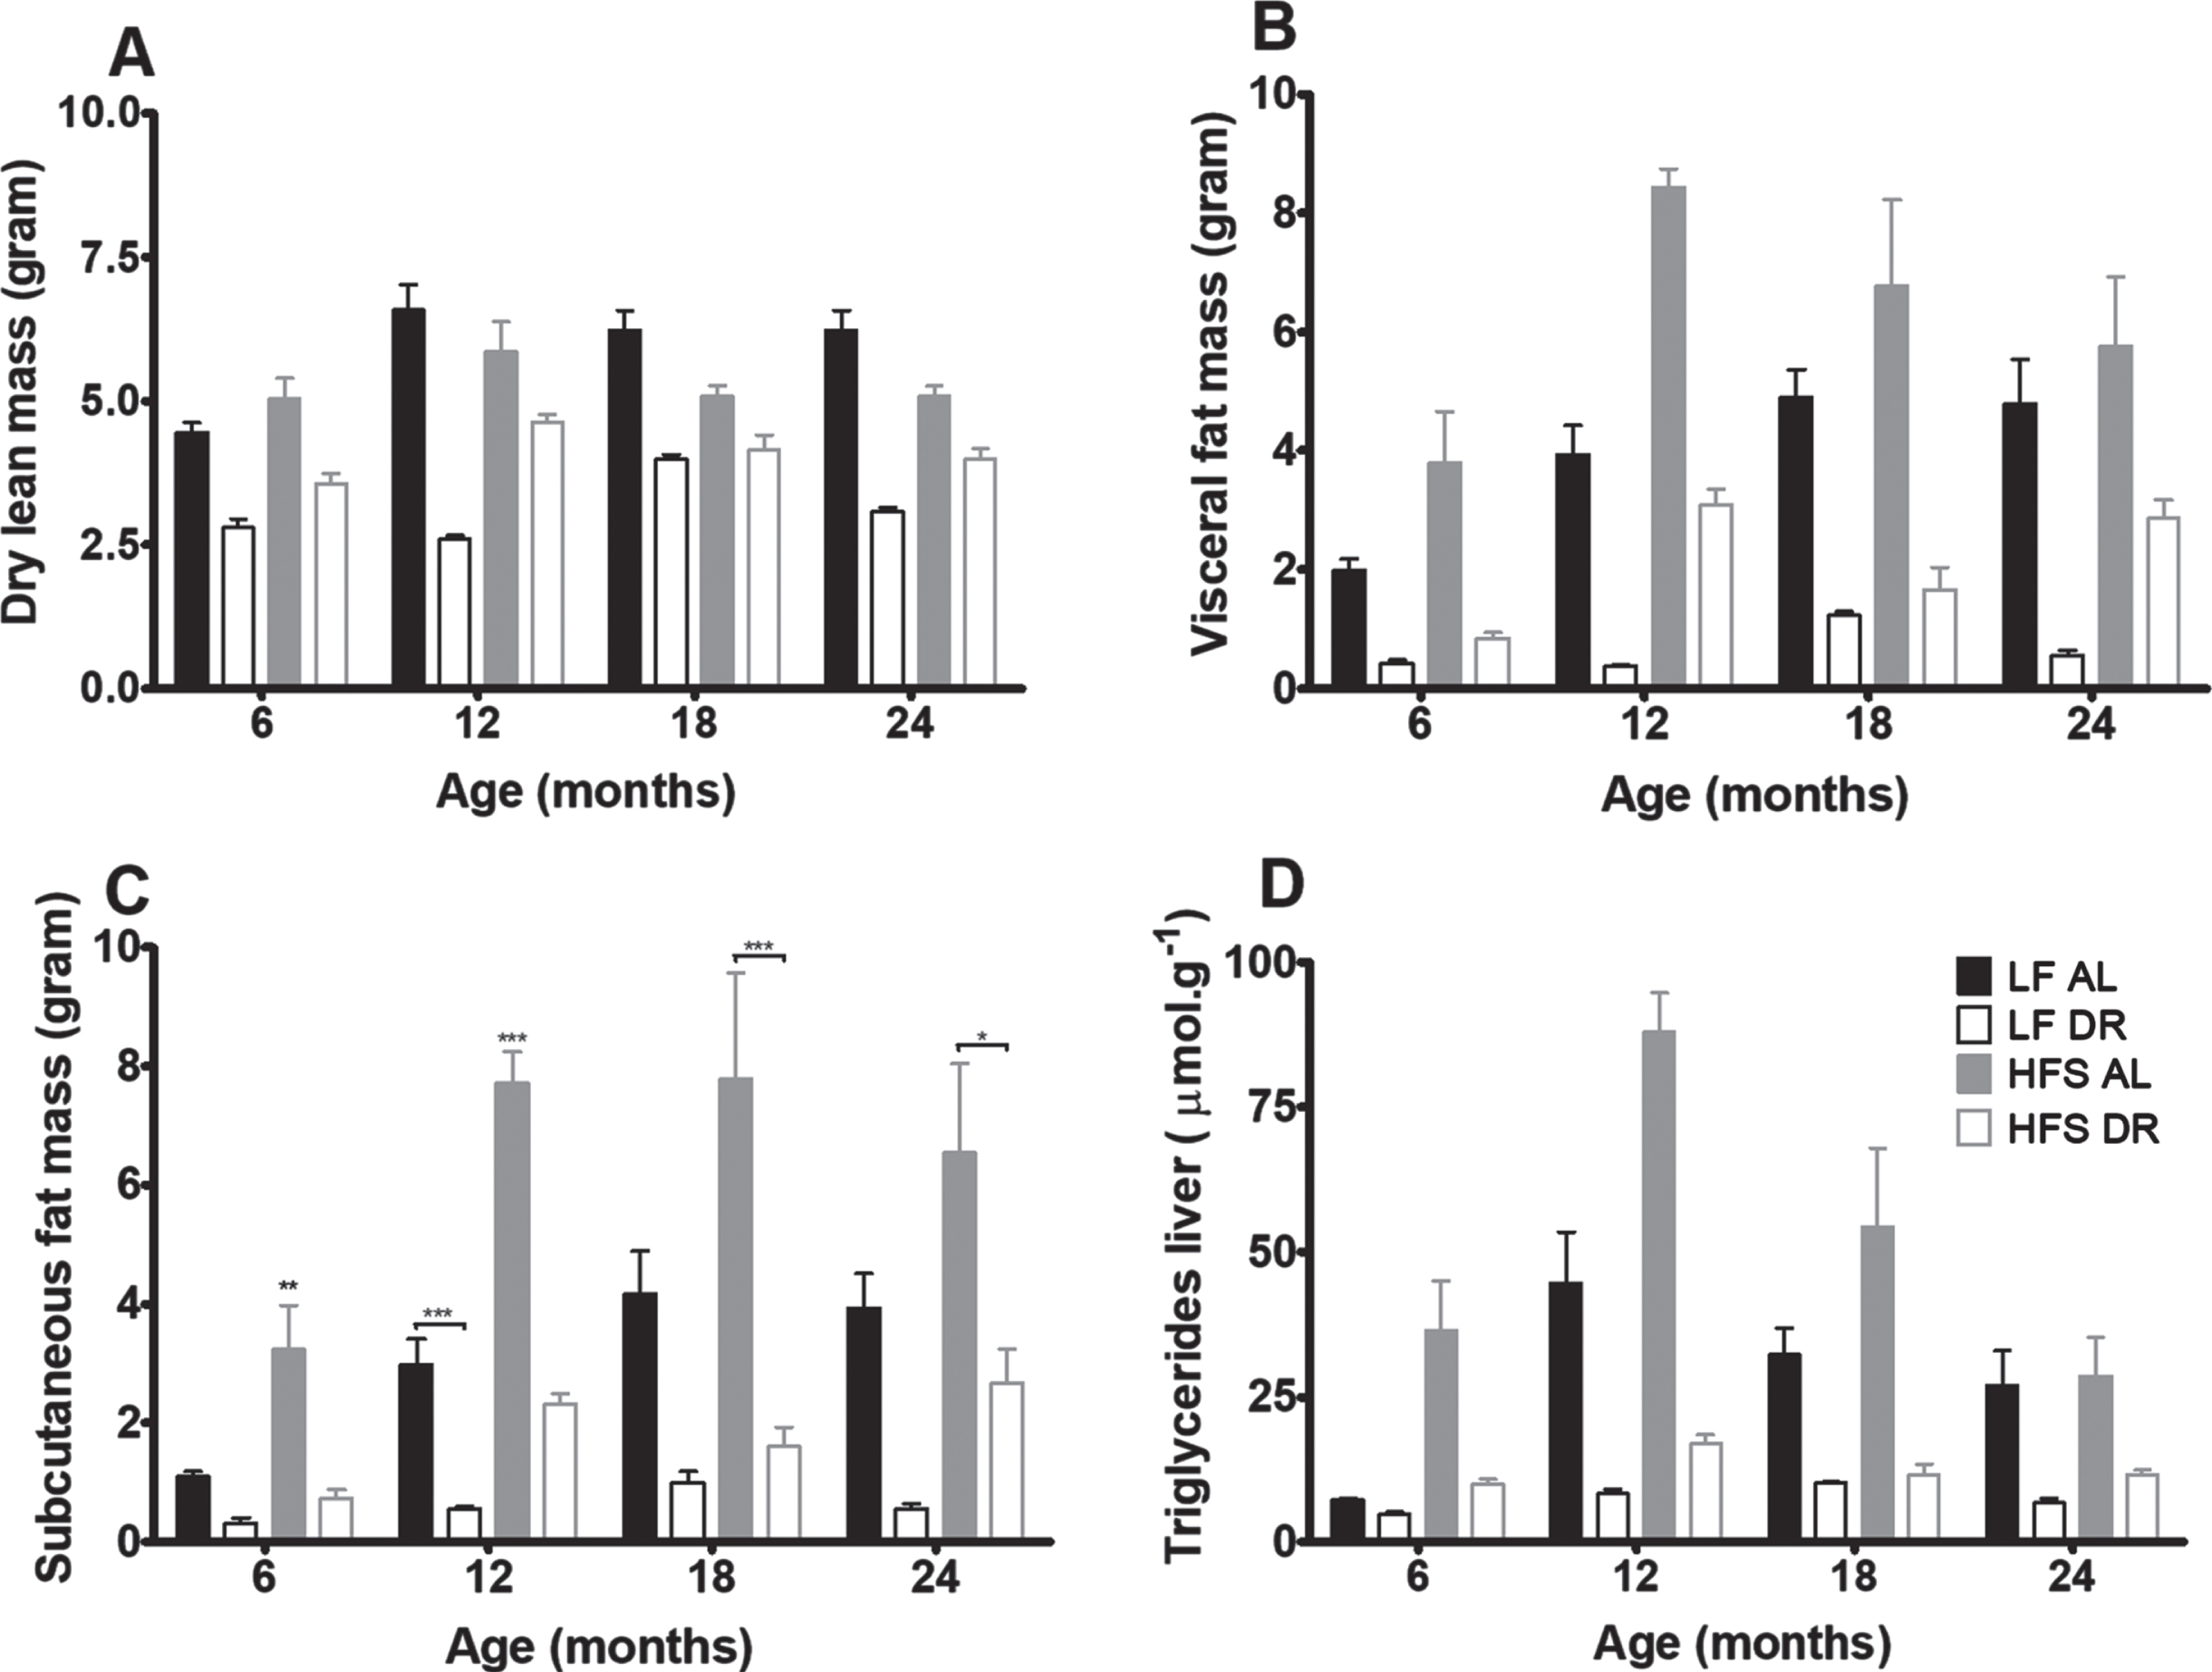
Body composition analysis of mice at 6, 12, 18, and 24 months (Fig. 3) revealed that dry lean mass (Fig. 3A) was lower in DR groups independent of diet type (p < 0.001). Visceral (Fig. 3B) and subcutaneous (Fig. 3C) fat mass were lower in DR mice independent of type of diet (p < 0.001) and higher in HFS mice compared to LF mice (p < 0.001). Overall the amount of visceral fat increased with age (p = 0.01). Liver TGs (Fig. 3D) decreased in DR mice versus AL mice (p < 0.001) and increased in mice on a HFS diet compared to mice on a LF diet (p < 0.001).
Fig. 3
Body composition results. Significant differences, including p-values, are indicated in the legend. If a post hoc test was allowed, the significant differences within an age group are indicated with asterisks (*p < 0.05, **p≤0.01, ***p≤0.001). LF DR at 6 and 18 months is LF DR II and at 12 and 24 months is LF DR I. (A) Dry lean mass at the four different ages was lower in DR mice (p < 0.001) (B) Visceral fat mass at the four different ages was lower in DR mice (p < 0.001), higher in mice on a HFS diet (p < 0.001) and there was a diet×age interaction (p = 0.01) (C) Subcutaneous fat mass at the four different ages was lower in DR mice (p < 0.001) and higher in mice on a HFS diet (p < 0.001) (D) Liver triglycerides at the four different ages was lower in DR mice (p < 0.001) and higher in mice on a HFS diet (p < 0.001). Data are averages from n = 7–8 mice per group; +SEM.
Plasma analysis of blood taken during sacrifice at 6, 12, 18 and 24 months (Fig. 4) revealed that levels of leptin (Fig. 4A) and GIP (Fig. 4B) were increased in HFS mice relative to LF mice (p < 0.001) and lowered by DR (p < 0.001) relative to AL conditions. In addition there were diet×age (leptin p < 0.01, GIP p < 0.05) and diet×restriction (leptin p < 0.001, GIP trend p = 0.06) interactions indicating that the restriction and age effects were dependent on the type of diet.
Fig. 4
Plasma hormone results. Significant differences, including p-values, are indicated in the legend. If a post hoc test was allowed, the significant differences within an age group are indicated with asterisks (*p < 0.05, **p≤0.01, ***p≤0.001). LF DR at 6 and 18 months is LF DR II and at 12 and 24 months is LF DR I. (A) Leptin and (B) GIP overall increased on a HFS diet (p < 0.001) and decreased by DR (p < 0.001). (C) Resistin was not affected by DR nor eating a HFS diet. Data are averages from n = 7–8 mice per group; +SEM.
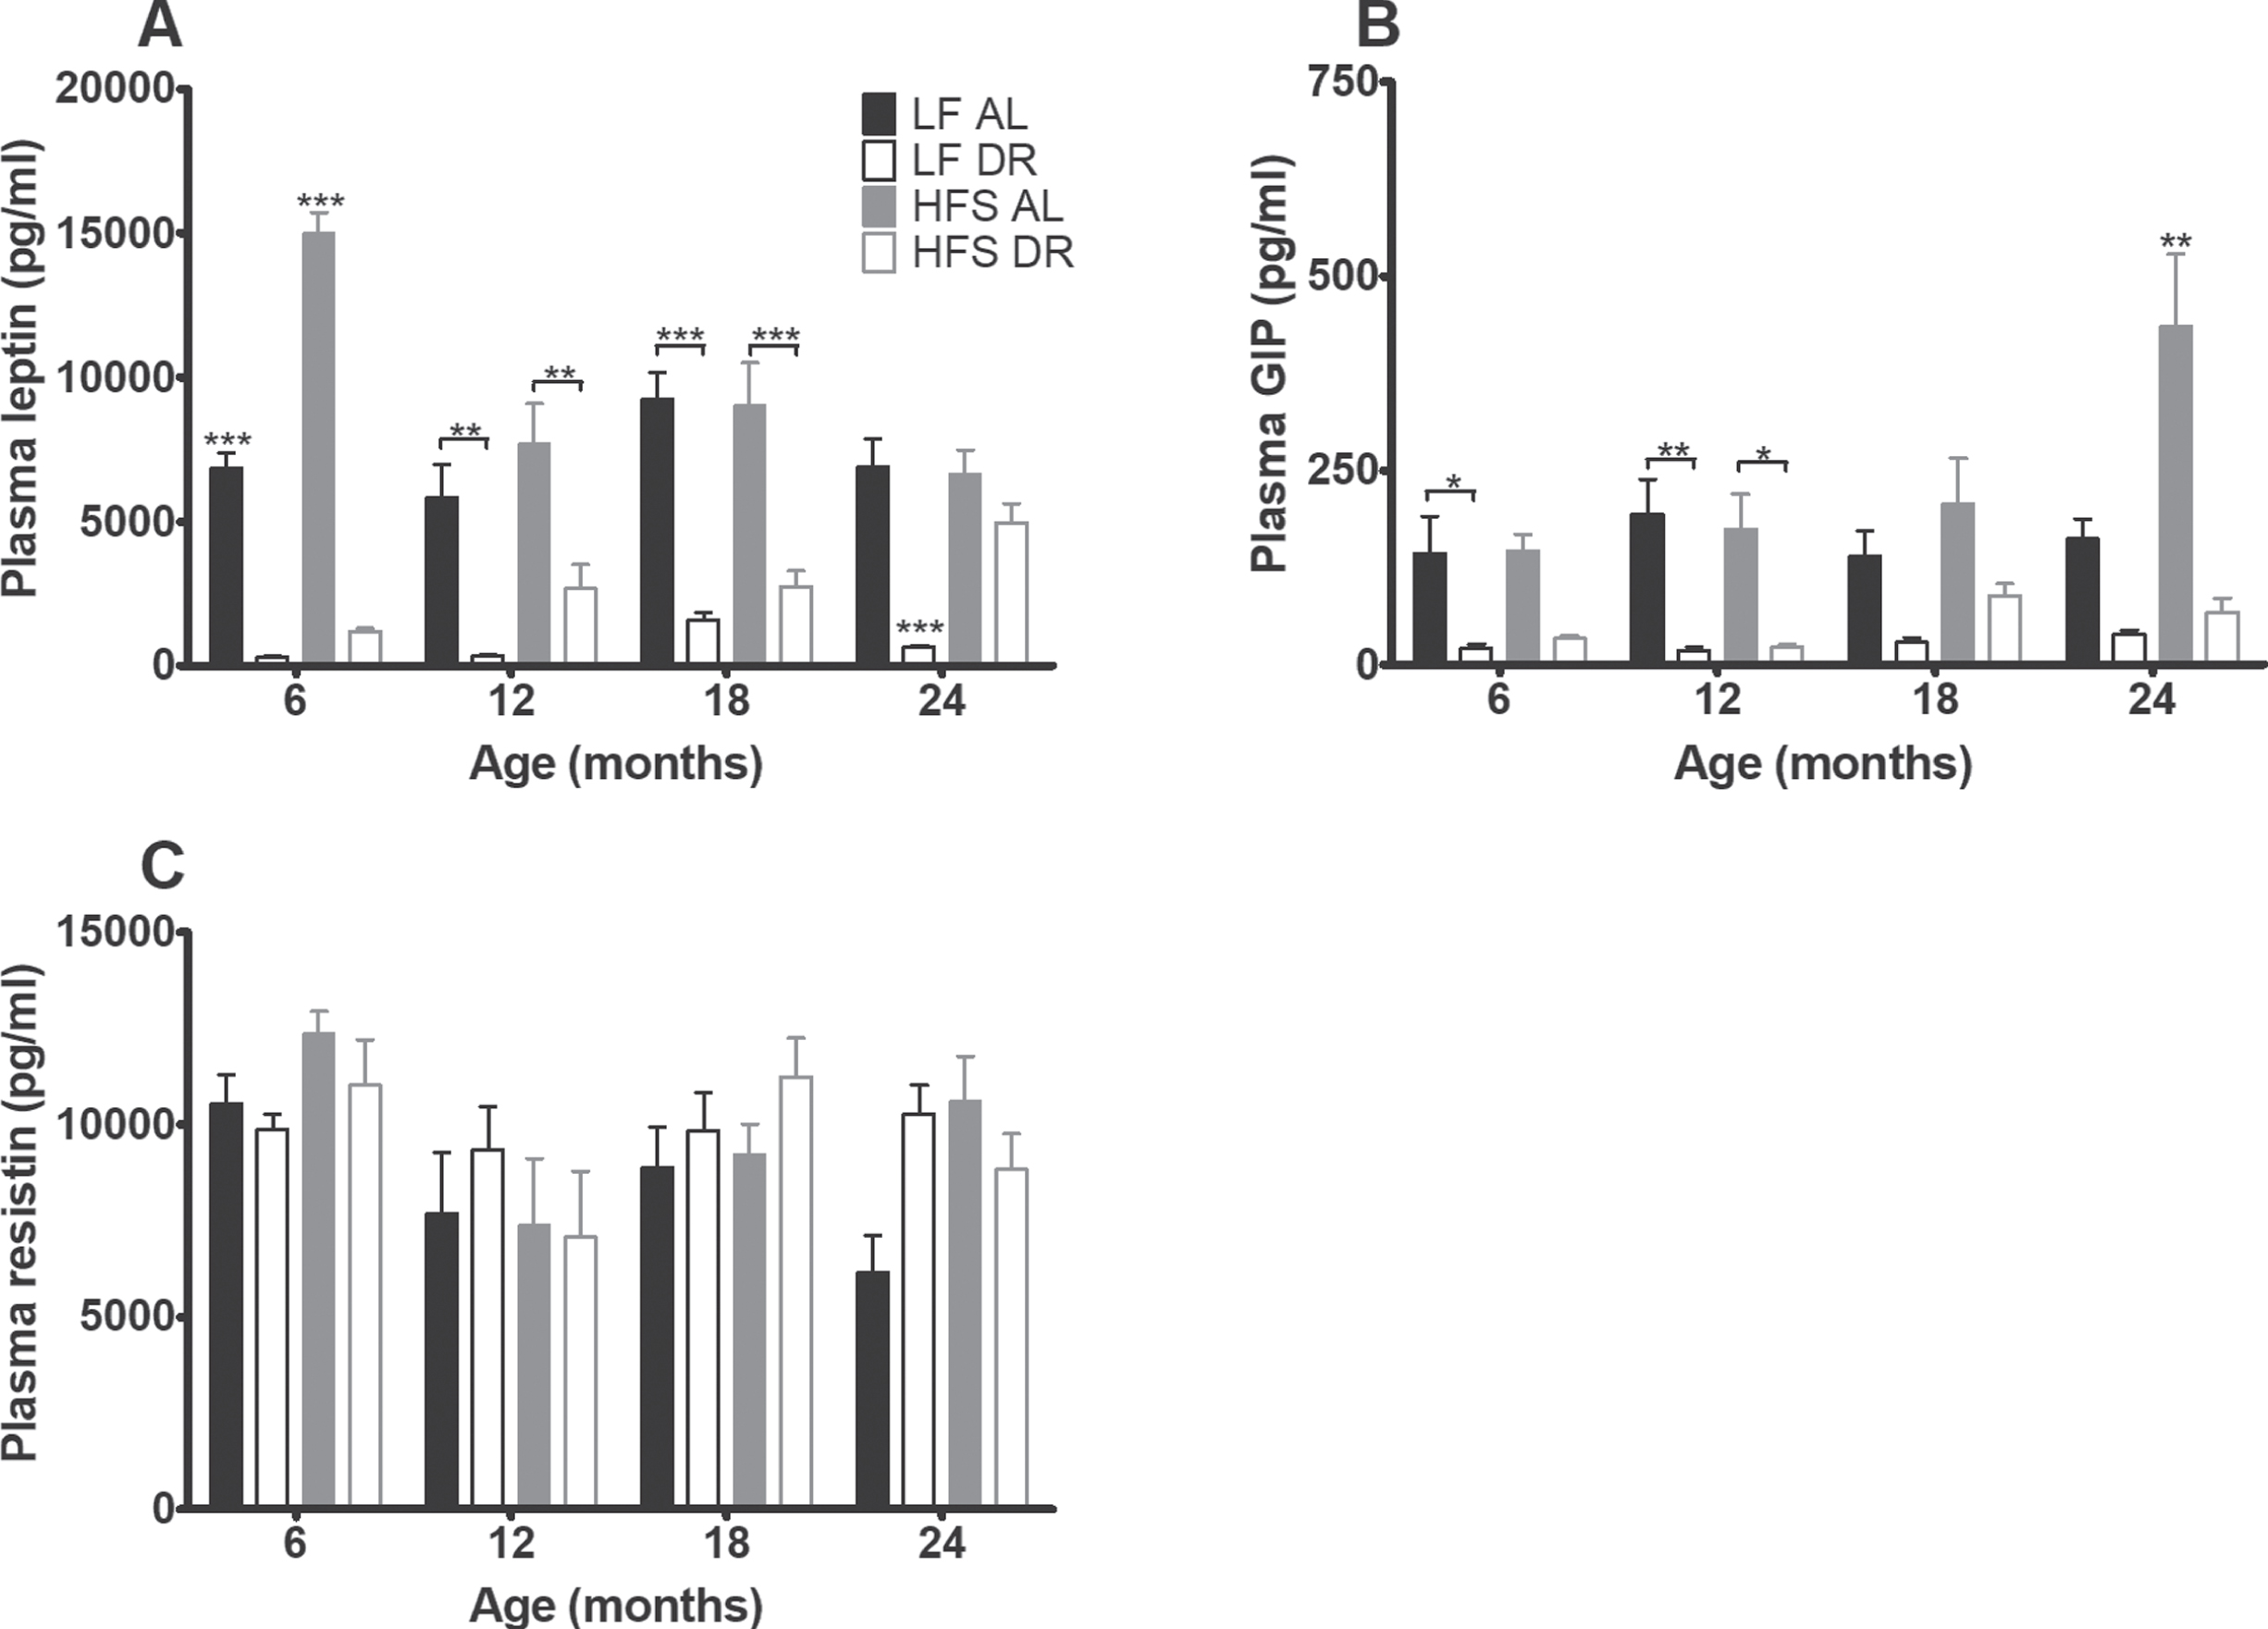
Resistin (Fig. 4C) was neither affected by type of diet nor diet availability. Plasma cholesterol (Fig. 5A) was overall higher in mice on a HFS diet (p < 0.001) and lower in DR mice (p < 0.001, diet effect for free cholesterol p < 0.01).
Fig. 5
Plasma cholesterol and glucose homeostasis results. Significant differences, including p-values, are indicated in the legend. If a post hoc test was allowed, the significant differences within an age group are indicated with asterisks (*p < 0.05, **p≤0.01, ***p≤0.001). LF DR at 6(4) and 18(15) months is LF DR II and at 12(9) and 24(21) months is LF DR I. (A) Total plasma cholesterol was higher on a HFS diet and lower in DR mice (p < 0.001) (B) Plasma glucose after 6 hours of fasting, (C) insulin after 6 hours of fasting, and (D) HOMA-IR index were higher on a HFS diet and lower in DR mice (p < 0.001). HOMA-IR index increased with age (p = 0.001). Data are averages from n = 7-8 (insulin and HOMA-IR n = 2–8) mice per group; +SEM.
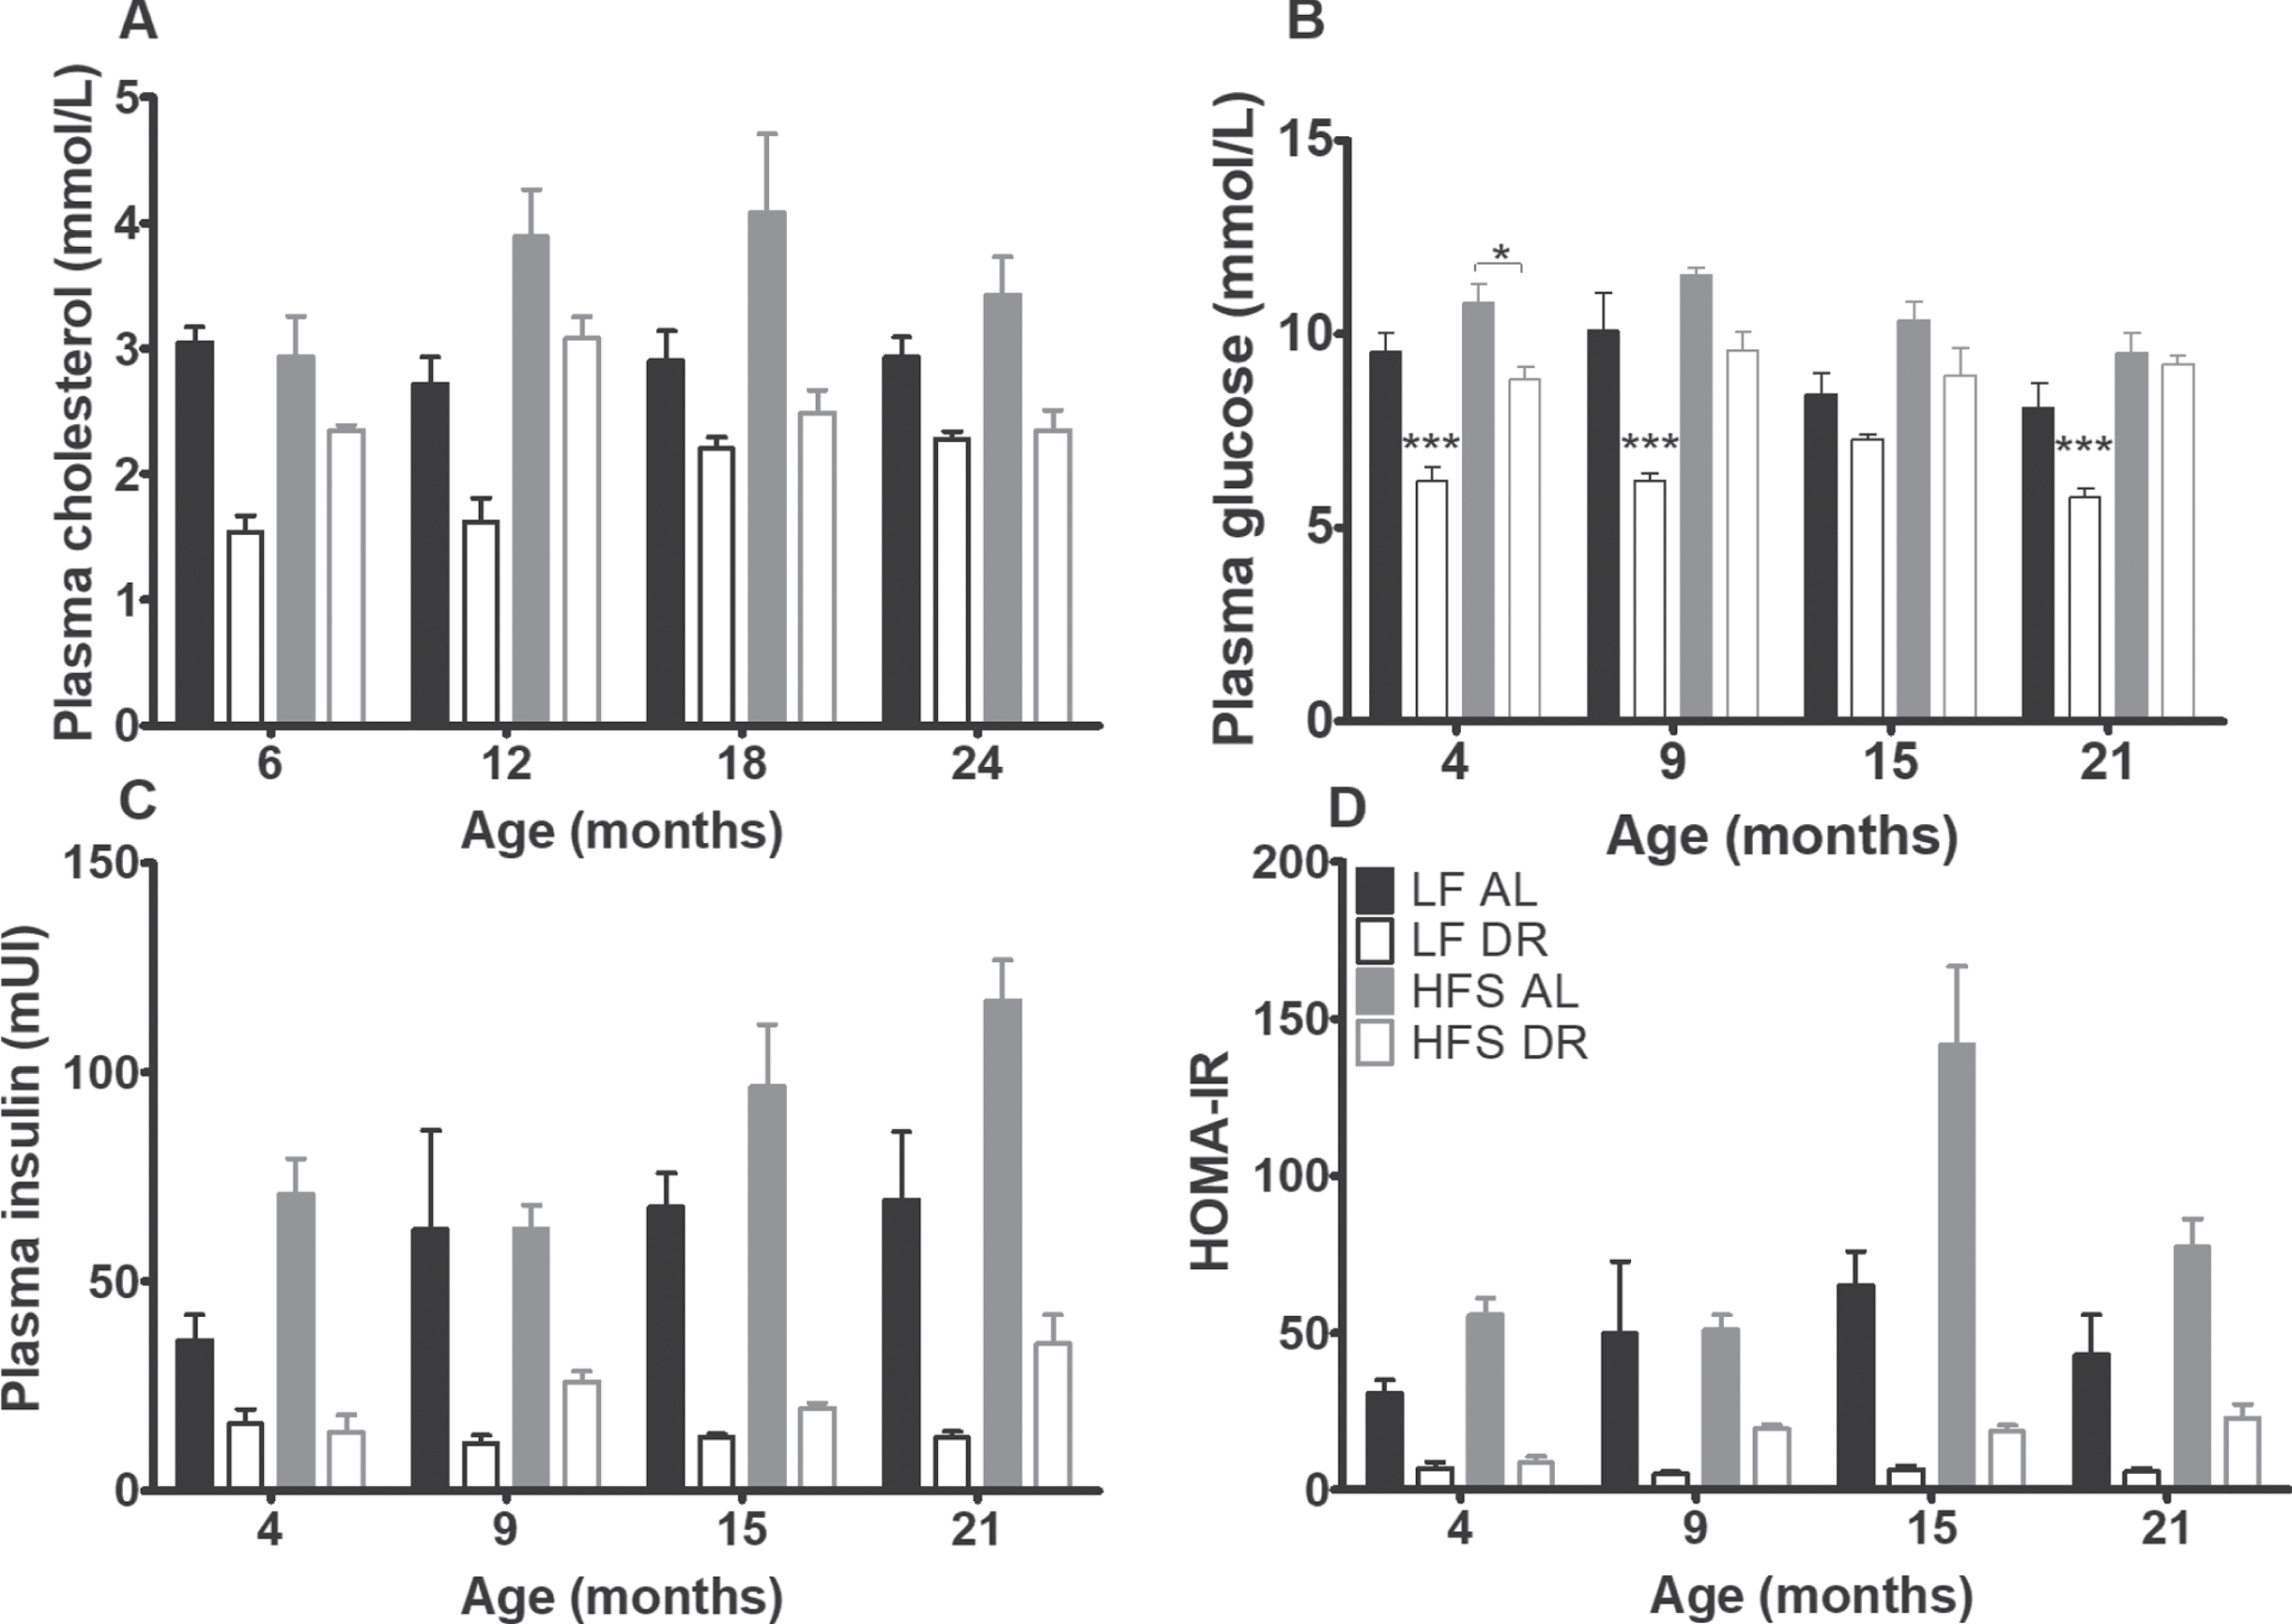
At 4, 9, 15, and 21 months, fasting blood samples were taken for assessment of glucose homeostatic parameters (Fig. 5B –D). Basal glucose, basal insulin and the HOMA-IR index were higher in mice on a HFS diet and lower in DR mice (p < .001). The HOMA-IR index increased with age (p = 0.001), irrespective of diet type and diet availability.
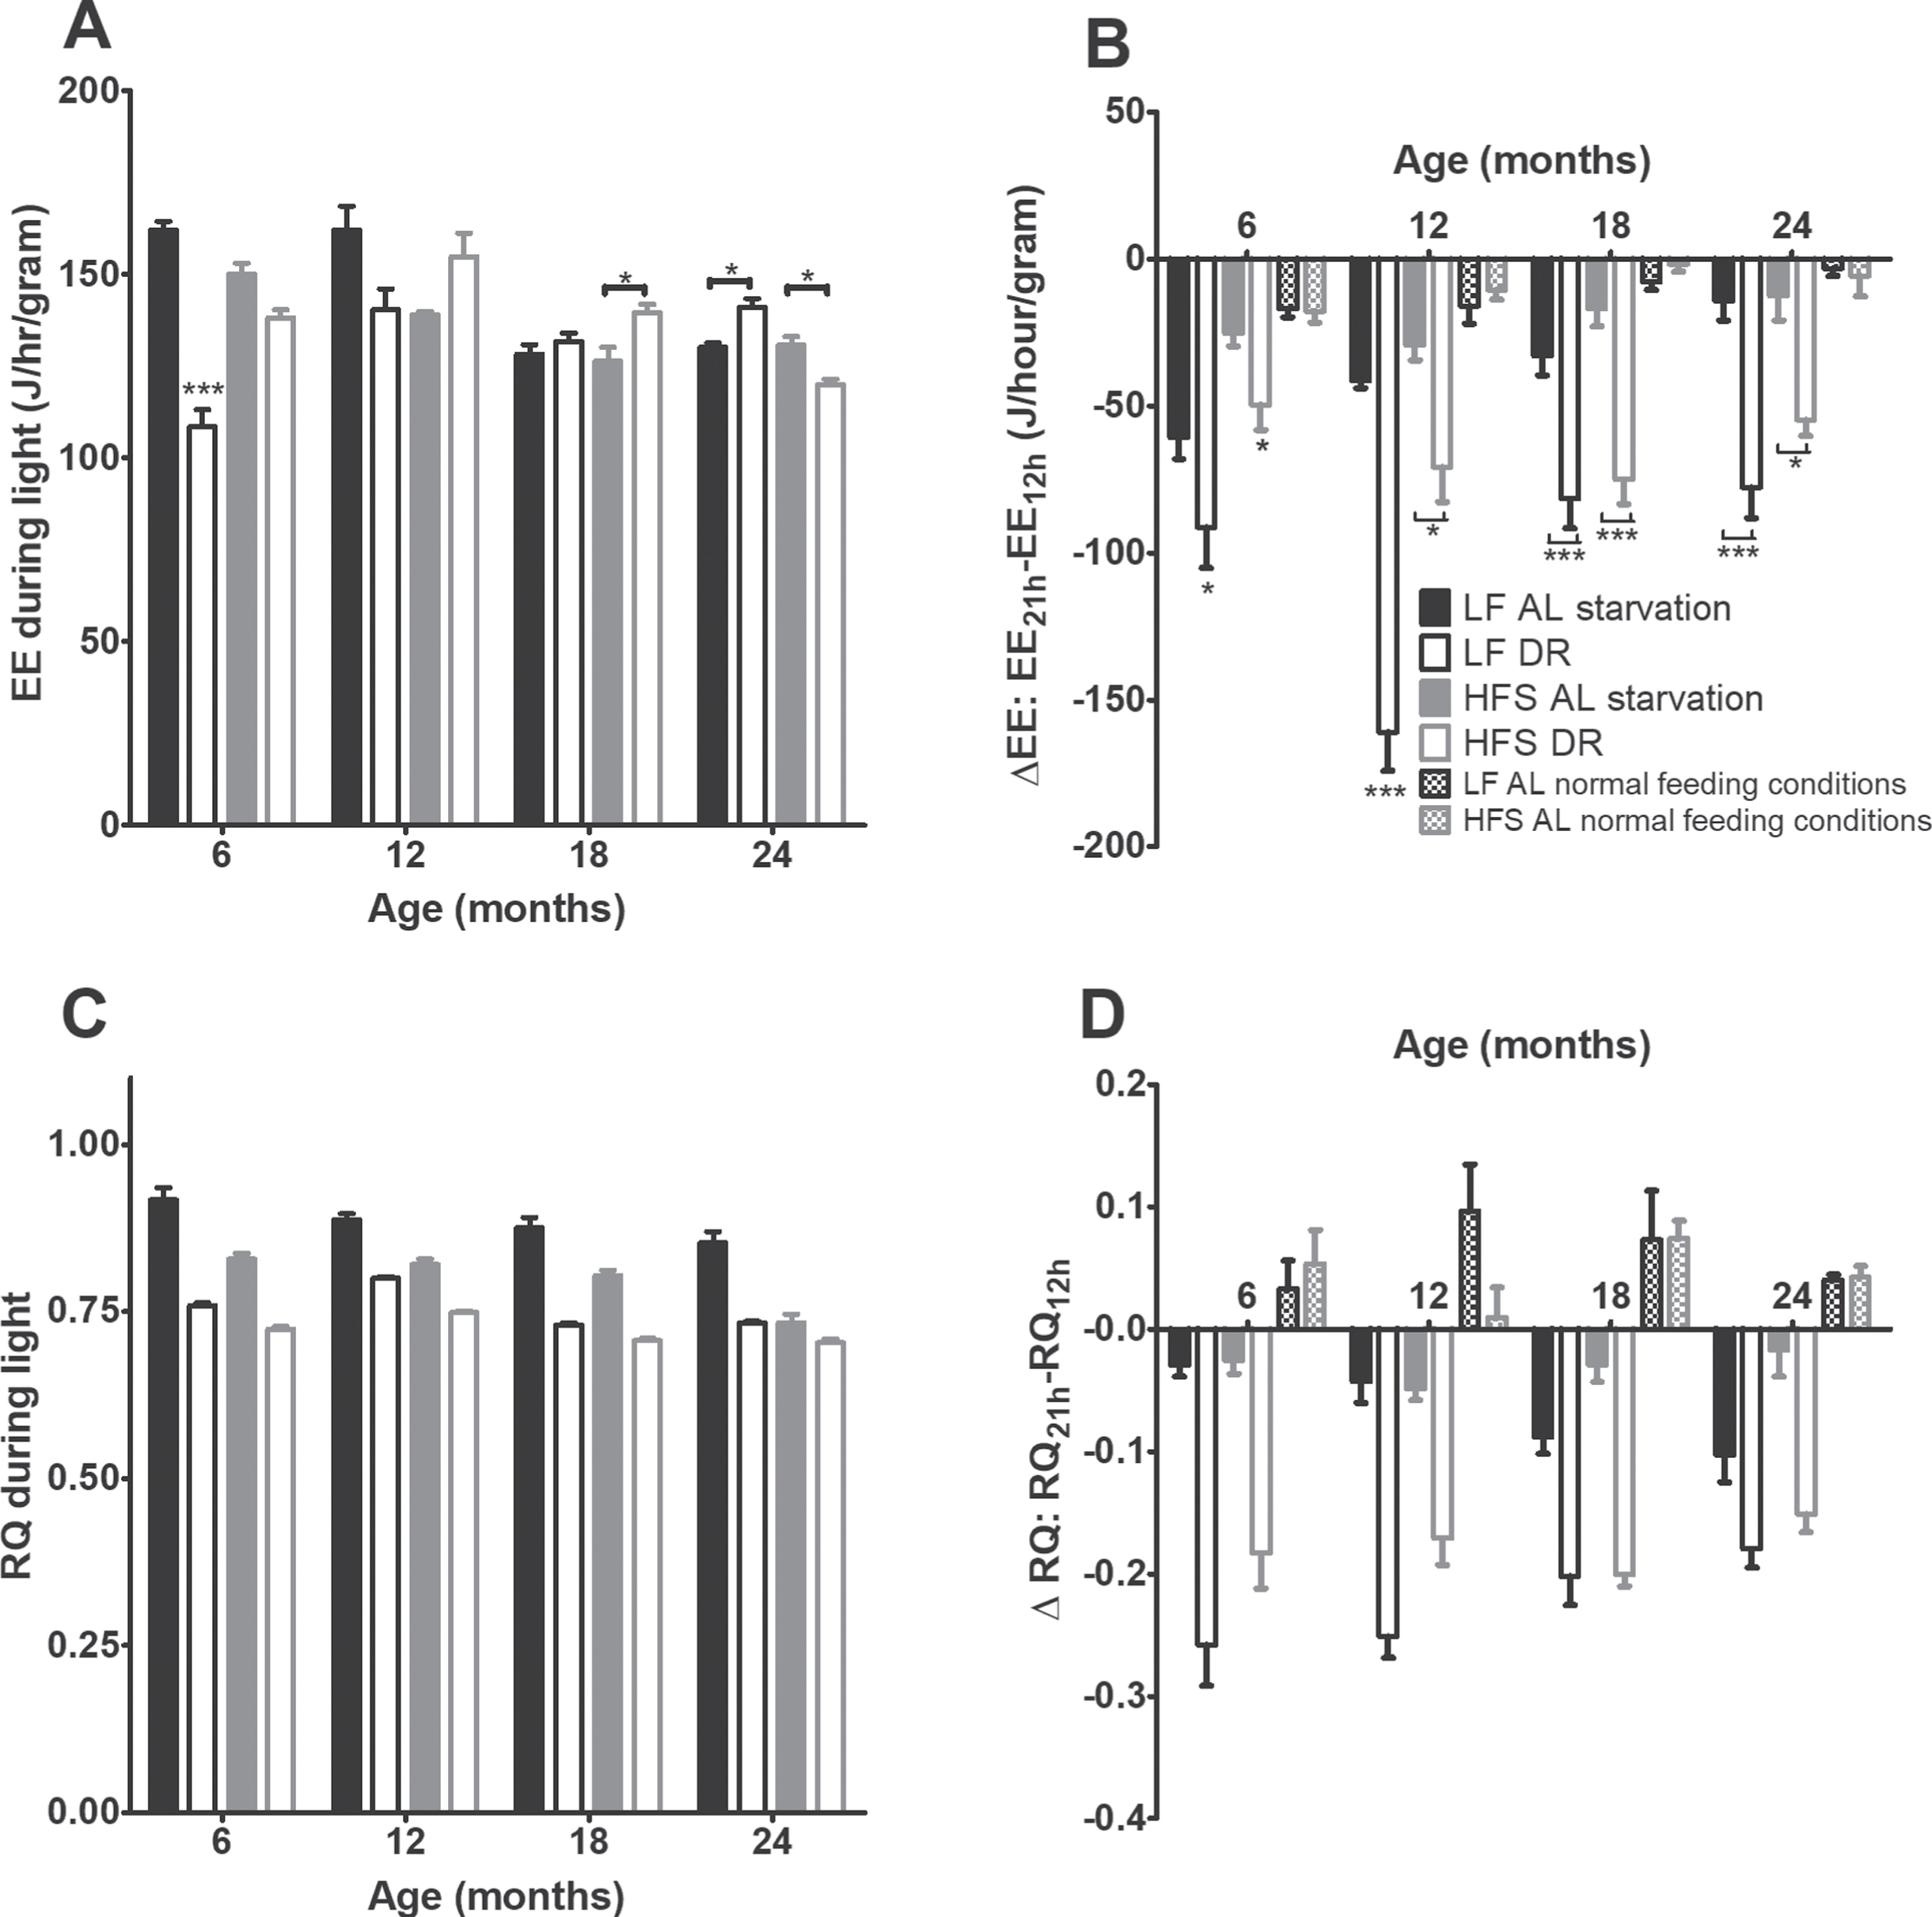
During a 24-hours fasting challenge (Figs. 6A and 6B) all AL mice showed a transient decrease in EE (p < 0.001), but this effect was not as profound in the AL groups as in the DR groups (p < 0.05). At the ages of 6 and 12 months, the LF groups declined steeper than the HFS groups (p < 0.001). The RQ (Figs. 6D and 6E) declined steeper in DR than AL groups (p < 0.001).
Fig. 6
Starvation experiment results. (A) EE during the light phase preceding starvation. Significant differences, including p-values, are indicated in the legend. If a post hoc test was allowed, the significant differences within an age group are indicated with asterisks (*p < 0.05, **p≤0.01, ***p≤0.001). LF DR at 6 and 18 months is LF DR II and at 12 and 24 months is LF DR I. There was a significant DR effect (p < 0.001) which differed over time (DR×age p < 0.001) and per diet (DR×diet p < 0.010) and a significant age effect (p < 0.001) which differed per diet (age×diet p < 0.01). (B) Difference in EE over time during the starvation experiment, as a comparison also the EE under normal feeding conditions are added. At all ages EE decreased with time (p < 0.001) and the DR groups declined steeper than the AL groups (p < 0.05). In addition, at 6 and 12 months the LF groups declined steeper than the HFS groups (p < 0.001). (C) RQ during the light phase preceding starvation. RQ was lower in mice on a HFS diet compared to mice on a LF diet (p < 0.001), RQ was lower in DR mice compared to AL mice (p < 0.001), and RQ declined with age (p < 0.001). (D) Difference in RQ over time during the starvation experiment, as a comparison also the RQ under normal conditions is added. The DR mice declined steeper than the AL mice (p < 0.001). Upon request an example of the decline in EE and RQ over time during the starvation experiment can be requested. Data are averages from n = 7–8 mice per group (24 months n = 3–8); ±SEM.
4Discussion
The major aim in this study was to investigate whether lifelong daily DR would counteract the negative effects of a Western-style diet on metabolic functioning and longevity. For this reason, a subgroup of mice was daily given (from weaning onwards) 60% of the caloric content of the HFS diet (HFS DR) that was daily eaten by the HFS AL mice. In the LF condition, subgroups were either daily given 60% (LFDRI) or 70% (LFDRII) of the metabolizable caloric intake of the LF AL group. The metabolizable caloric intake of the LFDRII group was comparable to the metabolizable caloric intake of the HFS DR group.
Overall, DR mice had a right-shift of the survival curve compared to AL mice (Fig. 1), independent of diet type. If all mice were included in the survival analysis (including the mice that were sacrificed because of non-lethal humane endpoints, Fig. 1A) the HFS DR condition still caused mice to right-shift their survival curve, but this effect was not observed in the LF DR mice. The latter was mainly caused by the relatively large number of LF DR mice that had to be sacrificed because of humane endpoints that were perhaps not lethal immediately. Thus, if only mice were included in the survival analysis that died spontaneous (i.e. mice did not show any indication of health deterioration within days before death), or because they were sacrificed of human endpoints that indeed predicted death within a few days, the diet effect under restricted conditions was lost and both DR groups survived longer than corresponding AL groups.
Although there were some subtle differences between HFS DR and LF DR groups, the major effects of the HFS AL diet (increased adiposity, elevated hepatic TG levels and higher HOMA-IR) were abolished by offering the HFS diet in reduced amounts. In any case, adipose tissue, hepatic TG levels and HOMA-IR in HFS DR mice never surpassed the levels of these parameters in the LF AL mice. Along with the positive effects by DR on lipid and glucose metabolism, we showed that the flexibility in EE and RQ were much higher in the DR mice than in the AL mice. A connection between high metabolic flexibility and longevity has indeed been observed before [39]. Whether the metabolic flexibility is a result of the time frame in which the DR mice ate their food or by restricted amount of food is not known. The effects on metabolic flexibility are remarkable in the light of the apparent incongruencies of the effects of DR on EE in the two diet groups over time [40, 41]. A negative association between RMR and lifespan is the cornerstone of the rate of living and free-radical damage theories of aging [42]. Related to this theory, the RMR measured in these mice probably reflects the right shift in the survival curves of the DR mice compared to the AL mice. However, the difference between the survival curves of the LF AL and HFS AL groups, and the lack of difference (when excluding the mice that were sacrificed because of humane end points (except severe weight loss/general bad appearance)) between the LF DR and HFS DR is not reflected in these RMR results.
One major implication of the current study is that inclusion of sacrifice according to humane endpoints directly interfered with the outcome, namely that the effect of DR in the LF group depended strongly on whether or not these human endpoint sacrifices were taken into account or not. In Table 1 the causes of death, or reasons for sacrifice, are mentioned, and probably only severe weight loss (due to sudden adipsia and hypophagia), and/or a general bad appearance would have been lethal within a few days, had the mice not been sacrificed by the researcher. Rectal prolapse is a common problem in laboratory mice, although the reason for the condition is often unclear [43]. We have checked the degree of DR and potential lack of micronutrients, but we did not find any of these to be related to the incidence of rectal prolapse in the current study, except for the fact it was more common in the LF condition. Seemingly adverse health conditions like rectal prolapse and scratching behavior would definitely not be lethal on the short (or even longer) term [44], but were decided by our Institutional Animal Use and Care Committee of the University of Groningen to be discomforting enough to qualify for sacrifice (i.e., humane endpoint).This was in the end a subjective decision, which might differ between individuals, research institutes, and countries. The scientific community should be made aware of this pitfall in long-term survival studies, where humane endpoints for sacrifice are practiced.
In agreement with previous studies [8–10], we showed that AL feeding a HFS diet resulted in decreased survival as indicated by a left-shift of the survival curves relative to those of mice AL feeding a LF diet. The main divergence of these curves was noted around 12 to 18 months of life, and after that the curves ran parallel. In the attempt to find underpinnings of this survival divergence, sub-cohorts of the different diet groups presumably representing the general health characteristics of these groups were sacrificed at 6, 12, 18 and 24 months. The most striking effect at all ages was that the HFS AL mice had profoundly increased adipose tissue depots and TG storage in the liver, combined with a higher HOMA-IR index indicative of a higher level of insulin resistance compared to LF AL mice. Development of a fatty liver, frequently the result of overflow from visceral adipose tissue deposition [45] could be one mechanism to explain the increased HOMA-IR [46, 47]. Expansion of adipose tissue [48] has been mentioned to be associated with macrophage infiltration [49, 50], inflammatory activation [51], increased oxidative stress [52] and adverse adipo-cytokine release and these derangement could build up over time to eventually cause derangements in other organs too [53]. It is likely that at least some of these mechanisms could be underlying to the divergence of the survival curves of HFS AL and LF AL mice that occurred around the age of 12 to 18 months. At 24 months, however, the HFS AL mice had sharply reduced levels of TG storage in the liver compared to these levels found at 12 to 18 months, and in fact reached the same levels found in the LF AL mice. Likewise, HOMA-IR was strongly elevated in HFS AL at 18 months but reduced again in mice at 24 months. While it cannot be excluded that these effects were driven by the aging process itself, we consider it more likely that they were the result of survivor bias as it is known that there are responders and non-responders to a Western-style diet [54, 55]). As such, mice that were affected most by the HFS diet to have increased hepatic TG deposition and associated IR may have not survived until 24 months, but these probably did contribute to the outcomes obtained at 12 to 18 months. Mice feeding the HFS AL diet nevertheless remained hyperphagic and sustained their increased fat mass relative to the LF AL mice until 24 months (and later), but presumably these surviving mice were less sensitive to the deleterious effects of HFS feeding. This disconnect between adipose tissue storage and overfeeding the HFS diet together with attenuation of hepatic TG storage and improvement of HOMA-IR is of interest and deserves further investigation. Finally, the elevated level of GIP in the HFS AL mice selectively at 24 months is remarkable. GIP has been shown to counter healthy aging [56, 57], however, there are also papers showing that GIP has anti-inflammatory actions in neurodegenerative [58] and metabolic [59] diseases. If any, the adipokines leptin and resistin did not seem to play a major role in these phenomena.
In conclusion, male mice eating a HFS AL diet resulted in a decreased survival, i.e. a left-shift in the survival curves compared to eating a LF AL diet. This left-shift can be the result of the increased adiposity in the HFS group, elevated TG levels, higher HOMA-IR which can be associated with derangements that build up in other organs too and a higher RMR. These effects of eating a HFS diet were abolished when HFS diet was eaten in restricted amounts. Suggesting that the composition of the diet is less important than the caloric consumption. If mice that were sacrificed because of humane end points (except severe weight loss/general bad appearance) were excluded from the survival analysis both DR groups survived better compared to both AL groups without a diet difference between both DR groups, suggesting that the negative effects of a Western-style diet do not negatively impact the positive effects of DR. Whether these results also apply to female mice needs to be further investigated.
Acknowledgments
We thank Giorgio Karapetsas for his skillful technical assistance.
Funding
This work was supported by a grant from the Netherlands Organization for Scientific Research (NWO, grant no. 853.00.110); https://www.nwo.nl/onderzoek-en-resultaten/onderzoeksprojecten/94/2300159494.html.
Barbara M. Bakker was supported by a Rosalind Franklin Fellowship for the University of Groningen. The funders had no role in study design, data collection and analysis, decision to publish, or preparation of the manuscript.
Conflicts of interest
The authors have no conflict of interest to report.
References
[1] | Han TS , Tajar A , Lean MEJ . Obesity and weight management in the elderly. Br Med Bull. (2011) ;97: :169–96. |
[2] | Woods JA , Wilund KRW , Martin SA , Kistler BM . Exercise, inflammation and aging. Aging Dis. (2012) ;3: (1):130–40. |
[3] | Akbaraly T , Sabia S , Hagger-Johnson G , Tabak AG , Shipley MJ , Shipley MJ , Jokela M , Brunner EJ , Hamer M , Batty GD , Singh-Manoux A , Kivimaki M . Does overall diet in midlife predict future aging phenotypes? A cohort study. Am J Med. (2013) ;126: (5):411–9. |
[4] | Everitt AV , Hilmer SN , Brand-Miller JC , Jamieson HA , Truswell AS , Sharma AP , Mason RS , Morris BJ , Le Couteur DC . Dietary approaches that delay age-related diseases. Clin Interv Aging. (2006) ;1: (1):11–31. |
[5] | Vasselli JR , Weindruch R , Heymsfield SB , Pi-Sunyer FX , Boozer CN , Boozer , Yi N , Wang C , Pietrobelli A , Allison DB . Intentional weight loss reduces mortality rate in a rodent model of dietary obesity. Obes Res. (2005) ;13: (4):693–702. |
[6] | Baur JA , Pearson KJ , Price NL , Jamieson HA , Jamieson HA , Lerin C , Kalra A , Prabhu VV , Alard JS , Lopez-Lluch G , Lewis K , Pistell PJ , Poosala S , Becker KG , Boss O , Gwinn D , Wang M , Ramaswami S , Fishbein KW , Specner RG , Lakatta EG , Le Couteur D , Shaw RJ , Navas P , Puigserver P , IngramDK, de CaboR, SinclairDA. Resveratrol improves health and survival of mice on a high-calorie diet. Nature. (2006) ;444: (7117):337–42. |
[7] | Otabe S , Yuan X , Fukutani T , Wada N , Hashinaga T , Nakayama H , Hirota N , Kojima M , Yamada K . Overexpression of human adiponectin in transgenic mice results in suppression of fat accumulation and prevention of premature death by high-calorie diet. Am J Physiol Endocrinol Metab. (2007) ;293: (1):E210–218. |
[8] | van der Heijden RA , Sheedfar F , Morrison MC , Hommelberg PP , Kor D , Kloosterhuis NJ , Gruben N , Youssef S , de Bruin A , Hofker MH , Kleeman R , Koonen DPY , Heeringa P . High-fat diet induced obesity primes inflammation in adipose tissue prior to liver in C57BL/6j mice. Aging (Albany NY). (2015) ;7: (4):256–68. |
[9] | Kim SJ , Kim SE , Kim AR , Kang S , Park MY , Sung MK . Dietary fat intake and age modulate the composition of the gut microbiota and colonic inflammation in C57BL/6J mice. BMC Microbiol. (2019) ;19: (193). |
[10] | Mühlfeld C , Pfeiffer C , Schneider V , Bornemann M , Schipke J . Voluntary activity reverses spermidine-induced myocardial fibrosis and lipid accumulation in the obese male mouse. Histochem Cell Biol. (2021) ;155: (1):75–88. |
[11] | Mair W , Dillin A . Aging and survival: the genetics of life span extension by dietary restriction. Annu Rev Biochem. (2008) ;77: :727–54. |
[12] | Colman RJ , Anderson RM , Johnson SC , Kastman EK , Kosmatka KJ , Beasley TM , Allison DB , Cruzen C , Simmons HA , Kemnitz JW , Weindruch R . Caloric restriction delays disease onset and mortality in rhesus monkeys. Science. (2009) ;325: (5937):201–4. |
[13] | Le Bourg E . Predicting whether dietary restriction would increase longevity in species not tested so far. Ageing Res Rev. (2010) ;9: (3):289–97. |
[14] | Speakman JR , Mitchell SE . Caloric restriction. Mol Aspects Med. (2011) ;32: (3):159–221. |
[15] | McCay CM , Crowell MF , Maynard LA . The effect of retarded growth upon the length of life span and upon the ultimate body size. Nutrition. (1989) ;5: (3):155–71. |
[16] | Berg BN , Simms HS . Nutrition and longevity in the rat. II. Longevity and onset of disease with different levels of food intake. J Nutr. (1960) ;71: :255–163. |
[17] | Walford RL , Harris SB , Weindruch R . Dietary restriction and aging: historical phases, mechanisms and current directions. J Nutr. (1987) ;117: (10):1650–4. |
[18] | Hennebelle M , Roy M , St-Pierre V , Courchesne-Loyer A , Fortier M , Bouzier-Sore AK , Gallis J-L , Beauvieux M-C . Energy restriction does not prevent insulin resistance but does prevent liver steatosis in aging rats on a Western-style diet. (2015) ;31: (3):523–30. |
[19] | Lane MA , Ingram DK , Roth GS . Calorie restriction in nonhuman primates: effects on diabetes and cardiovascular disease risk. Toxicol Sci. (1999) ;52: (2):41–8. |
[20] | Dhahbi JM , Mote PL , Wingo J , Rowley BC , Cao SX , Cao , Walford RL , Spindler SR . Caloric restriction alters the feeding response of key metabolic enzyme genes. Mech Ageing Dev. (2001) ;122: (10):1033–48. |
[21] | Barzilai N , Banerjee S , Hawkins M , Chen W , Rossetti L . Caloric restriction reverses hepatic insulin resistance in aging rats by decreasing visceral fat. J Clin Invest. (1998) ;101: (7):1353–61. |
[22] | Gabriely I , Ma XH , Yang XM , Atzmon G , Rajala MW , Rajala MW , Berg AH , Scherer P , Rossetti L , Barzilai N . Removal of visceral fat prevents insulin resistance and glucose intolerance of aging: an adipokine-mediated process? Diabetes. (2002) ;51: (10):2951–8. |
[23] | Dhahbi JM , Mote PL , Wingo J , Tillman JB , Walford RL , Walford RL , Spindler SR . Calories and aging alter gene expression for gluconeogenic glycolytic and nitrogen-metabolizing enzymes. Am J Physiol. (1999) ;277: (2):E352–360. |
[24] | Olson KA , Schell JC , Rutter J . Pyruvate and metabolic flexibility: Illuminating a path toward selective cancer therapies. Trends Biochem Sci. (2016) ;41: (3):219–30. |
[25] | Smith RL , Soeters MR , Wüst RCI , Houtkooper RH . Metabolic flexibility as an adaptation to energy resources and requirements in health and disease. Endocr Rev. (2018) ;39: (4):489–517. |
[26] | de la Iglesia R , Loria-Kohen V , Zulet MA , Martinez JA , Reglero G , Ramirez de Molina A . Dietary strategies implicated in the prevention and treatment of metabolic syndrome. Int J Mol Sci. (2016) ;17: (11):1877. |
[27] | Tay J , Thompson CH , Luscombe-Marsh ND , Wycherley TP , Noakes M , Buckley JD , Wittert GA , Yancy WS , Brinkworth GD . Effects of an energy-restricted low-carbohydrate, high unsaturated fat/low saturated fat diet versus a high-carbohydrate, low-fat diet in type 2 diabetes: A 2-year randomized clinical trial. Diabetes Obes Metab. (2018) ;20: (4):858–71. |
[28] | Houtkooper RH , Williams RW , Auwerx J . Metabolic Networks of Longevity. Cell. (2010) ;142: (1):9–14. |
[29] | Stull AJ , Galgani JE , Johnson WD , Cefalu WT . The contribution of race and diabetes status to metabolic flexibility in humans. Metabolism. (2010) ;59: (9):1358–64. |
[30] | Duivenvoorde LP , van Schothorst EM , Bunschoten A , Keijer J . Dietary restriction of mice on a high-fat diet induces substrate efficiency and improves metabolic health. J Mol Endocrinol. (2011) ;47: (1):81–97. |
[31] | Kalupahana NS , Voy BH , Saxton AM , Moustaid-Moussa N . Energy-restricted high-fat diets only partially improve markers of systemic and adipose tissue inflammation. Obesity (Silver Spring). (2011) ;19: (2):245–54. |
[32] | Oklejewicz M , Hut RA , Daan S , Loudon AS , Stirland AJ . Metabolic rate changes proportionally to circadian frequency in tau mutant Syrian hamsters. J Biol Rhythms. (1997) ;12: (5):413–22. |
[33] | Kleiber M . Body size and metabolic rate. Physiol Rev. (1947) ;27: (4):511–41. |
[34] | Even PC , Nadkarni NA . Indirect calorimetry in laboratory mice and rats: principles, practical considerations, interpretation and perspectives. Am J Physiol Regul Integr Comp Physiol. (2012) ;303: (5):R459–476. |
[35] | Ferrannini E . The theoretical bases of indirect calorimetry: a review. Metabolism. (1988) ;37: (3):287–301. |
[36] | Bligh EG , Dyer WJ . A rapid method of total lipid extraction and purification. Can J Biochem Physiol. (1959) ;37: (8):911–7. |
[37] | van Dijk TH , Laskewitz AJ , Grefhorst A , Boer TS , Bloks VW , Kuipers F , Groen AK , Reijngoud . A novel approach to monitor glucose metabolism using stable isotopically labelled glucose in longitudinal studies in mice. Lab Anim. (2013) ;47: (2):79–88. |
[38] | Kaplan EL , Meier P . Nonparametric estimation from incomplete observations. J Am Stat Assoc. (1958) ;53: (282):457–81. |
[39] | Riera C , Dillin A . Tipping the metabolic scales towards increased longevity in mammals. Nat Cell Biol. (2015) ;17: (3):196–203. |
[40] | St-Onge M-P , Jones PJH . Physiological effects of medium-chain triglycerides: potential agents in the prevention of obesity. J Nutr. (2002) ;132: (3):329–32. |
[41] | St-Onge M-P , Ross R , Parsons WD , Jones PJH . Medium-chain triglycerides increase energy expenditure and decrease adiposity in overweight men. Obes Res. (2003) ;11: (3):395–402. |
[42] | Duarte LC , Speakman JR . Low resting metabolic rate is associated with greater lifespan because of a confounding effect of body fatness. Age (Dordr). (2014) ;36: (6):9731. |
[43] | Uchihashi M , Wilding LA , Nowland MH . Surgical correction of rectal prolapse in laboratory mice (Mus musculus). J Am Assoc Lab Anim Sci. (2015) ;54: (4):433–8. |
[44] | Brayton CF , Treuting PM , Ward JM . Pathobiology of aging mice and GEM: background strains and experimental design. Vet Pathol. (2012) ;49: (1):85–105. |
[45] | Bosy-Westphal A , Braun W , Albrecht V , Muller MJ . Determinants of ectopic liver fat in metabolic disease. Eur J Clin Nutr. (2019) ;73: (2):209–14. |
[46] | Angelico F , Del Ben M , Conti R , Francioso S , Feole K , Fiorello S , Çavallo MG , Zalunardo B , Lirussi F , Alessandri C , Violi F . Insulin resistance, the metabolic syndrome, and nonalcoholic fatty liver disease. J Clin Endocrinol Metab. (2005) ;90: (3):1578–82. |
[47] | Fujii H , Imajo K , Yoneda M , Nakahara T , Hyogo H , Takahashi H , Hara T , Tanaka S , Sumida Y , Eguchi Y , Chayama K , Nakajima A , Nishimoto N , Kawada N . HOMA-IR: An independent predictor of advanced liver fibrosis in nondiabetic non-alcoholic fatty liver disease. J Gastroenterol Hepatol. (2019) ;34: (8):1390–5. |
[48] | Martin-Montalvo A , Mercken EM , Mitchell SJ , Palacios HH , Mote PL , Scheibye-Knudsen M , Gomes AP , Ward TM , Minor RK , Blouin M-J , Schwab M , Pollak M , Zhang Y , Yu Y , Becker KG , Bohr VA , Ingram DK , Sinclair DA , Wolf NS , Sprindler SR , Bernier M , de Cabo R . Metformin improves healthspan and lifespan in mice. Nature Commun. (2013) ;4: :2192. |
[49] | Cancello R , Clement K . Is obesity an inflammatory illness? Role of low-grade inflammation and macrophage infiltration in human white adipose tissue. BJOG. (2006) ;113: (10):1141–7. |
[50] | Michaud A , Drolet R , Noël S , Paris G , Tchernof A . Visceral fat accumulation is an indicator of adipose tissue macrophage infiltration in women. Metabolism. (2012) ;61: (5):689–98. |
[51] | Tchkonia T , Morbeck DE , Von Zglinicki T , Van Deursen J , Lustgarten J , Scrable H , Scrable , Khosla S , Jensen D , Kirkland JL . Fat tissue, aging, and cellular senescence. Aging Cell. (2010) ;9: (5):667–84. |
[52] | Furukawa S , Fujita T , Shimabukuro M , Iwaki M , Yamada Y , Nakajima Y , Nakayama O , Makishima M , Matsuda M , Shimomura I . Increased oxidative stress in obesity and its impact on metabolic syndrome. J Clin Invest. (2004) ;114: (12):1752–61. |
[53] | Lee YS , Li P , Huh JY , Hwang IJ , Lu M , Kim JI , Ham M , Talukdar S , Chen A , Lu WJ , Bandyopadhyay GK , Schwendener R , Olefsky J , Kim JB . Inflammation is necessary for long-term but not short-term high-fat diet–induced insulin resistance. Diabetes. (2011) ;60: (10):2474–83. |
[54] | Paalvast YJW , Gerding A , Wang Y , Bloks VW , van Dijk TH , Havinga R , Willems van Dijk K , Rensen PCN , Bakker BM , Kuivenhoven JA , Groen AK . Male apoE*3-Leiden. CETP mice on high-fat high-cholesterol diet exhibit a biphasic dyslipidemic response, mimicking the changes in plasma lipids observed through life in men. Phyiol Rep. (2017) ;5: (19):e13376. |
[55] | Roozendaal YJW , Wang Y , Paalvast Y , Tambyrajah L , Li Z , Willems van Dijk K , Rensen PCN , Kuivenhoven JA , Groen AK , Hilbers PAJ , van Riel NAW . In vivo and in silico dynamics of the development of Metabolic Syndrome. PLoS Comput Biol. (2018) ;14: (6):e1006145. |
[56] | Yamada C , Yamada Y , Tsukiyama K , Yamada K , Yamane S , Harada N , Miyawaki K , Seino Y , Inagaki N . Genetic inactivation of GIP signaling reverses aging-associated insulin resistance through body composition changes. Biochem Biophys Res Commun. (2007) ;364: (1):175–80. |
[57] | Kanemaru Y , Harada N , Shimazu-Kuwahara S , Yamane S , Ikeguchi E , Murata Y , Kiyobayashi S , Hatoko T , Inagaki N . Absence of GIP secretion alleviates age-related obesity and insulin resistance. J Endocrinol. (2020) ;245: (1):13–20. |
[58] | Spielman L , Klegeris A . The role of insulin and incretins in neuroinflammation and neurodegeneration. Immunoendocrinol. (2014) ;1: :e391. |
[59] | Kim S-J , Nian C , Karunakaran S , Clee SM , Isales CM , McIntosh CHS . GIP-overexpressing mice demonstrate reduced diet-induced obesity and steatosis, and improved glucose homeostasis. PLoS One. (2012) ;7: (7):e40156. |


