
Biological age and diet: Measuring the impact of lifestyle on a 6CpG-epigenetic clock
Abstract
BACKGROUND:
Changes in DNA methylation along the life have been documented, and environmental exposures (including diet, physical activity and smoking) can accelerate or decelerate this process. The epigenetic clock estimates the biological age of an individual measuring methylation patterns in specific areas of its genome. Recently, a new epigenetic clock based on 6 CpGs has been proposed, with high potential to become an easy accessible tool able to measure the epigenetic age (EA) of an individual.
OBJECTIVES:
This study aims to validate the 6 CpG epigenetic clock comparing it with other biomarkers of aging such as telomere length (TL) and methylation in the long interspersed nuclear element-1 (LINE-1). The impact of lifestyle associated factors on these molecular marks has been evaluated.
METHODS:
200 healthy participants having extreme dietary patterns (healthy vs western diet) were selected. Dietary intakes, body composition, physical activity level and smoking has been assessed. DNA extracted from whole blood was used to measure the 6CpG-EA, TL and LINE-1 methylation levels.
RESULTS:
6CpG-EA was positively correlated with chronological age (r = 0.591; p = 7.2*10-20) and negatively with TL (r = –0.150; p = 0.040) and LINE-1 methylation (r = –0.240; p = 0.001). Despite the fact that no significant associations were detected with the overall diet quality (HEI), 6CpG-EA was correlated with dietary intakes of nutrients involved in the one-carbon (1 C) metabolism, especially in the western diet group.
CONCLUSION:
These results support the 6CpG epigenetic clock as an easy accessible tool to estimate biological age, in accordance with other molecular markers of aging, and suggest that EA can be modulated by micronutrients involved in the 1 C metabolism.
Abbreviations
AA | Age acceleration |
CpG | Cytosine-Guanine dinucleotide |
EA | Epigenetic age |
HEI | Healthy Eating Index |
LINE | Long interspersed nuclear elements |
TL | Telomere length |
1Introduction
Epigenetic marks on DNA and histones are not entirely maintained in somatic cells over aging [1]. This altered epigenomic state, referred to ‘epigenetic drift’, contributes to impaired cellular and molecular functions in aged cells [2]. With regards to DNA methylation in mammals, aging is characterized by a global DNA hypomethylation and local changes in the methylation levels of specific DNA loci [3, 4]. Global hypomethylation in particular affects highly methylated repeat sequences, such as transposable elements [5–7]. Since CpG sites are particularly enriched at transposable elements (accounting for > 65% of those found throughout the human genome), the analysis of methylation levels in these areas of the genome has been considered as a surrogate marker of global levels of DNA methylation [6]. Among transposable elements, the long interspersed nuclear elements (LINEs) are those whose methylation can be altered in response to stress, infection, diseases [8] and have been associated to genomic instability [9, 10]. Moreover, LINE-1 hypomethylation is permissive for LINE-1 transcription [11] and it is a common condition in aging and age-related diseases [5, 6]. Nevertheless, despite this prevailing tendencies to hypomethylation in aging, DNA could be either hypomethylated or hypermethylated at specific loci [12].
Due to the association between aging and specific DNA methylation patterns [3], it has been suggested that, collectively, changes in DNA methylation at specific sites can be used as an “epigenetic clock” to predict the biological age and the lifespan of an individual [12]. Epigenetic clocks use algorithms to calculate biological age on the basis of a read-out of the extent to which dozens or even hundreds of CpGs across an individual’s genome are methylated. Classically, these models are trained to estimate chronological age. While chronological age refers to the time elapsed since the birth of the individual, biological age is linked to the decline of biological functions. The deviation measured between the epigenetic and the chronological age, often referred to as either DeltaAge or age acceleration (AA), tends to be predictive of age-related health outcomes, such as mortality and disease burden. Thus, epigenetic age is thought to be a proxy for biological age, and epigenetic clocks are considered tools able to trace biological aging [13].
Although the biological and chronological ages of an individual with a healthy lifestyle should match, exposition to detrimental environmental factors can increase biological age (i.e., promoting AA). Thus, it has been suggested that the epigenetic clock might help to quantify the impact of risk factors associated to the aging process (i.e., exposure to environmental factors such as unhealthy diet, alcohol use, tobacco and stress) on the health status, by measuring acceleration or deceleration of the epigenetic age (EA) [14].
Among environmental exposures, diet is one of the most well-described factors able to modulate the epigenome [15]. In particular, the influence of diet on DNA methylation pathways (especially through the regulation of the one-carbon metabolism [16, 17]) as well as its impact on the aging process [18–21] have been widely described. Both the overall diet quality and the availability of nutrients involved in the one-carbon cycle (1CC) (i.e., B vitamins, betaine and choline) might impact the DNA methylation pathways [17] and, consequentially, the epigenetic age.
Some literature concerning the impact of diet and lifestyle on the epigenetic clock is available [22–24]. However, contrasting evidence has been collected [25] and different approaches to measure the epigenetic clock have been used. Indeed, several epigenetic clocks have been developed that predict biological age based on the changes in methylation from a tissue or blood at different selected CpGs. One of the first and most popular epigenetic clock was developed by Horvath [13]. The Horvath clock used 353 CpG sites (obtained from publicly available datasets for various human tissues and cell types) to predict biological age. Other clocks have been developed, trying to reduce the number of CpGs used maintaining a good accuracy [14]. Indeed, despite most of the epigenetic clocks rely on the Illumina BeadChip technology, a targeted analysis limited to a few CpGs is more cost-effective, faster and less dependent on availability of this technology and its specific BeadChip versions. For this reason, a targeted approach to epigenetic age measurement might facilitate the translation of this interesting biomarker towards an easily accessible and more standardized test, as requested by the European in vitro diagnostics regulations (IVDR). Several pyrosequencing-based epigenetic clocks have been proposed for animal models [26] and humans [27, 28]. Among them, Han et al. recently elegantly described the possibility to use methylation levels at 6 CpGs to successfully estimate the biological age from human blood DNA samples [29]. To select age-associated CpGs, they used a training set of 973 DNAm profiles of healthy human blood samples (1 to 101 years old), derived from 7 different studies and based on the 450 k Illumina BeadChip platform. They selected candidate CpGs either for linear correlation (Pearson’s correlation), continuous non-linear association (Spearman’s rank-order), or by linear correlation with the logarithm of age. After a careful evaluation and elimination of CpGs that might act as confounding factors, they identified and validated in an independent set, several epigenetic clocks based on a different number of CpGs [29]. Among these, the simpler, but still informative, was the model based on 6 CpGs, which appeared as an easily accessible tool to evaluate the epigenetic age (6CpG-EA).
Thus, the aim of this study was: 1) to validate the measurement of epigenetic age through a 6-CpG model in an independent cohort of 200 healthy subjects, 2) to test the correlation between the 6-CpG-epigenetic clock and other parameters associated with biological aging (LINE-1 methylation and telomere length (TL)), 3) to test if lifestyle factors are associated with the 6CpG-EA, with a particular focus on diet quality and intake of vitamins involved in the 1CC.
2Materials and methods
2.1Enrolment of study participants, evaluation of body composition and physical activity levels
Participants gave their written informed consent (procedures approved by the Local Ethics Committee at Poznań University of Medical Sciences (number 486/2016)). A detailed description of the course of research, recruitment procedure and inclusion/exclusion criteria has been previously published [30–32]. The mean age of the recruited cohort is 38.2±4.9. Body Mass Index (BMI) was calculated as weight in kilograms (kg) divided by height in meters squared (m2). Fat mass percentage (% FM) was measured using the whole-body densitometry method with the predicted thoracic gas volume (BodPod, Cosmed, USA). Information about smoking habits were collected. No quantitative data about the number of cigarettes smoked per day were available. Physical activity (PA) level (1-low, 2-medium, 3-high) was estimated by means of a short form of the International Physical Activity Questionnaire (IPAQ) [33].
2.2Dietary records, diet quality and vitamin intake
Dietary records from three consecutive days have been collected. 200 subjects with extreme (healthy or western) dietary patterns were recruited. Such enrolment ensured high variance in the dietary intake within the group of participants and enabled analysing data in a broad range of intakes. The quality of diet was estimated by establishing the value of the Healthy Eating Index (HEI) [34, 35]. The dietary intakes (vitamins B1, B2, B6, B9, B12) were calculated using the Dieta 6.0 software (National Food and Nutrition Institute, Warsaw). Intakes of choline and betaine were calculated using the USDA database for the choline content of common foods [36]. Due to its connection with the 1CC, plasma homocysteine was assessed with using high-performance liquid chromatography with DAD detector (Merck Hitachi D-7000) [37, 38].
2.3DNA extraction, DNA methylation and TL assessments
DNA was extracted from whole blood using the NucleoSpin Blood Kit (Macherey-Nagel, Germany).
Relative TL was determined with a qPCR method normalizing the amount of telomere repeat amplification product to a single copy gene (IFNB1) product, as previously described [39]. 2 ng of gDNA were amplified and the SsoAdvanced Universal SYBR Green Supermix (Biorad) was used to optimize sensitivity and specificity of the assay. An inter-run calibrator was present in all PCR plates. Primers used are shown in Table 1 of supplementary materials (Table 1 S).
Table 1
Spearman’s correlations between 6CpG-EA, AA, TL, LINE-1 methylation and chronological age
| 6CpG-EA | AA | TL | LINE-1 | Age | ||
| B1 intake (mg/d) | r | –0.199 | –0.151 | 0.167 | 0.100 | –0.127 |
| p | 0.005 | 0.034 | 0.022 | 0.162 | 0.074 | |
| B2 intake (mg/d) | r | –0.114 | –0.120 | 0.142 | 0.120 | –0.045 |
| p | 0.111 | 0.094 | 0.052 | 0.094 | 0.531 | |
| B6 intake (mg/d) | r | –0.169 | –0.166 | 0.117 | 0.060 | –0.080 |
| p | 0.018 | 0.020 | 0.109 | 0.405 | 0.261 | |
| B9 intake (μg/d) | r | –0.160 | –0.127 | 0.136 | 0.029 | –0.102 |
| p | 0.025 | 0.076 | 0.063 | 0.683 | 0.152 | |
| B12 intake (μg/d) | r | –0.117 | –0.097 | 0.063 | 0.075 | –0.062 |
| p | 0.103 | 0.178 | 0.387 | 0.297 | 0.385 | |
| Choline intake (mg/d) | r | –0.184 | –0.179 | 0.177 | 0.110 | –0.065 |
| p | 0.010 | 0.012 | 0.015 | 0.125 | 0.360 | |
| Betaine intake (mg/d) | r | –0.066 | –0.004 | 0.077 | 0.170 | –0.129 |
| p | 0.361 | 0.960 | 0.296 | 0.018 | 0.071 | |
| Bonferroni Adj. p = 0.007 |
Bisulfite pyrosequencing was performed to assess DNA methylation levels in long interspersed nuclear element-1 (LINE-1), and the selected CpGs for the epigenetic clock estimation, as previously described [29, 40]. DNA was converted with bisulfite using the EZ-96 DNA Methylation Gold Kit (Zymo Research, Orange, USA) following the manufacturer’s instructions. The selected areas were amplified by means of the Pyromark PCR Kit (Qiagen, Germany) and sequenced using the Pyromark Q24 instrument (Qiagen, Germany). Primers used are listed in Table 1 S of supplementary materials. The CpGs selected for the epigenetic clock were associated with the genes of Elongation Of Very Long Chain Fatty Acids Protein 2 (ELOVL2), Immunoglobulin Superfamily Member 11 (IGSF11), Coiled-Coil Domain-Containing Protein 102B (CCDC102B), Collagen Type I Alpha 1 Chain (COL1A1), Four And A Half LIM Domains Protein 2 (FHL2), and MEIS1 Antisense RNA 3 (MEIS1-AS3). The methylation percentages of the 6 selected CpGs were used in a multivariable model to calculate the epigenetic age (6CpG-EA), as described by Han et al. [29]. The CpGs identified by Han et al. that have been used to calculate EA in this manuscript are detailed in supplementary materials Table 2 S. No transformation of the chronological age was applied since only adult (>30 y/o) were included in this study. AA was defined as the residuals from regressing predicted age on chronological age. Individuals with negative AA are considered to be biologically younger than their chronological age, and vice versa. LINE-1 methylation was determined interrogating the L1Hs sequences as described by Tabish et al. [40].
Table 2
Spearman’s correlations between the intakes of nutrients involved in the 1CC and 6CpG-EA, TL, LINE-1 methylation and chronological age
| Healthy diet group | Western diet group | ||||||||||
| 6CpG-EA | AA | TL | LINE | Age | 6CpG-EA | AA | TL | LINE | Age | ||
| B1 intake (mg/d) | r | –0.175 | –0.049 | –0.078 | 0.056 | –0.170 | –0.223 | –0.251 | 0.379 | 0.158 | –0.080 |
| p | 0.083 | 0.628 | 0.461 | 0.584 | 0.092 | 0.028 | 0.013 | 1.3*10-4 | 0.122 | 0.431 | |
| B2 intake (mg/d) | r | –0.039 | –0.010 | –0.055 | 0.111 | –0.036 | –0.216 | –0.231 | 0.335 | 0.164 | –0.086 |
| p | 0.700 | 0.921 | 0.603 | 0.273 | 0.719 | 0.034 | 0.023 | 0.001 | 0.108 | 0.395 | |
| B6 intake (mg/d) | r | –0.026 | –0.058 | –0.143 | 0.053 | 0.043 | –0.314 | –0.287 | 0.352 | 0.114 | –0.214 |
| p | 0.799 | 0.571 | 0.173 | 0.605 | 0.673 | 0.002 | 0.004 | 3.9*10-4 | 0.268 | 0.033 | |
| B9 intake (μg/d) | r | –0.113 | –0.046 | –0.027 | 0.049 | –0.101 | –0.281 | –0.243 | 0.305 | 0.114 | –0.193 |
| p | 0.266 | 0.651 | 0.795 | 0.634 | 0.317 | 0.005 | 0.017 | 0.002 | 0.268 | 0.055 | |
| B12 intake (μg/d) | r | –0.087 | –0.048 | –0.109 | 0.098 | –0.029 | –0.174 | –0.153 | 0.227 | 0.073 | –0.113 |
| p | 0.389 | 0.639 | 0.302 | 0.334 | 0.774 | 0.089 | 0.134 | 0.025 | 0.474 | 0.262 | |
| Choline intake (mg/d) | r | –0.125 | –0.111 | –0.004 | 0.195 | –0.027 | –0.266 | –0.260 | 0.348 | 0.042 | –0.122 |
| p | 0.219 | 0.272 | 0.973 | 0.053 | 0.792 | 0.009 | 0.010 | 4.8*10-4 | 0.685 | 0.226 | |
| Betaine intake (mg/d) | r | –0.006 | 0.116 | 0.06 | 0.025 | –0.198 | –0.152 | –0.178 | 0.082 | 0.284 | –0.039 |
| p | 0.952 | 0.262 | 0.573 | 0.809 | 0.052 | 0.137 | 0.081 | 0.423 | 0.005 | 0.699 | |
Bonferroni Adj. p = 0.007.
2.4Statistical analysis
Data are presented as means±standard deviations unless otherwise indicated. Correlations between continuous variables were tested with Pearson’s or Spearman’s correlations for parametric and non-parametric data, respectively. The normality of data distribution was evaluated using the Kolmogorov-Smirnov test. Parameters with skewed distributions were appropriately log-transformed before the analyses. Student’s t-test or ANOVA test with Bonferroni’s correction were used to test differences between means. General linear model was used to test association between categorical and continuous variables adjusting for covariates. The varimax-rotated Principal Component Analysis (PCA) was used as a technique for dimension reduction in multivariate analysis. A p-value < 0.05 was considered significant throughout the study. The Bonferroni correction was applied to correct p values in multiple comparisons. Since this study can be described as explorative, we reported also nominal correlations, as indicated in the text. IBM SPSS Statistics 18 [41] and R software version 4.0.5 (ggplot2 package [42]) was used for statistical analysis and visualization.
3Results
3.1Descriptive statistics
No significant differences in distribution of age (healthy diet group: 38.6±5.0; western diet group: 37.8±4.8; p = 0.215), genders (50% of males and 50% of females in both groups; p = 0.556) or smokers (14% in the healthy, 18% in the western diet group; p = 0.281) were measured between the healthy and the western diet group. Higher prevalence of sedentary people was in the western diet group than in the healthy diet group (p = 0.028). The overall dietary quality measured with the Healthy Eating Index (HEI) was highly different between the two groups (healthy diet group: 76.90±9.21; western diet group: 58.71±10.47; p = 1.8*10-28). Descriptive statistics for micronutrient intakes and blood homocysteine have been previously reported [30, 43] and are summarized in Table 3S. Significantly lower intakes of B2, B6, B9 and higher intakes of betaine were detected in the western than in the healthy diet group (Table 3S). A nominally higher homocysteine level was detected in the western diet group than in the healthy diet group (Table 3S).
3.2The 6CpG-epigenetic clock correlates with chronological age and other molecular hallmarks of aging (TL, LINE-1 methylation)
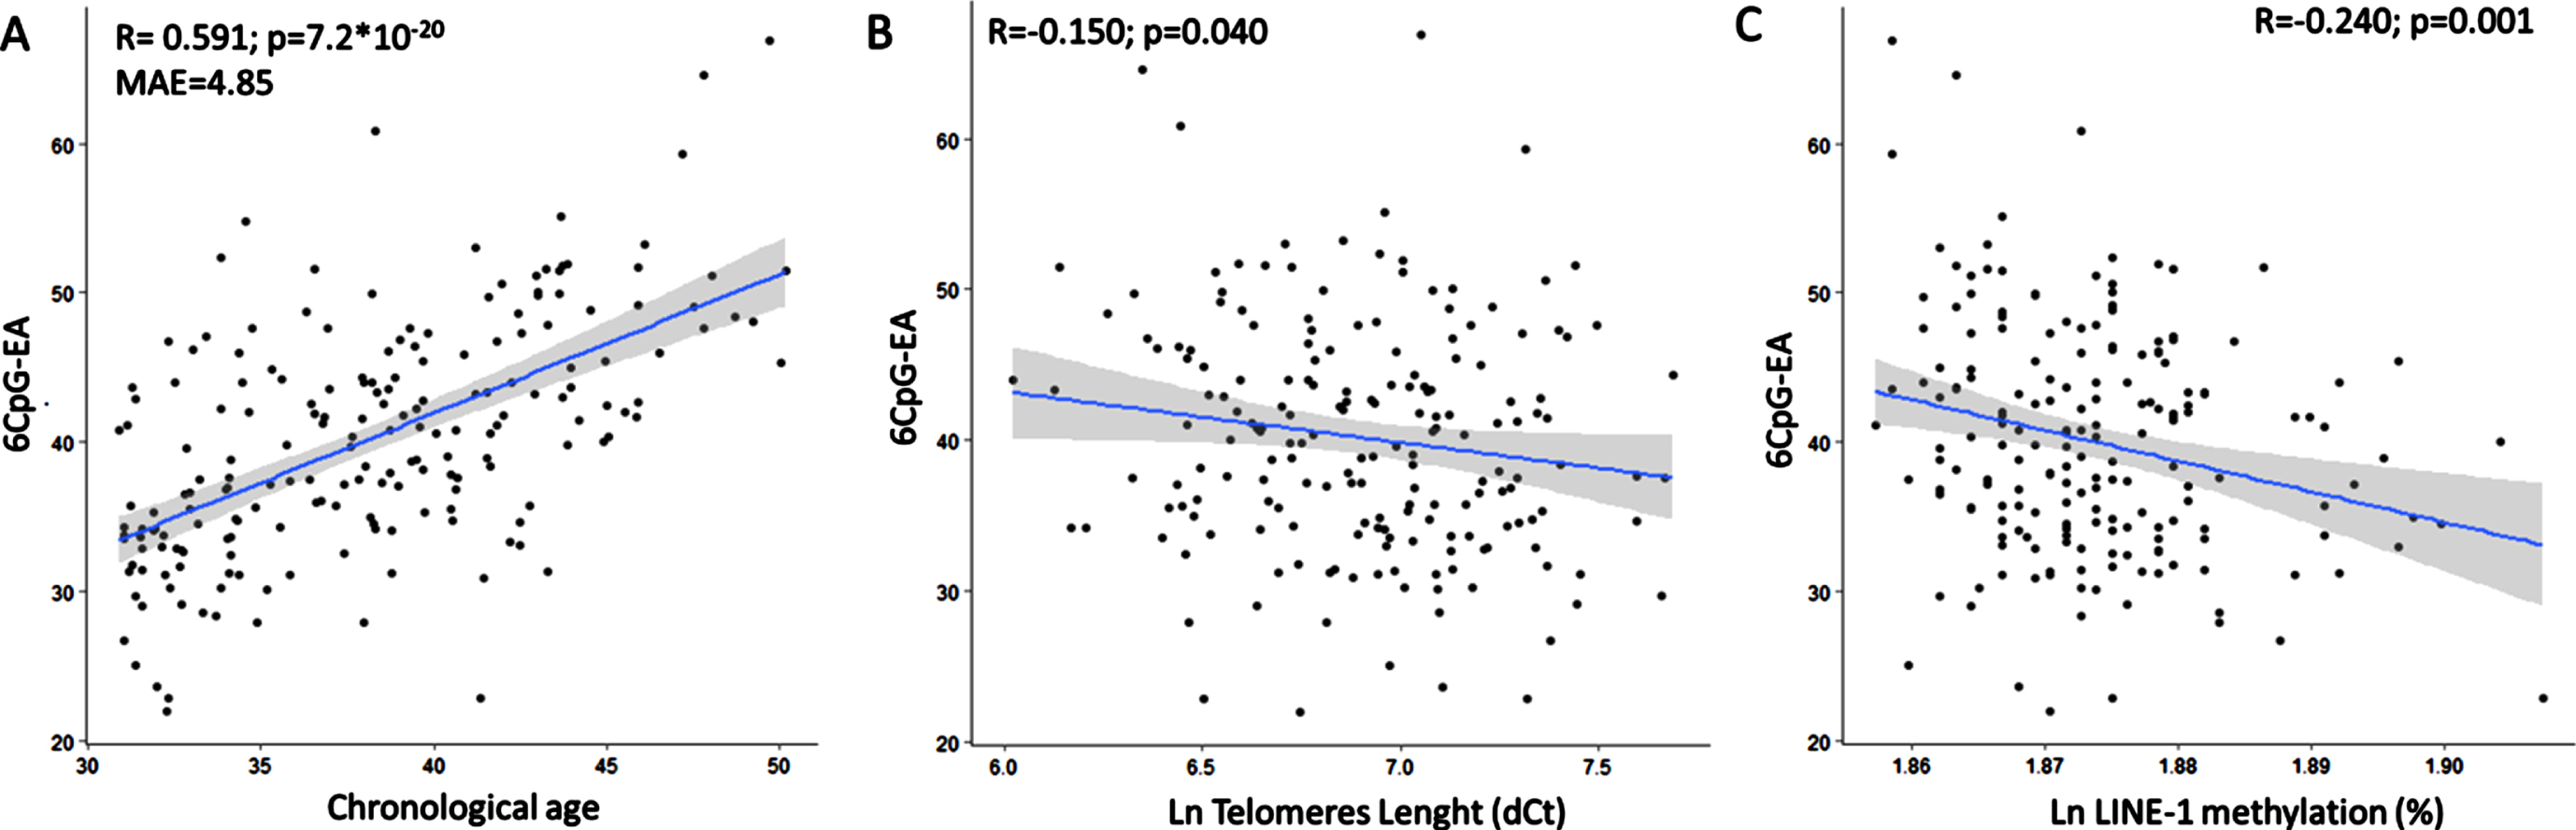
Mean 6CpG-EA in the whole group was 40.19±7.79. 6CpG-EA was highly correlated with chronological age in the whole study group (r = 0.591; p = 7.2*10-20, Mean Absolute Error, MAE = 4.85) (Fig. 1A). Results were similar when correlation was tested with the logarithm of age (r = 0.588; p = 1.3*10-19), which might be more suitable in young populations [44]. The 6CpG-EA was significantly lower in males than in females (mean diff: –3.05±1.09; p = 0.001), despite no significant differences were measured for chronological age between the two groups (p = 0.204) (Figure 1S). The 6CpG-EA was inversely correlated with TL (r = –0.150; p = 0.040) (Fig. 1B) and LINE-1 methylation (r = –0.240; p = 0.001) (Fig. 1C). Mean AA was 2.04±6.29 in the whole group. It was correlated with LINE-1 methylation (r = –0.217; p = 0.002), but not with telomere length (r = –0.051; p = 0.483).
Fig. 1
The 6CpG-EA is highly correlated with the chronological age (A). The 6CpG-EA is negatively correlated with telomeres length (B) and LINE-1 methylation levels (C). MAE: Mean Absolute Error.
3.36CpG-EA is not associated with smoking, physical activity and body composition
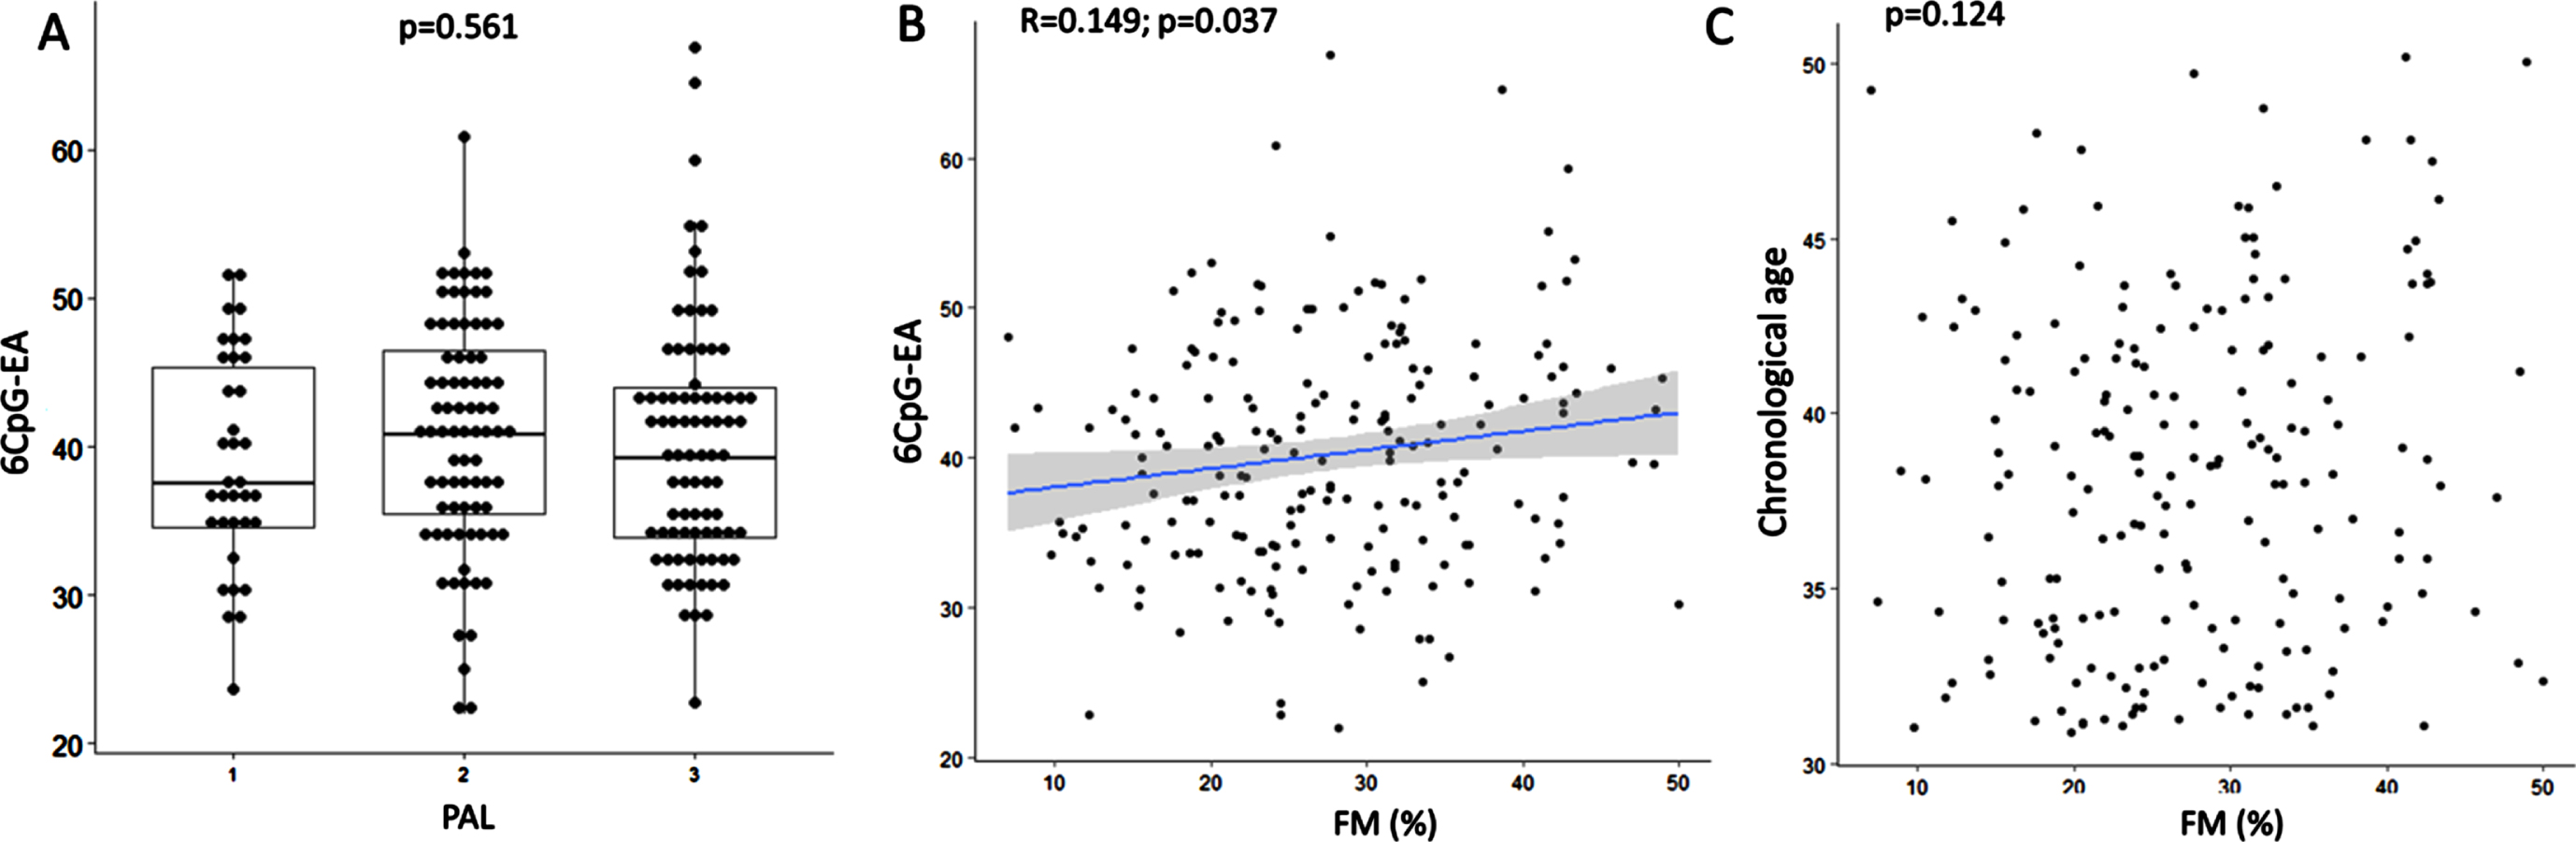
Neither the 6CpG-EA (p = 0.720) nor the AA (p = 0.737) were different between smokers and non-smokers. Neither the 6CpG-EA (p = 0.561) (Fig. 2A) nor the AA (p = 0.745) were different in subjects with low, medium and high levels of physical activity. The 6CpG-EA was positively correlated with FM% (r = 0.149; p = 0.037) (Fig. 2B), despite FM% was not correlated to the chronological age (r = 0.109; p = 0.124) (Fig. 2C). However, there was no correlation between FM% and AA (p = 0.151).
Fig. 2
Boxplots show 6CpG-EA differences among individuals with different physical activity levels (A). Correlation between FM% and 6CpG-EA (B) and chronological age (C) are shown. FM: fat mass; PAL: physical activity level (1 = low; 2 = medium; 3 = high) measured by the International Physical Activity Questionnaire (IPAQ).
3.4The 6CpG-EA is correlated with vitamin’s intake
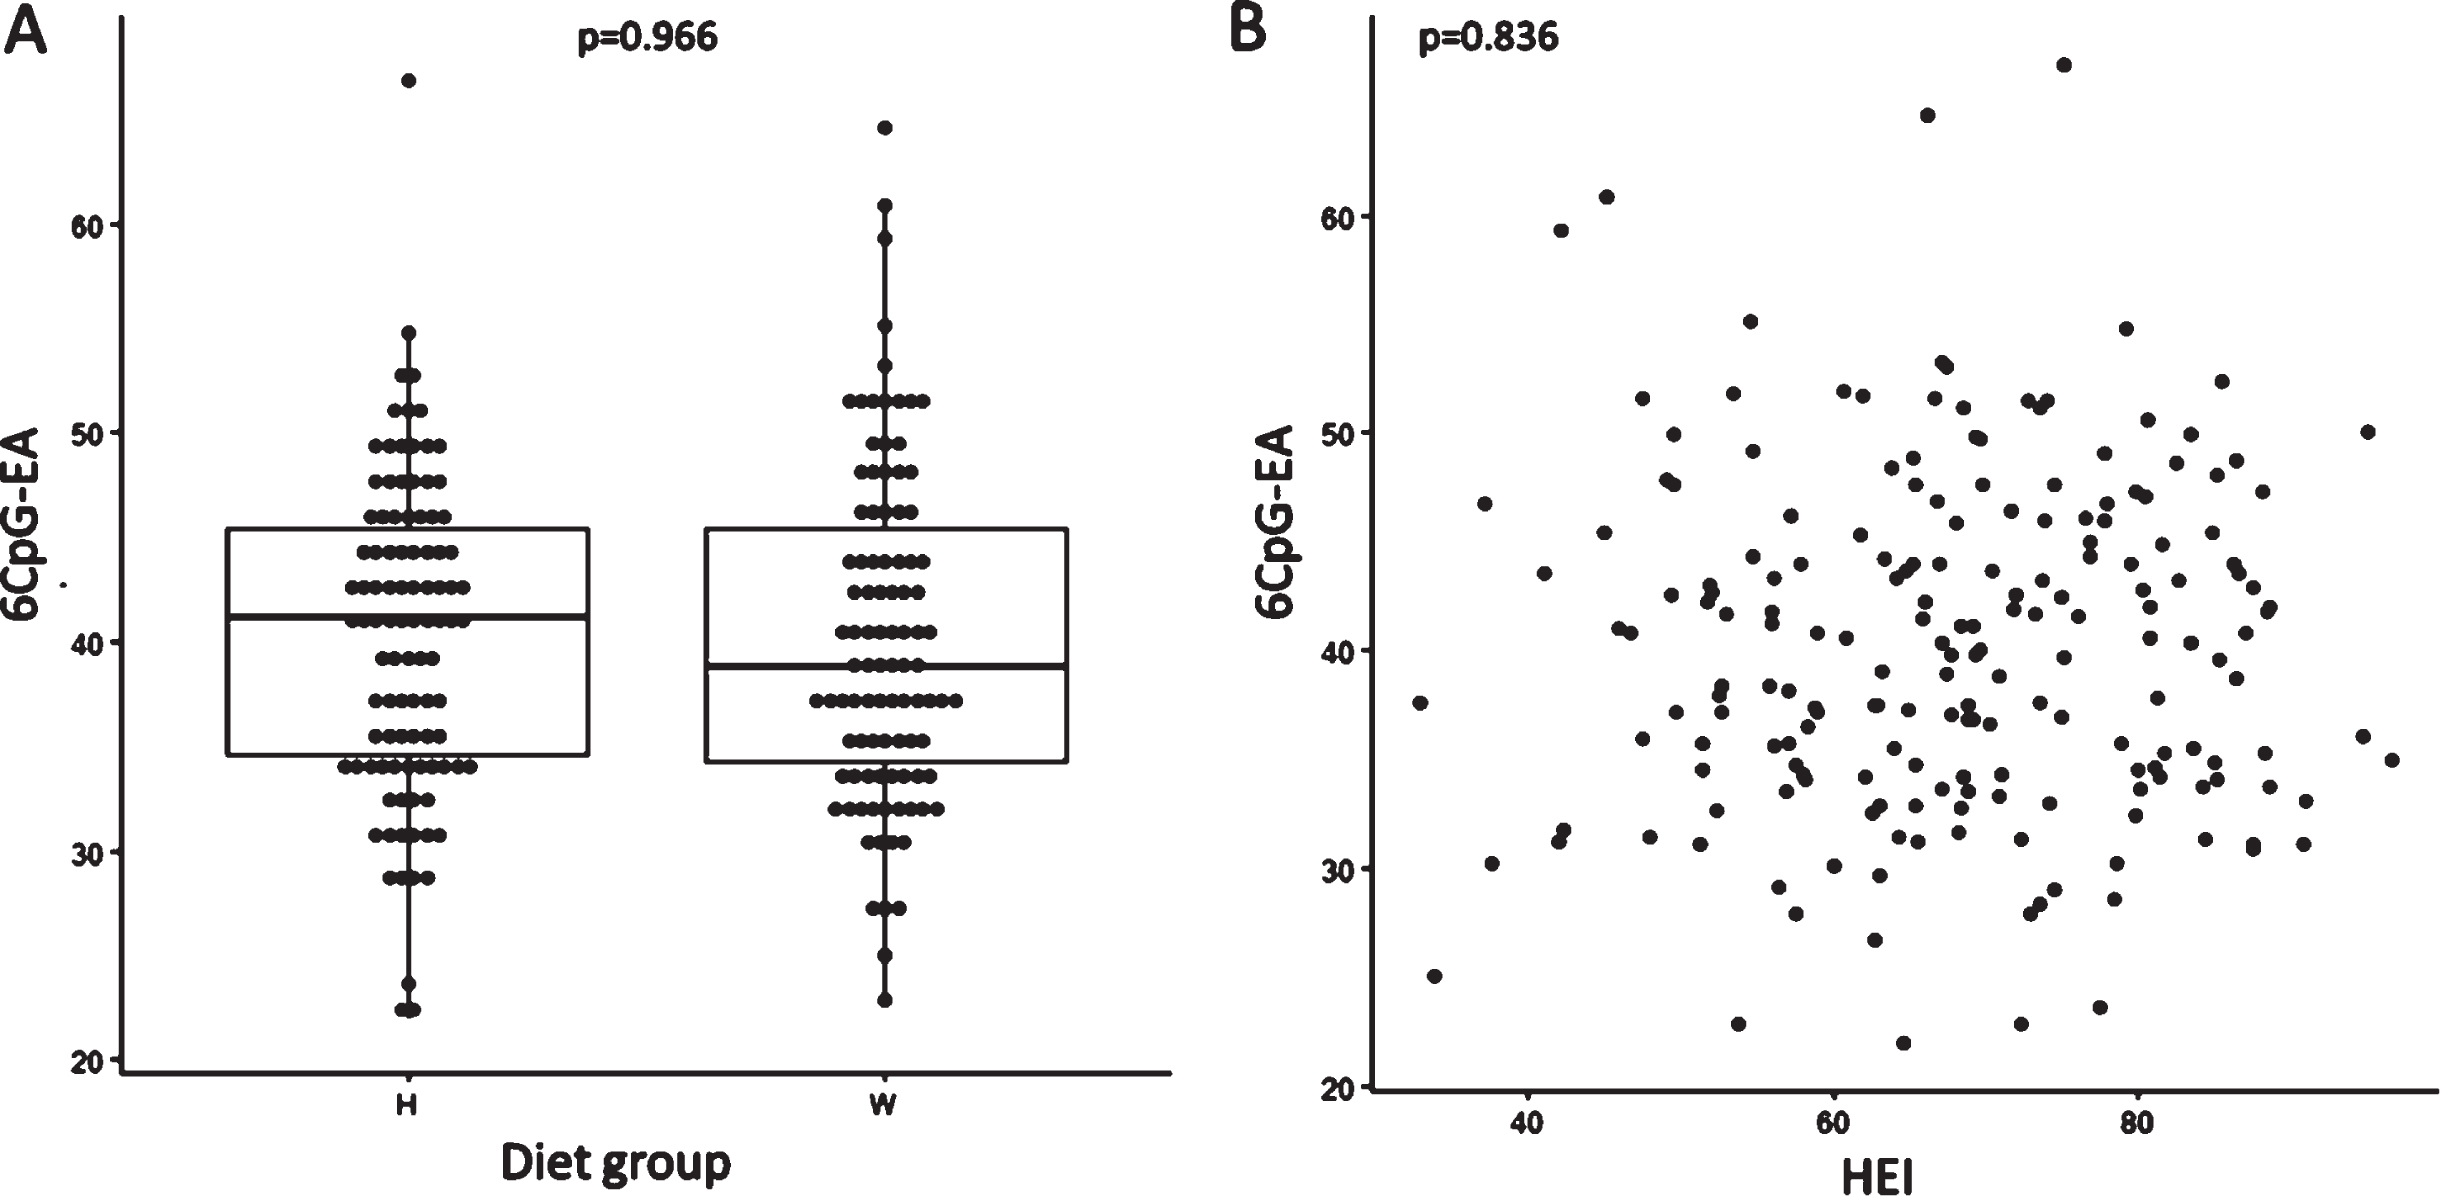
Biological age measured with the 6CpG-epigenetic clock (6CpG-EA) was 40.22±7.6 in the healthy and 40.17±8.03 (p = 0.966) in the western group (Fig. 3A). No significant differences in AA were measured between the two groups (healthy diet group: 1.58±6.52; western diet group: 2.51±6.04; p = 0.304). No correlation was detected between the overall diet quality (HEI) and 6CpG-EA (r = 0.015; p = 0.836) (Fig. 3B) or AA (r = –0.010; p = 0.873). Homocysteine blood level was not correlated to the 6CpG-EA in the whole sample (r = –0.136; p = 0.057).
Fig. 3
No differences in the 6CpG-EA between healthy and western diet group have been identified (A). No correlation between 6CpG-EA and HEI have been found (B). H: healthy diet group; W: western diet group.
Remarkably, the 6CpG-EA and AA were nominally correlated with the intake of several nutrients involved in the 1CC, which were not correlated to the chronological age (Table 1).
Of note, the intakes of these nutrients were significantly different between genders (Table 4S). Testing the association between the 6CpG-EA and genders adjusting the analysis for the intake of these nutrients, the difference in the epigenetic age previously detected between males and females was no more significant (p = 0.131). This suggests that rather intakes of nutrients involved in 1CC than sex is a determinant of the 6CpG-EA in this sample.
Due to the different distribution of these nutrients intake also between healthy and western diet groups (Table 3S), we tested the correlations with the 6CpG-EA separately. Data showed that the correlation between intakes of nutrients and the 6CpG-EA was significant in the western diet group but not in the healthy diet group (Table 2). Similar results were obtained considering the correlation between nutrients intake and AA (Table 2). This suggests that lower intakes of B1, B2, B6, B9 and choline, especially in a western dietary pattern, is reflected into an acceleration of the epigenetic age.
3.5Lifestyle associated factors and other molecular marks of aging (TL, LINE-1 methylation)
TL was negatively correlated with the chronological age (r = –0.163; p = 0.025). It did not differ between smokers and non-smokers (p = 0.720) or between genders (p = 0.194) and did not correlate with body composition (p = 0.489). Physical activity level was not associated to TL (p = 0.198).
TL was not different between the healthy diet and the western diet group (p = 0.194) and did not correlate with HEI (p = –0.026; p = 0.720). However, consistently to what observed for the 6CpG-EA, it showed a positive correlation with the intake of the nutrients involved in the 1CC (Table 2). This supports the hypothesis that the intake of these nutrients can have a role against the progressive deregulation of the genome functions occurring during aging.
LINE-1 methylation level was nominally correlated with chronological age (r = –0.139; p = 0.053). It did not differ between smokers and non-smokers (p = 0.735). A slightly but significantly lower methylation in the LINE-1 was observed in the female than in males in this group (M: 75.1±1.7% vs F: 74.4±1.3%; p = 0.004). LINE-1 methylation did not correlate with body composition (p = 0.122). Physical activity level was not correlated to LINE-1 methylation (p = 0.155).
LINE-1 methylation was not different between the healthy diet and the western diet group (p = 0.206) and did not correlate with HEI (p = –0.067; p = 0.352). It was not correlated with micronutrients intake in the entire sample (Table 1), except for a nominal correlation with betaine intake, that was significant only in the western diet group (r = 0.284; p = 0.005) (Table 2).
3.6PCA confirms the correlation between vitamin intakes and molecular hallmarks of aging
Due to the cross-correlation existing between the nutrients’ intakes (Bartlett’s test of sphericity; p = 1.9*10-93), we performed a PCA as an unsupervised technique for dimensionality reduction (Table 4S) to confirm the association between these variables and the biological age. Two principal components (PCs), cumulatively explaining the 57.3% of the variance have been computed (Table 5S). Analysis of PCA loadings identified B1, B2, B6, B9 as major contributors for PC1, while B12, choline and betaine for PC2.
PC1 was negatively correlated with homocysteine levels in the whole sample (r = –0.187; p = 0.009), supporting the hypothesis that lower vitamins intake can impact the 1CC thus leading to homocysteine accumulation and vice versa. No association between circulating homocysteine levels and PC2 was detected (p = 0.136).
PC1 was positively associated with TL (r = 0.195; p = 0.008) and negatively with the 6CpG-EA (r = –0.158; p = 0.028). No associations were detected with LINE-1 methylation (r = 0.066; p = 0.359). PC2 was correlated with 6CpG-EA (r = –0.158; p = 0.028) and with LINE-1 methylation (r = 0.198; p = 0.006) but not with TL (r = 0.116; p = 0.115). Similar results were obtained considering the AA. In particular, AA was correlated with PC1 (r = –0.158; p = 0.030) but not with PC2 (r = –0.94; p = 0.199). All in all, these findings suggest that higher intakes of these micronutrients can promote healthy aging measured with these molecular hallmarks.
Due to the differences concerning nutrient intakes measured between healthy and western diet groups (Table 3S), we tested the correlations between nutrient intakes and the molecular hallmarks of aging in the two groups separately (Fig. 4, Fig. 5).
Fig. 4
Scatter plot showing correlations between PC1 and 6CpG-EA (A), TL (B), AA (C), LINE-1 (D), in the two diet groups (H: healthy; W: western).
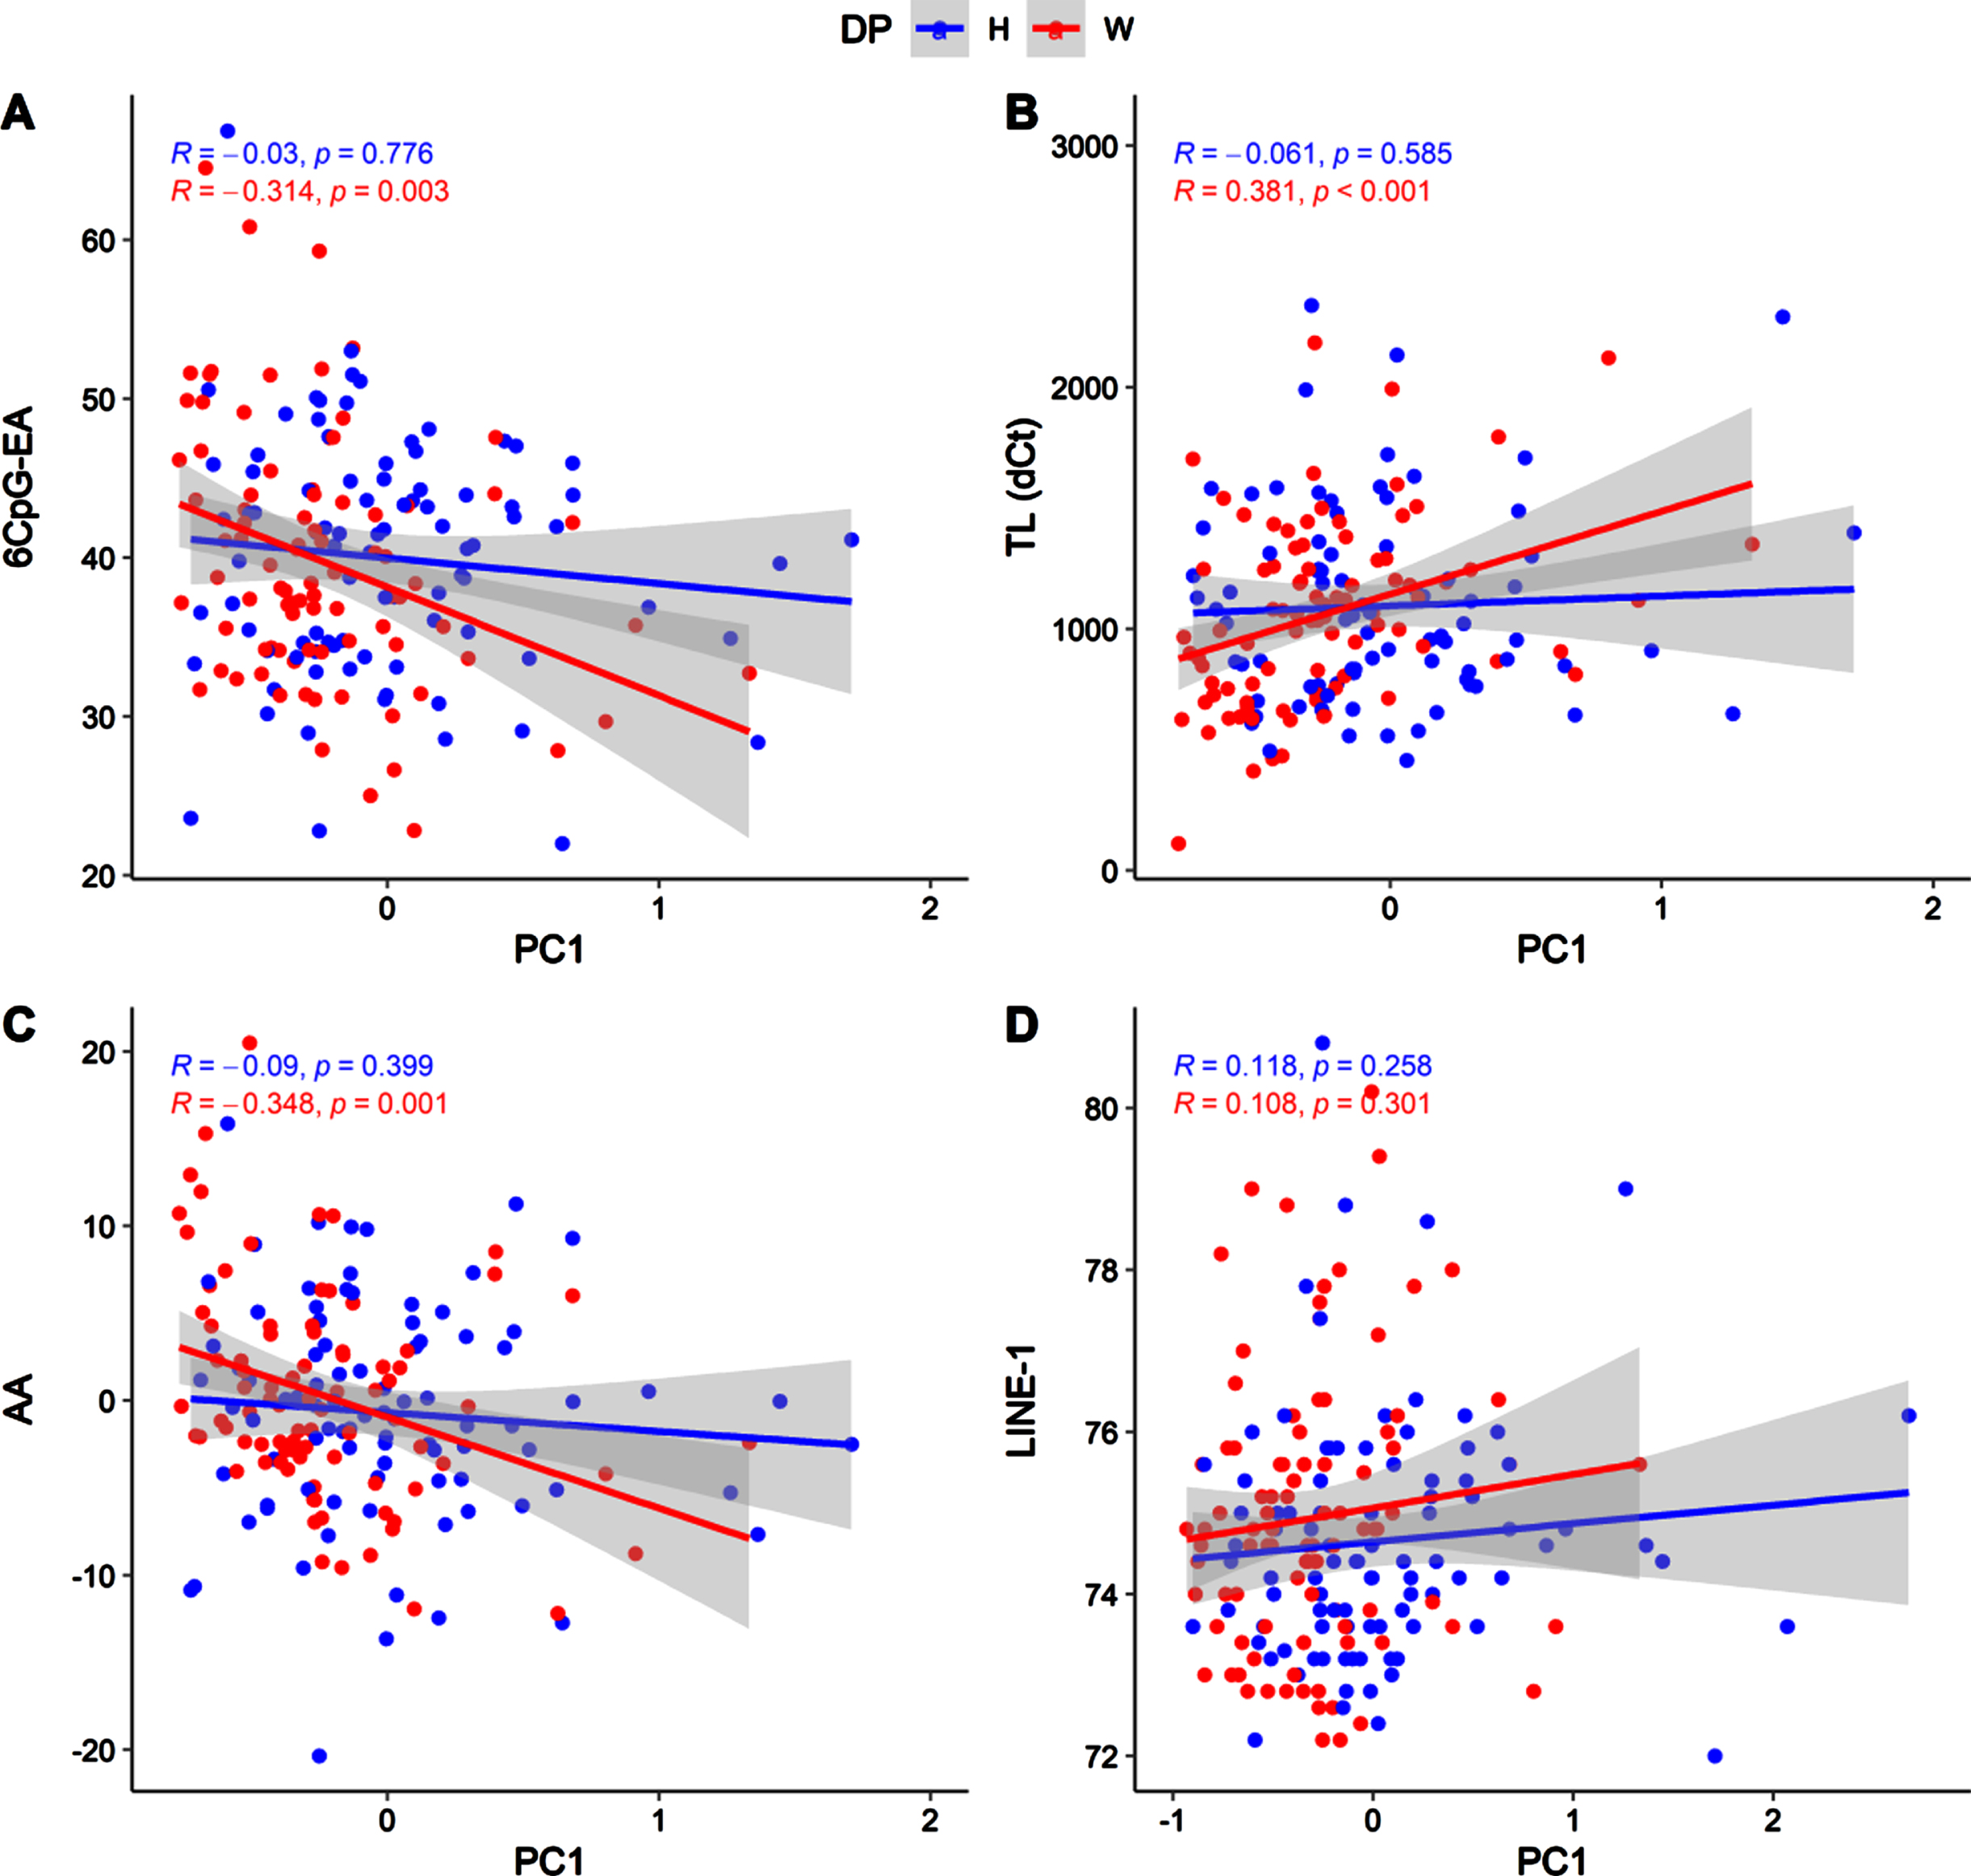
Fig. 5
Scatter plot showing correlations between PC2 and 6CpG-EA (A), TL (B), AA (C), LINE-1 (D), in the two diet groups (H: healthy; W: western).
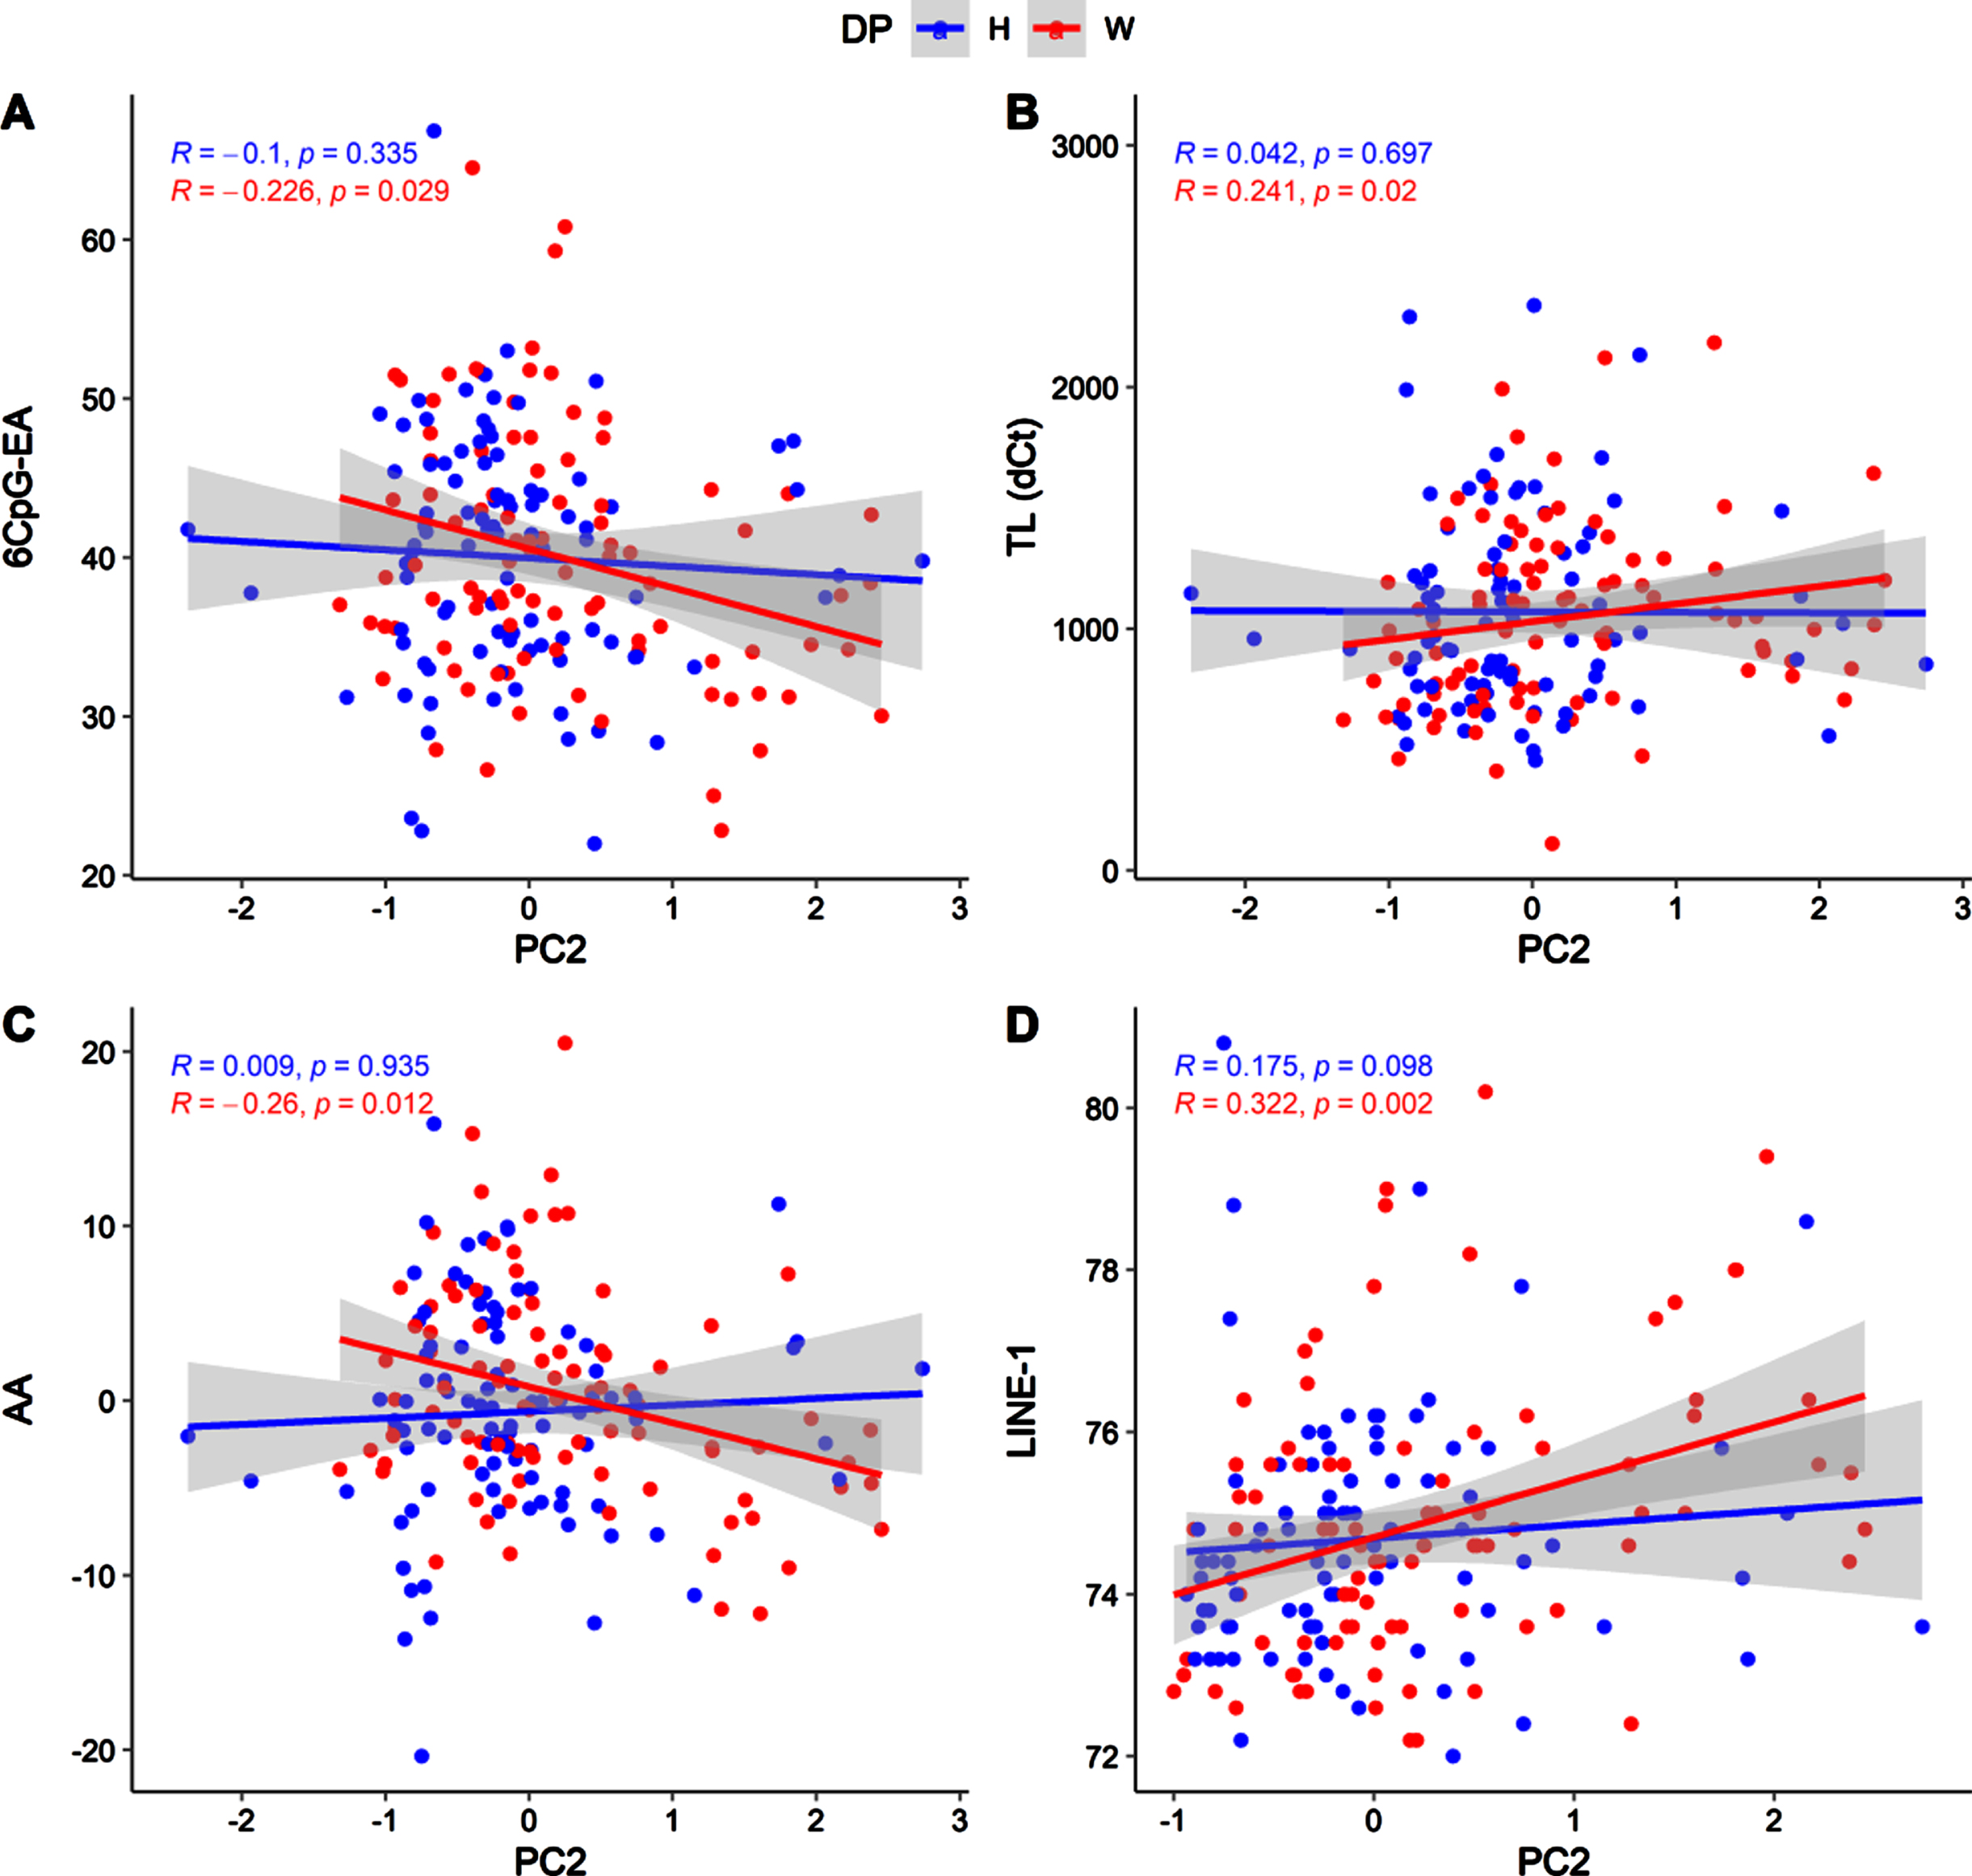
As previously shown, these correlations mainly concern PC1 and are significant only in the western diet group (Fig. 4). In particular, in the western diet group, PC1 was associated to significantly lower 6CpG-EA (r = –0.314; p = 0.003) and AA (r = –0.348; p = 0.001) and higher telomeres length (r = 0.381; p = 4.5*10-5). Similar but weaker correlations were detected in the western diet group for the PC2 (Fig. 5), which was also nominally correlated with LINE-1 methylation (r = 0.322; p = 0.002).
4Discussion
Recent epigenetic biomarkers of aging based on the analysis of DNA methylation at specific sites of the genome have been proposed (i.e. epigenetic clocks). Among them, a simple and easy accessible way to measure the epigenetic age has been proposed by Han et al. by measuring 6 CpGs. In this study, we tested the validity of this 6CpG-based clock in association with other biomarkers of aging in an independent cohort of 200 subjects. The 6CpG-EA was significantly correlated with chronological age and negatively associated with telomeres’ length and LINE-1 methylation levels. This evidence supports the validity of this tool to estimate the biological age of an individual, in accordance to other molecular hallmarks of aging. Since lifestyle factors have been related to a number of health outcomes as well as to molecular aging rates, it is of interest to understand if epigenetic clock can be used to trace the effect of smoking, physical activity, body composition and dietary intakes on the biological age. Previous evidence (summarized in a recent systematic review [45]) showed that acceleration of epigenetic clocks is significantly related to mortality, cardiovascular disease, cancer and diabetes. Moreover, associations between BMI, HIV infection, and male sex with acceleration of one or more epigenetic clocks have been identified. However, limited data are available about the impact of environmental factors, especially diet, on EA measured with targeted approaches (like the 6CpG-EA).
Despite cigarette smoking has been associated to alterations of DNA methylation patterns [46], we did not identify any association with smoking and the 6CpG-EA. This might be due to the lacking of quantitative data (number of cigarettes smoked per day) and limited number of smokers in the whole group. Moreover, the exclusion of the CpGs that are mostly affected by smoking in the selection process of the 6 CpG by Han et al. [29] might also explain the lack of this association. Physical activity was not associated to the 6CpG-EA in our sample, despite its correlation with epigenetic pathways has been described [47]. Although physical activity emerged as a modulator of the epigenetic age in some previous investigations based on other epigenetic clocks (e.g., [22]), this relation was not uniform among studies systematically reviewed by Oblak et al. [45]. A mild correlation between the 6CpG-EA with body composition was detected in our sample, but this was not confirmed adjusting the analysis for the chronological age. Even though previous studies identified a correlation between the EA and BMI [48, 49], the exact connection between BMI and methylation levels remains poorly understood [45]. Moreover, in studies suggesting a correlation between these parameters, body composition was described using BMI and waist circumference. On the contrary, in our study we assessed body composition by the BodPod, which is a gold standard method using whole-body densitometry to determine FM%, less affected than BMI by confounders [50–53].
A body of evidence has very recently investigated the impact of diet on the epigenetic age measured with the Illumina-based epigenetic clocks [22, 24, 54–57]. Despite some associations between the overall dietary pattern and the EA has been detected, none of the studies provided insights on the role of dietary intake of all the major nutrients involved in the 1CC. Interestingly, previous evidence showed an interaction between the methylenetetrahydrofolate reductase (MTHFR) C677T genotype and the impact of diet on the epigenetic age [56], suggesting a potential intermediary role of the 1CC underpinning the link between diet and epigenetic age. Also, Fitzgerald et al. have recently shown a reduction of the EA (measured from saliva DNA) in 43 males exposed to an healthy diet, which showed increased circulating levels of blood 5-methyltetrahydrofolate [24]. The hypothesis that boosting the 1C metabolism might promote health [17, 58–60] and healthy aging [60–62] is supported by our findings, showing that lowering the intake of nutrients (especially vitamin B6 and choline) might promote AA if associated to a western dietary pattern.
Despite the intake of these micronutrients was associated with the 6CpG-EA in our sample, this finding does not support an unnecessary extra-dietary supplementation, also because the effect of dietary supplements was not investigated in this study. Moreover, a long-term supplementation with methyl-donors has been associated to some risks [63–65], if not justified by specific physiopathological conditions (i.e., pregnancy, dietary limitations, macrocytic anaemia or hyperhomocysteinemia) [24]. On the contrary, these data highlight with a new prospective a potential role for these vitamins in maintaining the epigenetic age, which otherwise might be accelerated by an unhealthy dietary pattern associated to a reduced dietary intake for these nutrients.
A limitation of this study was that we did not consider socio-psychological aspects (e.g., education, stress, socio-economic status), that also have been shown to impact the epigenetic age [45, 66]. However, we studied a cohort which is highly homogeneous for sex and ethnicity (which can influence the EA [67]), and where dietary habits, physical activity levels and body composition were accurately measured. Another apparent limitation is that we applied the epigenetic age calculation in a relatively young cohort quite homogeneous for age (38.2±4.9). However, whether this is a limitation for the discovery of new epigenetic clocks, it is an advantage when we want to measure the effect of environmental factors on the biological age, since the confounding effect of chronological aging is limited.
In conclusion, the 6CpG-EA appears as an interesting tool able to measure the impact of lifestyle factors (including dietary habits) on human health in an easy-accessible way. This supports its validation and usage in other independent and large cohorts, with the aim to quantify the impact of dietary habits on human health. Nevertheless, other epigenetic clocks (such as PhenoAge [68], GrimAge [69], and DunedinPACE [70]) still remain better suitable and more informative tools to predict the effect of environmental exposures on the epigenome in case a more comprehensive analysis of the methylome can be performed.
Moreover, despite epigenetic clocks appear as interesting and promising tools to predict the biological age of an individual, it is still to be elucidated if methylation at the selected CpGs play a mechanistic role in the aging process. In this case, 6 CpG located in genes having different biological roles have been studied. ELOVL2 is involved in elongation of long-chain polyunsaturated fatty acids and its methylation is one of the most robust biomarkers of human age [71]. Even though whether ELOVL2 has a functional role in molecular aging is still a critical question, it has been reported that it regulates age-associated functional and anatomical aging in mice [72]. On the other hand, FHL2 is a scaffolding protein that modulates multiple signal transduction pathways, and it has been recently shown to be a novel regulator of obesity and energy expenditure [73]. However, whether an active role for some of the analysed genes in the aging process in supported by the literature, the role of others (i.e., IGSF11, CCDC102B, COL1A1 and MEIS1-AS3) in aging is still to be clarified. Interestingly, as discussed by Han et al., two of the CpGs included in the 6-CpG epigenetic clock (those in the ELOVL2 and FHL2 genes) were located in proximity of the binding site of CCCTC-binding factor (CTCF), which is involved in organization of chromatin structure. Since chromatin deregulation during aging is well documented [74], a functional role of methylation in this area in age promotion might be hypothesized. Definitely, an effort for future studies on epigenetic clocks is to describe if they are mere predictors of the biological age or if the studied CpGs have an active role in modulating aging. This is necessary to better support the usage of epigenetic clocks in clinical practice and to understand if the selected CpGs represent also a target for age rejuvenation and disease prevention.
Concerning the effects of diet on the selected epigenetic clock, our findings in particular suggest that dietary micronutrients supporting the 1CC might play a relevant role in maintaining a “young” epigenome. Remarkably, the possibility to monitor the epigenetic drift with epigenetic clocks suggests that personalized strategies aimed to prevent or even to reverse these age-related epigenetic changes to a “young” state might be developed in the near future [75]. Nevertheless, despite some interventional studies have been conducted [55, 56], further evidence from independent cohorts are warranted to promote the translation of the epigenetic clock to the clinic as a tool for precision nutrition.
Acknowledgments
We would like to thank Gaia De Simone and Irene Orzella for their support in the laboratory activities at UNICAM Nutrigenomics Laboratory. We also thank the School of Pharmacy of the University of Camerino for co-founding the PyroMark Q24 Pyrosequencer (Qiagen, Germany).
Funding
This work was supported by the National Science Center, Poland (Grant no. 2015/17/D/NZ9/01959) and institutional fund FPA300015 by Rosita Gabbianelli.
Conflict of interest
The authors have no conflict of interest to report.
Author contributions
LB: Conception and study design, data collection and analysis, interpretation and manuscript drafting. AMM: Cohort recruitment and samples collection, nutritional assessments, manuscript revision and editing. IP: Epigenetic assays. AC: Study design, supervision, manuscript revision and editing. RG: Conception and study design, supervision, manuscript revision and editing.
Supplementary material
[1] The supplementary material is available in the electronic version of this article: https://dx.doi.org/10.3233/NHA-220160.
References
[1] | Sen P , Shah PP , Nativio R , Berger SL , Epigenetic Mechanisms of Longevity and Aging, Cell (2016) ;166: (4):822–39. |
[2] | Teschendorff AE , West J , Beck S , Age-associated epigenetic drift: implications, and a case of epigenetic thrift? Hum Mol Genet (2013) ;22: (R1):R7–15. |
[3] | Unnikrishnan A , Freeman WM , Jackson J , Wren JD , Porter H , Richardson A , The role of DNA methylation in epigenetics of aging. Pharmacol Ther [Internet]. (2019) ;195: :172–85. Available from: https://www.sciencedirect.com/science/article/pii/S0163725818301980. |
[4] | Calvanese V , Lara E , Kahn A , Fraga MF , The role of epigenetics in aging and age-related diseases, Ageing Res Rev (2009) ;8: (4):268–76. |
[5] | Erichsen L , Beermann A , Arauzo-Bravo MJ , Hassan M , Dkhil MA , Al-Quraishy S , et al., Genome-wide hypomethylation of LINE-1 and Alu retroelements in cell-free DNA of blood is an epigenetic biomarker of human aging. Saudi J Biol Sci [Internet]. 2018/02/13. (2018) ;25: (6):1220–6. Available from: https://pubmed.ncbi.nlm.nih.gov/30174526. |
[6] | Mahmood W , Erichsen L , Ott P , Schulz WA , Fischer JC , Arauzo-Bravo MJ , et al., Aging-associated distinctive DNA methylation changes of LINE-1 retrotransposons in pure cell-free DNA from human blood, Sci Rep [Internet] (2020) ;10: (1):221227. Available from: https://doi.org/10.1038/s41598-020-79126-z. |
[7] | Cho YH , Woo HD , Jang Y , Porter V , Christensen S , Hamilton RF Jr , et al., The Association of LINE-1 Hypomethylation with Age and Centromere Positive Micronuclei in Human Lymphocytes, PLoS One [Internet]. (2015) ;10: (7):e0133909. doi: https://doi.org/10.1371/journal.pone.0133909. |
[8] | Byun H-M , Motta V , Panni T , Bertazzi PA , Apostoli P , Hou L , et al., Evolutionary age of repetitive element subfamilies and sensitivity of DNA methylation to airborne pollutants, Part Fibre Toxicol (2013) ;10: , 28. |
[9] | Su J , Shao X , Liu H , Liu S , Wu Q , Zhang Y , Genome-wide dynamic changes of DNA methylation of repetitive elements in human embryonic stem cells and fetal fibroblasts, Genomics (2012) ;99: (1):10–7. |
[10] | De Cecco M , Criscione SW , Peterson AL , Neretti N , Sedivy JM , Kreiling JA , Transposable elements become active and mobile in the genomes of aging mammalian somatic tissues, Aging (Albany NY) (2013) ;5: (12):867–83. |
[11] | Bourc’his D , Bestor TH Meiotic catastrophe and retrotransposon reactivation in male germ cells lacking Dnmt3L. Nature [Internet]. (2004) ;431: (7004):96–9. Available from: https://doi.org/10.1038/nature02886. |
[12] | Ashapkin VV , Kutueva LI , Vanyushin BF , Epigenetic Clock: Just a Convenient Marker or an Active Driver of Aging? Adv Exp Med Biol (2019) ;1178: :175–206. |
[13] | Horvath S , DNA methylation age of human tissues and cell types, Genome Biol [Internet]. (2013) ;14: (10):3156. Available from: https://doi.org/10.1186/gb-2013-14-10-r115. |
[14] | Topart C , Werner E , Arimondo PB , Wandering along the epigenetic timeline, Clin Epigenetics [Internet] (2020) ;12: (1):97. Available from: https://doi.org/10.1186/s13148-020-00893-7. |
[15] | Bordoni L , Gabbianelli R , Primers on nutrigenetics and nutri(epi)genomics: origins and development of precision nutrition, Biochimie (2019) ;160: :156–71. |
[16] | Anderson OS , Sant KE , Dolinoy DC , Nutrition and epigenetics: an interplay of dietary methyl donors, one-carbon metabolism and DNA methylation, J Nutr Biochem [Internet]. 2012/06/27 Available from (2012) ;23: (8):853–9. Available from: https://pubmed.ncbi.nlm.nih.gov/22749138. |
[17] | Mentch SJ , Locasale JW , One-carbon metabolism and epigenetics: understanding the specificity, Ann N Y Acad Sci [Internet] (2016) ;1363: (1):91–8. Available from: https://doi.org/10.1111/nyas.12956. |
[18] | Ribarič S , Diet and aging, Oxid Med Cell Longev (2012) ;2012: :741468. |
[19] | Jones MJ , Goodman SJ , Kobor MS , DNA methylation and healthy human aging, Aging Cell (2015) ;14: (6):924–32. |
[20] | Crott JW , Choi S-W , Ordovas JM , Ditelberg JS , Mason JB , Effects of dietary folate and aging on gene expression in the colonic mucosa of rats: implications for carcinogenesis, Carcinogenesis (2004) ;25: (1):69–76. |
[21] | Choi S-W , Friso S , Epigenetics: A New Bridge between Nutrition and Health, Adv Nutr (2010) ;1: (1):8–16. |
[22] | Quach A , Levine ME , Tanaka T , Lu AT , Chen BH , Ferrucci L , et al., Epigenetic clock analysis of diet, exercise, education, and lifestyle factors, Aging (Albany NY) [Internet] (2017) ;9: (2):419–46.Available from: https://pubmed.ncbi.nlm.nih.gov/. |
[23] | Fiorito G , Caini S , Palli D , Bendinelli B , Saieva C , Ermini I , et al., DNA methylation-based biomarkers of aging were slowed down in a two-year diet and physical activity intervention trial: the DAMA study, Aging Cell [Internet] (2021) ;20: (10):e13439. Available from: https://doi.org/10.1111/acel.13439. |
[24] | Fitzgerald KN , Hodges R , Hanes D , Stack E , Cheishvili D , Szyf M , et al., Potential reversal of epigenetic age using a diet and lifestyle intervention: a pilot randomized clinical trial, Aging (Albany NY) [Internet]. 2021/04/12. (2021) ;13: (7):9419–32.Available from: https://pubmed.ncbi.nlm.nih.gov/. |
[25] | Chamberlain JA , Dugué P-A , Bassett JK , Hodge AM , Brinkman MT , Joo JE , et al., Dietary intake of one-carbon metabolism nutrients and DNA methylation in peripheral blood, Am J Clin Nutr [Internet] (2018) ;108: (3):611–216.Available from: Available from: https://doi.org/10.1093/ajcn/nqy119. |
[26] | Han Y , Eipel M , Franzen J , Sakk V , Dethmers-Ausema B , Yndriago L , et al., Epigenetic age-predictor for mice based on three CpG sites. Elife. 2018 Aug;7. |
[27] | Bekaert B , Kamalandua A , Zapico SC , Van de Voorde W , Decorte R , Improved age determination of blood and teeth samples using a selected set of DNA methylation markers, Epigenetics (2015) ;10: (10):922–30. |
[28] | Zbieć-Piekarska R , Spólnicka M , Kupiec T , Makowska Z , Spas A , Parys-Proszek A et al., Examination of DNA methylation status of the ELOVL2 marker may be useful for human age prediction in forensic science, Forensic Sci Int Genet (2015) ;14: :161–7. |
[29] | Han Y , Franzen J , Stiehl T , Gobs M , Kuo C-C , Nikolić M , et al., New targeted approaches for epigenetic age predictions, BMC Biol [Internet]. (2020) ;18: (1):71. Available from: https://doi.org/10.1186/s12915-020-00807-2. |
[30] | Malinowska A , Easy Diet Screener: a quick and easy tool for determining dietary patterns, which are associated with lipid profile and the lipid content of the body. J Nutr Diet. 2021; 1-15. |
[31] | Malinowska A , Kok D , Steegenga W , GJEJ H , Chmurzynska A To what extent do dietary patterns shape human gut microbiota composition and its predicted functional properties? Food Res Int. 2021;Submitted. |
[32] | Bordoni L , Malinowska AM , Petracci I , Szwengiel A , Gabbianelli R , Chmurzynska A , Diet, trimethylamine metabolism and mitochondrial DNA: an observational study, Mol Nutr Food Res (2022) ;13: (66):e2200003. |
[33] | Craig CL , Marshall AL , Sjöström M , Bauman AE , Booth ML , Ainsworth BE , et al, International physical activity questionnaire: 12-country reliability and validity, Med Sci Sports Exerc (2003) ;35: (8):1381–95. |
[34] | Reedy J , Lerman JL , Krebs-Smith SM , Kirkpatrick SI , Pannucci TE , Wilson MM , et al, Evaluation of the Healthy Eating Index-J Acad Nutr Diet (2018) ;118: (9):1622–33. |
[35] | Krebs-Smith SM , Pannucci TE , Subar AF , Kirkpatrick SI , Lerman JL , Tooze JA , et al, Update of the Healthy Eating Index: HEI-J Acad Nutr Diet (2018) ;118: (9):1591–602. |
[36] | https://data.nal.usda.gov/dataset/usda-database-choline-content-common-foods-release-2-2008. |
[37] | Głowacki R , Bald E , Determination of N-Acetylcysteine and Main Endogenous Thiols in Human Plasma by HPLC with Ultraviolet Detection in the Form of Their S-Quinolinium Derivatives, J Liq Chromatogr Relat Technol [Internet]. (2009) ;32: (17):2530–44. https://doi.org/10.1080/10826070903249666. |
[38] | Głowacki R , Bald E . Fully automated method for simultaneous determination of total cysteine, cysteinylglycine, glutathione and homocysteine in plasma by HPLC with UV absorbance detection, J Chromatogr B [Internet] (2009) ;877: (28):3400–4. Available from: https://www.sciencedirect.com/science/article/pii/S157002320900419X |
[39] | Vasilishina A , Kropotov A , Spivak I , Bernadotte A . Relative Human Telomere Length Quantification by Real-Time PCR, Methods Mol Biol (2019) ;1896: :39–44. |
[40] | Tabish AM , Baccarelli AA , Godderis L , Barrow TM , Hoet P , Byun H-M , Assessment of Changes in Global DNA Methylation Levels byPyrosequencing® of Repetitive Elements, Methods Mol Biol (2015) ;1315: :201–7. |
[41] | IBM. IBM SPSS Statistics for Windows, Version 22.0. Armonk, NY: IBM Corp. 2013. |
[42] | Wickham H , Wickham H gplot2: Elegant Graphics for Data Analysis. Springer-Verlag New York [Internet]. 2009; Available from: http://ggplot2.org. |
[43] | Malinowska AM , Schmidt M , Kok DE , Chmurzynska A Folate production by fecal bacteria is not associated with human blood folate status: crosstalk between dietary patterns, gut microbiota, and folate metabolism. Under Submiss. |
[44] | Alisch RS , Barwick BG , Chopra P , Myrick LK , Satten GA , Conneely KN , et al., Age-associated DNA methylation in pediatric populations, Genome Res (2012) ;22: (4):623–32. |
[45] | Oblak L , van der Zaag J , Higgins-Chen AT , Levine ME , Boks MP , A systematic review of biological, social and environmental factors associated with epigenetic clock acceleration, Ageing Res Rev (2021) ;69: :101348. |
[46] | Gao X , Jia M , Zhang Y , Breitling LP , Brenner H , DNA methylation changes of whole blood cells in response to active smoking exposure in adults: a systematic review of DNA methylation studies, Clin Epigenetics (2015) ;7: :113. |
[47] | Petracci I , Gabbianelli R , Bordoni L , The Role of Nutri(epi)genomics in Achieving the Body’s Full Potential in Physical Activity, Antioxidants (Basel, Switzerland) (2020) ;9: (6). |
[48] | Sun D , Zhang T , Su S , Hao G , Chen T , Li Q-Z , et al., Body Mass Index Drives Changes in DNA Methylation, Circ Res [Internet] (2019) ;125: (9):824–33. Available from: https://doi.org/10.1161/CIRCRESAHA.119.315397. |
[49] | McCartney DL , Hillary RF , Stevenson AJ , Ritchie SJ , Walker RM , Zhang Q , et al., Epigenetic prediction of complex traits and death, Genome Biol (2018) ;19: (1):136. |
[50] | Frankenfield DC , Rowe WA , Cooney RN , Smith JS , Becker D , Limits of body mass index to detect obesity and predict body composition, Nutrition (2001) ;17: (1):26–30. |
[51] | Liu P , Ma F , Lou H , Liu Y , The utility of fat mass index vs, body mass index and percentage of body fat in the screening of metabolic syndrome. BMC Public Health (2013) ;13: :629. |
[52] | Kyle UG , Schutz Y , Dupertuis YM , Pichard C , Body composition interpretation, Contributions of the fat-free mass index and the body fat mass index. Nutrition (2003) ;19: (7-8):597–604. |
[53] | Fosbøl MØ , Zerahn B , Contemporary methods of body composition measurement, Clin Physiol Funct Imaging [Internet]. (2015) ;35: (2):81–97. Available from: https://doi.org/10.1111/cpf.12152. |
[54] | Kim Y , Ma J , Levy D , Abstract MP Healthy Diet Quality Is Associated With Epigenetic Age Deceleration, Circulation [Internet]. (2021) ;143: (Suppl_1):AMP06–AMP06. Available from: https://doi.org/10.1161/circ.143.suppl_1.MP06. |
[55] | Gensous N , Garagnani P , Santoro A , Giuliani C , Ostan R , Fabbri C , et al., One-year Mediterranean diet promotes epigenetic rejuvenation with country- and sex-specific effects: a pilot study from the NU-AGE project, GeroScience [Internet] (2020) ;42: (2):687–701. Available from: https://doi.org/10.1007/s11357-019-00149-0. |
[56] | Sae-Lee C , Corsi S , Barrow TM , Kuhnle GGC , Bollati V , Mathers JC , et al., Dietary Intervention Modifies DNA Methylation Age Assessed by the Epigenetic Clock, Mol Nutr Food Res [Internet] (2018) ;62: (23):1800092. Available from: https://doi.org/10.1002/mnfr.201800092. |
[57] | Kresovich JK , Park Y-MM , Keller JA , Sandler DP , Taylor JA , Healthy eating patterns and epigenetic measures of biological age, Am J Clin Nutr [Internet]. (2022) ;115: (1):171–9. Available from: https://doi.org/10.1093/ajcn/nqab307. |
[58] | Bordoni L , Petracci I , Mlodzik-Czyzewska M , Malinowska AM , Szwengiel A , Sadowski M , et al., Mitochondrial DNA and epigenetics: Investigating interactions with the onecarbon metabolism in obesity. Oxid Med Cell Longev. 2022;9171684. |
[59] | Mlodzik-Czyzewska MA , Malinowska AM , Chmurzynska A , Low folate intake and serum levels are associated with higher body mass index and abdominal fat accumulation: a case control study, Nutr J [Internet]. (2020) ;19: (1):53. Available from: https://pubmed.ncbi.nlm.nih.gov/32498709. |
[60] | Clare CE , Brassington AH , Kwong WY , Sinclair KD , One-Carbon Metabolism: Linking Nutritional Biochemistry to Epigenetic Programming of Long-Term Development, Annu Rev Anim Biosci [Internet]. (2019) ;7: (1):263–87. Available from: https://doi.org/10.1146/annurev-animal-020518-115206. |
[61] | Lionaki E , Ploumi C , Tavernarakis N , One-Carbon Metabolism: Pulling the Strings behind Aging and Neurodegeneration, Cells (2022) ;11: (2). |
[62] | Annibal A , Tharyan RG , Schonewolff MF , Tam H , Latza C , Auler MMK , et al., Regulation of the one carbon folate cycle as a shared metabolic signature of longevity, Nat Commun [Internet] (2021) ;12: (1):3486. Available from: https://doi.org/10.1038/s41467-021-23856-9. |
[63] | Oliai Araghi S , Kiefte-de Jong JC , van Dijk SC , Swart KMA , van Laarhoven HW , van Schoor NM , et al., Folic Acid and Vitamin B12 Supplementation and the Risk of Cancer: Long-term Follow-up of the B Vitamins for the Prevention of Osteoporotic Fractures (B-PROOF) Trial, Cancer Epidemiol biomarkers Prev a Publ Am Assoc Cancer Res cosponsored by Am Soc Prev Oncol (2019) ;28: (2):275–82. |
[64] | Ebbing M , Bønaa KH , Nygård O , Arnesen E , Ueland PM , Nordrehaug JE , et al., Cancer incidence and mortality after treatment with folic acid and vitamin B12, JAMA (2009) ;302: (19):2119–26. |
[65] | Figueiredo JC , Grau M V , Haile RW , Sandler RS , Summers RW , Bresalier RS , et al., Folic acid and risk of prostate cancer: results from a randomized clinical trial, J Natl Cancer Inst (2009) ;101: (6):432–5. |
[66] | Pavanello S , Campisi M , Tona F , Lin CD , Iliceto S , Exploring Epigenetic Age in Response to Intensive Relaxing Training: A Pilot Study to Slow Down Biological Age, Int J Environ Res Public Health [Internet]. Available from (2019) Aug 23;16: (17):432–5. https://pubmed.ncbi.nlm.nih.gov/31450859. |
[67] | Horvath S , Gurven M , Levine ME , Trumble BC , Kaplan H , Allayee H , et al., An epigenetic clock analysis of race/ethnicity, sex, and coronary heart disease, Genome Biol [Internet]. (2016) ;17: (1):171. https://doi.org/10.1186/s13059-016-1030-0. |
[68] | Levine ME , Lu AT , Quach A , Chen BH , Assimes TL , Bandinelli S , et al., An epigenetic biomarker of aging for lifespan and healthspan, Aging (Albany NY) (2018) ;10: (4):573–91. |
[69] | Lu AT , Quach A , Wilson JG , Reiner AP , Aviv A , Raj K , et al., DNA methylation GrimAge strongly predicts lifespan and healthspan, Aging (Albany NY) (2019) ;11: (2):303–27. |
[70] | Belsky DW , Caspi A , Corcoran DL , Sugden K , Poulton R , Arseneault L , et al., DunedinPACE, a DNA methylation biomarker of the pace of aging. Deelen J, Tyler JK, Suderman M, Deelen J, editors. Elife [Internet]. (2022) ;11: :e73420. Available from: https://doi.org/10.7554/eLife.73420. |
[71] | Garagnani P , Bacalini MG , Pirazzini C , Gori D , Giuliani C , Mari D , et al., Methylation of ELOVL2 gene as a new epigenetic marker of age, Aging Cell (2012) ;11: (6):1132–4. |
[72] | Chen D , Chao DL , Rocha L , Kolar M , Nguyen Huu VA , Krawczyk M , et al., The lipid elongation enzyme ELOVL2 is a molecular regulator of aging in the retina, Aging Cell [Internet] (2020) ;19: (2):e13100.. https://doi.org/10.1111/acel.13100. |
[73] | Clemente-Olivo MP , Habibe JJ , Vos M , Ottenhoff R , Jongejan A , Herrema H , et al., Four-and-a-half LIM domain protein 2 (FHL2) deficiency protects mice from diet-induced obesity and high FHL2 expression marks human obesity. Metabolism [Internet]. (2021) ;121: :154815. Available from: https://www.sciencedirect.com/science/article/pii/S0026049521001153. |
[74] | Wang K , Liu H , Hu Q , Wang L , Liu J , Zheng Z , et al., Epigenetic regulation of aging: implications for interventions of aging and diseases, Signal Transduct Target Ther [Internet] (2022) ;7: (1):374.. Available from: https://doi.org/10.1038/s41392-022-01211-8. |
[75] | Noroozi R , Ghafouri-Fard S , Pisarek A , Rudnicka J , Spólnicka M , Branicki W , et al., DNA methylation-based age clocks: From age prediction to age reversion, Ageing Res Rev (2021) ;68: :101314. |


