
Effectiveness of a short-term soy nutrition education intervention on nutrition knowledge and self-efficacy scores of rural elderly Zambian women
Abstract
BACKGROUND:
Women are at most risk for chronic diseases which can be prevented by healthy dietary choices. Evidence exists that nutrition education interventions (NEIs) are effective in educating community-dwelling women to modify their behavior for better health outcomes.
OBJECTIVES:
The objectives of this study were to implement a need-based, tailored NEI and evaluate its effectiveness in improving nutrition and soy knowledge and self-efficacy of participants in the intervention group compared to a control group.
METHODS:
A quasi-experimental pre-post-study design was used in a convenience sample of 149 women from the copper belt region of Zambia. The health belief model (HBM) informed the NEI, which consisted of six lessons, three cooking demonstrations, and an illustrative recipe book. Nutrition and soy knowledge scores and self-efficacy scores were evaluated using validated and reliable questionnaires. Data were analyzed using IBM SPSS software, version 26, and mean change scores in knowledge and self-efficacy were compared between the intervention and control groups.
RESULTS:
The average improvement in the scores for total nutrition knowledge and all six sub-sections of knowledge was significantly higher in the intervention group compared to the control group. The mean total self-efficacy score for the intervention group improved significantly (p = 5.7767e-20) from a pre-intervention score of 29.9±7.4 to 57.3±7.0 after the implementation of the NEI. No significant improvement (p = 0.904) in the control group was observed.
CONCLUSIONS:
A short-term, multi-component NEI was effective in improving the nutrition and soy knowledge and soy cooking self-efficacy of the participants in the intervention group.
1Introduction
Advancement in medical technology has made it possible for people to live longer which has resulted in a rising global elderly population [1]. As people age, they become susceptible to multiple physiological risk factors making them prone to diseases. Contrary to popular belief the prevalence of nutrition-related Non-Communicable Diseases (NCDs) has been on the rise in low-income and developing countries for the past decade. Unemployment and poverty coupled with a lack of education, healthcare, and nutrition resources have aggravated this situation, and social programs to prevent the rise of NCD risk factors, have not made necessary progress. This may have contributed to the fact that most healthcare resources in developing countries, especially in Africa, are concentrated on preventing infectious diseases and improving maternal and child undernutrition. This, when coupled with poor healthcare facilities in developing countries, often makes the elderly a vulnerable and neglected group [2].
Although healthy aging is achievable through proper nutrition care, it is often difficult to achieve because of environmental and societal barriers like poverty, lack of education, and resources [2]. Research states that the primary reasons for the increase in NCDs in Zambia are nutrition-related namely poor dietary intake, excessive alcohol consumption, and a sedentary lifestyle [3]. High illiteracy rates in women along with urban unemployment led to poor dietary choices, especially in women. There is ample evidence in the literature to show that following the Food-Based Dietary Guidelines (FBDGs) and encouraging healthy dietary practices resulted in improved health conditions [4]. This study will focus on the FBDG recommending legumes, specifically soy, as part of the daily diet. Soy is highly nutritious, affordable, plant-based food rich in proteins, unsaturated fats, and isoflavonoids. With a high protein content that varies between 36% and 46%, soy also contains all the essential amino acids making it a high-quality protein source comparable to animal proteins. Soy is the only legume rich in omega-3 and omega-6 fatty acids which has a cholesterol-lowering effect and therefore is considered to have a protective effect on the heart. Soy can also be considered a healthful alternative to animal foods, especially in the poorer communities of low-income countries where access to nutritious food is limited due to the financial constraints of the people [5–7].
Improving the nutritional status of people through modifying dietary behaviors and promoting healthy eating could, therefore, be used as a strategy to decrease nutrition-related NCD risk in the country. Adequate nutrition knowledge is essential for this vulnerable group to practice recommended dietary patterns to maintain a healthy and productive life. Nutrition education programs, when designed with specific goals targeted toward a particular group of people or community, have been identified as affordable, sustainable as well as an effective tool in many vulnerable communities to improve dietary behaviors and reduce NCD risk factors [8, 9]. Evidence from several interventions shows that employing multi-component strategies is more effective in producing functional benefits and promoting positive health outcomes in seniors [10]. Furthermore, Nutrition education intervention (NEI) designed based on behavior change theories have been reported to be more effective than those that are not informed by theory. The Health Belief Model (HBM) has been successfully used in NEI to improve nutrition knowledge and behaviors among elderly women [11]. Involving the community leaders during the planning, development, and implementation of intervention provides better chances of success by making the program acceptable and feasible in the community by considering the practical concerns of the participants [12]. The rising prevalence of NCDs in developing countries like Zambia and the lack of nutrition and healthcare resources necessitates the development of a community-based nutrition education intervention tailored to minimize the specific dietary risk factors. The rural, elderly women were identified as a vulnerable group who were at the highest risk to develop NCDs.
Therefore, the present study aimed to 1) develop and implement an NEI based on HBM, informed by a needs assessment of the community and employing multi-component intervention strategies like lectures, soy cooking demonstrations, food tasting, and hands-on activities, and 2) evaluate the effectiveness of the program in improving the nutrition and soy knowledge and self-efficacy scores of the participants.
2Methodology
2.1Ethical considerations
The Tropical Diseases Research Centre (TDRC) Ethics Review Committee (STC/2017/19), the National Health Research Ethics Board (NHREB), University Teaching Hospital, Zambia, and the Institutional Review Board, Texas Tech University (TTU) (IRB2017 1040) ethically approved this study. Permission to undertake the study was obtained from the community leaders of the two communities after explaining the purpose, objectives, and methods of the study. Informed consent was taken from all the participants.
2.2Purpose and objectives
The main purpose of this study was to implement a Nutrition Education Intervention (NEI) among the elderly women of Kitwe and evaluate its effectiveness in increasing knowledge about general nutrition and healthy eating, awareness of the health benefits of soy, and providing necessary skills to prepare a meal with soy which in turn would motivate them to improve the dietary habits of the participants. The specific objectives were divided into two primary objectives which were to compare the change and difference in Nutrition and soy knowledge scores of the participants through a general nutrition knowledge questionnaire and a soy knowledge questionnaire [13, 14] and Self-efficacy scores for preparation and consumption of soy foods through a self-efficacy questionnaire [15] between the intervention and control groups respectively.
2.3Study design and sampling
The study design was a quasi-experimental pre-post study. To determine the required sample size for the study the following formula was used:
Two wards, namely Twatasha (Kitwe) and Ndeke (Ndola) in the Copperbelt province of Zambia were purposively selected because of contact and permission to conduct the study. A convenience sampling method was used to recruit participants from each ward. Inclusion criteria included: women, aged 50 years or older, residing in Twatasha or Ndeke. The participants from the Twatasha ward were assigned to the experimental group and the participants from the Ndeke ward were assigned to the control group. A total of 149 participants completed the pre- and post-survey questionnaires. Among them, 38 were from Ndeke and were included in the control group while 111 were from Twatasha and therefore in the intervention group.
2.4NEI implementation
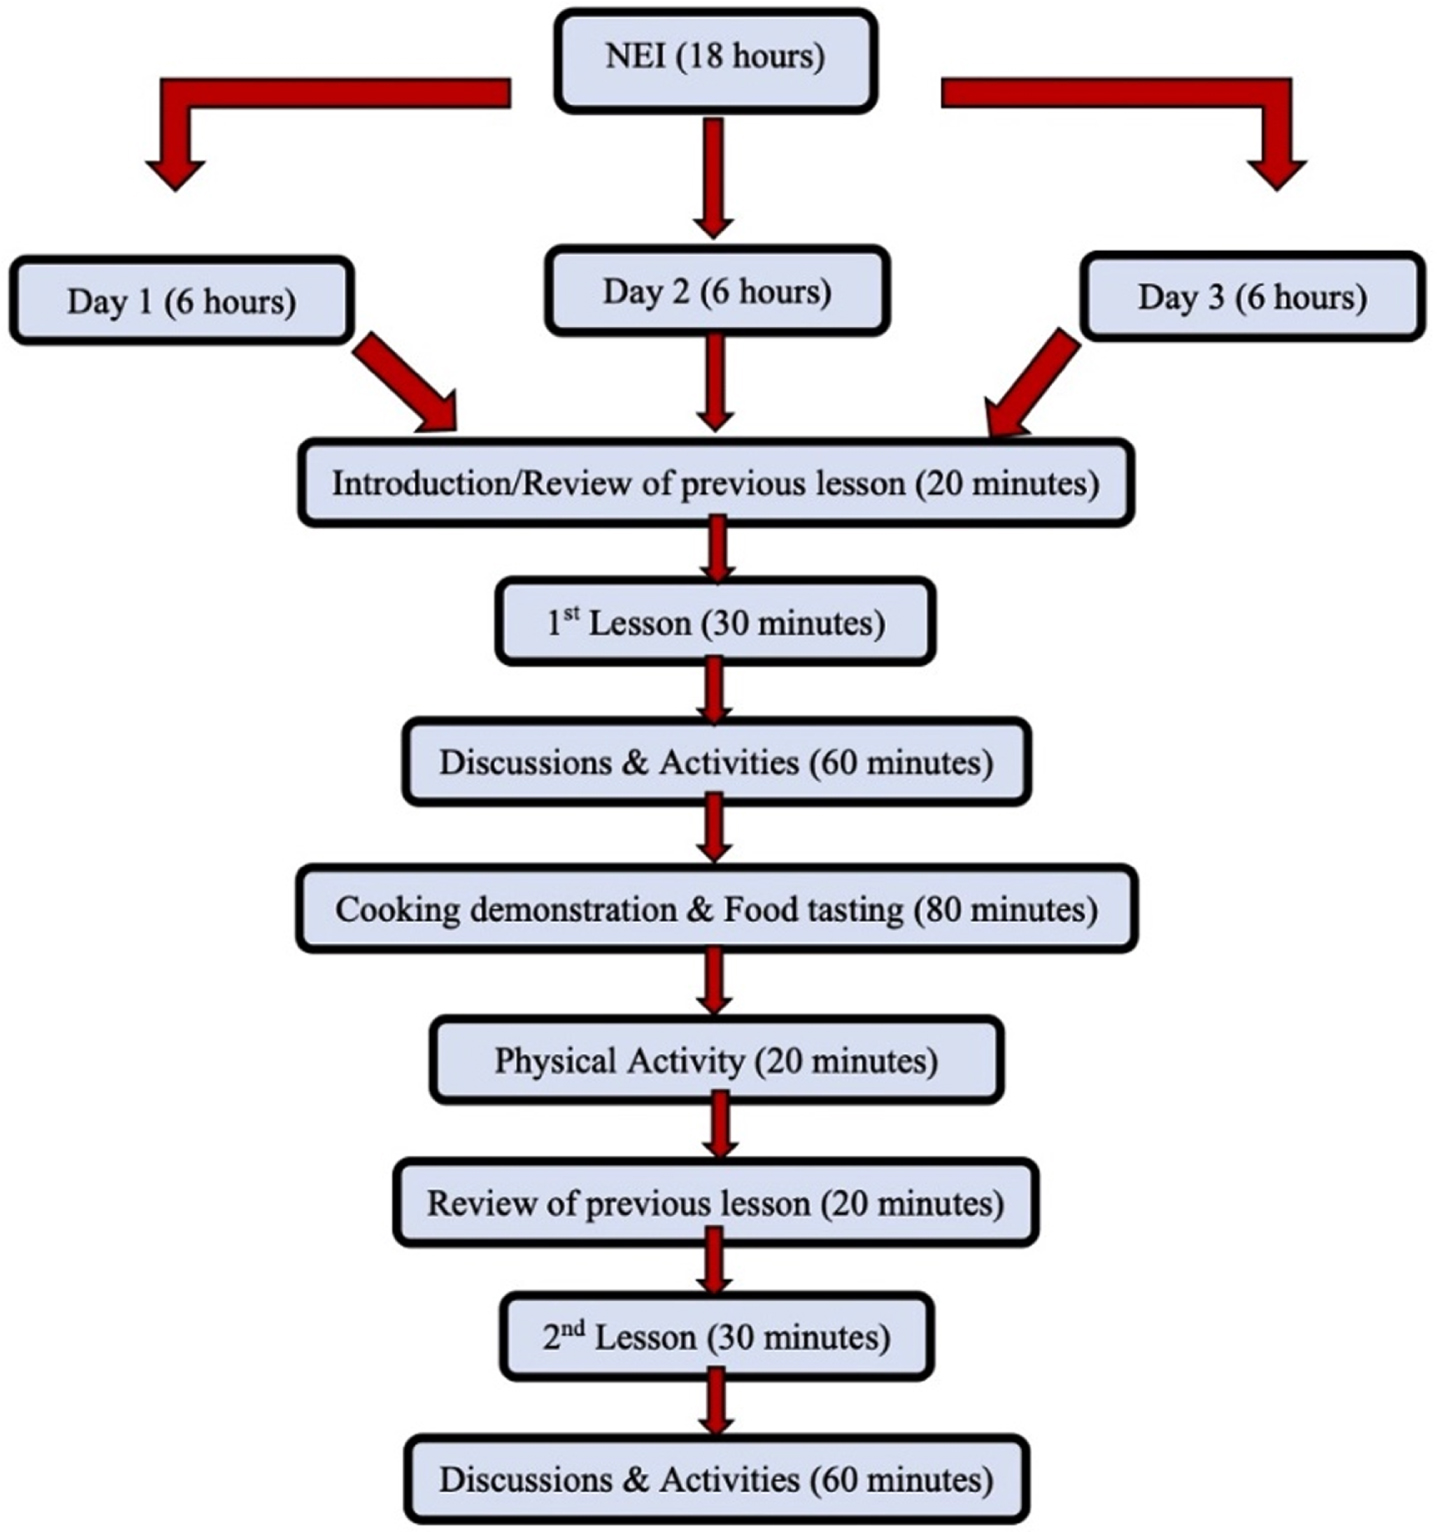
The NEI was developed following the four steps laid out by the United Nations Food and Agricultural Organization (FAO) for the development of a nutrition education program. Step 1 included a needs assessment [17], steps 2 and 3 included the development and implementation of the NEI respectively, followed by the evaluation of the NEI in step 4 [18]. The NEI consisted of a total of six lessons and three cooking demonstrations including food tasting sessions. The lessons were delivered in the form of lectures with the help of a PowerPoint presentation. The PowerPoints were shown with the help of a computer-assisted projector on a white wall of the room. The NEI consisted of 18 hours spread over three 6-hour sessions. Within each six-hour session, the total teaching time was one hour (two lessons 30 minutes each), followed by 2 hours of discussions and hands-on activities to reinforce the important messages (1 hour for each lesson) and 40 minutes of review of the previous lesson (20 minutes for each lesson). The rest of the time was spent in cooking demonstrations (1 hour), food tasting (20 minutes), physical activity (20 minutes), and four 10-minute breaks (40 minutes) between lessons. Three cooking demonstrations conducted to teach the participants how to use soy in the household included the preparation of soy milk, fruity soy yogurt, and soy raisin bread. Figure 1 is a summary of the steps followed in the NEI.
Fig. 1
Summary of the intervention.
The Health Belief Model (HBM) proposes that the readiness to change behaviors is based on the participants’ belief of their susceptibility and seriousness of health risks, the benefits of the recommendations as well as their confidence in acting. As the HBM is especially useful for designing NEI to enhance awareness and motivate participants to take specific actions to reduce the risk of health problems, therefore the HBM was used to design the educational objectives and intervention strategies for this specific group of participants. Five methods of instruction namely, lectures, group discussions, hands-on activities, demonstrations, and reinforcements through the recipe book were selected for the implementation of the nutrition and soy education program. Table 1 summarizes the constructs of HBM and the intervention strategies used for the construct.
Table 1
Constructs of the HBM as applied to intervention strategies
| Construct of HBM | Meaning | Educational objectives | Intervention strategies |
| Perceived susceptibility | The participants’ belief that they are susceptible to health risk or problem | Identify or demonstrate that: •Not eating different foods can cause malnutrition. •Eating too little can cause undernutrition •Eating high-calorie, filling foods can cause overweight and obesity. •Eating high amounts of cholesterol and bad fats can cause heart disease. •Eating foods containing added sugars and salts can cause diabetes or hypertension. Eating fewer fruits and vegetables can cause micronutrient deficiencies. | Lecture – introducing the concept of malnutrition caused by eating more or fewer foods (lesson 1), dietary diversity and recommendations from the dietary guidelines (lesson 4), consequences of unsafe food handling (lesson 6) |
| Perceived severity | The participants believe that this threat is serious | Identify the foods that contain bad fats, added sugars, and salts, as well as high-calorie filler foods in their diets. Demonstrate an understanding that consuming unhealthy foods may cause health deterioration and diseases such as cardiovascular disease, hypertension, and diabetes. | Lecture – specific nutrients and diseases caused by the lack or excess of these nutrients (lessons 2 & 3)Discussions – comparing the participants’ consumption patterns with the recommendations provided (all lessons) |
| Perceived benefits | The participants are convinced that taking action or following the recommendations would reduce this threat | Demonstrate understanding and appreciation of the importance of healthy eating according to the dietary guidelines. Identify the health benefits of soy consumption. | Lecture – functions of nutrients in our body, examples of foods that are rich in those nutrients (lessons 2 & 3), specific health benefits of soy and its role in preventing common nutrition-related diseases (lesson 5) |
| Perceived barriers | The participants believe that they can overcome the barriers and the benefits outweigh the barriers | Evaluate their intake compared to recommendations. Identify soy as a cheap, locally available, nutritious food. | Discussions – talking about personal challenges and barriers to healthy eating recommendations (all lessons) |
| Cues to action | Reminders for performing the actions successfully | Plan and prepare their plates to include a variety of nutritious foods from the five food groups. Follow the recipe book step by step to prepare a meal with soy. | Activity – reinforcing the recommendations through actively planning meals with food models (lessons 1 & 4), choosing foods (lessons 2 & 3), and handwashing (lesson 6)Recipe book – providing an illustrative way to remind participants to prepare a meal with soy |
| Self-efficacy | The participants feel confident to carry out the recommended actions successfully | Demonstrate increased self-efficacy in preparing and consuming a meal with soy. Demonstrate increased self-efficacy in basic cooking hygiene like cleaning raw food, cooking utensils, and cooking area. | Activities – building confidence by planning healthy meals incorporating the recommendations (all lessons)Cooking demonstration and hands-on activities – following the steps of soy preparation and tasting the prepared recipes. |
2.5Data collection
For both the pre-intervention and the post-intervention surveys data was collected from 8 AM to 5 PM, in two different locations in the two communities (church and community center) for the convenience of the participants by trained fieldworkers through one-on-one interviews with pre-determined questionnaires. Validated questionnaires were used to collect socio-demographic data [19] as well as the nutrition and soy knowledge [13, 14, 20, 21] and self-efficacy of participants [15]. The participants were assigned a study code upon registering and signing the consent form. Thereafter only the code was used instead of the name. Booths were set up for each measuring instrument or questionnaire. At least two fieldworkers were assigned to each booth. A field worker control sheet was used to control the flow of participants throughout the session and to ensure that each participant had filled out all the sections of the survey. In the end, the control sheet was checked for completion before the participants left. To minimize inter-translator biases, one fieldworker was responsible for the same questionnaire throughout the study.
2.6Data analysis
All data collected during the pre and post-surveys were entered immediately into Microsoft Excel and checked for inconsistencies and missing values. Only completed questionnaires were accounted for in the data analysis. Nutrition knowledge scores and self-efficacy scores were calculated for each participant in excel. Socio-demographic differences between the intervention and control group participants were compared with the help of Fischer’s exact test for continuous data like age, BMI, and food insecurity scores while for categorical data (level of education and household income) chi-square tests were used. Comparison of ordinal data for the secondary objectives (nutrition knowledge and self-efficacy scores) within the intervention and control group participants were analyzed using the non-parametric test, paired Wilcoxon test on mean scores (for knowledge and self-efficacy), and median nutrient before and after the intervention. In addition, a linear regression model was used to assess the difference in changed scores for the primary outcomes between the intervention and control groups. The initial model was adjusted for differences in the two groups in terms of socio-demographic factors like household income, educational qualification, BMI, and the effect of pre-scores. After backward selection to fit the model under the f-test criteria, the difference in the improvement in scores between the intervention and control groups was not significantly impacted by the level of education, income, or BMI. For hypothesis testing, the family-wise error rate (FWER) was set at 5% and after correcting for multiple comparisons, a p-value of < 0.00625 was considered statistically significant (0.05/8 = 0.00625, adjusted for 8 primary outcome variables). Subsequently, the 8 primary outcome measures were the total nutrition knowledge score, knowledge scores for each of the 6 sections of the nutrition knowledge questionnaire, and the total self-efficacy score.
The effectiveness of the NEI in improving the nutrition and soy knowledge of the participants was evaluated by comparing the mean change scores of the participants between the intervention and control groups. Multiple regression analysis was performed with the initial model consisting of the level of education, household income, BMI as well as the pre-intervention scores for total nutrition knowledge, each of the six sections of knowledge. After backward selection to fit the model under the f-test criteria, the difference in the improvement in scores between the intervention and control groups was not significantly impacted by the level of education, income, or BMI.
3Results
Primary and secondary hypotheses were developed for the study and the results will be reported for each of the hypotheses.
3.1Comparison between intervention and control group participants at pre-intervention
All participants in both control and intervention groups were black women residing in the Twatasha and Ndeke communities respectively. Although there were no significant differences between the mean age and food insecurity scores between the control and intervention group participants at pre-intervention, the proportion of participants with higher education levels and higher household income was significantly higher in the control group compared to the intervention group (Table 2). Mean BMI was higher in the control group compared to the intervention group and the difference was nominally significant (p < 0.05).
Table 2
Socio-demographic differences between control and intervention group participants at pre-intervention
| Measurement | Intervention group | Control group | P-value |
| Mean±SD | Mean±SD | ||
| Age | 58.97±10.4 | 55.41±7.9 | 0.129 |
| BMI | 28.1±5.2 | 31.0±5.1 | 0.002 |
| Food Security | 16.78±5.1 | 14.1±10.1 | 0.100 |
| Number of participants (Percentage) | Number of participants (Percentage) | ||
| Education | 4.0815E-8 | ||
| None | 26 (23.4%) | 4 (9.5%) | |
| Primary | 72 (64.9%) | 15 (35.7%) | |
| Secondary/college | 13 (11.7%) | 23 (54.8%) | |
| Household Income | 1.4092E-7 | ||
| Don’t know/didn’t answer | 4 (3.6%) | 4 (9.5%) | |
| <K100 (=$8) | 65 (58.6%) | 14 (33.3%) | |
| K100-K200 (=$8-$15) | 34 (30.6%) | 5 (11.9%) | |
| >K200 ($15) | 8 (7.2%) | 19 (45.2%) |
3.2Primary objective 1: Nutrition and soy knowledge scores of the participants between the intervention and control groups
With only the group and pre-intervention scores remaining in the model predicting change scores, analysis of the final model shows that for total nutrition knowledge scores, the average change for a person in the intervention group who got 0 answers correct during the pre-intervention survey was an improvement of 18.68 correct answers, while the average change for a person in the control group who got 0 answers correct during the pre-intervention survey was an improvement of (18.68+–10.73) 7.95 correct answers (Table 3). As the mean score for the total nutrition knowledge was 49, the change in score after the intervention for an average person in the intervention group was 13.08 while the same for an average person in the control group was 2.35. This difference between the change score for the intervention and control group was significant (P < 2e-16). Similar trends were observed in the knowledge scores for each of the six knowledge primary outcomes.
Table 3
Comparison between the change scores of knowledge sections between the intervention and control group
| Knowledge section | Coefficient | Standard error | Average change in score | P-value | |
| Total Score | Intervention group (reference) | 18.68 | 1.14 | 13.08 | 2e-16** |
| Offset (difference between groups) | –10.73 | 0.73 | 2.35 | 2e-16** | |
| Pre-intervention scores | –0.11 | 0.02 | 1.14e-06** | ||
| Nutrients | Intervention group (reference) | 2.52 | 0.19 | 1.78 | 2e-16** |
| Offset (difference between groups) | –1.36 | 0.17 | 0.43 | 3.16e-13** | |
| Pre-intervention scores | –0.37 | 0.08 | 2.53e-05** | ||
| Food Groups | Intervention group (reference) | 6.99 | 0.43 | 4.34 | 2e-16** |
| Offset (difference between groups) | –3.66 | 0.34 | 0.68 | 2e-16** | |
| Pre-intervention scores | –0.12 | 0.02 | 3.8e-09** | ||
| Choosing Foods | Intervention group (reference) | 4.09 | 0.34 | 3.24 | 2e-16** |
| Offset (difference between groups) | –2.38 | 0.25 | 0.86 | 2e-16** | |
| Pre-intervention scores | –0.21 | 0.07 | 0.00399* | ||
| Health Problems | Intervention group (reference) | 1.86 | 0.13 | 0.72 | 2e-16** |
| Offset (difference between groups) | –0.33 | 0.12 | 0.40 | 0.00956* | |
| Pre-intervention scores | –0.16 | 0.02 | 2e-16** | ||
| Food Safety | Intervention group (reference) | 1.03 | 0.10 | 0.68 | 2e-16** |
| Offset (difference between groups) | –0.68 | 0.09 | –0.003 | 9.16e-12** | |
| Pre-intervention scores | –0.12 | 0.03 | 0.000388** | ||
For knowledge about nutrients, food groups, choosing foods, health problems, and food safety, the average change of score for a person in the intervention group who got 0 answers correct during the pre-intervention survey was an improvement of 2.52, 6.99, 4.09, 1.86, and 1.03 correct answers respectively. While the average change for a person in control group who got 0 answers correct during the pre-intervention survey was an improvement of (2.52+–1.36) 1.16, (6.99+–3.66) 3.33, (4.09+–2.38) 1.71, (1.86+–0.33) 1.53, (1.03+–0.68) 0.35 correct answers respectively for the five sections of the knowledge scores. Therefore, for a person with average scores for each of the knowledge sections, the change in scores after the NEI in the control group (0.43, 0.68, 0.86, 0.40, and –0.003 respectively) were significantly lower compared to the intervention group (1.78, 4.34, 3.24, 0.72 and 0.68 respectively).
For the knowledge about soy section, the average change of score for a person in the intervention group who got 0 answers correct during the pre-intervention survey was an improvement of 2.40 correct answers, while the average change for a person in the control group who got 0 answers correct during the pre-intervention survey was a decline of (2.40+–2.44) 0.03 correct answers. For a person with average scores for this section, the improvement in scores in the intervention group was 1.22, while in the control group it declined by 1.22 points. Although BMI showed nominal significance for knowledge about soy section score only, it did not statistically impact the chance of improving the knowledge scores (Table 4).
Table 4
Comparison between the change scores of knowledge about soy between the intervention and control group
| Knowledge about soy score | Intervention group | Control group | Effect of pre-scores | BMI |
| Co-efficient | 2.40 | –2.44 | –0.12 | 0.04 |
| Standard error | 0.65 | 0.25 | 0.03 | 0.02 |
| Average change in score | 1.22 | –1.22 | ||
| P-value | 0.000343** | 2e-16** | 6.21e-06** | 0.041772* |
Therefore, to summarize, the results of the nutrition knowledge scores of the study participants show that pre-intervention scores had a significant impact on the change in the score after the NEI. The lower the score of a participant the higher there was a chance of improvement. The average improvement in the scores for total nutrition knowledge as well as for all six sub-sections of knowledge was significantly higher in the intervention group participants compared to the control group.
3.3Primary objective 2: Self-efficacy scores of the participants between the intervention and control groups
The effectiveness of the NEI in improving the self-efficacy scores of the participants was evaluated by comparing the mean change scores of the participants between the intervention and control groups. Multiple regression analysis was performed with the initial model consisting of the level of education, household income, BMI as well as pre-intervention scores. After backward selection to fit the model under the f-test criteria, it was seen that the difference in the improvement in scores between the intervention and control groups was not significantly impacted by the level of education, income, or BMI. However, the level of education had a nominal significance (P < 0.05) on the change in self-efficacy scores between the intervention and control groups.
With only the self-efficacy scores at pre-intervention having a significant impact on the change in self-efficacy scores, analysis of the final model shows that the average chance for a person in the intervention group with a score of 0 during the pre-intervention survey was an improvement of 46.33, while the average chance for a person in the control group with an initial score of 0 was an improvement of (46.33+–23.11) 23.22 points (Table 5). As the mean self-efficacy score was 32 before the intervention, the change in score after the intervention for an average person in the intervention group was 26.54 while the same for an average person in the control group was 3.43. This difference between the change score for the intervention and control group was significant (P < 2e-16). The larger proportion of participants with a higher level of educational qualification (Secondary or college education) in the control group, had a nominal impact on the change in scores between the two groups, but this effect was not significant at the p = 0.00625 level considered for this study.
Table 5
Comparison between the change in self-efficacy scores between the intervention and control group
| Co-efficient | Standard error | Average change in scores | P-value | |
| Intervention | 46.33 | 2.61 | 26.54 | 2e-16** |
| Control | 23.11 | 1.56 | 3.43 | 2e-16** |
| Pre-scores | –0.62 | 0.08 | 4.26e-13** | |
| No education | –0.79 | 1.39 | 0.572 | |
| Primary Education | 0.54 | 1.85 | 0.771 | |
| Secondary/College Education | 6.49 | 3.14 | 0.041* |
3.4Secondary objective 1: Nutrition and soy knowledge of the participants within the intervention and control groups
The mean±SD total nutrition knowledge score of the participants in the intervention group improved significantly (p = 8.2203e-20) from a pre-intervention score of 47.8±13.2 to a post-intervention score of 61.0±11.7. In the control group, although the improvement from a pre-intervention score of 52.5±16.7 to a post-intervention score of 54.5±16.5 was lower, it was significant (p = 1.18887e-7). Analysis of the mean scores of each of the six knowledge sections within each group (intervention and control) shows that in section 1, the knowledge about nutrients and their functions improved from a mean score of 2.0±0.9 to 3.8±1.1 in the intervention group and from 2.2±0.9 to 2.5±0.8 in the control group. Although the improvement was greater in the intervention group the improvement in scores was significant in both groups. In section 2, knowledge about food groups significantly (p = 1.9949e-19) improved from 21.4±6.9 to 25.9±5.9 in the intervention group. In the control group, the improvement from an initial score of 26.1±10.4 to a post-intervention score of 26.5±10.2 was not significant. In section 3 of the knowledge questionnaire, knowledge about choosing foods improved from a mean±SD pre-intervention score of 4.3±1.6 to 7.5±1.9 during post-intervention in the intervention group, while in the control group, it increased from 4.3±1.4 to 5.1±1.4. The improvement in both groups was significant. In section 4 of the knowledge questionnaire, knowledge about health problems significantly improved from a pre-intervention score of 7.5±3.4 to a post-intervention score of 8.1±2.8 in the intervention group, while in the control group, the mean scores also improved significantly from 7.3±3.7 to 7.7±3.3. In section 5, mean scores for the knowledge about food safety and soy foods increased significantly in the intervention group from 2.9±1.2 to 3.6±1.2. However, no significant changes in the mean knowledge scores were observed in this section for the control group. In section 6, mean scores for the knowledge about soy increased significantly in the intervention group from 9.7±4.2 to 12.1±3.8. However, no significant changes in the knowledge scores were observed in this section for the control group.
3.5Secondary objective 2: Self-efficacy scores of the participants within the intervention and control groups
Within-group comparisons show that the mean total self-efficacy score for the intervention group improved significantly (p = 5.7767e-20) from a pre-intervention score of 29.9±7.4 to 57.3±7.0 after the implementation of the NEI, compared to no significant improvement (p = 0.904) in the control group (Table 7).
Table 6
Comparison of change in mean nutrition and soy knowledge scores within the intervention and control group participants
| Knowledge section | Section score | Intervention group | Control group | ||||
| Mean±SD | P-value | Mean±SD | P-value | ||||
| Pre | Post | Pre | Post | ||||
| Total score | 111 | 47.8±13.2 | 61.0±11.7 | 8.2203e-20** | 52.5±16.7 | 54.5±16.5 | 1.1887e-7** |
| Knowledge about nutrients | 7 | 2.0±0.9 | 3.8±1.1 | 4.5319e-18** | 2.2±0.9 | 2.5±0.8 | 0.000183** |
| Knowledge about food groups | 59 | 21.4±6.9 | 25.9±5.9 | 1.9949e-19** | 26.1±10.4 | 26.5±10.2 | 0.015764 |
| Knowledge about choosing foods | 11 | 4.3±1.6 | 7.5±1.9 | 1.1368e-19** | 4.3±1.4 | 5.1±1.4 | 6.5985e-7** |
| Knowledge about health problems | 11 | 7.5±3.4 | 8.1±2.8 | 5.1248e-9** | 7.3±3.7 | 7.7±3.3 | 0.003510** |
| Knowledge about food safety | 5 | 2.9±1.2 | 3.6±1.2 | 1.0318e-15** | 3.0±1.5 | 3.0±1.5 | 1.000 |
| Knowledge about soy | 18 | 9.7±4.2 | 12.1±3.8 | 8.2203e-20** | 9.6±4.2 | 9.7±4.2 | 0.102470 |
**significant at p < 0.00625.
Table 7
Comparison of change in mean self-efficacy scores within the intervention and control group participants
| Self-efficacy Score | Intervention group | Control Group | ||||
| Mean±SD | P-value | Mean±SD | P-value | |||
| Pre | Post | Pre | Post | |||
| 80 | 29.9±7.4 | 57.3±7.0 | 5.7767e-20** | 38.5±5.7 | 38.9±6.9 | 0.904 |
**significant at p < 0.00625.
4Discussion
The change in knowledge scores was significantly higher in the intervention group than in the control group at post-measurement. Other nutrition education interventions for the elderly have also shown similar results in improving the nutritional knowledge of the participants. In Korea, two studies reported significant improvements in nutrition knowledge after an 8-week intervention in elderly women and a 3-week education intervention in both male and female elderly respectively [22]. While in Iran an HBM-based 12-week nutrition education program for elderly women also showed significant improvements in nutrition knowledge [11]. Another recent nutrition education intervention conducted among 100 elderly in Egypt showed that nutrition knowledge improved significantly after a 6-session intervention [23]. The NEP implemented in Qwa Qwa, South Africa from which the NEI implemented in this study was adapted, showed similar results to our study in significantly improving the nutrition knowledge scores of the participants. In Qwa Qwa the pre-intervention survey showed higher nutrition knowledge among the participants (66%) like the case of the current study. After the implementation of the NEI, the soy knowledge of the participants significantly improved from 65% to 74% in the Qwa Qwa participants [14], while in the current study the soy knowledge of the participants in the intervention group increased from a mean score of 43% to 55%.
Significant improvements in self-efficacy scores were observed in the participants of the intervention group after the NEI involving cooking demonstration in the current study compared to no significant improvements in the control group where no NEI was provided. These results are consistent with the results of several studies involving cooking interventions that have been shown to increase cooking confidence or self-efficacy in adults. A recent article published in 2018 reporting on studies involving cooking interventions in adults from 2011 to 2016 shows that out of the 34 studies included in the systematic review six studies measured cooking confidence and six studies measured knowledge improvement, while one study measured both cooking confidence as well as knowledge improvements in the participants after the interventions. Among them, all 13 studies reported having significantly improved their respective outcome measures after the cooking intervention in their participants [24]. A previous systematic review which included cooking intervention studies before 2011, reported significant improvements in the outcome measures in all 5 studies focusing on improving cooking confidence or knowledge. Among them 2 studies measured cooking confidence, 2 studies measured knowledge improvements, and one measured both outcomes in participants after cooking interventions in adults ranging from 4 weeks to 6 months [25]. Unfortunately, there is a paucity of studies measuring cooking self-efficacy among elderly women and our results could not be compared to studies undertaken on the elderly. Similarly, the QwaQwa study did not measure soy or cooking self-efficacy as an outcome [18].
The success of this NEI can be contributed to several strengths of the study. Firstly, the NEI implemented in this study was based on and included all seven steps of planning a successful food and/or nutrition community program. Secondly, a collaboration between the researchers from two universities and the community leaders in Kitwe was a significant implication of this study. As we know community collaborations take years to build and this study was an important first step that opened the doors for future research opportunities in this community. Trust-building through communications and inputs from the local community leaders helped to make the NEI more effective and appealing to the study participants by bridging the gap between the participants and the researchers and ensuring that the purpose of the intervention was not only for data collection but for the improvement in the knowledge, self-efficacy and dietary intakes of the participants. Thirdly, the NEI was tailored to the requirements of the participants by virtue of a needs assessment survey conducted among the community (Sociodemographic, nutritional status, and household food insecurity assessment of elderly women from rural Zambia, under review). Fourthly, along with being needs-based, the NEI was also informed on a behavior change model that promoted the inclusion of multiple strategies like cooking demonstrations, and food tastings as well as hands-on activities such as planning own meals with the help of food models, choosing healthy food choices, and eliminating unhealthy ones and hand washing, which helped enhance the learning process of the participants.
Several limitations that were beyond the control of the researchers should be noted. In this study, the convenience sampling method was used, participation was voluntary, and the participants were allocated to the control and intervention groups according to the community in the participants resided in. The intervention and control groups, therefore, did not have equal sample sizes. Randomization would have ensured that differences between treatment groups arise by chance alone [26]. However, linear regression with backward selection was used to adjust for these confounding factors (differences). Although several strategies were employed to keep the schedule of the NEI interesting and appealing, spreading out the duration over several weeks would probably have led to better knowledge retention as the attention span decreases with time [27, 28]. A longer period between the pre and post-measurements would also be beneficial in measuring changes in the nutrient intakes of the participants.
5Conclusion and recommendations
In conclusion, the results of this study show that a short-term nutrition education intervention informed by a needs assessment survey and targeted toward elderly women in rural communities faced with poverty, unemployment, and food insecurity increased the knowledge and self-efficacy of the participants regarding soy cooking. This would help them in their daily lives to better their dietary habits and nutrient intake of themselves as well as other family members. These study results may guide future research studies in developing and implementing NEI among rural elderly women communities in Zambia as well as the rest of sub-Saharan Africa. The field workers were trained extensively to conduct dietary and health surveys as an opportunity for capacity building.
Future research should include larger numbers of participants to ensure a greater impact on promoting healthy dietary practices as well as consumption of soy in these resource-poor, food-insecure elderly communities. Ideally, long-term follow-up measurements should be conducted to measure dietary intake after at least 5 months [8]. Therefore, a follow-up assessment to measure long-term knowledge retention is recommended.
Acknowledgments
The authors want to thank the Texas Tech University and the Vaal University of Technology for funding this project. The fieldworkers and participants are acknowledged for their valuable contributions.
Funding
This work was supported by the Texas Tech University and the Vaal University of Technology.
Conflict of interest
The authors have no conflict of interest to report.
References
[1] | United Nations, Department of Economic and Social Affairs, Population Division. World population ageing 2017 – highlights (ST/ESA/SER.A/397). (2017) . [cited March 1, 2020]. Available from: https://www.un.org/en/development/desa/population/publications/pdf/ageing/WPA2017_Highlights.pdf. |
[2] | De Villiers A , Faber M . Healthy ageing: is it achievable? South African Journal of Clinical Nutrition. (2018) ;31: (3):4–5. |
[3] | Goma FM , Nzala SH , Babaniyi O , Songolo P , Zyaambo C , Rudatsikira E , Siziya S , Muula AS . Prevalence of hypertension and its correlates in Lusaka urban district of Zambia: a population based survey. International Archives of Medicine. (2011) ;4: (1):34. |
[4] | Tapsell LC , Neale EP , Satija A , Hu FB , Foods, nutrients, and dietary patterns: interconnections and implications for dietary guidelines. Advances in Nutrition. (2016) ;7: (3):445–54. |
[5] | Mayo B , Guadamuro L , Flórez AB , Delgado S . Soy and Soy Products, Isoflavones, Equol, and Health, In: Shekhar HU, Howlader ZH, Kabir Y. (Eds.). Exploring the Nutrition and Health Benefits of Functional Foods. Hershey, PA: IGI Global (2017) ;223–53. |
[6] | Pawar VS , Patil BM , Syed Z , Salve RV . Soybean: a novel food grain for human health: a review. International Journal of Chemical Studies. (2018) ;6: (2):1894–8. |
[7] | Rizzo G , Baroni L . Soy, soy foods and their role in vegetarian diets. Nutrients. (2018) ;10: (1):43. |
[8] | Murimi MW , Kanyi M , Mupfudze T , Amin MR , Mbogori T , Aldubayan K . Factors influencing efficacy of nutrition education interventions: a systematic review. Journal of Nutrition Education and Behavior. (2017) ;49: (2):142–65. |
[9] | Khorsandi M , Fekrizadeh Z , Roozbahani N . Investigation of the effect of education based on the health belief model on the adoption of hypertension-controlling behaviors in the elderly. Clinical Interventions in Aging. (2017) ;12: :233–40. doi: 10.2147/CIA.S117142. |
[10] | Bouaziz W , Lang PO , Schmitt E , Kaltenbach G , Geny B , Vogel T . Health benefits of multicomponent training programmes in seniors: a systematic review. International Journal of Clinical Practice. (2016) ;70: (7):520–36. |
[11] | Iranagh JA , Rahman HA , Motalebi SA , Health Belief Model-based intervention to improve nutritional behavior among elderly women. Nutrition Research and Practice. (2016) ;10: (3):352–8. |
[12] | Korn AR , Hennessy E , Tovar A , Finn C , Hammond RA , Economos CD . Engaging coalitions in community-based childhood obesity prevention interventions: a mixed methods assessment. Childhood Obesity. (2018) ;14: (8):537–52. |
[13] | Kliemann N , Wardle J , Johnson F , Croker H . Reliability and validity of a revised version of the General Nutrition Knowledge Questionnaire. European Journal of Clinical Nutrition. (2016) ;70: (10):1174. |
[14] | Oldewage-Theron W , Egal AA . Impact of a soy nutrition education programme on knowledge in a low-income community in Qwa-Qwa, South Africa. International Journal of Consumer Studies. (2012) ;36: (4):480–5. |
[15] | Woodruff SJ , Kirby AR . The associations among family meal frequency, food preparation frequency, self-efficacy for cooking, and food preparation techniques in children and adolescents. Journal of Nutrition Education and Behavior. (2013) ;45: (4):296–303. |
[16] | Oldewage-Theron W , Morales S , Egal A . Change in soy and nutrition knowledge and perceptions of smallholder South African farmers after attending a single one-day soy nutrition training workshop: A pilot study. African Journal of Food, Agriculture, Nutrition and Development. (2020) ;20: (6):16604–21. |
[17] | ChalweJM, MukherjeeU, GroblerC, MbambaraSH & Oldewage-TheronW. Association between hypertension, obesity, and dietary intake in post-menopausal women from rural Zambian communities. Health SA Gesondheid (Online). (2021) ;26: :1–7. |
[18] | Food and Agriculture Organization of the United Nations (FAO). Policy Brief: Food security. FAO Agriculture and Development Economics Division. (2006) ;Issue 2. |
[19] | World Health Organization. (WHO). World Health Survey. Evidence and Information for Policy. Individual Questionnaire. [cited November 17, 2017]. Available from: http://www.who.int/healthinfo/survey/whslongindividuala.pdf. |
[20] | Bukenya R , Ahmed A , Andrade JM , Grigsby-Toussaint DS , Muyonga J , Andrade JE . Validity and reliability of general nutrition knowledge questionnaire for adults in Uganda. Nutrients. (2017) ;9: (2):172. |
[21] | Marumo-Ngwenya K . Impact of a soy feeding programmme on the nutritional status of an elderly community in Sharpeville. Doctoral dissertation. Vanderbijlpark, South Africa: Vaal University of Technology. Available from: 2014. http://digiresearch.vut.ac.za/handle/10352/254. |
[22] | Ahn JA , Park J , Kim CJ . Effects of an individualised nutritional education and support programme on dietary habits, nutritional knowledge and nutritional status of older adults living alone. Journal of Clinical Nursing. (2018) ;27: (9-10):2142–51. |
[23] | Abdelwahed AY , Algameel MMM , Tayel DI . Effect of a Nutritional Education Program on Nutritional Status of Elderly in Rural Areas of Damanhur City, Egypt. International Journal of Nursing Science. (2018) ;8: (5):83–92. |
[24] | Reicks M , Kocher M , Reeder J . Impact of cooking and home food preparation interventions among adults: a systematic review – Journal of Nutrition Education and Behavior (2018) ;50: (2):148–72. |
[25] | Park KS , Yoo JI , Kim HY , Jang S , Park Y , Ha YC . Education and exercise program improves osteoporosis knowledge and changes calcium and vitamin D dietary intake in community dwelling elderly. BMC Public Health. (2017) ;17: (1):966. |
[26] | Contento IR Nutrition education: linking research, theory, and practice (3rd ed.). Burlinton, MA: Jones & Bartlett Learning. (2016) . |
[27] | Margetts BM , Nelson M . (Eds.). Design concepts in nutritional epidemiology. 2nd ed. Oxford, UK: Oxford University Press. (2000) . |
[28] | Nnakwe N . Community Nutrition: Planning Health Promotion and Disease Prevention. 3rd Ed. Burlington, MA: Jones & Bartlett Publishers. 2918. |


