
Association of nutritional screening score and healthy ageing domains among urban elderly in Jakarta, Indonesia
Abstract
BACKGROUND:
Nutritional status is a modifiable risk factor that could support healthy ageing outcome among elderly population.
OBJECTIVE:
To investigate association of nutritional status indicated by Mini Nutritional Assessment short form (MNA-SF) score with domains of functional ability, cognitive state, depression, and social engagement status.
METHODS:
A cross-sectional study was conducted among 133 elderly aged > 60 years in five community health center across Jakarta province. MNA-SF was used to indicate nutritional status score. Functional ability measured based on activity daily living (ADL) score. Cognitive function measured based on Mini Mental State Examination (MMSE) score. Geriatric Depression Scale short form (GDS-15) was used to measure depression and social engagement status measured based on social engagement index questionnaire. Association of study variables analyzed using linear regression test by considering possible confounders including age, sex, education, income, smoking status, and disease history.
RESULTS:
MNA-SF score reported to have positive correlation with domains of cognitive function (r = 0.25 p = 0.00) and social engagement status (r = 0.30 p = 0.00), but inverse correlation was found with depression symptoms (r = 0.24, p = 0.00). The association was remained significant in the multivariate analyses (cognitive function adjusted β= 0.18, p = 0.01; depression adjusted β= –0.38, p = 0.00; social engagement adjusted β= 0.23, p = 0.00). MNA-SF was not associated with functional ability domain in this study.
CONCLUSIONS:
Higher level of nutrition status was associated with better cognition, lower depression symptoms, and better social engagement of the healthy ageing domains, but it was not associated with functional ability domain among elderly.
1Introduction
Growing number of elderly population in low middle income countries (LMIC) such as Indonesia was among the highest in the world. According to Indonesian Ministry of Health (MoH), the share of people aged 65 years and older was 9.03% in 2017 and projected to reach about 12.9% in 2030 [1]. Jakarta province is the capital city of Indonesia that placed the second highest in life expectancy rate among other province in 2015 with the number rate at 73.56 years [2]. However, income per capita inequity in Jakarta was also higher than the national number since 2014 indicating high social inequity problems in this area. According to the Indonesian National Statistic Agencies, Gini coefficient ratio in Jakarta was 0.39 in 2018 [3]. Considering that social determinant is one of the important factor contributes to health status of elderly, social inequity gap in in this area could impact to quality of health and wellbeing of this high risk population [4].
Healthy ageing is an important issue to be addressed in Indonesia. In elderly, risk of immobility and dependency is increase, at the same time energy and overall nutrient intake is decreases, and malnutrition is prevalent [5, 6]. In addition, ‘health transition’ is also happening in Indonesia where the most prevalent disease occurs among elderly are shifted from infectious disease into chronic illness [7]. These conditions have added challenges in the burden of the country’s National Health Insurance program (NHI). Based on the Indonesia Social Insurance Administration Organization report in 2018, the burden of catastrophic disease (includes cancer, heart disease, stroke, etc.) has accounted for about 25% of the total health expenditure of the country and still consider as one of the main factor that cause financial loss of the NHI [8]. Therefore, achieving more healthy agers population is urgently needed to prevent these financial burdens and reduce morbidity rate of the people.
Complex interaction happens in ageing process that involved both biological and environment surroundings individual. Thus comprehensive measurement is needed to capture reliable outcome of healthy ageing at the individual level. Study done by Lara and colleagues in 2013 suggested five common domains to be considered in healthy ageing phenotype measurement that consists of physiological and metabolic health, physical function, cognitive function, psychological wellbeing, and social wellbeing [9]. Recent study done by Cao and Rammohan measured healthy ageing in Indonesian elderly based on physical function indicated by ADL Katz index, self-assessed mental health and history of chronic illness domains. This study analyzed dataset of 1226 individuals aged 50 above from the bigger study of Indonesian Family Life Survey-East (IFLS-East). The study suggested that prevalence of dependency in Indonesian older adults were high where 56.12% of elderly having low functional [7]. Other study conducted among urban elderly in Jakarta that measured cognitive function domain indicated by MMSE score showed similar problems. The proportion of elderly with cognitive impairment was relatively high in the range of 35–40% using 24 as the MMSE cut off point [10, 11]. The high prevalence in these two domains could impact quality of life and burden of diseases among elderly population in this country.
In order to engage positive actions towards healthy ageing goal, it is important to identify and target the modifiable risk factors. Nutrition has been studied to be one of the key role in the alteration of the healthy ageing outcome and prevention of disability [12–15]. Having malnutrition were associated with loss of skeletal muscle, increase vulnerability to infections, and poor wound healing that resulted in higher risk to falling and mortality rates [16]. In addition, malnutrition, disease condition, and pyscological state such as depression in elderly has been identified to have two-way path [14]. Having certain disease condition and depression that required medication intake could affect the sense in taste buds and reduce of appetite that increase risk to poor nutritional status. On the other hand, malnutrition may alter the depression and apathy status that could affect to worsen disease state [17]. Beside pyscological factor, association of nutritional status and cognitive function were reported to be significant both in institutional or community dwelling elderly. Study by El Zoghbi et.al, among long-stay institutions elderly in Lebanon reported that lower MNA score were predictors of cognitive impairment (R = 3.03, 95% CI 1.41–6.53) [18]. Similar findings reported by Hai et.al among community dwelling elderly aged 90 years and more that showed malnutrition was the risk factor for lower MMSE score after adjustment for gender, ages, education, smoking and alcohol consumption, and several diseases condition [13]. The relationship were explained by the function of important nutrient in dietary intake that affect multiple brain process such as regulation of neuro-transmitter pathway, synaptic transmission, membrane fluidity, and signal tranduction [18].
Study measuring healthy ageing domains and its relationship with nutritional study among elderly were limited in Indonesia. One study measuring nutritional status, physical, and mental function among elderly in Yogyakarta in 2017 reported that cognitive function was strongly associated with functional capacity rather than nutritional status [19]. However, this study was not measuring social wellbeing or engagement status and association with depression symptoms was not investigated further. To filling the gap, this study aimed to investigate the association of nutritional status with different healthy ageing domains among elderly in urban area of Jakarta, Indonesia. By studying association of nutritional status and healthy ageing outcomes, better nutrition intervention program could be developed in order to robust health status of elderly in this area.
2Methods
2.1Area and study design
The study was designed as a cross-sectional study and conducted in the Jakarta province. This area has 664.01 km2 and located between latitude 5010’ - 6022’S and longitude 106022’42”–41’12.5”–58’24”E in the western part of the Java island. Jakarta is the most populated province in Indonesia that have 15,906 people live per meter square in 2020. As the capital city of Indonesia, Jakarta represents various ethnicity and sociodemographic backgrounds with second highest life expectancy at 73.56 years in 2013. According to provincial statistic data in 2019, there were 869 thousands elderly live in this area with 52% represents females and 48% were males elderly. Social inequity gap of this arera was higher than the national level since 2014 with gini ratio of 0.39 in 2019 [2, 20, 21].
2.2Study subjects
Participants were recruited from the sub-district community/public health center (PHC) trough multistage sampling method. As part of the universal coverage program from the central government, integrated health system in Jakarta province required every citizen to be the part of National Health Insurance (NHI). Therefore, PHC in this area have an important role as the first front liner of this program and required elderly citizens to have register and have regular checkup in this facility [22]. There were five urban municipalities in this province that consist of the Western, Eastern, Central, Northern, and Southern area. From each municipality, one sub-district level of PHC were randomly selected to make up five clusters which were Tanjung Priok, Palmerah, Johar Baru, Matraman, Jagakarsa. This was to allow equal distribution and representation of different population backgrounds. There were 133 subjects selected based on consecutive sampling according to arrival to the PHC. In each PHC, at least 23 subjects recruited to allow required total sample of 115 needed.
Participants’ recruitment and screening were conducted from July–August 2020 based on following criteria: aged > 60 years, residents of Jakarta, and able to follow study protocols. Minimum total sample size needed was 115 based on calculation to estimate correlation (alpha = 0.05, 0.8 power, and correlation estimation was 0.33 based on Arjuna et al. [19]). We added 1.5 design effect and 10% as non-response rate. Therefore, total of 133 subjects participated in the study to meet the required minimum sample size. During data collection in Jagakarsa PHC, from 25 participants recruited, there were five subjects that have incomplete data due to unavailibility to be interviewed. However, minimum sample were able to be fullfilled from other PHC participants.
All subjects have signed a written informed-consent before the start of the study. Ethical permission of the study obtained from Research Ethics Committee, Faculty of Medicine, Universitas Indonesia and Dr. Cipto Mangunkusumo General Hospital (protocol number: 20-04-0424). Additional study permission also obtained from Department of Health and Integrated One-Stop Service of Jakarta province.
2.3Data collection
Data collection was administered by trained enumerators that recruited based on academic backgrounds and experiences in the field. Enumerators were trained to standardize the interview protocols and measurement procedures. Before data collection, pre-testing was conducted among subjects that were different from study subjects in Tanjung Priok PHC. This was to allow better understanding in each items questionnaire and avoiding leading questions. Interview flow and adjustment with field conditions were revised into the final study protocols.
Due to the Covid-19 pandemic during data collection period, study protocols were following safety instructions from the government to minimize direct contact with respondents. The steps were performed based on the procedures below:
Interview via phone were conducted to acquire data for domains of healthy ageing status (physical functioning, mental health, and social engagement status), nutritional screening questionnaire, smoking status, history of chronic disease, socioeconomic, and demographic backgrounds of the respondents. The use of phone interview in the administration of nutritional screening questionnaire and healthy ageing domains (ADL, GDS, and social engagement status) has been studied to be valid and applicable to be conducted in the community settings [23–28].
Direct measurement was conducted to obtained data for cognitive function and anthropometric measurement in the PHC. Eligibility criteria to enter the health center were: not have any indications of fever (>38° C), cough, cold, sore throat, and shortness of breath. Enumerators were equipped with personal protective equipment. Respondents were required to wear face mask during data collection. Both respondents and enumerators were kept at least 1 meter distance during interview and wash their hands with disinfectant before and after direct data collection conducted.
2.4General characteristics assessment
Socio-demographic and economic characteristics measured were age, sex, education, and income. Age and sex variables measured based on identification card (ID). Distribution of age were categorized as early elderly (60–75 years) and older elderly (>75 years). Education were measured based on the last diploma obtained by subjects and categorized as low education (lower than elementary school), high education (graduated from junior or senior high school), and higher education (graduated from vocational or university degree). Income was measured using structured questionnaire that assessed average monthly income in Indonesian Rupiahs (IDR) in the past 12 months. Smoking status measured any tobacco consumption at current and in the past with classification as never smoke, former smoker (have stopped for more than 12 months), and current smokers. In this study, chronic diseases history were measured based on medical check up or medication of following diseases: diabetes melitus, hypertension, cancer, heart disease, stroke, and chronic respiratory diseases as the highest contributors to the non communicable diseases (NCD) related death in Indonesia [29]. Subjects were categorized as no major disease, have 1 disease, and have two or more chronic diseases.
2.5Healthy ageing domains measurement
Healthy ageing domains measured in this study was similar to study done by Lara et.al and Lu et.al that adopt the most important features including physical functioning, cognitive function, mental or pyscholgical health, and social wellbeing [9, 30]. Physical functioning measured based on sum of 6 indicators of Katz index basic activity daily living (BADL) and 8 indicators of Lawton scale of instrumental activity dailty living (IADL). Subjects were categorized as high physical functioning (ADL score 14) and low physical functioning (ADL score < 14). Cognitive function were assessed using Mini Mental State Examination (MMSE) and subjects were classified as normal cognition (MMSE > 24) and having impairment (MMSE < 23). Mental health or psychological domains were assesed using Geriatric Depressive Screening Scale short form (GDS-15) and subjects scored > 5 were categorized as having indication of depressive symptoms, while score < 5 as have no depressive symptoms. Lastly, social wellbeing were assesed using social engagement index score developed by Bassuk et.al that measured contact with spouse, family, friends, activities in religion and communities. The index were ranged from 0–6 and categorized as active engagement if scored from 3–6, while inactive engagement were scored 0-2 [31, 32].
2.6Nutritional status and anthropometric measurements
Nutritional status and anthropometric measurement data assessed based on Mini Nutritional Assessment–Short Form (MNA®-SF) [33, 34]. The use of MNA-SF has been studied to have valid and sensitive rapid nutritional assessment tools compare with the full MNA. This form could increase applicability in the community settings [34–36]. There were six questions items with total screening score were ranged from 0–14 with higher score would indicated better nutritional status of the respondents. Respondents were categorized into 3 categories as normal nutritional status (12–14 points), at risk of malnutrition (8–11 points), or malnourished (0–7 points).
Body weight of subjects measured using SECA® weighting scale that account 0.1 kg precision. During weight measurement, the scale should be placed in a flat surface, subjects required to have proper feet position, bare feet, taking off any objects that can alter the weight, and no movement until the measured number appears. Respondent were measured twice and the third measurement were done if the first and second measurement differs more than 0.1 kg. Height were measured using Shorr Board® and taken twice with the nearest 0.1 cm. Third measurement was taken if the first and second measurement differs for more than 0.5 cm. These anthropometric values were used to calculate body mass index (BMI) using formula weight (kg)/ height (m2).
2.7Statistical analysis
Data analysis performed using SPSS Statistic ver. 20.0 (IBM Corporation, Armonk, NY, USA). Normality test for continues data were analyzed using Kolmogorov-Smirrnof or Saphiro-Wilk test. Data on healthy ageing domains, age, MNA-SF score, income, and number of chronic disease history was presented as median (25th percentile–75th percentile). The data were also presented as the frequency distribution for variables of healthy ageing domains, age, sex, smoking status, and nutritional status. Correlation of numerical data (age, MNA-SF score, income, and number of diseases) with healthy ageing domains were analyzed using Spearman’s correlation test. Mean difference of healthy ageing domains score in different sex category were analyzed using Mann-Whitney test. Kruskal Wallis test performed to measure mean difference of healthy ageing domains score in different education and smoking status backgrounds. Covariate variables with p < 0.25 were included in the multivariate analysis that performed using linear regression test with CI 95% and significant level at p < 0.05.
3Results
Figure 1 shows the selection flow for subjects in the study. Initially, there were 166 subjects screened and selected to participate in the study. However, there were 33 subjects that have missing information on the healthy ageing domains due to unavailability in the second interview by phone. Total subjects included in the analyses were 133 persons.
Fig. 1
Flow of study sampling and subjects recruitment.
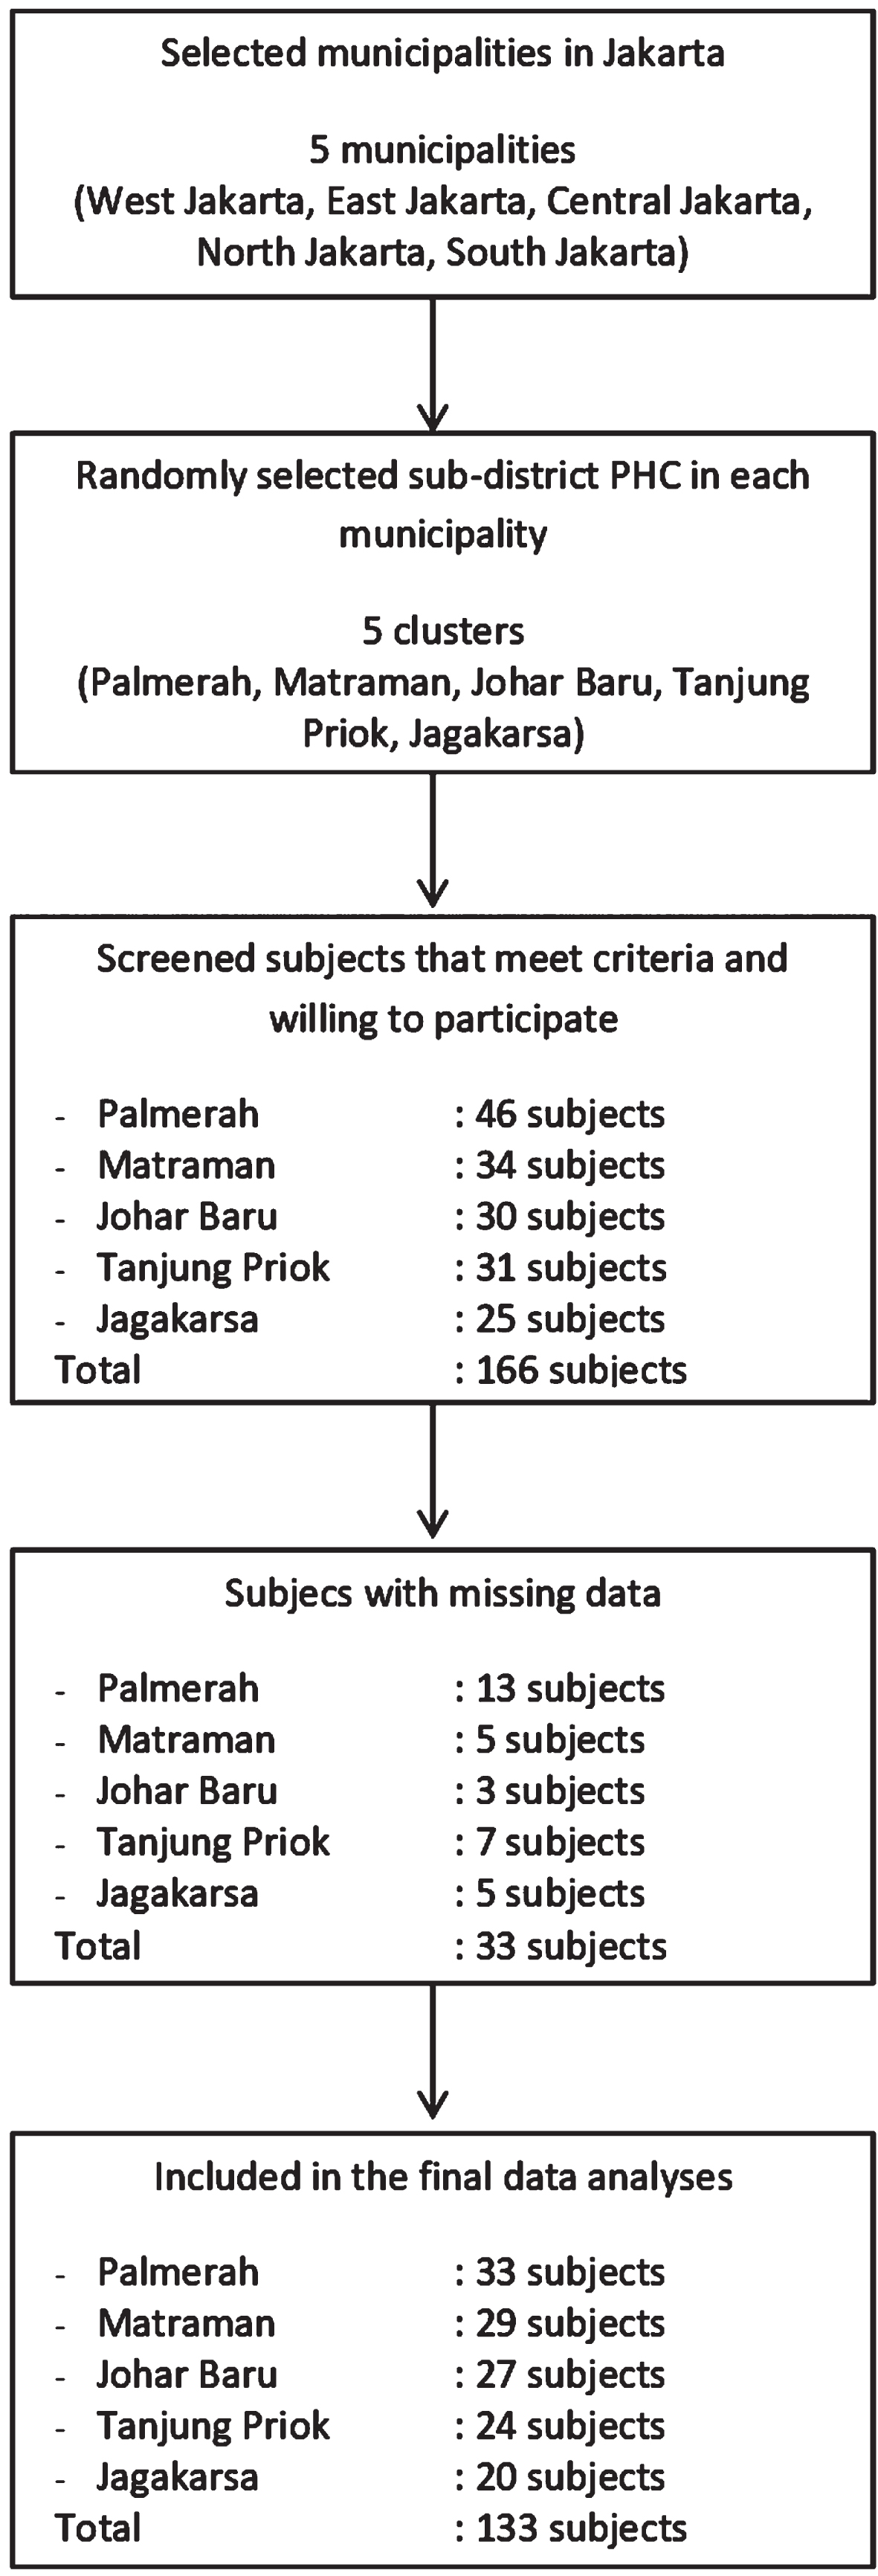
Table 1 presents general characteristics of the study subjects. Median aged of the elderly were 65.7 (62.2–69.9) years and mostly (94.7) were categorized as early elderly. Majority of the subjects were female (59.4%), graduated from junior or senior high school (49.6%) with average income of IDR 2 million. There were 8.3% subjects reported as current smokers with high prevalence of having at least 1 chronic disease (49.6%).
Table 1
General characteristics of study subjects
| Variable1 | Total (n = 133) |
| Age (year) | 65.7 (62.2–69.9) |
| Early elderly (n, %) | 126 (94.7) |
| Older elderly (n, %) | 7 (5.3) |
| Sex | |
| Male (n, %) | 54 (40.6) |
| Female (n, %) | 79 (59.4) |
| Education | |
| Lower education (n, %) | 41 (30.8) |
| High education (n, %) | 66 (49.6) |
| Higher education (n, %) | 26 (19.5) |
| Income (IDR 1.000k) | 2.0k (1.0k–3.2k) |
| Smoking status | |
| Never smoke (n, %) | 110 (82.7) |
| Former smokers (n, %) | 12 (9.0) |
| Current smokers (n, %) | 11 (8.3) |
| Number of chronic diseases | 1.0 (1.0–2.0) |
| Chronic disease history | |
| No major chronic disease (n, %) | 20 (15.0) |
| Have 1 chronic disease (n, %) | 66 (49.6) |
| Have 2 or more chronic disease (n, %) | 47 (35.3) |
1Variable presented as median (25th–75th percentile) or n (%).
Distribution of nutritional status and each healthy ageing domain are presented in Table 2. Based on the nutritional screening score, there were 18.8% subjects at risk of malnutrition and only 1 subject indicated to be malnourished (0.8%). From four healthy ageing domains measured, prevalence of functional disability and cognitive impairment were the highest among other domains. More than half (55.6%) of study subjects having low physical function and 46.8% subjects have moderate to mild cognitive impairment. There were 11.3% subjects showed indications of depression. However, in the domains of social engagement, subjects showed high engagement status with total prevalence of 87.2%.
Table 2
Nutritional status and healthy ageing profile of study subjects
| Variable1 | Total (n = 133) |
| MNA-SF score | 13.0 (12.0–14.0) |
| Nutritional status | |
| Normal (n, %) | 107 (80.5) |
| At risk (n, %) | 25 (18.8) |
| Malnutrition (n, %) | 1 (0.8) |
| ADL score | 13.0 (12.0–14.0) |
| Functional status | |
| High functioning (n, %) | 59 (44.4) |
| Low functioning (n, %) | 74 (55.6) |
| MMSE score | 24.0 (22.0–26.0) |
| Cognitive function | |
| Normal cognition (n, %) | 70 (52.6) |
| Moderate to mild impairment (n, %) | 63 (47.4) |
| GDS score | 1.0 (1.0–2.0) |
| Mental health status | |
| No depressive symptoms (n, %) | 118 (88.7) |
| Indicates depressive symptoms (n, %) | 15 (11.3) |
| Social engagement score | 4.0 (3.0–5.0) |
| Social engagement status | |
| Active engagement (n, %) | 116 (87.2) |
| Inactive engagement (n, %) | 17 (12.8) |
1Variable presented as median (25th–75th percentile) or n (%).
Using Spearman correlation test that showed in Table 3, the study resulted that nutritional screening score were found to have no correlation with the functioning score (p = 0.75), however it has positive but weak correlation with the cognitive score (r = 0.25, p < 0.00) and moderate correlation with social engagement score (r = 0.30, p < 0.00). Negative but weak correlation were found between nutritional screening score and depressive symptoms score (r = –0.24, p < 0.00). The association with the three domains were remained significant in the linier regression analyses as shown in Table 4. Significant predictor of functioning score was education (adjusted β= 0.27, 95% CI = 0.21–1.07, p < 0.00). For cognitive function score, significant predictors were MNA-SF score (adjusted β= 0.18, 95% CI = 0.07–0.81, p = 0.01), education (adjusted β= 0.36, 95% CI = 0.94–2.69, p < 0.00), and chronic disease (adjusted β= 0.19, 95% CI = 0.20–1.38, p < 0.00). Predictors for depressive symptoms score were MNA-SF score (adjusted β= –0.38, 95% CI = –0.89–(–0.34), p < 0.00), age (adjusted β= –0.26, 95% CI = –0.19–(–0.44), p < 0.00), and chronic disease (adjusted β= 0.22, 95% CI = 0.17–1.02, p < 0.01). Lastly, social engagement score predictors were MNA-SF score (adjusted β= 0.23, 95% CI = 0.05–0.34, p < 0.00) and education (adjusted β= 0.22, 95% CI = 0.076–0.74, p = 0.02).
Table 3
Bivariate analyses of nutritional status, general characteristics, and healthy ageing domains
| Variablea | ADL score | p-value | MMSE score | p-value | GDS score | p-value | Social engagement score | p-value |
| MNA-SF score† | ||||||||
| R | 0.02 | 0.75 | 0.25 | 0.00** | –0.24 | 0.00** | 0.30 | 0.00** |
| Age† | ||||||||
| R | –0.15 | 0.07 | –0.08 | 0.34 | –0.15 | 0.09 | –0.07 | 0.40 |
| Sex£ | ||||||||
| Male | 13.0 (12.0–14.0) | 0.10 | 24.5 (22.0–27.0) | 0.03* | 1.5 (1.0–2.0) | 0.75 | 4.0 (3.0–5.0) | 0.11 |
| Female | 14.0 (12.0–14.0) | 23.0 (21.0–26.0) | 1.0 (1.0–2.0) | 4.0 (3.0–5.0) | ||||
| Education§ | ||||||||
| Lower education | 13.0 (11.0–14.0) | 0.16 | 22.0 (18.5–24.0) | 0.00** | 2.0 (1.0–4.0) | 0.03* | 3.0 (3.0–4.0) | 0.00** |
| High education | 13.0 (12.0–14.0) | 24.4±2.6 | 1.0 (1.0–2.0) | 4.0 (3.0–5.0) | ||||
| Higher education | 14.0 (13.0–14.0) | 26.5 (22.7–27.2) | 1.5 (0.0–2.0) | 4.5 (4.0–5.0) | ||||
| Income† | ||||||||
| R | 0.02 | 0.75 | 0.29 | 0.00** | –0.04 | 0.62 | 0.10 | 0.22 |
| Smoking status§ | ||||||||
| Never smoke | 13.0 (12.0–14.0) | 0.95 | 24.0 (21.7–26.0) | 0.56 | 1.0 (1.0–2.0) | 0.61 | 4.0 (3.0–5.0) | 0.94 |
| Former smoker | 13.5 (11.5–14.0) | 24.0±3.5 | 1.5 (1.0–3.5) | 4.0 (3.2–5.0) | ||||
| Current smoker | 13.0 (12.0–14.0) | 24.3±3.2 | 2.0 (0.0–3.0) | 3.9±1.7 | ||||
| Number of chronic diseases† | ||||||||
| R | –0.07 | 0.38 | 0.24 | 0.00** | 0.19 | 0.02* | –0.12 | 0.14 |
aData presented in mean±SD, or median (25th percentile–75th percentile). †Spearman correlation test. £Mann-Whitney test. §Krusskal-Walis test. *Statistically significant (p < 0.05). **Statistically significant (p < 0.01).
Table 4
Association of nutritional screening score with healthy ageing domains by linear regression analyses
| Variables | Adjusted β | 95% CI | p-value |
| ADL score | |||
| MNA-SF | –0.02 | –0.23–0.17 | 0.79 |
| Age | –0.12 | –0.09–0.01 | 0.17 |
| Sex | 0.11 | –0.21–1.06 | 0.20 |
| Education | 0.27 | 0.21–1.07 | 0.00** |
| MMSE score | |||
| MNA-SF | 0.18 | 0.07–0.81 | 0.01* |
| Sex | –0.01 | –1.21–1.04 | 0.85 |
| Education | 0.36 | 0.94–2.69 | 0.00** |
| Income | 0.06 | 0.00–0.00 | 0.46 |
| Disease history | 0.19 | 0.20–1.38 | 0.00** |
| GDS score | |||
| MNA-SF | –0.38 | –0.89–(–0.34) | 0.00** |
| Age | –0.26 | –0.19–(–0.44) | 0.00** |
| Education | –0.08 | –0.84–0.27 | 0.31 |
| Disease history | 0.22 | 0.17–1.02 | 0.00** |
| Social engagement score | |||
| MNA-SF | 0.23 | 0.05–0.34 | 0.00** |
| Sex | –0.05 | –0.57–0.31 | 0.56 |
| Education | 0.22 | 0.06–0.74 | 0.02* |
| Income | –0.04 | 0.00–0.00 | 0.66 |
| Disease history | –0.15 | –0.45–0.00 | 0.05 |
CI: Confidence interval. *Statistically significant (p < 0.05). **Statistically significant (p < 0.01).
4Discussion
Based on the nutrition screening score, we compared the nutritional status prevalence with other studies before the pandemic situation. This study resulted that risk of malnutrition among subjects was lower than the previous study among urban elderly in Yogyakarta city, although this result may not reflect the pre pandemic period [19, 37]. Using the same MNA-SF indicator, the risk prevalence among study subjects were also showed better result compare with other Asian countries such as Sri Lanka and Malaysia [38, 39]. There were limited studies investigating nutritional status among community dwelling elderly during pandemic of Covid-19. Literature reviews highlight the linked among malnutrition risk, multi-morbidity, and higher risk to mortality and severity of Covid-19 infections. However, data on prevalence of malnutrition risk among elderly in community settings were unknown. Changes in the nutritional status might be indirectly affected by factors such as dietary habit changes during lockdown. Studies showed varied result among adults; those who changes dietary habit into healthier options mostly increase consumption of fresh food such as fruit and vegetables, others showed no significant changes or worse during pandemic situation [40–43]. Changes in the dietary habit in several studies were being associated with pyschological state such as anxiety level and stress [40, 43, 44].
Although current study showed lower risk of malnutrition compare with the pre-pandemic studies, factors such as weight loss and reduce intake should be considered closely since it was a common condition that might occur in older age that could contributed in the poor nutritional status [12]. These conditions happened due to changing in sense of taste, loss of appetite, and problems with chewing or swallowing [45]. It is also important to note that majority of the subjects were categorized as early elderly, thus having risk to malnutrition could affect in the higher probability on falls, frailty, and loss of mobility in later life [46].
Profile of healthy ageing domains were compared with previous studies before the Covid-19 pandemic. In urban area of Surabaya, study among community elderly showed 31.8% of physical dependency and 20.1% of cognitive impairment [37]. Similar prevalence were also reported among community dwellig in urban and rural area of India showed that functional disablitiy were 25.6% and 37.4% respectively [47, 48]. These numbers showed that the prevalence of disability among urban elderly in this study subjects are poorer. In addition, similar functional disability prevalence were reported from bigger study that utilized national survey data in the large-scale community settings among population in eastern part of Indonesia [7]. This indicated that the magnitude of functional disability problems among urban elderly in this study settings is similar compare with the most vulnerable area in this country. Compare with previous study on cognitive function among elderly in similar study area in 2011, the results showed higher prevalence of memory and cognitive problems both in the community and institutionalized settings [11, 49]. The rate of cognitive impairment this study also higher compare to urban elderly in India and China with the rate of 26% and 20.1% respectively [50, 51].
To the best of our knowledge, there were no study reported prevalence of healthy ageing domains among community dwelling during the Covid-19 outbreak in Indonesia. However, studies have evaluated cognitive decline among patients with dementia diseases during pandemic in several countries. The results showed that MMSE score decreased ranging from 0.6 to 3.1 points during the pandemic [52–54]. Decreased of cognitive during the pandemic were associated with several aspects in studies from different countries. The main aspects were reported associated with interaction among domain that to be related each other. Factors such as changes in routine activities due to social isolation has been reported to reduce autonomy in daily living activities that could affect the cognitive decline [55, 56]. Similar to this study findings, physical disability were also prevalent among subjects in this study that might contributed in the worsening the overall cognitive function. In addition, psychological disorders such as loneliness and depression due to social isolation were being highlighted to be the most prevalent aspects affected cognitive and functional decline in elderly [52, 54, 57].
Despite higher prevalence in functional disability and cognitive impairment, depression prevalence and social engagement among subjects in this study showed contrast results compare with previous studies before the pandemic. Prevalence of subjects indicating depression symptoms among subjects in this study were lower than the general elderly community settings before the pandemic that showed 18.5% prevalence of depression [49]. In addition, subjects in this study also showed higher prevalence on social engagement status compare to study among community elderly in the same city in 2011 [10]. Although studies on depression and social interaction among elderly during pandemic in Indonesia were not yet known, similar study findings were reported among older adults both in community dwelling or in the primary care settings. Majority of the older adults reported there were no increase of depressive symptoms before and the pandemic lockdown [57, 58]. The possible explanation was reported where partial or non-restrictive lockdown method such were applied in Jakarta enabled people to have certain access to going outside that contributed to more stable mental health state during the pandemic [59]. In the aspects of social activities, although there were restriction in the gathering or other in-person meeting, alternative methods such as contact with relatives and friends using phone has been reported to not change the social engagement and loneliness state of the elderly [58, 59]. Current study finding reported that nutritional screening score is associated with MMSE, GDS, and social engagement score after adjustment for possible confounders. However, the association was not observed between nutritional screening score with ADL. Education was found to be significant predictor of ADL rather than nutritional screening score. Subjects with higher level of education were associated with higher level of ADL. Study conducted by Garber et.al reported similar finding among community dwelling in the US where better education could indicate level of socioeconomic position that enable higher opportunity of subjects to access health care services that support better functional level and chronic disease management [60].
Linier regression analysis showed that subjects with higher level of education, reporting more diseases, and have better nutritional score were associated with higher MMSE. Previous study among Lebanese older adults supported the finding where nutritional status was factor that associated with cognitive state (OR = 3.03, CI 95% = 1.41–6.53, p = 0.005) [18]. The relationship was explained due to the role of nutrients intake in the regulation of neurotransmitter and anti-oxidant pathways. Good nutrition provided sources of energy and micronutrient that can affect multiple brain process by providing essential metabolic load and protect neural defect that will determine cognitive ability [61]. Besides nutrition, education were important factors that have been studied to contributed in cognitive status [31, 62]. Education were found to be protective factor against cognitive decline in older age by increasing cognitive reserve. It is suggested that education influence lifestyle choices that could impact better health status, better opportunities in health care use and quality of care, as well as changes of habits related to occurrence in diseases that at the end impacted in cognitive function [63]. Current study also found that subjects with more diseases history are associated with higher cognitive state. The explanation was related with education level that could affect access to information and care that those with more education were more likely reporting their history of diseases [62].
In this study, nutritional status and disease history were associated with mental health domain score. Subjects with poor nutritional status and reported more diseases in this study had higher depression sypmtoms score. Study on review article by Al-Rasheed et.al reported that there was vicious circle between depression and malnutrition in elderly. There were common risk factors on both variables such as loneliness, lack of social support, physical illness, functional impairment, financial paucity, and endocrinal disturbances [64]. It is suggested that malnutrition may affect depression through biological changes such as lack in consumption of esential nutrients that impact lower in immune functions [65]. In relation with malnutrition, Wahyudi et.al reported that chronic disease history such as diabetes mellitus that were commonly occur in older age were also associated with higher risk to develop depression. Subjects with complication in chronic diseases would experience higher risk of disability and cognitive decline that at the end contributed in development of depression [66].
Lastly better nutritional status and education level of the subjects were associated with better social engagement status in this study. Current study noted that nutritional status was correlated with several healthy ageing domains including social engagement. Similar with depression, social engagement and nutritional status were interrelated each other. Malnutrition has been studied to adversely impact general health status in elderly such as increase in weakness, diminished activity, exacerbation pre-existing illness, and poor prognosis that will affect subjects ability to engaging with social life [64]. In the other hand, social issolation such as living alone would impact ability of elderly to access better nutritional intake that resulted in higher risk of malnutrition [45]. Beside nutrition, education was factor that being highlighted to be important predictors of social status for many health outcomes including in several healthy ageing studies [26, 45, 40, 62]. Sowa et al. reported that role of education were affecting level of health knowledge, beliefs, and awareness to diseases risk factors that attributed to healthier lifestyle and better access to information and care. In addition, better education were also associated with higher opportunities in employment and impacted level of interaction with outside communities [62].
This study was among the first to examine comprehensive healthy ageing domains and its association with nutritional status indicated by MNA-SF among urban elderly population in Jakarta, Indonesia. Domains of healthy ageing and nutritional screening score were measured based on established indicators, thus comparison among studies could be conducted in the future. Validated measurement tools and standardized data collection procedures were also conducted to maximize data quality administration.
There were limitations needed to be considered in current study. First, using health facility based as study sampling frame could influenced the result on high prevalence of chronic diseases among subjects, since those who were coming to health facility would represent tendency of those having more health concern. Furthermore, recall bias might occur during interview due to decrease in cognitive function in elderly. However, by considering the level of education that most of the subjects achieved high school or higher, this bias could be minimized. The reason was due to higher level of education has been studied to increase interview response rate and higher cognitive reserve that could trigger valid information during assessment [26]. In addition, considering data that cross-sectionally conducted during pandemic of COVID-19 in Indonesia, behavioral and dietary changes that might happen before and during the pandemic among subjects could not be compared. Thus, causalities for higher level of functional limitation and cognitive impairment that occur due to social restriction among study subjects could not be examined.
5Conclusion
The study showed that higher nutritional screening score was associated with higher level of cognitive score, lower depression and higher social engagement status. However, nutritional score was not associated with functioning ability in this study. Significant predictor for physical function score was education level. Nutritional screening score, education, and disease history were associated with cognitive score. In the domain of depressive symptoms, nutrition score and disease history were found to be the significant predictors. Lastly nutritional score and education were associated with domain of social engagement score.
Acknowledgments
This study was partially funded by Universitas Indonesia under the grant of International Indexed Publication for Final Assignment of the Postgraduate Student (PUTI Q4) Program 2020 (Grant number: NKB-2135/UN2.RST/HKP.05.00/2020). The authors were grateful to support given from Department of Health at Provincial and municipalities’ level of Jakarta Province. We were also grateful to the support given from the head and staff of each community health center.
Conflict of interest
None of the authors reported conflict of interest related to the study.
References
[1] | Kementerian Kesehatan RI . Situasi lansia di Indonesia tahun 2017: Gambar struktur umur penduduk Indonesia tahun 2017. Pusat Data dan Informasi. 2017. |
[2] | Badan Pusat Statistik. Angka harapan hidup menurut provinsi, 1996-2013. 2018. |
[3] | Badan Pusat Statistik. Ketimpangan pengeluaran penduduk Jakarta di atas ketimpangan Nasional sejak. 2014. 2019. |
[4] | Tavares RE , Jesus de MCP , Machado DR , Braga VAS , Tocantins FR , Merighi MAB . Healthy aging from the perspective of the elderly: an integrative review. Rev Bras Geriatr e Gerontol. (2017) ;20: (6):878–89. |
[5] | Leslie W , Hankey C . Aging, nutritional status and health. Healthcare. (2015) ;3: (3):648–58. |
[6] | Liu S , Lee IM , Ajani U , Cole SR , Buring JE , Manson JE . Intake of vegetables rich in carotenoids and risk of coronary heart disease in men: The physicians’ health study. Int J Epidemiol. (2001) ;30: (1):130–5. |
[7] | Cao J , Rammohan A . Social capital and healthy ageing in Indonesia. BMC Public Health. (2016) ;16: (1):1–15. |
[8] | BPJS Kesehatan. Laporan pengelolaan program dan laporan keuangan tahun 2018. 2018; |
[9] | Lara J , Godfrey A , Evans E , Heaven B , Brown LJE , Barron E , et al. Towards measurement of the healthy ageing phenotype in lifestyle-based intervention studies. Maturitas. (2013) ;76: (2):189–99. |
[10] | Wreksoatmodjo BR . Pengaruh sosial engagement terhadap fungsi kognitif lanjut usia di Jakarta. Cermin Dunia Kedokt. (2012) ;41: (3):171–4. |
[11] | Wreksoatmodjo BR . Pengaruh aktivitas fisik terhadap fungsi kognitif lanjut usia di Jakarta. Cermin Dunia Kedokt. (2016) ;43: (1):7–12. |
[12] | Donini LM , Scardella P , Piombo L , Neri B , Asprino R , Proietti AR , et al. Malnutrition in elderly: Social and economic determinants. J Nutr Heal Aging. (2013) ;17: (1):9–15. |
[13] | Hai S , Cao L , Yang X , Wang H , Liu P , Hao Q , et al. Association between nutrition status and cognitive impairment among Chinese nonagenarians and centenarians. Int J Gerontol. (2017) ;11: (4):215–9. |
[14] | Velázquez-Alva MC , Irigoyen-Camacho ME , Cabrer-Rosales MF , Lazarevich I , Arrieta-Cruz I , Gutiérrez-Juárez R , et al. Prevalence of malnutrition and depression in older adults living innursing homes in Mexico City. Nutrients. (2020) ;12: (8):1–12. |
[15] | Salminen KS , Suominen MH , Kautiainen H , Pitkälä KH . Associations between nutritional status, frailty and health-related quality of life among older long-term care residents in Helsinki. J Nutr Heal Aging. (2020) ;24: (3):319–24. |
[16] | Gezer C , Yurt M , Harmancio B , Elmas C . The relationship between malnutrition, diet quality and health-related quality of life among the elderly: a cross-sectional study. Prog Nutr. (2020) ;22: (4):1–9. |
[17] | Ahmadi SM , Keshavarzi S , Refahi Z , Lankarani KB . Dependence of the geriatric depression scores on nutritional status, cognitive abilities and anthropometric indices in elderly population of Shiraz, Iran. Iran J Psychophysiol. (2013) ;8: (2):92–6. |
[18] | El Zoghbi M , Boulos C , Amal AH , Saleh N , Awada S , Rachidi S , et al. Association between cognitive function and nutritional status in elderly: A cross-sectional study in three institutions of Beirut-Lebanon. Geriatr Ment Heal Care. (2013) ;1: (4):73–81. |
[19] | Arjuna T , Soenen S , Hasnawati RA , Lange K , Chapman I , Luscombe-Marsh ND . A cross-sectional study of nutrient intake and health status among older adults in Yogyakarta Indonesia. Nutrients. (2017) ;9: (11):1–21. |
[20] | Badan Pusat Statistik. Hasil sensus penduduk 2020. 2021. |
[21] | Dinas Komunikasi Informatika dan Statistik Provinsi DKI Jakarta. Buku statistik provinsi Daerah Khusus Ibukota Jakarta tahun 2020. 2020. |
[22] | BPJS Kesehatan. Executive summary: program management report and financial report on the JKN program 2014. 2015. |
[23] | Ciesla JR , Shi L , Stoskopf CH , Samuels ME . Reliability of Katz’s Activities of Daily Living scale when used in telephone interviews. Eval Health Prof. (1993) ;16: (2):190–203. |
[24] | Carrete P , Augustovski F , Gimpel N , Fernandez S , Paolo Di R , Schaffer I , et al. Validation of a telephone-administered geriatric depression scale in a hispanic elderly population. J Gen Intern Med. (2001) ;16: :446–50. |
[25] | Dauphinot V , Boublay N , Moutet C , Achi S , Bathsavanis A , Krolak-Salmon P . Comparison of Instrumental Activities of Daily Living assessment by face-to-face or telephone interviews: A randomized, crossover study. Alzheimer’s Res Ther. (2020) ;12: (1):1–10. |
[26] | Herzog AR , Rodgers WL , Kulka RA . Interviewing older adults: A comparison of telephone and face-to-face modalities. Public Opin Q. (1983) ;47: (3):405–18. |
[27] | Rolandi E , Vaccaro R , Abbondanza S , Casanova G , Pettinato L , Colombo M , et al. Loneliness and social engagement in older adults based in lombardy during the covid-19 lockdown: The long-term effects of a course on social networking sites use. Int J Environ Res Public Health. (2020) ;17: (21):1–12. |
[28] | Yang PH , Lin MC , Liu YY , Lee CL , Chang NJ . Effect of nutritional intervention programs on nutritional status and readmission rate in malnourished older adults with pneumonia: A randomized control trial. Int J Environ Res Public Health. (2019) ;16: (23):1–12. |
[29] | World Health Organization. NCDs country profiles 2018 WHO. 2018. |
[30] | Lu W , Pikhart H , Sacker A . Domains and measurements of healthy aging in epidemiological studies: A review. Gerontologist. (2018) ;00: (00):1–17. |
[31] | Arias-Merino ED , Mendoza-Ruvalcaba NM , Arias-Merino MJ , Cueva-Contreras J , Vazquez Arias C . Prevalence of successful aging in the elderly in western Mexico. Curr Gerontol Geriatr Res. (2012) ;2012: (September):1–6. |
[32] | Bassuk SS , Glass TA , Berkman LF . Social disengagement and incident cognitive decline in community-dwelling elderly persons. Ann Intern Med. (1999) ;131: (3):165–73. |
[33] | Nestle Nutrition Insititute. Nutrition screening as easy as MNA: A guide to completing the MNA-SF. Nestle Nutrition Insititute. 2009. |
[34] | Rubenstein LZ , Harker JO , Salvà A , Guigoz Y , Vellas B . Screening for undernutrition in geriatric practice: Developing the Short-Form Mini-Nutritional Assessment (MNA-SF). J Gerontol Med Sci. (2001) ;56: (6):366–72. |
[35] | Motokawa K , Yasuda J , Mikami Y , Edahiro A , Morishita S , Shirobe M , et al. The Mini Nutritional Assessment-Short Form as a predictor of nursing home mortality in Japan: A 30-month longitudinal study. Arch Gerontol Geriatr. (2019) ;86: (April 2019):103954. |
[36] | Kaiser MJ , Bauer JM , Ramsch C , Uter W , Guigoz Y , Cederholm T , et al. Validation of the Mini Nutritional Assessment short-form(MNA®-SF): A practical tool for identification ofnutritional status. J Nutr Heal Aging. (2009) ;13: (9):782–8. |
[37] | Widajanti N , Ichwani J , Dharmanta RS , Firdausi H , Haryono Y , Yulianti E , et al. Sarcopenia and frailty profile in the elderly community of Surabaya: A descriptive study. Acta Med Indones. (2020) ;52: (1):5–13. |
[38] | Norazman CW , Adznam SN , Jamaluddin R . Malnutrition as key predictor of physical frailty among Malaysian older adults. Nutrients. (2020) ;12: (6):1–12. |
[39] | Damayanthi HDWT , Moy FM , Abdullah KL , Dharmaratne SD . Prevalence of malnutrition and associated factors among community-dwelling older persons in Sri Lanka: A cross-sectional study. BMC Geriatr. (2018) ;18: (1):1–10. |
[40] | Hu Z , Lin X , Kaminga AC , Xu H . Impact of the COVID-19 epidemic on lifestyle behaviors and their association with subjective well-being among the general population in Mainland China: Cross-sectional study. J Med Internet Res. (2020) ;22: (8):1–10. |
[41] | Rodríguez-Pérez C , Molina-Montes E , Verardo V , Artacho R , García-Villanova B , Guerra-Hernández EJ , et al. Changes indietary behaviours during the COVID-19 outbreak confinement in theSpanish COVIDiet study. Nutrients. (2020) ;12: (6):1–19. |
[42] | Di Renzo L , Gualtieri P , Pivari F , Soldati L , Attinà A , Cinelli G , et al. Eating habits and lifestyle changes during COVID-19lockdown: An Italian survey. J Transl Med. (2020) ;18: (1):1–15. |
[43] | Scarmozzino F , Visioli F . Covid-19 and the subsequent lockdown modified dietary habits of almost half the population in an Italian sample. Foods. (2020) ;9: (5). |
[44] | Khubchandani J , Kandiah J , Saiki D . The COVID-19 pandemic, stress, and eating practices in the United States. Eur J Investig Heal Psychol Educ. (2020) ;10: (4):950–6. |
[45] | Katsas K , Mamalaki E , Kontogianni MD , Anastasiou CA , Kosmidis MH , Varlamis I , et al. Malnutrition in older adults: Correlations with social, diet-related, and neuropsychological factors. Nutrition. (2020) ;71: :110640. |
[46] | Setiati S , Laksmi PW , Aryana IGPS , Sunarti S , Widajanti N , Dwipa L , et al. Frailty state among Indonesian elderly: Prevalence, associated factors, and frailty state transition. BMC Geriatr. (2019) ;19: (182):1–10. |
[47] | Gupta P , Mani K , Rai SK , Nongkynrih B , Gupta SK . Functional disability among elderly persons in a rural area of Haryana. Indian J Public Health. (2014) ;58: (1):11–6. |
[48] | Vaish K , Patra S , Chhabra P . Functional disability among elderly: A community-based cross-sectional study. J Fam Med Prim Care. (2019) ;9: (1):253–8. |
[49] | Susilowati IH , Nugraha S , Sabarinah S , Peltzer K , Pengpid S , Hasiholan BP . Prevalence and risk factors associated with falls among community-dwelling and institutionalized older adults in indonesia. Malaysian Fam Physician. (2020) ;15: (1):30–8. |
[50] | Zhao Q , Guo Q-H , Meng H , Wang B , Luo J , Mortimer J , et al. Prevalence of mild cognitive impairment in an urban community in China: A cross-sectional analysis of the Shanghai Aging Study. Alzheimer’s Dement. (2014) ;11: (3):300–9. |
[51] | Mohan D , Iype T , Varghese S , Usha A , Mohan M . A cross-sectionalstudy to assess prevalence and factors associated with mildcognitive impairment among older adults in an urban area of Kerala,South India. BMJ Open. (2019) ;9: (3):1–8. |
[52] | Ismail II , Kamel WA , Al-Hashel JY . Association of COVID-19 pandemic and rate of cognitive decline in patients with dementia and mild cognitive impairment: A cross-sectional study. Gerontol Geriatr Med. (2021) ;7: :1–7. |
[53] | Palermo G , Tommasini L , Baldacci F , Del Prete E , Siciliano G , Ceravolo R . Impact of Coronavirus disease pandemic on cognition in Parkinson’s disease. Mov Disord. (2020) ;35: (10):1717–8. |
[54] | Tondo G , Sarasso B , Serra P , Tesser F , Comi C . The impact of the covid-19 pandemic on the cognition of people with dementia. Int J Environ Res Public Health. (2021) ;18: (8):1–11. |
[55] | Borges-Machado F , Barros D , Ribeiro Ó , Carvalho J . The effectsof COVID-19 home confinement in Dementia care: Physical andcognitive decline, severe neuropsychiatric symptoms and increasedcaregiving burden. Am J Alzheimers Dis Other Demen. (2020) ;35: :1–9. |
[56] | Tsapanou A , Papatriantafyllou JD , Yiannopoulou K , Sali D , Kalligerou F , Ntanasi E , et al. The impact of COVID-19 pandemic on people with mild cognitive impairment/dementia and on their caregivers. Int J Geriatr Psychiatry. (2021) ;36: (4):583–7. |
[57] | Barguilla A , Fernández-Lebrero A , Estragués-Gázquez I , García-Escobar G , Navalpotro-Gómez I , Manero RM , et al. Effects of COVID-19 pandemic confinement in patients with cognitiveimpairment. Front Neurol. (2020) ;11: (November):1–8. |
[58] | Thyrian JR , Kracht F , Nikelski A , Boekholt M , Schumacher-Schönert F , Rädke A , et al. The situation of elderly with cognitive impairment living at home during lockdown in the Corona-pandemic in Germany. 2020;1-15. |
[59] | van Tilburg TG , Steinmetz S , Stolte E , van der Roest H , de Vries DH . Loneliness and mental health during the COVID-19 pandemic: A study among Dutch older adults. Journals Gerontol Ser B. (2020) ;20: (20):1–7. |
[60] | Garber CE , Greaney ML , Riebe D , Nigg CR , Burbank PA , Clark PG . Physical and mental health-related correlates of physical function in community dwelling older adults: A cross sectional study. BMC Geriatr. (2010) ;10: (6):1–10. |
[61] | Gómez-Pinilla F . Brain foods: The effects of nutrients on brain function. Nat Rev Neurosci. (2008) ;9: (july):568–78. |
[62] | Sowa A , Tobiasz-Adamczyk B , Topór-Mądry R , Poscia A , La Milia DI . Predictors of healthy ageing: Public health policy targets. BMC Health Serv Res. (2016) ;16: (Suppl 5):441–79. |
[63] | Shatenstein B , Ferland G , Belleville S , Gray-donald K , Kergoat M , Morais J , et al. Diet quality and cognition among older adults from the NuAge study. Exp Gerontol. (2012) ;47: :353–60. |
[64] | Al-Rasheed R , Alrasheedi R , Al Johani R , Alrashidi H , Almaimany B , Alshalawi B , et al. Malnutrition in elderly and its relation to depression. Int J Community Med Public Heal. (2018) ;5: (6):2156–60. |
[65] | Wei J , Fan L , Zhang Y , Li S , Partridge J , Claytor L , et al. Association between malnutrition anddepression among community-dwelling older Chinese adults. Asia-Pacific J Public Heal. (2018) ;30: (2):107–17. |
[66] | Wahyudi ER , Setiati S , Harimurti K , Dewiasty E , Istanti R . Risk factors for depressive symptom changes in Indonesian geriatric outpatient. Acta Med Indones. (2012) ;44: (1):47–52. |


