
The relationships of lifetime physical activity and diet with salivary cell telomere length in current ultra-endurance exercisers
Abstract
BACKGROUND:
Physical activity and a healthy diet may delay the aging process and ultra-endurance exercise is an extreme form of physical activity. Telomeres are protective DNA sequences located at the ends of eukaryotic chromosomes which shorten as we age.
OBJECTIVE:
The aim of this study was to investigate the relationships of lifetime physical activity and diet with salivary cell telomere length in current ultra-endurance exercisers (n = 49; % female = 37, age range 26–74 years).
METHODS:
Physical activity and dietary intake were measured using the Lifetime Physical Activity and Diet Questionnaire (LPADQ) and salivary cell telomere length was measured using quantitative polymerase chain reaction.
RESULTS:
In this group of current ultra-endurance exercisers there was no relationship between lifetime physical activity or diet (according to food category scores) and telomere length. In contrast to the expected age-related decrease in telomere length, there was no relationship between age and telomere length (95% confidence interval [CI]: –38.86, 14.54, p = 0.359) in this group of current ultra-endurance exercisers.
CONCLUSIONS:
The relationships of lifetime physical activity and diet with telomere length remain uncertain. It is possible that lifetime physical activity (including ultra-endurance exercise) and lifetime diet may independently, or in combination, contribute to a decrease in the rate of age-related telomere shortening in current ultra-endurance exercisers.
1Introduction
Ultra-endurance exercise involves prolonged periods of physical activity covering a distance of more than the standard marathon (42.195 km) or with a duration greater than 6 hours [1]. The majority of ultra-runners are masters athletes (>35 years) with reported age of participants ranging from 18–81 years [2–4]. Currently, men make up the majority of participants in ultra-endurance events, although an increasing number of women participants over the past decade has been reported [5, 6]. Ultra-endurance exercisers tend to be well-educated and show a large range of training and running experiences [2, 4]. Worldwide participation in ultra-endurance exercise is increasing, yet there is minimal research on the individuals who engage in this form of physical activity. Specifically, there is minimal information on the physical activity and dietary habits of ultra-endurance exercisers or how this form of extreme exercise influences the aging process.
Aging is an obligatory component of human life and is thought to be determined by several factors, including genetics, the environment and lifestyle choices [7, 8]. Telomeres are non-coding repeating segments of DNA (human sequence –TTAGGG) located at the ends of eukaryotic chromosomes [9]. In most dividing cells telomeres shorten which can lead to apoptosis or replicative senescence and this progressive loss of cells can contribute to chronic inflammation, tissue aging and age-related diseases [10]. Telomere shortening is a natural part of the aging process, but shortening may be accelerated by lifestyle factors such as obesity [11], inactivity, smoking [12, 13], and psychological stress [14, 15]. Physical activity and diet have been found to be associated with components of telomere biology with many studies showing positive correlations of regular exercise and healthy eating with telomere length [16–21]. While other indices of biological aging have been reported, such as the epigenetic clock [22], telomere length has been used as a marker of biological aging in a multitude of research topics and may provide information on the aging process at the molecular level [23, 24].
Physical activity is commonly assessed using questionnaires which collect information on intensity, duration and/or type of exercise [25]. Although evidence suggests habitual physical activity may help preserve telomere length, it is unclear if this depends on the type, volume or intensity of exercise [26]. To our knowledge, only five studies have investigated telomere length in ultra-endurance exercisers with three showing longer telomeres and two showing no difference in telomere length in ultra-endurance exercisers [20, 27–30]. However, these studies have not assessed physical activity across the lifespan and there are no data that examine the influence of diet on telomere length in ultra-endurance exercisers.
Most studies investigating the relationship between diet and telomere length have used a food frequency questionnaire (FFQ) [31–37]. This tool has been used to investigate diet in relation to telomere length based on individual nutrients, foods and/or beverages [38–42] or to examine associations with dietary patterns [17, 43, 44]. However, food frequency questionnaires used in telomere research only extend as far back as one year and provide dietary information specific to that time period. Although there are two longitudinal studies that have collected dietary intake at baseline and measured telomere length 10 years later [40, 43], there are no studies that include information on lifetime diet from childhood to older age. Information on lifetime diet is important considering the dynamics of telomere length changes and attrition begin at birth and extend across the lifespan [45]. Studies show higher intakes of vegetables and/or fruit and adherence to some dietary patterns, such as the Mediterranean diet, are positively associated with telomere length [17, 36]. Therefore, assessing the lifetime intake of healthy and less healthy foods could be a useful and logical approach to investigating the impact of diet on telomere length.
Telomere length has most frequently been assessed in blood cells, particularly peripheral blood mononuclear cells (PMBC’s) [46–49]. However, more recently, studies have used salivary cells to assess telomere length as they are an appropriate alternative to blood cells and provide a fast, simple to obtain, and non-invasive method for sample collection [50]. Salivary cell telomere length is highly correlated with telomere length from whole blood and leukocytes [51, 52] and, therefore, it has been suggested telomere length of salivary cells can be used as a proxy for telomere length in other tissues [53]. Furthermore, genomic DNA from salivary cells has been found to be of similar quality to that obtained from blood cells [54]. The aim of the present study was to investigate the relationships of lifetime physical activity and diet with salivary cell telomere length in current ultra-endurance exercisers.
2Materials and methods
2.1Study design
This study includes a subset of participants from a previous study that reported on the lifetime physical activity [4] and diet [55] of current ultra-endurance exercisers. Ultra-endurance exercisers from the previous study were invited via email to take part in the present study. Current male and female ultra-endurance exercisers were recruited for this study from April 2016 to September 2016. A control group was not included as it was not possible to obtain a comparison group for which physical activity and diet were suitably controlled across the lifespan as the individual patterns could not have been matched. This study was conducted according to the National Statement and Human Research Ethics Guidelines [56] and approved by the University of the Sunshine Coast Human Research Ethics Committee. Lifetime physical activity and diet were investigated retrospectively using an online survey hosted on the SurveyMonkey® platform. Participants were provided with an information sheet, and provided informed consent by completing and submitting the online questionnaires and by returning a written, signed consent form with their saliva samples.
2.2Participants
The details of participant recruitment have been described elsewhere [4]. Briefly, participants were recruited internationally through Facebook, the Ultra Listserve (http://[email protected]) and web pages associated with ultra-endurance organizations and events worldwide, including Australia, New Zealand, the United States of America and Canada. Inclusion criteria were being healthy, ≥18 years of age, able to complete an online questionnaire in English, and being a current ultra-endurance exerciser. To qualify as a current ultra-endurance exerciser, participants had to have completed at least one ultra-endurance event within the last five years and engage in, on average, at least five hours of running or cycling per week during the past year. The criterion of completion of at least one ultra-endurance event within the last five years allowed for the inclusion of individuals who identified as a current ultra-endurance exerciser (i.e. in training only) but may not participate in events on a regular basis. For the current study, sampling was restricted to Australian and North American participants who had completed all required components of the initial study (n = 86). Fifty-five participants agreed to take part in the study and 50 (91%) saliva samples (33 men; 17 women) were received.
2.3Questionnaires
Lifetime physical activity and diet were assessed using the Lifetime Physical Activity and Diet Questionnaire (LPADQ), details of which have been described elsewhere [55]. In brief, the questionnaire is a modified and combined version of the Lifetime Physical Activity Questionnaire (LPAQ) and the Lifetime Diet Questionnaire (LDQ) [57, 58]. Medical health history was collected with a Medical History Questionnaire (MHQ).
The LPAQ assesses physical activity over several life periods ranging from childhood to older age [58]. Participants identified all activities they engaged in on more than 10 occasions over each life period. They then estimated the total number of years, months and hours they engaged in the activity. Similarly, the LDQ assesses dietary intake over five life periods (5–18 years, 19–30 years, 31–45 years, 46–60 years and 61–75 years). Using a four-point scale (i.e. rarely, 2–3 times a month; 2–3 times per week; daily), individuals were asked to recall the general frequency at which they consumed certain foods during each time period. The life periods in the LPAQ were modified from the original version to match the diet history life periods [58] and the 5–18 year life period was divided into 5–12 and 13–18 years.
Stressful life events were measured using the List of Threatening Events (LTE) questionnaire [59]. Participants identified if they experienced any of 12 stressful events during each of six life periods (0–12 years; 13–18 years; 19–30 years, etc.). If a stressful event occurred more than once, they were instructed to select as many times as needed. Participants indicated ‘yes’, ‘no’ or ‘not applicable’ to each experience and a lifetime score was obtained ranging from 0–72 (one point for each ‘yes’ with a higher score indicating higher lifetime stress). For the current study, participants received a link to the List of Threatening Events (LTE) questionnaire by e-mail.
2.4Assessment of lifetime physical activity and diet
Assessment of lifetime physical activity has been described in detail elsewhere [4]. Briefly, physical activity was calculated as the total number of hours spent in each activity per life period. This was determined by multiplying the number of years, by the number of months and the number of hours per week spent in each activity. Each activity was multiplied by the intensity according to the metabolic equivalent (MET) as determined by the Compendium of Physical Activities [60]. All activities were summed to obtain a total number of MET-hours of activity for each life period. Finally, a total lifetime MET-hours was calculated by summing the total MET-hours per life period up to the participant’s current life period.
The assessment of lifetime diet has also been described elsewhere [55]. Briefly, there are 78 food items within the LDQ and these were grouped into two categories (healthy and less healthy). Fifty foods were included in the healthy food category: 17 vegetables, 13 fruits, 4 dairy or alternatives, 5 whole grains, 9 meat or alternatives, 1 alcohol [i.e. red wine] and 1 fat [i.e. olive oil]. Eleven foods were included in the less healthy food category: 6 sweets or sugar sweetened beverages, 1 takeaway food, 1 snack food, 1 processed meat and 2 saturated fats. As such, foods were grouped into categories according to healthy eating guidelines (healthy) and those considered other/extra/processed foods (less healthy). Seventeen food items were not included as there was not enough evidence to support inclusion of these items in one category over the other. A separate sub-category for vegetables and fruit (30 items) was created. These were investigated separately as several studies have reported a benefit of vegetables and/or fruit on telomere length [34, 36, 43, 44]. Each participant received three scores per life period. A score per life period was calculated by summing response frequencies (i.e. from 1 rarely/never to 4 daily) for each food within the category. Possible ranges were 50–200 (or 49–196 for childhood and adolescence) for the healthy food category, 11–44 for the less healthy food category and 30–120 for vegetables/fruit food category. Childhood and adolescence had one less item in the healthy food category (i.e. excludes red wine) and, therefore, a weighted score was calculated by multiplying the score by 200 and dividing by 196. Finally, a weighted lifetime score was calculated as the sum of the scores for each life period multiplied by the number of years spent in the respective life period, and then dividing by the total number of years spent in all life periods.
2.5Saliva samples
Purpose-made collection kits were mailed or hand delivered to participants along with instructions for providing saliva samples. Each kit included two 30 ml collection containers with 2 ml of a stabilizing solution (RNAlater® Thermo Fisher Scientific). Participants were instructed to provide 5 ml of saliva per container and, upon receipt, samples were stored at –20°C until DNA extraction. At the time of DNA extraction, saliva samples were aliquoted into approximately 750μl volumes and one was used for immediate DNA extraction. The remaining aliquots were stored at –20°C for use in subsequent DNA extractions if the initial isolation was unsuccessful (i.e. poor DNA quality/poor yield). All assays were performed by the same investigator, under identical conditions.
2.6Measurement of telomere length
Saliva samples were spun for 5 minutes (×8000 g) to obtain a cell pellet and to remove the supernatant. Genomic DNA was extracted from salivary samples using the ISOLATE II kit (Bioline) following the genomic DNA bench top protocol (http://www.bioline.com/au/). During the pre-lysis step samples were incubated for up to 18 hours depending on the time required for complete lysis. Following isolation DNA samples were stored at –20°C until further analysis. DNA was assessed for quality and quantity via visualization on a 1% agarose gel and spectrophotometry (NanoDrop, Thermo Scientific).
Relative (rTL) and absolute telomere length (aTL) were measured using quantitative polymerase chain reaction (qPCR). Relative TL was measured as previously described by Cawthon [61] and aTL was measured using a protocol adapted from O’Callaghan and Fenech [62]. These methods calculate telomere length based on the ratio of telomere repeat copy number to a single copy reference gene 36B4 which encodes the acidic ribosomal phosphoprotein PO. The reference gene 36B4 is not expected to change expression (i.e. copy number) as a function of any of the independent variables being measured. Therefore, the reference gene provides a control level of gene expression whereby a ratio <1 (or >1) indicates the telomere copy number was higher (or lower) than the reference gene. Standard curves for each gene were created using a 10-fold serial dilution of known quantities of a synthesized 84 mer oligonucleotide telomere (TEL) standard containing 14 TTAGGG repeats and a synthesized 75 mer single copy reference gene (SCG) standard, 36B4.
To assist in the normalisation of DNA sample concentration, and reduce pipetting error, each participant sample DNA was prepared to a consistent concentration of 5 ng/μl. The SensiFAST SYBR No-Rox kit (Bioline) was used for qPCR according to the manufacturer’s instructions. A master mix was prepared with a final concentration of 1×SensiFAST SYBR No-ROX mix and 400 nM each of forward and reverse primers. The primers used were those previously described by O’Callaghan and Fenech [62] for both the telomere sequence and the 36B4 reference gene. The telomere primers used were: telomere forward primer (CGGTTTGTTTGGGTTTGGGTTTGGGTTTGGGTTTGGGTT), and telomere reverse primer (GGCTTGCCTTACCCTTACCCTTACCCTTACCCTTACCCT). Primers for the single copy reference gene amplicon (36B4) consisted of: 36B4 forward primer (CAGCAAGTGGGAAGGTGTAATCC) and 36B4 reverse primer (CCCATTCTATCATCAACGGGTACAA). In each sample both 36B4 and TEL genes were analysed in triplicate with two no template controls (NTC) included in each qPCR run. The Rotor-Gene Q (Qiagen), was used for qPCR analysis. Each run was carried out in 0.1 ml strip tubes with the 72 sample Rotor-Disc, using a final volume of 10μl (5.8μl of master mix and 4.2μl of participant DNA) to give a final concentration of 20 ng/μl of sample DNA. A 3-step cycle was used with cycling conditions of: 3 min at 95°C, followed by 40 cycles of 95°C for 5 sec, 60°C for 10 sec and 72°C 15 sec (with data acquisition), followed by a dissociation (melt) curve ramping from 72°C to 95°C. The same amplification and cycling parameters were carried out for both TEL and 36B4 genes. Triplicate samples all displayed a standard deviation of the Ct (cycle threshold) values of <1 Ct. Samples were inspected to ensure all participants’ values were within the linear range, resulting in two participants being identified who showed unusually low amplifications. DNA extraction and qPCR were repeated for these two samples, resulting in one participant being removed from further analysis due to poor amplification. All qPCR assays were performed by the same investigator.
Relative TL was determined by the ratio of telomere repeat copy number (T) to the single copy gene copy number (36B4) as described by Cawthon [61] and presented as the telomere length to single copy gene ratio (T/S ratio). Absolute telomere length was measured by determining the number of TTAGGG hexamer repeats as described by O’Callaghan and Fenech [62] and is reported in bases. Briefly, a ratio of telomere repeat to single copy gene (36B4) was obtained by first dividing the 36B4 reaction value by 2 (as there are two copies of this gene present in every cell). The telomere length in kilo base (kb) per reaction was then calculated by dividing the TEL reaction value obtained in the qPCR by the 36B4 (single gene reference). This was converted to length per telomere (kb) by dividing by 92 (there are 46 chromosomes with a telomere at each end and, therefore, 92 telomeres in total in the human genome). Telomere length is reported in bases by multiplying by 1000.
2.7Covariates
Data for eight pre-identified covariates were collected: age, sex, body mass index, smoking history, paternal age at birth, education, medical health history and stressful life events.
2.8Statistical analysis
Descriptive statistics are displayed as mean and standard deviation. Total lifetime MET hours and paternal age at birth were log transformed, and a reflect and square root transformation was applied to lifetime health eating category scores, to normalize the data. Pearson’s correlation was used to assess the relationship between absolute and relative salivary cell telomere length and age. Multiple linear regression was used to investigate the independent contributions of age, total lifetime MET-hours, lifetime food category scores, lifetime stressful events scores, paternal age at birth and sex on telomere length. Data were screened to ensure all assumptions for the use of multiple linear regression were met. Statistical analyses were performed using SPSS version 24.0 with an alpha level of p < 0.05.
3Results
3.1Salivary cell DNA quality and quantity
Considering the unique nature of the study design and population, it was deemed important to include details on the quality and quantity of the DNA extracted from saliva samples. The quality of the DNA was very good as assessed by agarose gel electrophoresis and spectrophotometry which showed no evidence of DNA degradation. The average 260/280 ratio was 2.0 (pure DNA will have a 260/280 ratio of 1.7–2.0 [62]). The average quantity of DNA, as assessed by spectrophotometry, was 42.7±23.7 ng/μl (range 5.8–95 ng/μl).
3.2Participant characteristics
Descriptive statistics were calculated and displayed as mean and standard deviation. Participant characteristics are presented in Table 1. Sixty-five percent (32 of 49) were ultra-runners, 18% (9 of 49) were ultra-cyclists and 16% (8 of 49) were a combination (ultra-runner, ultra-cyclist and/or ultra-triathlete). Sixty-three percent of participants were men. Men were older and had a higher BMI than women (50.8±10.1 years for men vs 45.2±6.7 years for women, p = 0.043 and 23.7±2.6 kg/m2 for men vs 21.9±1.7 kg/m2 for women, p = 0.008).
Table 1
Participant characteristics
| Ultra-endurance exercisers (n = 49) | |
| Absolute telomere length (in bases) | 1602±572 |
| Relative telomere length (T/S ratio*†) | 1.41±0.05 |
| Age (years) | 48.7±9.2 |
| Lifetime total MET hours | 133072±106911 |
| Lifetime food category scores | |
| Healthy category | 117±5.3 |
| Less healthy category | 23.9±2.1 |
| Vegetables and fruit | 63.9±4.5 |
| Lifetime stressful events scores | 9±3.5 |
| Father’s age at birth (years) | 28.5±7.4 |
| Education [n, (%)] | |
| ≤high school | 4 (8) |
| Some college, but no degree | 12 (24) |
| Associate or bachelor’s degree | 18 (37) |
| Postgraduate | 15 (31) |
| Smoke history [n, (%)] | |
| Current smoker | 1 (2) |
| Past smoker | 14 (29) |
| Never smoked | 34 (69) |
| Ethnicity [n, (%)] | |
| Caucasian | 46 (94) |
| Other | 3 (6) |
| Country [n, (%)] | |
| Australia | 29 (59) |
| Canada | 12 (25) |
| United States | 8 (16) |
Data presented as mean±standard deviation and n (%) for categorical variables. *ratio of telomere repeat copy number (T) to the single copy gene copy number (36B4). †Log transformed.
3.3Predictors of telomere length
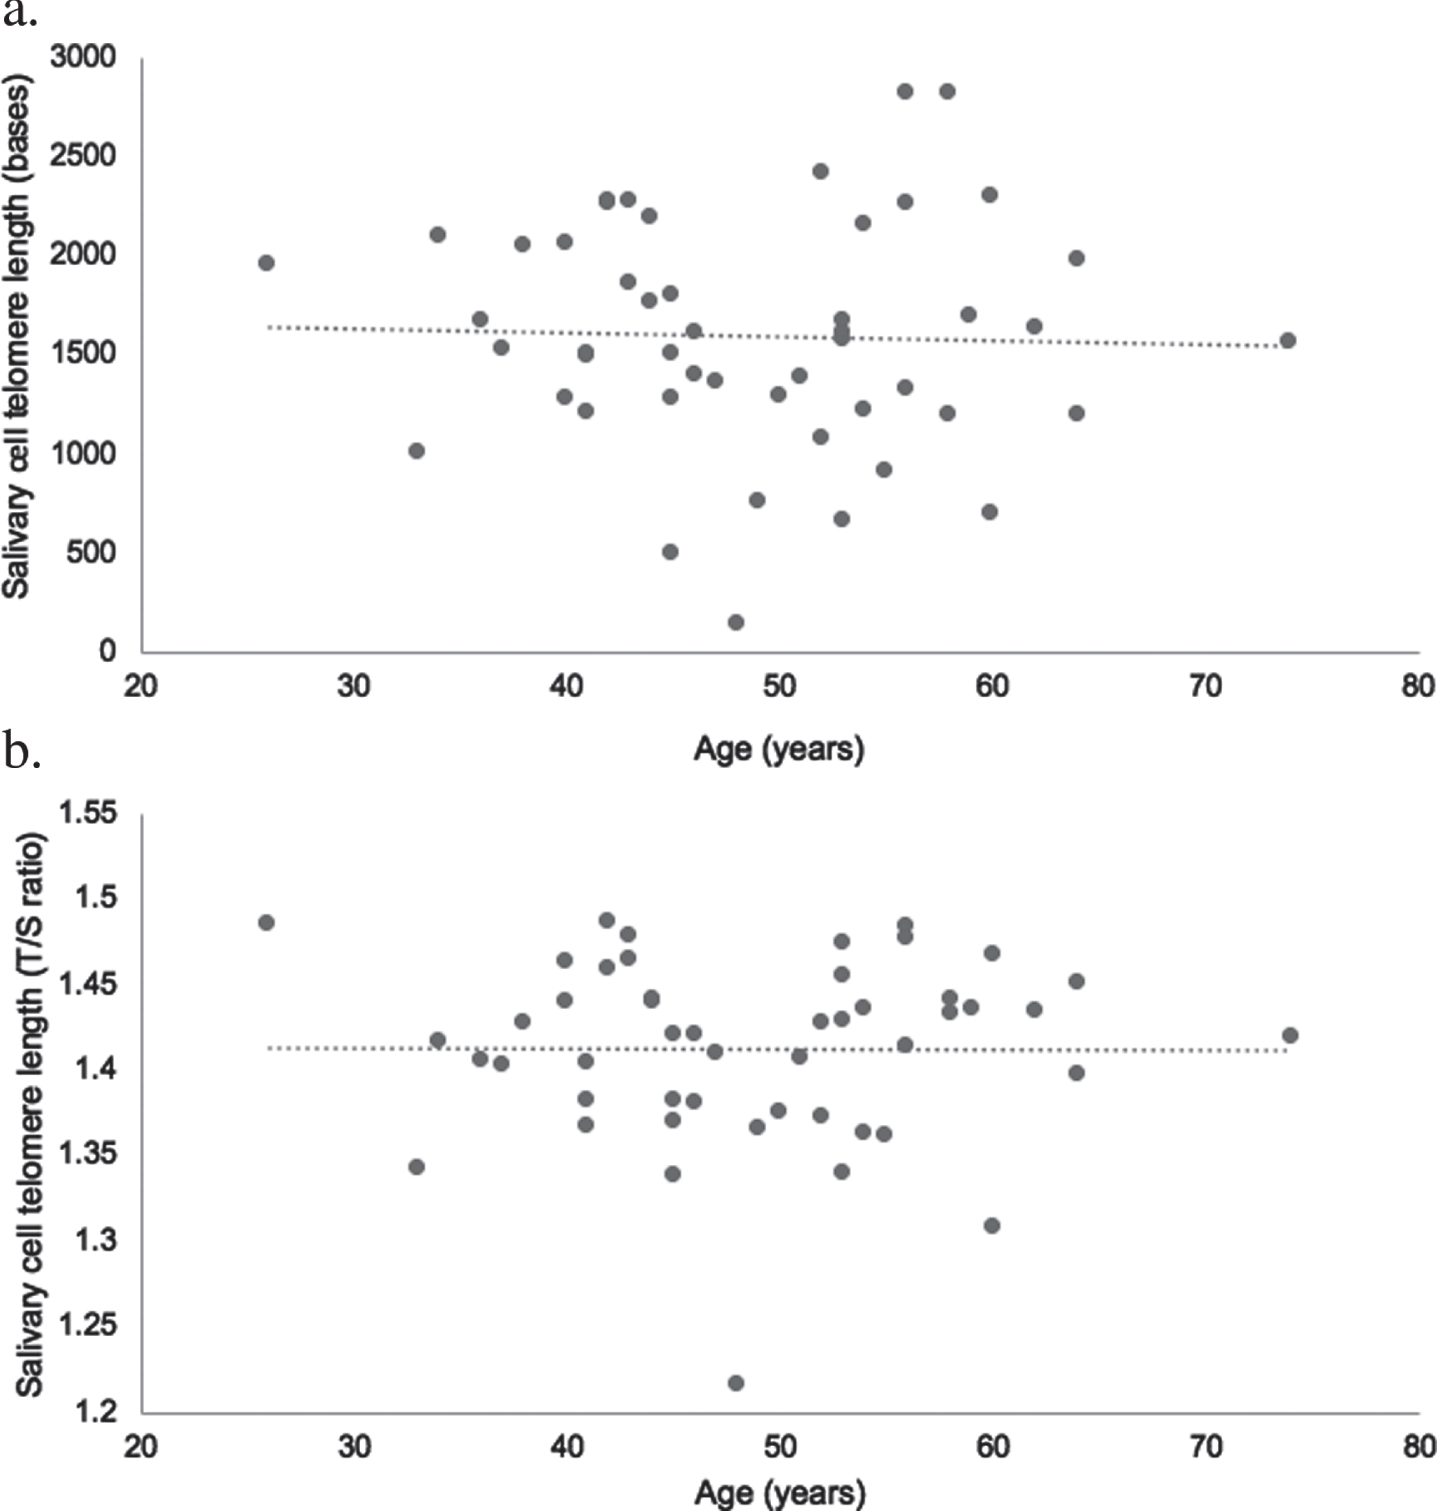
Results of the multiple linear regression are presented in Tables 2 and 3. None of the measured variables were statistically significant cross-sectional predictors of absolute telomere length (p > 0.05). Sex was a statistically significant cross-sectional predictor of relative telomere length (p < 0.05) with men having longer telomeres than women (1.42 + 0.04 for men vs 1.39 + 0.06 for women, p = 0.04). There was no statistically significant difference in absolute telomere length between men and women (1643 + 517 for men vs 1532 + 666 for women, p = 0.52). Age was not statistically correlated with relative or absolute telomere length for all participants (unadjusted raw data) (Fig. 1).
Table 2
Multiple regression summary statistics for absolute telomere length (n = 49)
| Variable | B | 95% [CI] | B | Partial r | t | p |
| Age | –12.16 | [–38.86, 14.54] | –0.232 | –0.170 | –0.932 | 0.359 |
| Lifetime total MET hours† | –0.899 | [–667.17, 665.37] | –0.001 | –0.001 | –0.003 | 0.998 |
| Lifetime food category scores | ||||||
| Healthy category‡ | 56.15 | [–334.67, 446.97] | 0.106 | 0.054 | 0.294 | 0.771 |
| Less healthy category | –16.28 | [–114.08, 81.51] | –0.073 | –0.063 | –0.341 | 0.736 |
| Vegetables and fruit | –2.50 | [–92.83, 87.83] | –0.021 | –0.011 | –0.057 | 0.955 |
| Lifetime stressful events scores | 45.68 | [–15.31, 106.67] | 0.315 | 0.274 | 1.532 | 0.136 |
| Paternal age at birth† | –928.98 | [–3443.43, 1585.47] | –0.148 | –0.139 | –0.756 | 0.456 |
| Sex§ | –301.63 | [–801.99, 198.73] | –0.272 | –0.223 | –1.233 | 0.228 |
Significance set at p < 0.05. †Log transformed. ‡Reflect and square root transformed. §Coding for categorical variables is male = 0; female = 1.
Table 3
Multiple regression summary statistics for relative telomere length† (n = 49)
| Variable | B | 95% [CI] | B | Partial r | T | p |
| Age | –0.002 | [–0.005, 0.000] | –0.414 | –0.319 | –1.813 | 0.08 |
| Lifetime total MET hours† | 0.020 | [–0.042, 0.082] | 0.129 | 0.124 | 0.675 | 0.505 |
| Lifetime food category scores | ||||||
| Healthy category‡ | 0.017 | [–0.019, 0.054] | 0.322 | 0.177 | 0.971 | 0.340 |
| Less healthy category | –0.004 | [–0.013, 0.005] | –0.170 | –0.158 | –0.861 | 0.396 |
| Vegetables and fruit | 0.002 | [–0.006, 0.010] | 0.168 | 0.091 | 0.495 | 0.625 |
| Lifetime stressful events scores | 0.005 | [–0.001, 0.011] | 0.345 | 0.321 | 1.825 | 0.078 |
| Paternal age at birth† | –0.123 | [–0.357, 0.110] | –0.194 | –0.197 | –1.080 | 0.289 |
| Sex§ | –0.066 | [–0.112, –0.019] | –0.585 | –0.473 | –2.888 | 0.007* |
*Indicates significant difference at p < 0.05. †Log transformed. ‡Reflect and square root transformed. §Coding for categorical variables is male = 0; female = 1.
Fig. 1
Scatter plot illustrating the raw uncontrolled association between age and absolute (a) and relative (b) salivary cell telomere length in ultra-endurance exercisers (n = 49; age range 26–74). Relative telomere length was log transformed.
4Discussion
This is the first study to investigate relationships of lifetime physical activity and diet with telomere length in current ultra-endurance exercisers. Participants for this study were drawn from a larger sample of ultra-endurance exercisers who provided detailed information on lifetime physical activity [4] and diet [55]. The ultra-endurance exercisers engaged in a variety of physical activities across the lifespan with total volumes (MET hours) that were, on average, higher than general populations [4]. In this group of ultra-endurance exercisers, whose exercise volumes varied considerably [4], there was no relationship between total lifetime physical activity and telomere length.
The lack of a relationship between food scores and telomere length was unexpected considering the evidence regarding the influence of diet, particularly vegetables and fruit, on telomere length [17, 36, 43, 44]. Similarly, the lack of associations with the less healthy category was not expected as foods that are highly processed, high in saturated fat and/or sugar, have been shown to be associated with shorter telomeres [33, 35, 42]. It has been suggested that certain foods (e.g. processed meat, saturated fat, high sugar foods), many of which are found in the less healthy category in the current study, are negatively associated with telomere length because they increase oxidative stress and inflammation [63]. Although speculative, it is possible that engagement in habitual physical activity, which may lower oxidative stress [64], could help minimize the negative influence of poor dietary choices on telomere attrition. However, the current study collected information on the frequency of eating and the total quantity of food or energy consumed is unknown and it is possible this may have affected the findings. Also, as this was the first study to use food categories developed from the LDQ to assess lifetime diet, it was not possible to compare the food category scores of the ultra-endurance exercisers in the current study to general populations.
A secondary finding from this study was the absence of a relationship between age and telomere length for both absolute and relative telomere length. This finding supports previous research with ultra-endurance runners where a negative correlation of telomere length with age was not observed [20, 27] and provides some evidence that participating in regular physical activity across the lifetime, that includes ultra-endurance exercise, may help protect against telomere shortening. The lack of association between age and telomere length is of interest considering participants ranged in age from 26–74 years. As expected, the older participants (≥50 years, n = 23) had accumulated significantly more lifetime hours of physical activity (that included ultra-endurance exercise) than the younger ultra-endurance exercisers (<50 years, n = 26). Studies have reported a positive relationship between habitual physical activity and telomere length [19, 65], particularly amongst older, active individuals [66–68]. It is possible that the accumulating lifetime physical activity of this group, in particular the older participants, had a benefit on telomere length. However, to our knowledge, there are no studies with older ultra-endurance exercisers to help explain the lack of association between age and telomere length and more research with this population is needed.
Possible mechanisms that may explain the lack of associations of lifetime physical activity and diet with telomere length within this group of current ultra-endurance exercisers are the roles of these two variables in promoting general health and wellbeing. Both physical activity and diet may influence levels of oxidative stress and inflammation which are two key underlying mechanisms linked to telomere attrition [63, 69]. Research shows health behaviours tend to cluster by which active individuals tend to eat healthier diets [70] and, therefore, it may be the cumulative effect of health behaviours that benefit telomere length rather than individual components [32, 71, 72]. As such, it is possible the lifetime habits of this group, including physical activity and diet, contributed to preserving telomere length. This study also included a measure of lifetime stress which is important to consider given the known association between psychological stress and telomere length [15, 73]. In the current study there was no correlation between lifetime stress and telomere length which may be due to the possible role of physical activity on minimising the impact of stress on telomere length. Regular physical activity may reduce the impact of psychological stress as observed in a study in which postmenopausal women with the healthiest behaviours (had the highest score related to sleeping, eating and exercise habits) did not experience the effect of major life stressors on accelerating telomere attrition [74]. Engaging in regular physical activity may explain the lack of relationship between lifetime psychological stress and telomere length in the group of ultra-endurance exercisers in this study. Furthermore, it is possible, as reported in previous studies with ultra-endurance exercisers, there is an upregulation of cellular components involved in telomere maintenance that helps protect against telomere attrition [28]. Although the lack of age-related decline in telomere length may suggest a protective effect of physical activity and diet on telomere length, factors such as small sample size, unmeasured covariates (i.e. genetic variances) and life period specific cofounders (e.g. health related issues, changes in lifestyle or socioeconomic status), need to be considered. The reason for a significant finding related to sex and relative, but not absolute, telomere length is unclear and may be due to a difference in the expression of the control gene between sexes. However, more research that includes both measures of telomere length, within the same population, is necessary.
To our knowledge this is the first study to report on the lifetime physical activity and diet of ultra-endurance exercisers in relation to telomere length. It is the first study to include a measure of diet when investigating telomere length in ultra-endurance exercisers. Detailed information on physical activity and diet were collected across several life periods which is important when investigating telomere length as changes typically take place over long periods of time (i.e. at least 1 year) and may be influenced by cumulative factors over a lifetime [75, 76]. This study is one of two studies that have measured salivary cell telomere length in ultra-endurance exercisers and provides new information on diet for this population. This is the first study to describe both relative and absolute telomere length within the same population of ultra-endurance exercisers, which allows for comparisons using both measures. Furthermore, the measurement of absolute telomere length in this study provides the substantial opportunity for a more direct comparison to other studies that have also measured absolute telomere length.
4.1Limitations
This study has five known potential limitations. Firstly, this study may have lower than optimal statistical power due to the sample size and this may, in part, explain the lack of associations with telomere length. Secondly, this study collected retrospective physical activity and diet data and relied on participants’ ability to recall information on habits from several decades ago. Thirdly, this study measured telomere length at one point in time and did not have repeated measures of telomere length at different time points across the lifespan. Therefore, there was no information on the rate of telomere attrition or telomere length at baseline. Fourthly, this study did not include a control group. However, it was not possible to obtain a comparison group for whom physical activity and diet were suitably controlled across the lifespan. Fifth, it was not possible to consider, and control for, all potential co-variates that could influence telomere length across the lifespan. It is possible there were unmeasured variables (i.e. genetic variances) that may have influenced the findings.
More research that assesses lifetime physical activity and diet in a larger sample of ultra-endurance exercisers would assist in explaining the role of these two variables across the lifespan on telomere length. Early life experiences can have a positive or negative effect on telomere length and future research investigating the diet of ultra-endurance exercisers and telomere length during different life stages is needed. This should include information on the type, intensity, duration and frequency of physical activity of ultra-endurance exercisers which would help explain how, and if, diet and physical activity interact in relationship to telomere length.
5Conclusions
This study adds to the limited amount of research investigating telomere length in ultra-endurance exercisers and provides the first information on diet and telomeres for this population. The primary results showed no relationship of lifetime physical activity or diet with telomere length. The secondary finding that showed an absence of telomere shortening with age is of interest and provides some evidence for a potential protective role of physical activity and/or diet across the lifetime on cellular aging. It is possible that engaging in various forms of physical activity throughout life, which includes ultra-endurance exercise, may help delay telomere shortening. It is also possible the lack of age-related telomere shortening is independently due to lifetime diet or due to an interactive effect between physical activity and diet. However, this process remains unclear and requires further investigation. As participation in ultra-endurance exercise continues to increase worldwide and the number of older individuals participating in this form of physical activity continues to grow, it is important to understand the impact this form of extreme exercise has on cellular aging and how diet may influence this process.
Acknowledgments
All authors assisted with study design. KB was responsible for data collection, data analysis and writing of the manuscript drafts. All authors provided input on data analysis and subsequent manuscript drafts. GL provided statistical guidance. All authors read and approved the final version of the manuscript.
Funding information
Karen Birkenhead received a Fee Offset Scholarship and a Stipend Scholarship from the Australian Government Research Training Program during this project.
Conflict of interest
The authors have no conflict of interest to report.
References
[1] | Knechtle B , Ultramarathon runners: Nature or nurture? Int J Sports Physiol Perform. (2012) ;7: (4):310–2. |
[2] | Hoffman MD , Fogard K . Demographic characteristics of 161-km ultramarathon runners. Res Sports Med. (2012) ;20: (1):59–69. |
[3] | Hoffman MD , Krishnan E . Health and exercise-related medical issues among 1,212 ultramarathon runners: Baseline findings from the ultrarunners longitudinal tracking (ULTRA) study. PLoS One. (2014) ;9: (1):e83867. |
[4] | Birkenhead K , Lovell G , Barr SI , Solomon C . Changes in physical activity across the lifetime of current ultra-endurance exercisers. J Phys Activity Res. (2018) ;3: (1):11–9. |
[5] | Cejka N , Rust CA , Lepers R , Onywera V , Rosemann T , Knechtle B . Participation and performance trends in 100-km ultra-marathons worldwide. J Sports Sci. (2014) ;32: (4):354–66. |
[6] | da Fonseca-Engelhardt K , Knechtle B , Rust CA , Knechtle P , Lepers R , Rosemann T . Participation and performance trends in ultra-endurance running races under extreme conditions - ‘Spartathlon’ versus ‘Badwater’, Extrem Physiol Med. (2013) ;2: (1):15. |
[7] | Kipling D . Telomeres, replicative senescence and human ageing, Maturitas. (2001) ;38: (1);25–37. |
[8] | Tzanetakou IP , Katsilambros NL , Benetos A , Mikhailidis DP , Perrea DN . “ Is obesity linked to aging?" Adipose tissue and the role of telomeres. Ageing Res Rev. (2012) ;11: (2):220–9. |
[9] | Blackburn EH . Structure and function of telomeres, Nature. (1991) ;350: (6319):569–73. |
[10] | Zhu Y , Liu X , Ding X , Wang F , Geng X . Telomere and its role in the aging pathways: telomere shortening, cell senescence and mitochondria dysfunction. Biogerontology. (2019) ;20: (1):1–16. |
[11] | Dankel SJ , Loenneke JP , Loprinzi PD . The impact of overweight/obesity duration and physical activity on telomere length: An application of the WATCH paradigm. Obes Res Clin Pract. (2017) ;11: (2):247–52. |
[12] | Latifovic L , Peacock SD , Massey TE , King WD . The influence of alcohol consumption, cigarette smoking, and physical activity on leukocyte telomere length, Cancer Epidemiol Biomarkers Prev. (2015) ;25: (2):374–80. |
[13] | Sjögren P , Fisher R , Kallings L , Svenson U , Roos G , Hellénius ML . Stand up for health—avoiding sedentary behaviour might lengthen your telomeres: secondary outcomes from a physical activity RCT in older people, Br J Sports Med. (2014) ;48: (19):1407–9. |
[14] | Shalev I , Entringer S , Wadhwa PD , Wolkowitz OM , Puterman E , Lin J , Epel ES . Stress and telomere biology: A lifespan perspective. Psychoneuroendocrinology. (2013) ;38: (9):1835–42. |
[15] | Epel ES . Psychological and metabolic stress: A recipe for accelerated cellular aging? Hormones. (2009) ;8: (1):7–22. |
[16] | Gong Y , Tian G , Xue H , Zhang X , Zhao Y , Cheng G . Higher adherence to the ‘vegetable-rich’ dietary pattern is related to longer telomere length in women. Clin Nutr. 2017. |
[17] | Crous-Bou M , Fung TT , Prescott J , Julin B , Du M , Sun Q , Rexrode KM , Hu FB , De Vivo I . Mediterranean diet and telomere length in Nurses’ Health Study: Population based cohort study. BMJ. 2014;349. |
[18] | Tucker LA . Physical activity and telomere length in U. S. men and women: An NHANES investigation. Prev Med. (2017) ;100: :145–51. |
[19] | Kim JH , Ko JH , Lee DC , Lim I , Bang H . Habitual physical exercise has beneficial effects on telomere length in postmenopausal women. Menopause. (2012) ;19: (10):1109–15. |
[20] | Denham J , Nelson CP , O’Brien BJ , Nankervis SA , Denniff M , Harvey JT , Marques FZ , Codd V , Zukowska-Szczechowska E , Samani NJ , Tomaszewski M , Charchar FJ . Longer leukocyte telomeres are associated with ultra-endurance exercise independent of cardiovascular risk factors, PLoS One. (2013) ;8: (7). |
[21] | Cherkas LF , Hunkin JL , Kato BS , Richards JB , Gardner JP , Surdulescu GL , Kimura M , Lu X , Spector TD , Aviv A . The association between physical activity in leisure time and leukocyte telomere length. Arch Intern Med. (2008) ;168: (2):154–158. |
[22] | Frenk S , Housely J . Gene expression hallmarks of cellular ageing. Biogerontology. (2018) ;19: :1–20. |
[23] | Aviv A . Telomeres and human aging: Facts and fibs, Sci Aging Knowledge Environ (2004) ;(51):43. |
[24] | Lopez-Otin C , Blasco MA , Partridge L , Serrano M , Kroemer G . The hallmarks of aging. Cell. (2013) ;153: (6):1194–217. |
[25] | Pereira MA , Fitzer Gerald SJ , Gregg EW , Joswiak ML , Ryan WJ , Suminski RR , Utter AC , Zmuda JM . A collection of physical activity questionnaires for health-related research. Med Sci Sports Exerc. (1997) ;29: (6 Suppl):S1–205. |
[26] | Ludlow AT , Ludlow LW , Roth SM . Do telomeres adapt to physiological stress? Exploring the effect of exercise on telomere length and telomere-related proteins, Bio Med Res Int (2013) ;2013: :1–15. |
[27] | Borghini A , Giardini G , Tonacci A , Mastorci F , Mercuri A , Sposta SM , Moretti S , Andreassi MG , Pratali L . Chronic and acute effects of endurance training on telomere length. Mutagenesis. (2015) ;30: (5):711–6. |
[28] | Laye MJ , Solomon TPJ , Karstoft K , Pedersen KK , Nielsen SD , Pedersen BK . Increased shelterin mRNA expression in peripheral blood mononuclear cells and skeletal muscle following an ultra-long-distance running event. J Appl Physiol. (2012) ;112: (5):773–81. |
[29] | Denham J , Lack of association between PBMC telomere length and endurance exercise, J Appl Biomed. (2016) ;15: (1):9–13. |
[30] | Denham J , O’Brien BJ , Prestes PR , Brown NJ , Charchar FJ . Increased expression of telomere-regulating genes in endurance athletes with long leukocyte telomeres. J Appl Physiol. (2016) ;120: (2):148–58. |
[31] | García-Calzón S , Moleres A , Martínez-González MA , Martínez JA , Zalba G , Marti A . Dietary total antioxidant capacity is associated with leukocyte telomere length in a children and adolescent population. Clin Nutr. (2015) ;34: (4):694–9. |
[32] | Shiels PG , McGlynn LM , MacIntyre A , Johnson PCD , da Batty GD , Burns H , Cavanagh J , Deans KA , Ford I , McConnachie A , McGinty A , McLean JS , Millar K , Sattar N , Tannahill C , Velupillai YN , Packard CJ . Accelerated telomere attrition is associated with relative household income, diet and inflammation in the pSoBid Cohort, PLoS One. (2011) ;6: (7) |
[33] | Song Y , You NY , Song Y , Kang MK , Hou L , Wallace R , Eaton CB , Tinker LF , Liu S . Intake of small-to-medium-chain saturated fatty acids is associated with peripheral leukocyte telomere length in postmenopausal women. J Nutr. (2013) ;143: (6):907–14. |
[34] | Tiainen AMK , Mannisto S , Blomstedt PA , Moltchanova E , Perala MM , Kaartinen NE , Kajantie E , Kananen L , Hovatta I , Eriksson JG . Leukocyte telomere length and its relation to food and nutrient intake in an elderly population. Eur J Clin Nutr. (2012) ;66: (12):1290–4. |
[35] | Nettleton JA , Diez-Roux A , Jenny NS , Fitzpatrick AL , Jacobs DR Jr . Dietary patterns, food groups, and telomere length in the multi-ethnic study of atherosclerosis (MESA), Am J Clin Nutr. (2008) ;88: (5):1405–12. |
[36] | Marcon F , Siniscalchi E , Crebelli R , Saieva C , Sera F , Fortini P , Simonelli V , Palli D . Diet-related telomere shortening and chromosome stability. Mutagenesis. (2012) (1);49–57. |
[37] | Puterman E , Lin J , Krauss J , Blackburn EH , Epel ES . Determinants of telomere attrition over 1 year in healthy older women: stress and health behaviors matter. Mol Psychiatry. 2014;1-7. |
[38] | Cassidy A , De Vivo I , Liu Y , Han J , Prescott J , Hunter DJ , Rimm EB . Associations between diet, lifestyle factors, and telomere length in women. Am J Clin Nutr. (2010) ;91: (5):1273–80. |
[39] | Tucker LA . Consumption of nuts and seeds and telomere length in 5,582 men and women of the national health and nutrition examination survey (NHANES), J Nutr Health Aging. (2017) ;21: (3):233–40. |
[40] | Lee JY , Shin C , Baik I . Longitudinal associations between micronutrient consumption and leukocyte telomere length. J Hum Nutr Diet. (2016) ;30: (2):236–243. |
[41] | Fretts AM , Howard BV , Siscovick DS , Best LG , Beresford SA , Mete M , Eilat-Adar S , Sotoodehnia N , Zhao J . Processed meat, but not unprocessed red meat, is inversely associated with leukocyte telomere length in the strong heart family study. J Nutr. (2016) ;146: (10):2013–8. |
[42] | Leung CW , Laraia BA , Needham BL , Rehkopf DH , Adler NE , Lin J , Blackburn EH , Epel ES . Soda and cell aging: Associations between sugar-sweetened beverage consumption and leukocyte telomere length in healthy adults from the national health and nutrition examination surveys. Am J Public Health. (2014) ;104: (12):2425–31. |
[43] | Lee JY , Jun NR , Yoon D , Shin C , Baik I . Association between dietary patterns in the remote past and telomere length. Eur J Clin Nutr. 2015;1-5. |
[44] | Gu Y , Honig LS , Schupf N , Lee JH , Luchsinger JA , Stern Y , Scarmeas N . Mediterranean diet and leukocyte telomere length in a multi-ethnic elderly population. Age. (2015) ;37: (2):24. |
[45] | Eisenberg DT . An evolutionary review of human telomere biology: The thrifty telomere hypothesis and notes on potential adaptive paternal effects. Am J Hum Biol. (2011) ;23: (2):149–67. |
[46] | Astuti Y , Wardhana A , Watkins J , Wulaningsih W , Network PR Cigarette smoking and telomere length: A systematic review of 84 studies and meta-analysis. Environ Res. (2017) ;158: ;480–9. |
[47] | Mundstock E , Zatti H , Louzada FM , Oliveira SG , Guma FT , Parisi MM , Rueda AB , Machado DG , Stein RT , Jones MH , Sarria EE , Barbe-Tuana FM , Mattiello R . Effects of physical activity in telomere length: Systematic review and meta-analysis. Ageing Res Rev. (2015) ;22: :72–80. |
[48] | Oliveira BS , Zunzunegui MV , Quinlan J , Fahmi H , Tu MT , Guerra RO . Systematic review of the association between chronic social stress and telomere length: A life course perspective. Ageing Res Rev. (2016) ;26: :37–52. |
[49] | Rafie N , Golpour Hamedani S , Barak F , Safavi SM , Miraghajani M . Dietary patterns. food groups and telomere length: A systematic review of current studies, Eur J Clin Nutr. (2017) ;71: (2):151–8. |
[50] | Wren ME , Shirtcliff EA , Drury SS . Not all biofluids are created equal: chewing over salivary diagnostics and the epigenome. Clin Ther. (2015) ;37: (3):529–39. |
[51] | Stout SA , Lin J , Hernandez N , Davis EP , Blackburn E , Carroll JE , Glynn LM . Validation of minimally-invasive sample collection methods for measurement of telomere length, Front Aging Neurosci. (2017) ;9: :397. |
[52] | Mitchell C , Hobcraft J , McLanahan SS , Siegeld SR , Berg A , Brooks-Gunn J , Garfinkel I , Notterman D , Social disadvantage, genetic sensitivity, and 864 children’s telomere length, Proc Natl Acad Sci U S A. (2014) ;111: (16):5944–9. |
[53] | Friedrich U , Griese EU , Schwab M , Fritz P , Thon KP , Klotz U . Telomere length in different tissues of elderly patients. Mech Ageing Dev. (2000) ;119: (3):89–99. |
[54] | Hansen TV , Simonsen MK , Nielsen FC , Hundrup YA . Collection of blood, saliva, and buccal cell samples in a pilot study on the Danish nurse cohort: Comparison of the response rate and quality of genomic DNA. Cancer Epidemiol Biomarkers Prev. (2007) ;16: (10):2072–6. |
[55] | Birkenhead KL , Barr SI , Lovell G , Solomon C . Changes in diet, and the relationship between diet and physical activity within and across the lifetime of current ultra-endurance exercisers. J Sports Med Phys Fitness. (2019) ;59: (5):798–807. |
[56] | Commonwealth of Australia. (2007). National statement on ethical conduct in human research 2007 (UpdatedMay2015). |
[57] | Hosking D , Danthiir V , Nettelbeck T , Wilson C . Assessing lifetime diet: Reproducibility of a self-administered, non-quantitative FFQ. Public Health Nutr. (2011) ;14: (5):801–8. |
[58] | Chasan-Taber L , Erickson JB , McBride JW , Nasca PC , Chasan-Taber S , Freedson PS . Reproducibility of a self-administered lifetime physical activity questionnaire among female college alumnae. Am J Epidemiol. (2002) ;155: (3):282–9. |
[59] | Rosmalen JG , Bos EH , de Jonge P . Validation of the long-term difficulties inventory (LDI) and the list of threatening experiences (LTE) as measures of stress in epidemiological population-based cohort studies. Psychol Med. (2012) ;42: (12):2599–608. |
[60] | Ainsworth BE , Haskell WL , Herrmann SD , Meckes N , Bassett DR Jr , Tudor-Locke C , Greer JL , Vezina J , Whitt-Glover MC , Leon AS . 2011 compendium of physical activities: A second update of codes and MET values. Med Sci Sports Exerc. (2011) ;43: (8):1575–81. |
[61] | Cawthon RM , Telomere measurement by quantitative PCR, Nucleic Acids Res. (2002) ;30: (10). |
[62] | O’Callaghan NJ , Fenech M . A quantitative PCR method for measuring absolute telomere length. Biol Proced Online. (2011) ;13: (3). |
[63] | Shivappa N , Wirth MD , Hurley TG , Hebert JR . Association between the dietary inflammatory index (DII) and telomere length and C-reactive protein from the national health and nutrition examination survey-1999-2002, Mol Nutr Food Res. (2017) ;61: (4). |
[64] | Arsenis NC , You T , Ogawa EF , Tinsley GM , Zuo L . Physical activity and telomere length: Impact of aging and potential mechanisms of action. Oncotarget. 2017. |
[65] | Sassenroth D , Meyer A , Salewsky B , Kroh M , Norman K , Steinhagen-Thiessen E , Demuth I . Sports and exercise at different ages and leukocyte telomere length in later life–Data from the Berlin aging study II (BASE-II), PLoS One. (2015) ;10: (12):e0142131. |
[66] | La Rocca TJ , Seals DR , Pierce GL . Leukocyte telomere length is preserved with aging in endurance exercise-trained adults and related to maximal aerobic capacity. Mech Ageing Dev. (2010) ;131: (2):165–7. |
[67] | Østhus IBØ , Sgura A , Berardinelli F , Alsnes IV , Brønstad E , Rehn T , Støbakk PK , Hatle H , Wisløff U , Nauman J . Telomere length and long-term endurance exercise: Does exercise training effect biological age? A pilot study. PLoS One. (2012) ;7: (12):e52769. |
[68] | Werner C , Fürster T , Widmann T , Pöss J , Roggia C , Hanhoun M , Scharhag J , Büchner N , Meyer T , Kindermann W , Haendeler J , Böhm M , Laufs U . Physical exercise prevents cellular senescence in circulating leukocytes and in the vessel wall, Circulation. (2009) ;120: (24):2438–47. |
[69] | Ludlow AT , Roth SM , Physical activity and telomere biology: Exploring the link with aging-related disease prevention. J Aging Res. 2011;2011. |
[70] | Glanz K , Basil M , Maibach E , Goldberg J , Snyder D . Why Americans eat what they do: Taste, nutrition, cost, convenience, and weight control concerns as influences on food consumption. J Am Diet Assoc. (1998) ;98: (10):1118–26. |
[71] | Mirabello L , Huang WY , Wong JYY , Chatterjee N , Reding D , Crawford ED , De Vivo I , Hayes RB , Savage SA . The association between leukocyte telomere length and cigarette smoking, dietary and physical variables, and risk of prostate cancer, Aging Cell. (2009) ;8: (4):405–13. |
[72] | Sun Q , Shi L , Prescott J , Chiuve SE , Hu FB , De Vivo I , Stampfer MJ , Franks PW , Manson JE , Rexrode KM . Healthy lifestyle and leukocyte telomere length in U. S. women, PLoS One. (2012) ;7: (5):e38374. |
[73] | Shalev I , Early life stress and telomere length: Investigating the connection and possible mechanisms:Acritical survey of the evidence base, research methodology and basic biology. Bioessays. (2012) ;34: (11):943–52. |
[74] | Puterman E , Lin J , Blackburn E , O’Donovan A , Adler N , and Epel E . The power of exercise: Buffering the effect of chronic stress on telomere length, PLoS One. 5: (5):2010. |
[75] | Puterman E , Epel E . An intricate dance: Life experience, multisystem resiliency, and rate of telomere decline throughout the lifespan. Soc Personal Psychol Compass. (2012) ;6: (11):807–25. |
[76] | Akkad A , Hastings R , Konje JC , Bell SC , Thurston H , Williams B . Telomere length in small-for-gestational-age babies. Br J Obstet Gynaecol. (2006) ;113: (3):318–23. |


