
The nutrition for healthy living study: A randomised clinical trial assessing the effect of protein sources on healthy ageing
Abstract
BACKGROUND:
Worldwide, populations are ageing with significant impact on health patterns. Studies have shown that low protein, high carbohydrate diets are associated with more favourable outcomes. Plant-based diets have also been shown to have a positive impact on cardiometabolic health, weight loss and prevention of all causes of mortality.
OBJECTIVE:
The aim of the current study is to assess the main and interactive effects of two macronutrient interventions in a 2×2 factorial dietary design to determine their effects on appetite and health outcomes in older individuals.
METHODS:
Individuals aged 65 to 75 with a BMI between 20 and 35 kg/m2 were recruited. Participants were provided with ad libitum access to one of four diets for four weeks, designed as a 2×2 factorial. Each dietary treatment provided 14% of energy as protein, which was either omnivorous or semi-vegetarian in origin. The remaining complement of macronutrient energy (80–82%) was either relatively high in fat (37–41% of energy) and low in carbohydrates (41–43%), or vice versa (28–29% fat with 53% carbohydrate). Study diets were provided via a meal delivery company. Self-completed questionnaires, biospecimen and clinical assessments were collected before and after intervention to assess cardio-metabolic, oral and gut health, body composition and physical performance.
RESULTS:
Trial status is currently ongoing (sample and data analyses).
CONCLUSIONS:
This study will help determine whether protein-source (plant vs animal) and fat to carbohydrate ratio have an impact on predictors of healthy ageing. These findings will also create a sound foundation on which to base nutritional interventions in older individuals to support healthy ageing.
1Introduction
Worldwide, populations are ageing with significant impact on health patterns [1–3]. In Australia, the number of individuals aged 65 years and over is rapidly increasing as a result of the ageing post-war baby-boom cohort and rising of life expectancy at age 65 years [4]. With this changing population, the occurrence of age-related chronic diseases such as stroke, heart attack, and diabetes is also rising [5]. Nutrition is an important and readily modifiable factor influencing health in older age. Adequate nutritional intake can reduce morbidity, improve quality of life and prevent mortality in older age [6]. In contrast, inadequate dietary intake can result in poor health outcomes such as poor cardio-metabolic health, limited mobility [6] and reduced mental health in older age [7]. Studies investigating the associations between dietary intake and health outcomes in older age are scarce, nevertheless, a significant number of dietary intervention studies involving older individuals can be found in the literature.
Recent studies conducted in mouse models have shown that the ratio (i.e. balance) of macronutrients is a key dietary parameter that strongly influences appetite and health outcomes such as lifespan, ageing, insulin and glucose metabolism, dyslipidaemia, fatty liver, bone mineral density, lymphocytes, reproductive potential, skin structure and microbiome [8–10]. In general, these studies showed that diets low in protein and high in carbohydrate were associated with more favourable outcomes, and that these diets were associated with optimal nutrient signaling pathways such as insulin/IGF1, mTOR and FGF-21 metabolites [11].
In humans, plant-based diets have been shown to be positively associated with cardiometabolic health [12], healthy BMI and reduced all-cause-mortality [13]. Plant-based diets are likely to be high in fibre, and lower in refined sugar and fat. These characteristics are likely to explain the lower energy consumption observed amongst vegetarians [14]. Furthermore, changes in markers such as FGF-21 [15], inflammatory indicators [16, 17] and microbiome profiles [18] are observed with changes in plant to animal ratio of the diet. These changes are important in linking diet composition and risk of disease with aging.
The aim of the current study is to assess the main and interactive effects of two macronutrient interventions in a 2×2 factorial dietary design; both the source of dietary protein (plant-based versus omnivorous, at fixed 14% of energy) and the ratio of carbohydrate to fat in the remaining energy complement will be tested to determine their effects on appetite, cardio-metabolic, inflammatory, oral health, physical performance and body composition outcomes in healthy subject between 65 and 75 years of age. We hypothesize that the consumption of a semi-vegetarian, high carbohydrate diet over a period of four weeks will improve overall health in individuals aged 65–75 years.
2Materials and methods
2.1Participants
2.1.1Eligibility
Male and female (post-menopausal) volunteers aged between 65 and 75 and with a body mass index (BMI) between 20 and 35 kg/m2 were recruited. Individuals diagnosed with diabetes mellitus (type 1 or insulin dependent), renal or liver disease, cancer or active neoplasms, hyperthyroidism (unless treated or under control), taking medications known to affect weight or energy expenditure, unintentional weight loss (>10% body weight) over the past 5 years, smokers, alcohol consumers (>3 drinks/day), vegetarians, food allergies and/or intolerances, and when changes in diet are contraindicated by treating doctor were not enrolled.
2.1.2Recruitment
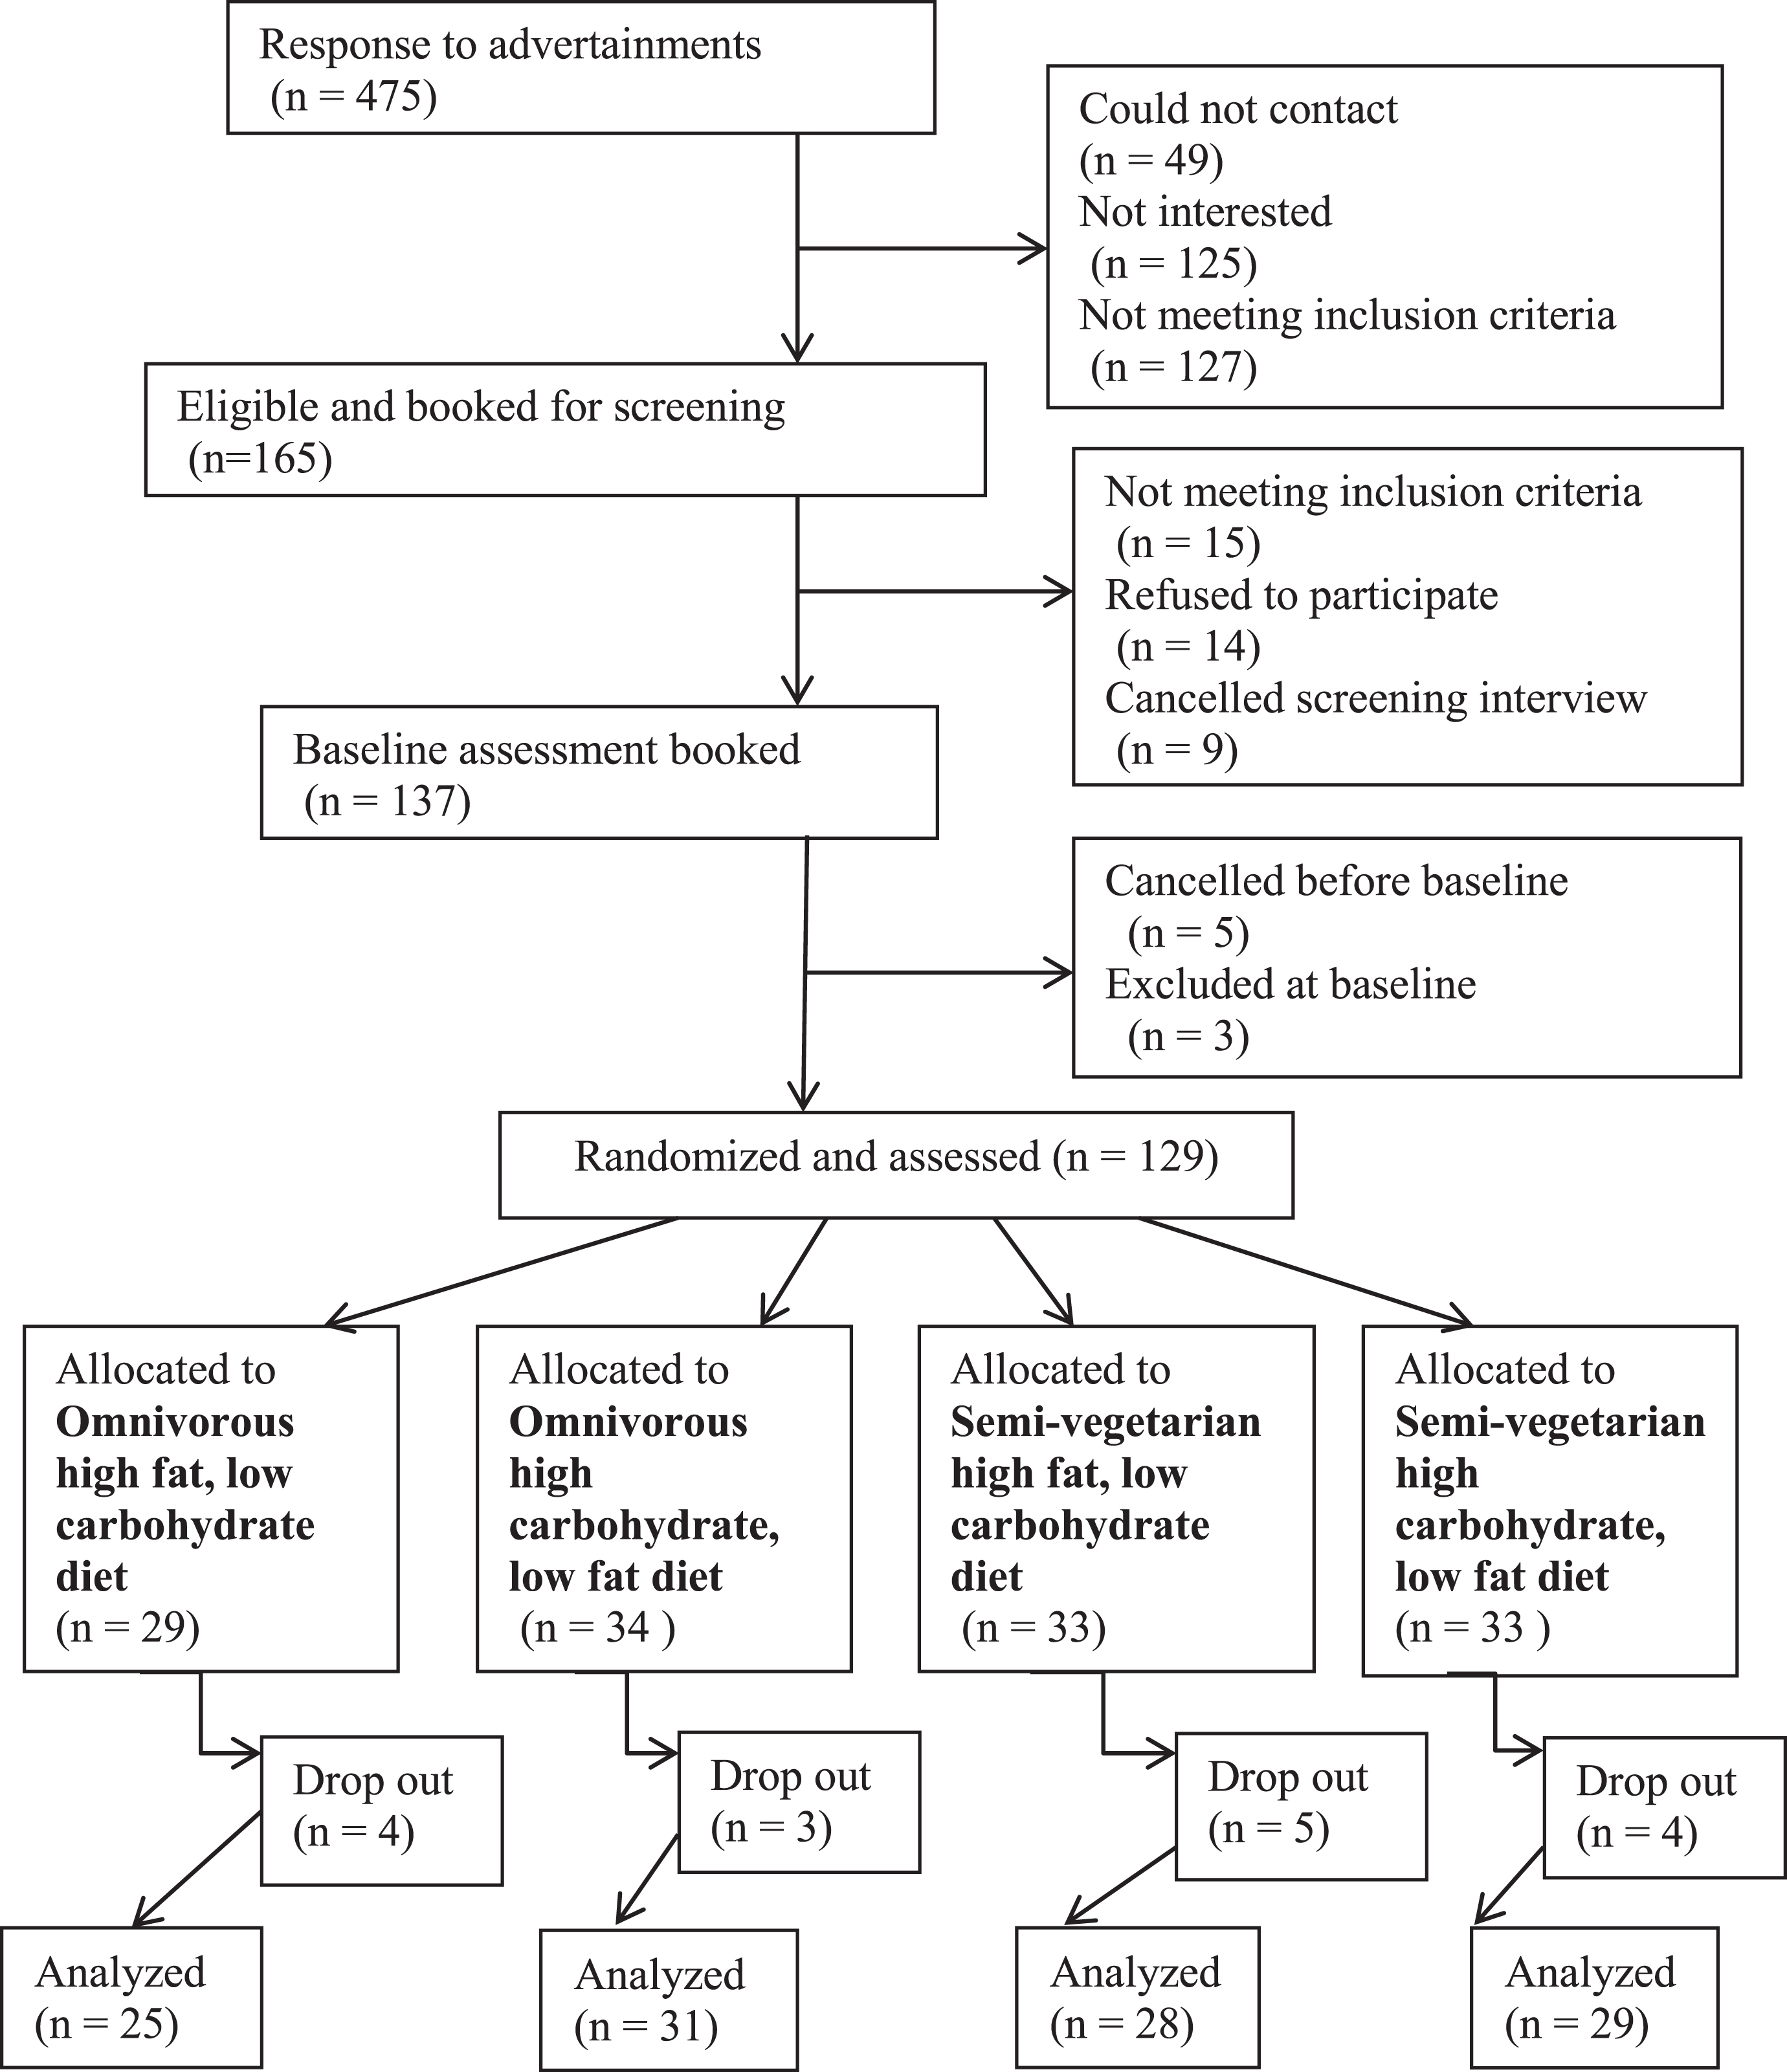
Volunteers were recruited through electronic and paper media advertisements including radio, TV and social media, and assessed for eligibility through a screening questionnaire (SQ) and screening visit at Clinical Research Facility at the Charles Perkins Centre. The SQ includes questions on medical history, medications, supplements, allergies and intolerances. Weight and height were measured and BMI calculated. Rolling recruitment and assessments occurred between April 2017 and June 2018. A maximum of 10 participants were started per week, with a break of three weeks to avoid scheduling visits during the Christmas holiday period. Five participants withdrew before commencement and three were excluded from study based on their smoking status and inability to comply with the study protocol, and baseline data was collected for 129 participants (Fig. 1). Participants details are presented in Table 3.
Fig.1
Consort flow diagram for recruitment, randomization and data collection.
2.1.3Minor changes to trial design
In February 2018, upper BMI cut-off was raised to 35 kg/m2 as we realized that previous cut-off was excluding a number of otherwise suitable participants. Ethics approval was obtained to include a one-year follow-up, and the protocol was updated.
2.1.4Ethics
The trial was conducted in accordance with the Declaration of Helsinki and all procedures were reviewed and approved by the Ethics Review Committee (Royal Prince Alfred Hospital Zone) of the Sydney Local Health District. The trial was registered with the Australian and New Zealand Clinical Trials Registry (ACTRN12616001606471) on the 21/11/2016. All participants signed a consent form.
2.2Design and dietary intervention
2.2.1Study design
The study was a single-blinded parallel randomized clinical trial. Random blocks of 8 were generated using the R package “blockrand” [19, 20] for males and females separately. Participants were randomized to one of four diets. Allocated diet was not revealed or discussed with participants during the intervention.
2.2.2Diets
The intervention consisted of four diets differing in source of protein, carbohydrate and fat content: omnivorous high fat, omnivorous high carbohydrate, semi-vegetarian high fat and semi-vegetarian high carbohydrate. Omnivorous diets contained 50% animal and 50% plant protein whereas semi-vegetarian diets contained 70% plant and 30% animal protein. The acceptable macronutrient distribution range (AMDR) cut-offs for Australia and New Zealand [21] were used to classify the diets as high or low in a particular macronutrient. Absolute macronutrient content (i.e. grams) of comparable omnivorous and semi-vegetarian diets were very closely matched. Information on total energy, macronutrient and amino acid content of the four-dietary arms are detailed in Table 1.
Table 1
Total energy, macronutrient and amino acid content per study diet
| Omnivorous1 | Semi-vegetarian2 | |||
| High fat, low carbohydrate diet | High carbohydrate, low fat diet | High fat, low carbohydrate diet | High carbohydrate, low fat diet | |
| Energy and nutrients | ||||
| Total energy (kJ)3 | 8837 | 8750 | 8886 | 8794 |
| Carbohydrate, grams (% E) | 214 (41) | 271 (53) | 226 (43) | 276 (53) |
| Total fat, grams (% E) | 97 (41) | 69 (29) | 90 (37) | 66 (28) |
| Protein, grams (% E) | 71 (14) | 71 (14) | 73 (14) | 71 (14) |
| Lysine (g) | 2.2 | 2.1 | 2.3 | 2.1 |
| Alanine (g) | 1.7 | 1.7 | 1.8 | 1.7 |
| Glutamic acid (g) | 7.5 | 7.2 | 8.4 | 7.8 |
| Glycine (g) | 1.6 | 1.5 | 1.7 | 1.6 |
| Histidine (g) | 0.9 | 0.9 | 1.1 | 0.9 |
| Isoleucine (g) | 1.6 | 1.5 | 1.8 | 1.6 |
| Leucine (g) | 2.8 | 2.7 | 3.1 | 2.9 |
| Methionine (g) | 0.8 | 0.8 | 0.7 | 0.6 |
| Phenylalanine (g) | 1.7 | 1.6 | 2.1 | 1.9 |
| Proline (g) | 2.3 | 2.5 | 2.5 | 2.6 |
| Cystine (g) | 0.5 | 0.5 | 0.6 | 0.5 |
| Tryptophan (g) | 0.6 | 0.6 | 0.7 | 0.7 |
| Valine (g) | 1.9 | 1.8 | 2.2 | 2 |
| Tyrosine (g) | 1.2 | 1.2 | 1.3 | 1.2 |
| Arginine (g) | 2.5 | 2.1 | 2.9 | 2.4 |
| Threonine (g) | 1.4 | 1.3 | 1.6 | 1.4 |
| Serine (g) | 1.8 | 1.7 | 2.2 | 2 |
| Aspartic acid (g) | 3.4 | 3.4 | 4.5 | 4.2 |
| Fibre (g) | 38 | 43 | 47 | 50 |
kJ, kilojoules; g, grams; % E, percentage contribution to energy; LC N3, long chain omega 3 fatty acids; tsp, teaspoon. 1Omnivorous diets contained 50% animal and 50% plant protein. 2Semi-vegetarian diets contained 70% plant and 30% animal protein. 3With the contribution of dietary fibre to energy.
Participants were provided with ad libitum access to their allocated diet over a four-week period and asked to consume only study foods. Study diets were provided via a meal delivery company. A seven-day menu cycle containing breakfast, snacks, fruit, lunch and dinner was adopted. The number of serves of core food groups per study diet is presented in Table 2.
Table 2
Number of serves of core food groups per study diet
| Omnivorous | Semi-vegetarian | |||
| Food group | High fat, low carbohydrate diet | High carbohydrate, low fat diet | High fat, low carbohydrate diet | High carbohydrate, low fat diet |
| Grains | 6.3 | 7 | 5.6 | 6.5 |
| Wholegrains | 3.6 | 3.7 | 3.2 | 3.3 |
| Fruit | 1.6 | 3 | 1.6 | 3 |
| Vegetables | 6.7 | 7.1 | 9.1 | 9.1 |
| Legume | 0.1 | 0.1 | 2.1 | 1.6 |
| Dairy | 1.3 | 1.3 | 1.6 | 1.6 |
| Milk | 0.1 | 0.1 | 0.1 | 0.1 |
| Cheese | 0.2 | 0.2 | 0.1 | 0.2 |
| Yoghurt | 1 | 1 | 1 | 1 |
| Milk alternatives | 0 | 0 | 0.4 | 0.4 |
| Protein foods | 2 | 1.2 | 3.3 | 2.2 |
| Red meats | 0.2 | 0.2 | 0 | 0 |
| Poultry | 0.2 | 0.2 | 0 | 0 |
| Eggs | 0.2 | 0.2 | 0.2 | 0.2 |
| Seafood high LC N-3 | 0.1 | 0.1 | 0.1 | 0.1 |
| Nuts/seeds | 1.3 | 0.5 | 1.4 | 0.6 |
| Legumes protein | 0.1 | 0.1 | 1.3 | 1 |
| Soy products | 0 | 0 | 0.3 | 0.3 |
| Oil equivalents (tsp) | 15.2 | 10.1 | 15.7 | 11.2 |
LC N-3, long chain omega-3 fatty acids; tsp, teaspoon.
Table 3
Participants characteristics
| % (n) | |
| Age (years), median (IQR) | 69 (4.0) |
| SI weight(kg), median (IQR) | 74.8 (15.6) |
| BL weight(kg), median (IQR) | 73.1 (14.9) |
| BMI (kg/m2), median (IQR) | 27.4 (4.5) |
| PASE, median (IQR) | 130 (66.4) |
| Education level (n = 111) | |
| Bachelor’s degree or higher | 39 (44) |
| Trade/apprenticeship/certificate/diploma | 34 (38) |
| High school or below | 26 (29) |
| Source of income (n = 104) | |
| Age pension only | 19 (20) |
| Other1 | 81 (84) |
| Marital status (n = 112) | |
| Married/living with a partner/de facto | 50 (57) |
| Widowed/divorced/separated/never married | 49 (55) |
| Housing arrangements (n = 110) | |
| Outright owner | 72 (81) |
| Other2 | 26 (29) |
| Country of birth (n = 111) | |
| Australia/New Zealand | 58 (65) |
| Other3 | 41 (46) |
| Smoking status (n = 112) | |
| Ex-smokers | 39 (44) |
| Never smoked | 60 (68) |
| SRH (n = 109) | |
| Excellent/good | 81 (91) |
| Fair/poor/very poor | 16 (16) |
IQR, interquartile range; SI, screening interview; BL, baseline; BMI, body mass index; PASE, Physical Activity Scale for the Elderly. 1Repatriation pension/veteran’s pension, superannuation or other private income, own business/farm/partnership, wage or salary, other or any source of income combination. 2Paying off home, leasing, purchasing (or other financial plan) in a retirement village, paying rent or board to a private landlord, paying rent to the government for public housing, living rent or board free, other. 3Austria, China (Republic), Czech Republic, England + United Kingdom undefined, Germany, Hungary, Iraq, Ireland undefined, Israel, Palestine, Italy, Japan, Lebanon, Malaysia, Malta, Peru, Portugal, Singapore, South Africa (Republic), Uruguay, United States of America + America, undefined, Union of Soviet Socialist Republics (USSR) Former undefined, Yugoslavia.
2.2.3Study compliance
Dietary indiscretions (dietary intake derived from non-study foods) over four weeks were used as an adherence measure. All participants were allowed consumption of unlimited amounts of water, tea and coffee as well as herbs, spices and small amounts of milk (of any type) in their tea/coffee.
2.2.4Dietary intake
Habitual dietary intake was determined through collection of a seven-day weighed food record (7dWFR) as baseline intake prior to commencement of the study intervention. Participants were required to weigh and record their dietary intake for seven consecutive days giving as much detail about food consumed as possible. This included brands, preparation technique, leftovers (bones, skin, core), recipes and food consumed outside of home. An electronic scale (Ikea ORDNING Scale) was provided along with photographic and written instructions, and a weighed food record booklet. The study coordinator demonstrated the procedure to participants at the screening interview. The 7dWFR was adapted from Henderson, Gregory [22].
Similarly, during the 4-week study intervention, participants were asked to weigh and record their food intake daily in a study food diary which contained a list of all meals and snacks (i.e. specific diet menu) supplied by the study.
2.2.5Diet data handling
Individual dietary intakes (habitual and during study) were converted into nutrient intakes using FoodWorks 8 Professional for Windows (Xyris Software (Australia) Pty Ltd) with the Australian Food, Supplement and Nutrient Database 2013 (AUSNUT 2013) [23]. Data from the United States Department of Agriculture, National Nutrient Database for Standard Reference, release 27 [24] were used to estimate study diets amino acid content, as such data are not available in Australia. All study foods were matched to the nearest food in the US nutrient database, ensuring total protein content was matched so that scaling was not necessary as it has been previously described [25].
2.2.6Self-reported questionnaires
Information on socio-demographics, tobacco and alcohol consumption [26] were collected via self-completed questionnaire prior to baseline assessment. Oral health literacy [27], physical activity [28], depression [29, 30], health [31] and activities of daily living [32] information were obtained through self-completed questionnaire prior to and after dietary intervention.
2.2.7Physical assessment
Grip strength, walking speed and repeated chair stands were assessed on baseline and final testing days. Handgrip strength was assessed using a Jamar dynamometer (Promedics, Blackburn, UK). Grip strength (kg) of the dominant hand (best of two trials) will be used to assess participants’ upper body muscle strength. Walking speed was measured on a six-metre course at self-selected usual pace [2]. Time to successfully complete five chair stands was also assessed using a chair without armrests and a seat height of 40 cm.
2.2.8Body composition
Body composition was assessed using air-displacement plethysmography (BodPod) (COSMED USA, Concord, CA, USA). Participants were fasted overnight before testing. Height was measured using a wall mounted stadiometer and body weight was measured to the nearest 0.01 kg using the BodPod system electronic scale [33]. Each subject was tested in tight-fitted clothes and Lycra® swim cap to minimize potential error due to isothermal air trapped in clothing and hair. Thoracic gas volume (TGV) was measured in all subjects and BodPod conditions (i.e. BOD PODBH and BOD PODFH) according to the procedures described in the manual, while percent fat was determined by the Siri equation [34].
2.2.9Oral health
A standardized questionnaire on self-performed oral hygiene, dentist visiting behaviour and oral health related quality of life as adopted from National Survey in Adult Oral Health (2004-06) was used at baseline and final clinic assessment [35, 36].
An oral health clinic examination was performed at baseline and final testing. These examinations included probing pocket depth, recession and bleeding on probing via Florida Probe (Florida Probe, Florida Probe Corp, FL). Bacterial deposits on the tooth surfaces were quantified using the Silness and Loe Plaque Index [37], which are standard procedures in dental practice for evaluating dental hygiene. The supra- and subgingival bacteria were sampled using a sterile and blunt dental instrument. Unstimulated saliva was collected for 3 minutes. The gingival crevicular fluid was also collected and assessed with a Periotron 8000 (Periotron, Oraflow, NY). The oral health examination will provide information on periodontal status, gingival inflammation, bacterial plaque and bacterial composition of the plaque.
2.2.10Palatability and appetite questionnaires
Participants were provided with visual analogue scales to test for palatability of the study foods and appetite during dietary intervention. These questionnaires were completed weekly on days 4, 11, 18 and 25 of the four-week intervention period. The visual analogue scale questionnaires ask subjects to assess subjective palatability of food and appetite by reference to a 10 cm horizontal line [38].
2.2.11Medication
All participants were asked to provide a list of prescription and nonprescription medications that they had used daily (or almost daily) at their screening interview. Medication lists were updated at baseline and final assessment.
2.2.12Weekly calls
Participants were called on days 3, 10, 17 and 24 of the four-week intervention period. The purpose of the call was to: 1) remind participants to complete palatability and appetite questionnaires on the following day, 2) ask about the diet and how they were managing, 3) ask if any additional food (non-study food) had been consumed.
2.3Biospecimen
2.3.1Stool
Stool samples were collected within 48 hours prior to baseline and final clinic assessment. Participants were provided with a thermal bag (Thermabag, St Peters, NSW, Australia), a small icepack, as well as written instructions on sample collection, storage and transportation. Participants were asked to record the time of the collection and to place the sample in the freezer immediately after collection. Participants were requested to minimize the time out of the freezer to less than 2 hours when delivering to the clinic on assessment day. Once received, samples were stored in –80°C freezers. Stool samples will be used for measurement of the gut microbiome and short chain fatty acids.
2.3.2Blood
Fasting blood samples were collected at baseline and final assessments. Blood samples were collected into 10 mL EDTA (BD Vacutainer K2E ref 367,525; Becton Dickinson, USA) for plasma and 8.5 mL SSTII advance (BD Vacutainer ref367,958; Becton Dickinson, USA) for serum, centrifuged immediately (4500 rpm, 15 mins at 4°C), pipetted into a cryogenic (CryoPure, Sarstedt AG & Co; ref 72,380; Nümbrecht, Germany) labelled tube and stored at –80°C until analysis. Serum and plasma samples will be used for measurement of indicators of cardiometabolic health, appetite and inflammation.
2.3.3Urine
24-h urine collections were completed prior to baseline and final assessments. Participants were provided with a 4 L plastic container to collect the 24-h urine sample, as well as detailed written instructions on how to collect the sample. The 24-h urine was voided into the container without omission. Participants were instructed to store samples at 4°C following each collection. In the study center, the urine was mixed, weighed and volume measured before aliquots were sampled. Urinary samples were then stored at –80°C in the study center until analysis. 24-h urine collections will be used to measure urinary urea as an indicator of protein intakes.
2.3.4Gingival crevicular fluid (GCF)
Gingival crevicular fluid was sampled from two dental surfaces with the deepest probing pocket depth using sterile paper strips (Periopaper, Oraflow, NY). GCF is a serum exudate that carries all key molecular (complement components and antibodies) and cellular (neutrophils and plasma cells) components of the immune response of the periodontal tissues [39].
2.3.5Unstimulated saliva
Unstimulated saliva was collected at baseline and final assessments by having the participants spit into empty biospecimen containers for a total of three minutes. Saliva was then pipetted into 1.6 ml cryotubes and stored immediately into –80°C freezers. Participants were asked not to eat or drink for one hour prior to the assessments.
2.3.6Oral plaque
Supra and sub-gingival oral plaque was collected from the two tooth surface sites with deepest periodontal pockets, during baseline and final assessment. The plaque was collected with use of a blunt disposable dental instrument and paper points. The plaque was wiped onto paper points and stored in 1.6 mL cryotubes, which were stored in –80°C freezers. Participants were asked not to brush their teeth prior to the assessment, and were provided with a toothbrush post-assessment.
3Discussion
The Nutrition for Healthy Living study has been designed to assess the effect of protein source, as well as energy from carbohydrates and fats, on health outcomes in a healthy population of older adults. This paper summarizes the study design, recruitment, sample collection and processing protocols of the study. To our knowledge, this is the first study to comprehensively test the effect of protein source and single macronutrients, as well as their interactions, on health outcomes in older individuals by providing participants with all of their meals.
Individuals aged 65 to 75 (i.e. in peri-retirement age) are often more interested in partaking in intervention studies aiming to improve health than people of younger age groups, and tend to be more available [40, 41].This is particularly useful as age and nutrition are two of the main risk factors for several chronic diseases such as diabetes, heart disease and stroke [42, 43].
4Conclusion
This study will help determine whether protein-source (plant vs animal) and fat to carbohydrate ratio have an impact on predictors of healthy ageing. These findings will also create a sound foundation on which to base nutritional interventions in older individuals to support healthy ageing.
Author contributions
RR and AG designed data collection, performed recruitment, individual patient consults and coordinated the study. RR cleaned data and prepared manuscript. KR performed oral health assessment. SS is the guarantor for the study. All authors reviewed manuscript drafts and approved the final version.
Acknowledgments
The authors would like to thank all the participants for their time and support. We would also like to acknowledge Jian Tan, Wennie Dai, Alexandra Angelatos, Tamara Pulpitel, Shahrukh Khan and Rebecca Raeside for their assistance in data collection and sample processing. This research was funded by a generous philanthropic donation from Emeritus Professor George Palmer, and RR was supported by a Charles Perkins Centre Early Career Fellowship from Ms Jennie Mackenzie.
References
[1] | (WHO) WHO. Heath topics - Ageing 2014 [Available from: http://www.who.int/topics/ageing/en/. |
[2] | Orwoll E , Blank JB , Barrett-Connor E , Cauley J , Cummings S , Ensrud K , et al. Design and baseline characteristics of the osteoporotic fractures in men (MrOS) study—a large observational study of the determinants of fracture in older men. Contemporary Clinical Trials. (2005) ;26: (5):569–85. |
[3] | Wright N , Wilson L , Smith M , Duncan B , McHugh P . The BROAD study: A randomised controlled trial using a whole food plant-based diet in the community for obesity, ischaemic heart disease or diabetes. Nutrition & Diabetes. (2017) ;7: :e256. |
[4] | Australian Bureau of Statistics. Who are Australia’s older people? Reflecting a nation: Stories from the 2011 census 2012 [Available from: http://www.abs.gov.au/ausstats/[email protected]/lookup/2071.0main+features752012-2013. |
[5] | Kirkland JL . Translating advances from the basic biology of aging into clinical application. Experimental Gerontology. (2013) ;48: (1):1–5. |
[6] | Houston DK , Ding J , Nicklas BJ , Harris TB , Lee JS , Nevitt MC , et al. Overweight and Obesity Over the Adult Life Course and Incident Mobility Limitation in Older Adults The Health, Aging and Body Composition Study. Am J Epidemiol. (2009) :kwp007. |
[7] | Beydoun MA , Beydoun H , Wang Y . Obesity and central obesity as risk factors for incident dementia and its subtypes: A systematic review and meta-analysis. Obes Rev. (2008) ;9: (3):204–18. |
[8] | Hew J , Solon-Biet SM , McMahon AC , Ruohonen K , Raubenheimer D , Ballard JW , et al. The Effects of Dietary Macronutrient Balance on Skin Structure in Aging Male and Female Mice. PLoS One. (2016) ;11: (11):e0166175. |
[9] | Solon-Biet SM , McMahon AC , Ballard JW , Ruohonen K , Wu LE , Cogger VC , et al. The ratio of macronutrients, not caloric intake, dictates cardiometabolic health, aging, and longevity in ad libitum-fed mice. Cell Metab. (2014) ;19: (3):418–30. |
[10] | Holmes AJ , Chew YV , Colakoglu F , Cliff JB , Klaassens E , Read MN , et al. Diet-Microbiome Interactions in Health Are Controlled by Intestinal Nitrogen Source Constraints. Cell Metab. (2017) ;25: (1):140–51. |
[11] | Solon-Biet SM , Mitchell SJ , de Cabo R , Raubenheimer D , Le Couteur DG , Simpson SJ . Macronutrients and caloric intake in health and longevity. The Journal of Endocrinology. (2015) ;226: (1):R17–28. |
[12] | McMacken M , Shah S . A plant-based diet for the prevention and treatment of type 2 diabetes. Journal of Geriatric Cardiology: JGC. (2017) ;14: (5):342–54. |
[13] | Kim H , Caulfield LE , Rebholz CM . Healthy Plant-Based Diets Are Associated with Lower Risk of All-Cause Mortality in US Adults. The Journal of Nutrition. (2018) ;148: (4):624–31. |
[14] | Bradbury KE , Tong TYN , Key TJ . Dietary Intake of High-Protein Foods and Other Major Foods in Meat-Eaters, Poultry-Eaters, Fish-Eaters, Vegetarians, and Vegans in UK Biobank. Nutrients. (2017) ;9: (12):1317. |
[15] | Schmidt JA , Rinaldi S , Ferrari P , Carayol M , Achaintre D , Scalbert A , et al. Metabolic profiles of male meat eaters, fish eaters, vegetarians, and vegans from the EPIC-Oxford cohort. Am J Clin Nutr. (2015) ;102: (6):1518–26. |
[16] | Turner-McGrievy GM , Wirth MD , Shivappa N , Wingard EE , Fayad R , Wilcox S , et al. Randomization to plant-based dietary approaches leads to larger short-term improvements in Dietary Inflammatory Index scores and macronutrient intake compared with diets that contain meat. Nutrition Research. (2015) ;35: (2):97–106. |
[17] | Watzl B . Anti-inflammatory Effects of Plant-based Foods and of their Constituents. International Journal for Vitamin and Nutrition Research. (2008) ;78: (6):293–8. |
[18] | David LA , Maurice CF , Carmody RN , Gootenberg DB , Button JE , Wolfe BE , et al. Diet rapidly and reproducibly alters the human gut microbiome. Nature. (2014) ;505: (7484):559–63. |
[19] | Snow G . blockrand: Randomization for block random clinical trials. R package version 1.3 ed2013. |
[20] | Team RC. R: A language and environment for statistical computing. R Foundation for Statistical Computing. Vienna, Austria (2014) . |
[21] | National Health and Medical Research Council and New Zealand Ministry of Health. Nutrient Reference Values for Australia and New Zealand 2006 [Available from: https://www.nrv.gov.au/chronic-disease/macronutrient-balance. |
[22] | Henderson L GJ , Swan G , Britain G , Britain G . National Diet and Nutrition Survey: Adults Aged 19 to 64 Years. (2000) . |
[23] | Zealand FSAN. AUSNUT 2013, Australian Food, Supplement and Nutrient Database for estimation of population nutrient intakes. 2013 [Available from: http://www.foodstandards.gov.au/science/monitoringnutrients/ausnut/pages/about.aspx. |
[24] | U.S. Department of Agriculture ARSU, National Nutrient Database for Standard Reference R. National Nutrient Database for Standard Reference, Release 27. (2014) |
[25] | Schmidt JA , Rinaldi S , Scalbert A , Ferrari P , Achaintre D , Gunter MJ , et al. Plasma concentrations and intakes of amino acids in male meat-eaters, fish-eaters, vegetarians and vegans: A cross-sectional analysis in the EPIC-Oxford cohort. European Journal of Clinical Nutrition. (2016) ;70: (3):306–12. |
[26] | Ewing JA . Detecting alcoholism. The CAGE questionnaire. JAMA. (1984) ;252: (14):1905–7. |
[27] | Sistani M , Yazdani R , Virtanen J , Pakdaman A , Murtomaa H . Oral health literacy and information sources among adults in Tehran, Iran. Community Dent Health. (2013) ;30: (3):178–82. |
[28] | Washburn RA , Smith KW , Jette AM , Janney CA . The Physical Activity Scale for the Elderly (PASE): Development and evaluation. J Clin Epidemiol. (1993) ;46: (2):153–62. |
[29] | Sheikh JL , JA Y . Geriatric Depression Scale (GDS): Recent evidence and development of a shorter version. New York: The Hawthorn Press Inc; (1986) . |
[30] | Arthur A , Jagger C , Lindesay J , Graham C , Clarke M . Using an annual over-75 health check to screen for depression: Validation of the short Geriatric Depression Scale (GDS15) within general practice. Int J Geriatr Psychiatry. (1999) ;14: (6):431–9. |
[31] | Ware J Jr , Kosinski M , Keller SD . A 12-Item Short-Form Health Survey: Construction of scales and preliminary tests of reliability and validity. Med Care. (1996) ;34: (3):220–33. |
[32] | Katz S , Downs TD , Cash HR , Grotz RC . Progress in development of the index of ADL. Gerontologist. (1970) ;10: (1):20–30. |
[33] | McCrory MA , Gomez TD , Bernauer EM , Mole PA . Evaluation of a new air displacement plethysmograph for measuring human body composition. Medicine and Science in Sports and Exercise. (1995) ;27: (12):1686–91. |
[34] | Iwaoka H , Yokoyama T , Nakayama T , Matsumura Y , Yoshitake Y , Fuchi T , et al. Determination of percent body fat by the newly developed sulfur hexafluoride dilution method and air displacement plethysmography. Journal of Nutritional Science and Vitaminology. (1998) ;44: (4):561–8. |
[35] | Slade GD SA , Roberts-Thomson KF . Australia’s dental generations: The National Survey of Adult Oral Health 2004–06. Canberra: Australian Institute of Health and Welfare Report No.: AIHW cat. no. DEN 165. |
[36] | Slade GD . Derivation and validation of a short-form oral health impact profile. Community Dentistry and Oral Epidemiology. (1997) ;25: (4):284–90. |
[37] | Silness J , Löe H . Periodontal disease in pregnancy II. Correlation between oral hygiene and periodontal condition. Acta Odontologica Scandinavica. (1964) ;22: (1):121–35. |
[38] | Flint A , Raben A , Blundell JE , Astrup A . Reproducibility, power and validity of visual analogue scales in assessment of appetite sensations in single test meal studies. International journal of obesity and related metabolic disorders: Journal of the International Association for the Study of Obesity. (2000) ;24: (1):38–48. |
[39] | Taylor JJ , Preshaw PM . Gingival crevicular fluid and saliva. Periodontology. (2016) ;70: (1):7–10. |
[40] | Mody L , Miller DK , McGloin JM , Div M , Freeman M , Marcantonio ER , et al. Recruitment and Retention of Older Adults in Aging Research. Journal of the American Geriatrics Society. (2008) ;56: (12):2340–8. |
[41] | Nooyens AC , Visscher TL , Schuit AJ , van Rossum CT , Verschuren WM , van Mechelen W , et al. Effects of retirement on lifestyle in relation to changes in weight and waist circumference in Dutch men: A prospective study. Public Health Nutrition. (2005) ;8: (8):1266–74. |
[42] | Partridge L , Deelen J , Slagboom PE . Facing up to the global challenges of ageing. Nature. (2018) ;561: (7721):45–56. |
[43] | Fontana L , Kennedy BK , Longo VD , Seals D , Melov S . Medical research: Treat ageing. Nature. (2014) ;511: (7510):405–7. |


