
Relationships between the inflammatory potential of the diet, aging and anthropometric measurements in a cross-sectional study in Pakistan
Abstract
BACKGROUND:
Little is known about associations between dietary inflammation, age and anthropometric measurements.
OBJECTIVE:
In this regard, we examine how DII is related to age, anthropometrics [weight, Body mass index (BMI), waist to hip ratio (WHR)] and other parameters of nutrition (energy, protein, fats and cholesterol intake, Net Endogenous Acid Production (NEAP) and Phytochemical Index (PI)) in a cross-sectional study in Pakistan.
DESIGN:
Only men (n = 651, age 54–95 years) participated in the study. Anthropometric data were collected using standard methods. DII was calculated from nutrients derived from 24-hr Dietary Recall questionnaires. NEAP and PI were calculated by established algorithms using information on nutrient intake.
RESULTS:
The results show that with increasing age, there was a significant increase in the DII score (p < 0.05). Similarly significant positive correlations were found between DII score and weight, BMI, WHR and % BF (p, for all trends < 0.05). DII score significantly positively correlated with the dietary factors studied i.e. energy, protein, and fats (p, for all trends < 0.0001) but non-significantly with cholesterol (p > 0.05). Similarly, a significant positive correlation with NEAP (p < 0.0001) was found, but negative with PI (p < 0.0001).
CONCLUSION:
In conclusion, the present study shows direct positive correlations between the DII, age and indices of obesity, and thus supports the hypothesis that diet may have a role in the development of obesity through inflammatory modulation mechanisms in elderly.
1Introduction
Evidence linking diet with inflammation has been accumulating recently [1–7]. It is likely that a Western-style diet is associated with higher systemic levels of inflammatory cytokines [2], whereas the Mediterranean-style diet may be accompanied by lower levels of these factors [3, 4]. Similar influences have been recorded for some other dietary items and nutrients, such as fruits and vegetables, polyunsaturated fatty acids and vitamins [5–7].
Aging is also closely linked with raised systemic inflammatory markers and studies focusing on how to measure these in the context of dietary interventions are paramount [8]. Blood levels of the acute phase response factors C-reactive protein (CRP), interleukin-6 (IL-6), and tumor necrosis factor α (TNFα) tend to increase during aging in elderly people [9]. Chronically elevated acute phase proteins are risk indicators for high mortality in the National Health and Nutrition Examination Survey (NHANES III), those over 60 with elevated CRP > 0.30 mg/dl serum had 2.7-fold higher mortality than those below this threshold [10] and even in younger individuals in this study the tendency for those with higher levels of IL 6 to suffer earlier mortality over 10-year follow-up was already present [11].
Clinical biomarkers of inflammation are used to study the effect of dietary constituents on inflammation [8–12]. CRP is a common clinical biomarker of cardiac-related inflammation and general inflammation [13]. Other common clinical indicators of inflammation are a high erythrocyte sedimentation rate (ESR), a high white blood cell count, and a low albumin level. However, these tests are nonspecific, meaning an abnormal result might result from a condition not related to inflammation. Various cytokines and adhesion molecules are useful for research but are not commonly used clinically because they do not identify the source of inflammation [6, 14, 15].
A novel dietary inflammatory index (DII), to assess the overall diet quality with regard to inflammatory potential, has been developed [6], used and validated extensively in a number of studies [17–22]. The purpose of creating the DII was to provide a tool that could assess an individual’s diet on a continuum from maximally anti-inflammatory to maximally pro-inflammatory. The DII has been validated using CRP measurements in the Seasonal Variation in Blood Lipids Study (SEASONS), a longitudinal study of approximately 500 individuals followed with intensive dietary and physical activity monitoring for a year [16, 21]. We have integrated the DII in a cross-sectional study in Pakistan with the aim to understand how it related to age, anthropometrics and other parameters of nutrition such as energy, protein, fats and cholesterol intake, Net Endogenous Acid Production (NEAP) and Phytochemical Index (PI). This study shows novel data supporting the role of diet in the development of inflammation-related conditions (obesity and inflammaging).
2Methods
2.1Study Site, participants, and data collection
The study was conducted in Peshawar, Khyber Pakhtunkhwa Pakistan from 2009–2014. Participants in the current study included a cohort of elderly men (n = 651, age 54–95 years), who participated in our previous studies conducted for the assessment of anthropometrics, nutritional status, selected blood chemistry values, and immunological parameters [23]. For the recruitment of the subjects, city registration data were obtained from the local office of the National Database and Registration Authorities in Peshawar. Addresses of the elderly subjects, who fulfilled the age and health criteria for the study, were obtained from the lists provided by the National Database and Registration Authorities. Potential subjects expressing interest in participating in the study were first screened by obtaining a verbal medical history to rule out any health conditions or medication use that could significantly affect their dietary habits. Only otherwise medically healthy subjects with no evident disease or infection, and those who were not taking medication on a chronic basis, were included.
The subjects were measured for their anthropometric characteristics. Weight and height were measured according to the standardized procedures, and body mass index (BMI) was calculated as weight/height2 according to the standard procedures (kg/m2) as previously reported [23]. Based on BMI, subjects were classified in either of the three groups i.e. obese (OB = BMI=>30), overweight (OW = BMI=25 – 29.9) and normal weight (NW = BMI=16.9 – 24.9).
The dietary data were collected using 24-hour dietary recalls (24-HR) through face-to-face interviews as we previously reported [23]. Briefly, a well-structured and extensively validated questionnaire was used for 24-HR in face-to-face interviews. During these interview sessions, the subjects were asked to recall what they had eaten during the previous day starting from breakfast in the morning until their last meals at night before sleep. During the 24-HR interviews, the intake reported by the subject was verified by someone in the household to avoid over- or underestimation of dietary intake because the elderly might easily forget what they had eaten during the previous 24 hours. Household measures such as cups, bowls, and spoons were used to help estimate quantities of foods consumed. Quantities were recorded according to the amount of food consumed from a particular bowl (for instance, half of the small brown bowl). When interviewees gave answers like “I used a little or a lot of milk in tea,” they were asked to show this with the cup they used, and the cup volume was later measured to estimate the amount. Nutrient intakes were computed using an in-house nutrient calculator in Microsoft Office Excel 2003 (Microsoft Corporation, Redmond, WA). This calculator is based on data from the food composition tables forPakistan.
2.2Estimation of DII, NEAP and PI
2.2.1Dietary inflammatory index
The design and development of the DII has been described elsewhere [22]. Briefly, the DII is a scoring algorithm based on an extensive review of the literature published from 1950 to 2010, linking 1943 articles to a total of forty-five food parameters and including various macronutrients, micronutrients, flavonoids and food items. These dietary parameters were scored according to whether they increased ( ± 1), decreased (–1) or had no effect (0) on six inflammatory biomarkers (IL-1β, IL-4, IL-6, IL-10, TNF-α and C-reactive protein (CRP). An overall food parameter-specific inflammatory effect score was calculated and multiplied by a centered percentile value for each food. This percentile was calculated by first linking the dietary data from a study to the regionally representative world database intake, which was based on actual human consumption in eleven populations from different parts of the world that provided a robust estimate of a mean and standard deviation for each parameter. These values then become the multipliers to express an individual’s exposure, relative to the ‘standard global mean’ as a z-score. This was achieved by subtracting the ‘standard global mean’ from the amount reported, and dividing this value by the standard deviation. To minimize the effect of ‘right skewing’, this value was then converted to a centered percentile score. The centered percentile score for each food parameter for each individual was multiplied by the respective food parameter effect score that was derived from the literature review in order to obtain a food parameter-specific DII score for an individual. All of the food parameter-specific DII scores were then summed to create the overall DII score for every participant in the study. The greater the DII score, the more pro-inflammatory the diet, and more negative values represent more anti-inflammatory diets. The DII score could take on values ranging from 7.98 (maximally pro-inflammatory) to –8.87 (maximally anti-inflammatory).
2.2.2Estimation of NEAP
For the estimation of dietary acid load, several algorithms have been developed [24] and also reported by ourselves. Briefly, Fassetto et al. (1998) calculated the estimated net endogenous acid production (NEAP) from the protein-potassium ratio of the diet [25]. Another algorithm developed by Remer et al. that estimates the diet-induced potential renal acid load (PRAL) [26]. In this study, both markers of diet-induced acid load were calculated. We in our previous study [15] have used both these methods. The method calculates the diet’s protein/potassium ratio expressed as g/mEq. The rationale and algorithm of this method have been described previously and the estimated NEAP could account for about 70% of the variation in renal net acid excretion [25]. We also performed additional analyses using the PRAL as a second marker for diet-induced acid load, and the PRAL was calculated using an algorithm described by Remer et al. [26, 27] NEAP of the subjects was estimated indirectly from the participants’ diets [24–26].
2.2.3Estimation of PI
The dietary phytochemical index was calculated based on the modified method previously developed by McCarty (2004); [PI=(phytochemical-rich foods g/d/ total food intake g/d)×100] [27]. Foods included in the phytochemical-rich category were fruits and vegetables, legumes, whole grains, nuts, soy products, olives and olive oil, and additionally, tea, coffee and spices. Potatoes were not considered as vegetables because they are often consumed as a starch component rather than as vegetables. Natural fruit and vegetable juices as well as tomato sauces were included in the fruit and vegetable groups because these are also considered as rich sources of phytochemicals.
2.3Statistical Analysis
Data analysis was performed using GraphPad Prism software Inc. (USA). Means (std) were calculated for all variables. The variables of interest were analyzed according to the tertiles of the DII score. The DII score was divided into tertiles for all analyses. We examined tertiles of the DII, instead of quartiles or quintiles, because our sample size was small in comparison with that of other studies using the DII. Comparisons of baseline characteristics of participants across tertiles of the DII were made by using one-factor ANOVA for continuous variables or chi-square tests for categorical variables, whichever was applicable. Pearson correlations were performed for the dietary inflammatory index and other variables using the scores as continuous variables. A p-value of < 0.05 was considered as statistically significant.
3Results
A total of 651 old men participated in the study. The mean ( ± SD) age of the study participants was 69.02 ± 8.9 years. Based on their BMI values, 72.5% of participants were NW, while 21% and 7.0% were OW and OB respectively. The DII ranged from –1.432 to 3.208 with the median of –0.93 in the lowest tertile and 1.114 in the highest tertile. The other basic characteristics of the study participants are given in Table 1. As shown, anthropometrics (weight, BMI, WC.WHR. % BF), nutrients intake (energy, protein, fats, cholesterol), NEAP and PI of the participants were analyzed in tertiles according to their DII scores. Participants in the lowest tertile of DII score were significantly younger, more likely to be having significantly lower BMI, WC, WHR and % BF. Also, participants in the lowest tertile of DII score were significantly consuming lower energy, protein, fats and cholesterol. Moreover, participants with a higher DII score had higher NEAP but lower PI values than those in the lowest tertile.
Table 1
Baseline characteristics of the participants according to tertiles of the DII1 score
| Overall | T1 | T2 | T3 | P 2 | |
| DII Score | –1.432 – 3.208 | –1.432 – <0.3730 | 0.3730 – <1.448 | 1.448 – <3.208 | <0.0001 |
| Age (Yrs) | 69.02 ± 8.9 | 62.91 ± 11.83 | 67 ± 12.3 | 75.13 ± 16.4 | <0.0001 |
| Weight (Kg) | 63.08 ± 13.2 | 56 ± 11.23 | 61.05 ± 9.4 | 69.05 ± 10.2 | <0.0001 |
| BMI (Kg/m2) | 22.4 ± 3.4 | 19.8 ± 1.3 | 21.5 ± 1.6 | 24 ± 1.8 | <0.0001 |
| WC (cm) | 79.81 ± 9.5 | 73.15 ± 6.9 | 79.67 ± 8.3 | 85.4 ± 7.4 | <0.0007 |
| WHR | 0.95 ± 0.07 | 0.93 ± 0.10 | 0.97 ± 0.12 | 0.99 ± 0.11 | <0.0001 |
| % BF | 26.2 ± 4.3 | 23.26 ± 3.8 | 25.61 ± 7.9 | 28.52 ± 6.8 | <0.0001 |
| Energy (Kcal/day) | 1664 ± 368 | 1459 ± 178 | 1619 ± 154 | 1773 ± 177 | <0.0001 |
| Protein (g/day) | 43.8 ± 11.5 | 36.1 ± 5,81 | 42.2 ± 6.44 | 48.63 ± 3.99 | <0.0001 |
| Fats (g/day) | 75.4 ± 21.4 | 60.68 ± 12.7 | 76.95 ± 11.9 | 91.05 ± 14.9 | <0.091 |
| Cholesterol (mg/day) | 167.2 ± 85.5 | 110 ± 23.1 | 133 ± 43.1 | 198.3 ± 39.9 | <0.0001 |
| NEAP | 43.2 ± 9.5 | 37.55 ± 8.9 | 42.93 ± 9.8 | 49.24 ± 7.9 | <0.0001 |
| PI | 23.9 ± 4.8 | 26.8 ± 5.33 | 24.1 ± 6.11 | 21.77 ± 4.12 | <0.0001 |
1Dietary Inflammatory Index. 2Chi-square test was used for categorical variables; ANOVA was used for continuous variables. 3Mean ± SD (all such values).
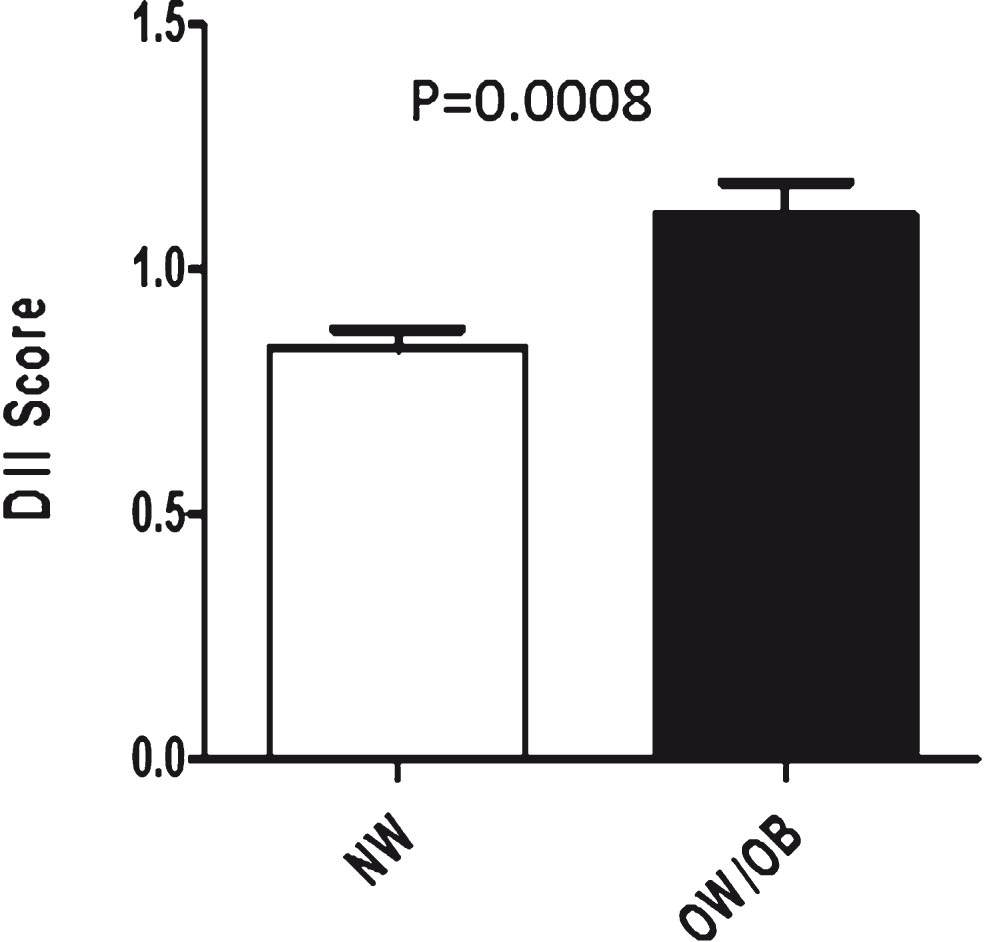
Figure 1 shows the comparison of mean values of DII scores of Normal Weight (NW) and Overweight/Obese (OW/OB) individuals. As evident, the DII score of NW individuals was significantly lower (p = 0.0008) than that of the OW/OB individuals.
Fig.1
Comparison of DII Scores of Normal Weight (NW) (BMI < 23) and Over Weight/Obese (OW/OB) (BMI > 23).
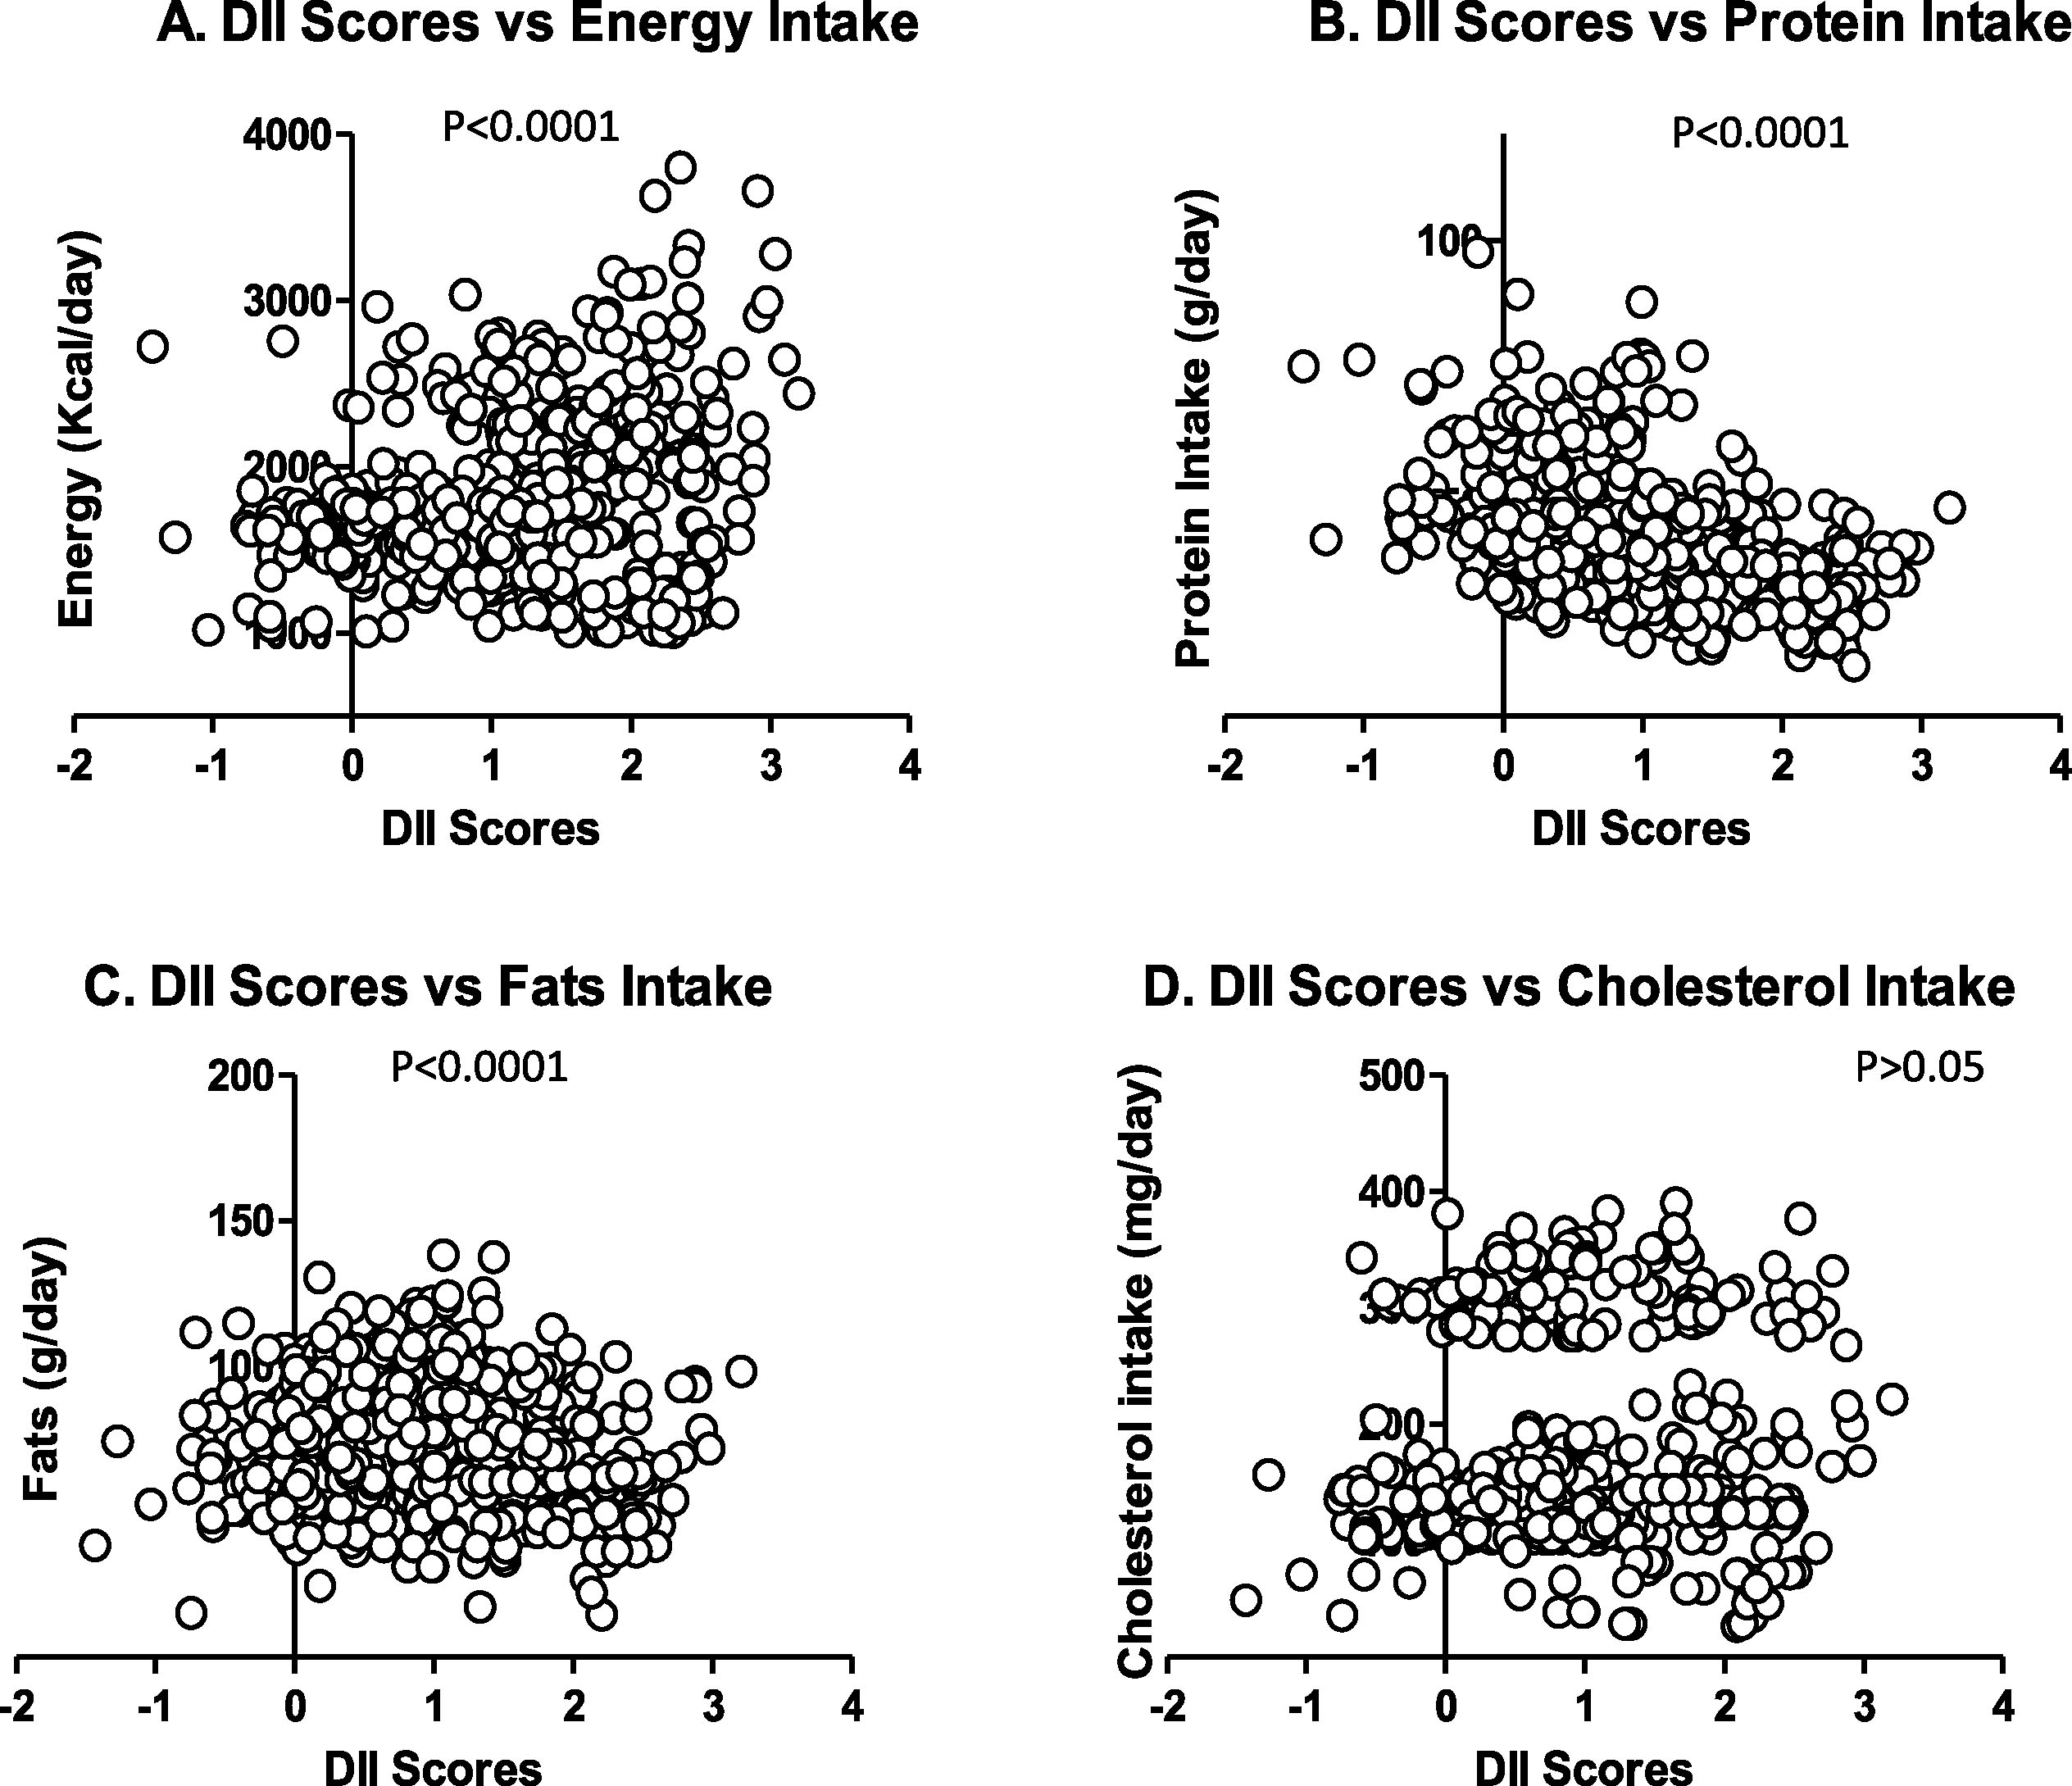
Figures 2–4 demonstrate the relationship between DII score age, anthropometrics and other parameters of nutrition (energy, protein, fats and cholesterol intake, Net Endogenous Acid Production (NEAP) and Phytochemical Index (PI). As evident, with increasing age there was a significant increase in the DII score (p = 0.05) (Fig. 2 A). Similarly significant and positive correlation was observed with weight, BMI and % BF (p, for all trends < 0.05) (Fig. 2B, C, D, E, F). A weak but positive correlation (p = 0.037) existed between DII score and WHR. Figure 3 shows the correlation between DII score, and selected nutrients. As clear, significant and positive correlation was observed with NEAP (p < 0.0001) but negative with PI (p < 0.0001). Figure 4 shows the relationship between DII score and selected nutrients. As evident, DII was significantly positively correlated with nutrients studied i.e. energy, protein, and fats (p, for all trends < 0.0001) but non-significantly with cholesterol (p > 0.05).
Fig.2
Scatterplot for DII score Vs Age (A), Weight (B), BMI (C), WC (D), WHR €, and % BF (F).
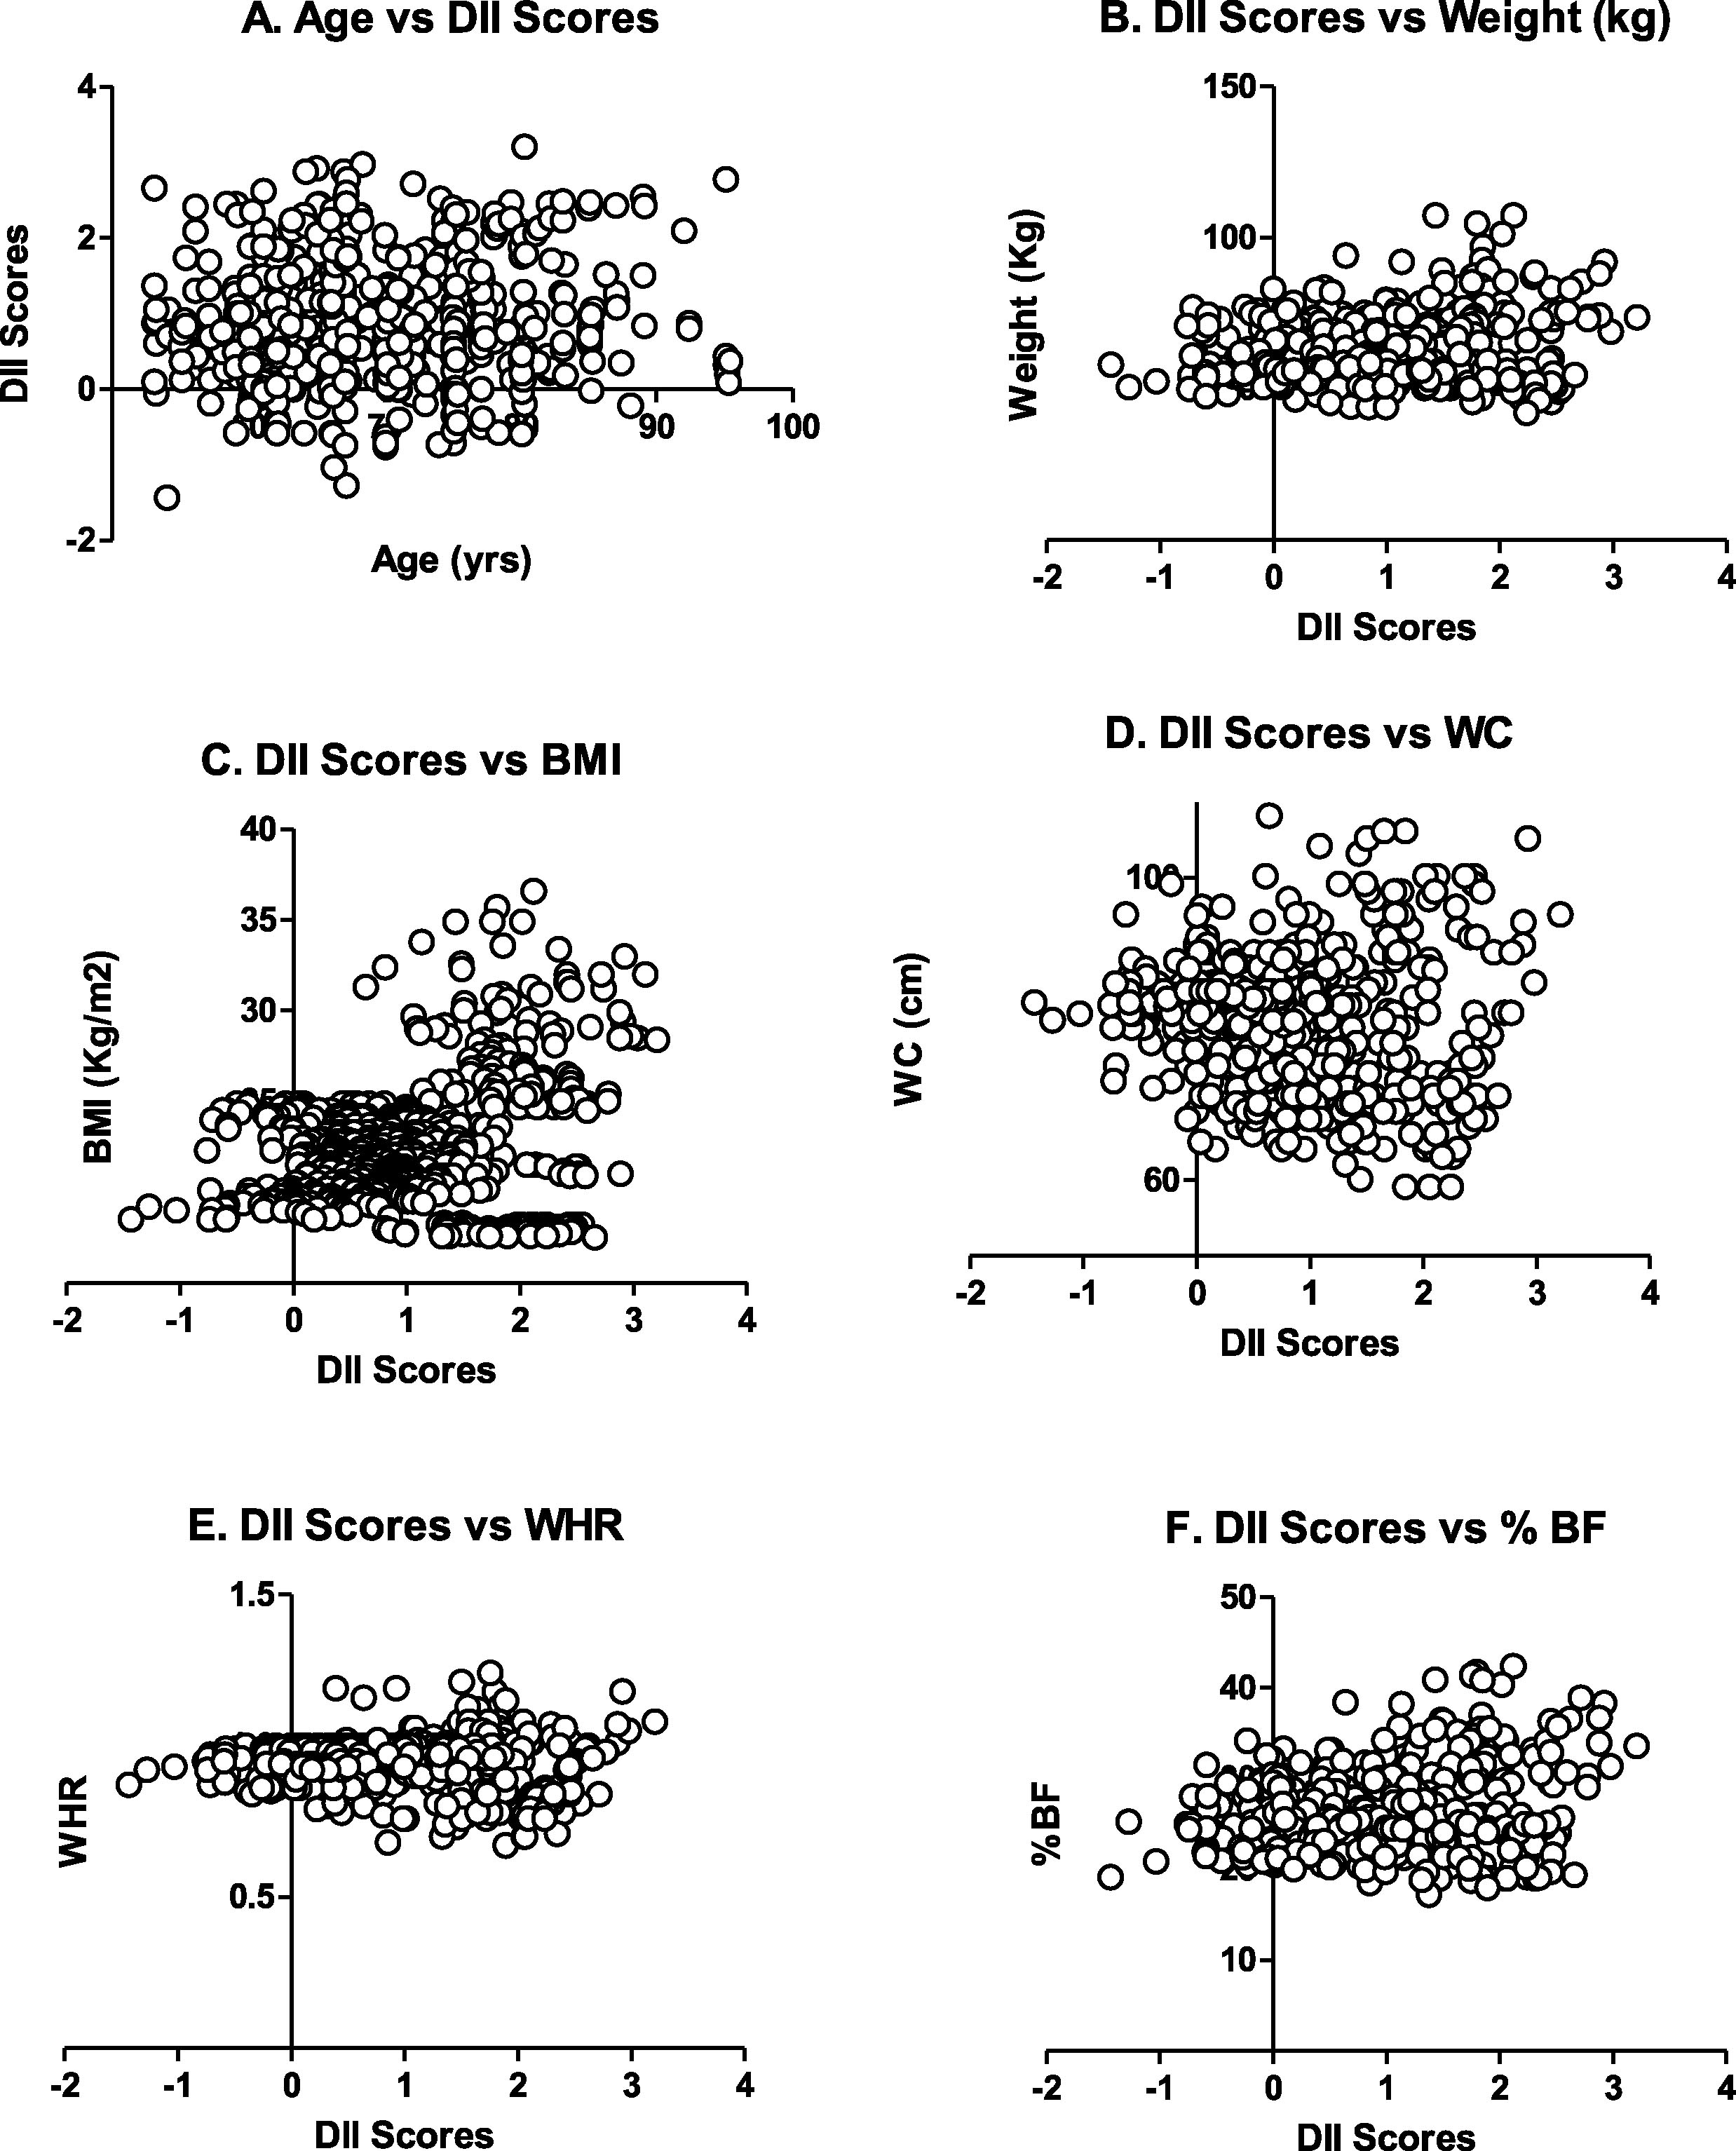
Fig.3
Scatterplot of DII Score Vs NEAP (A) and PI (B).
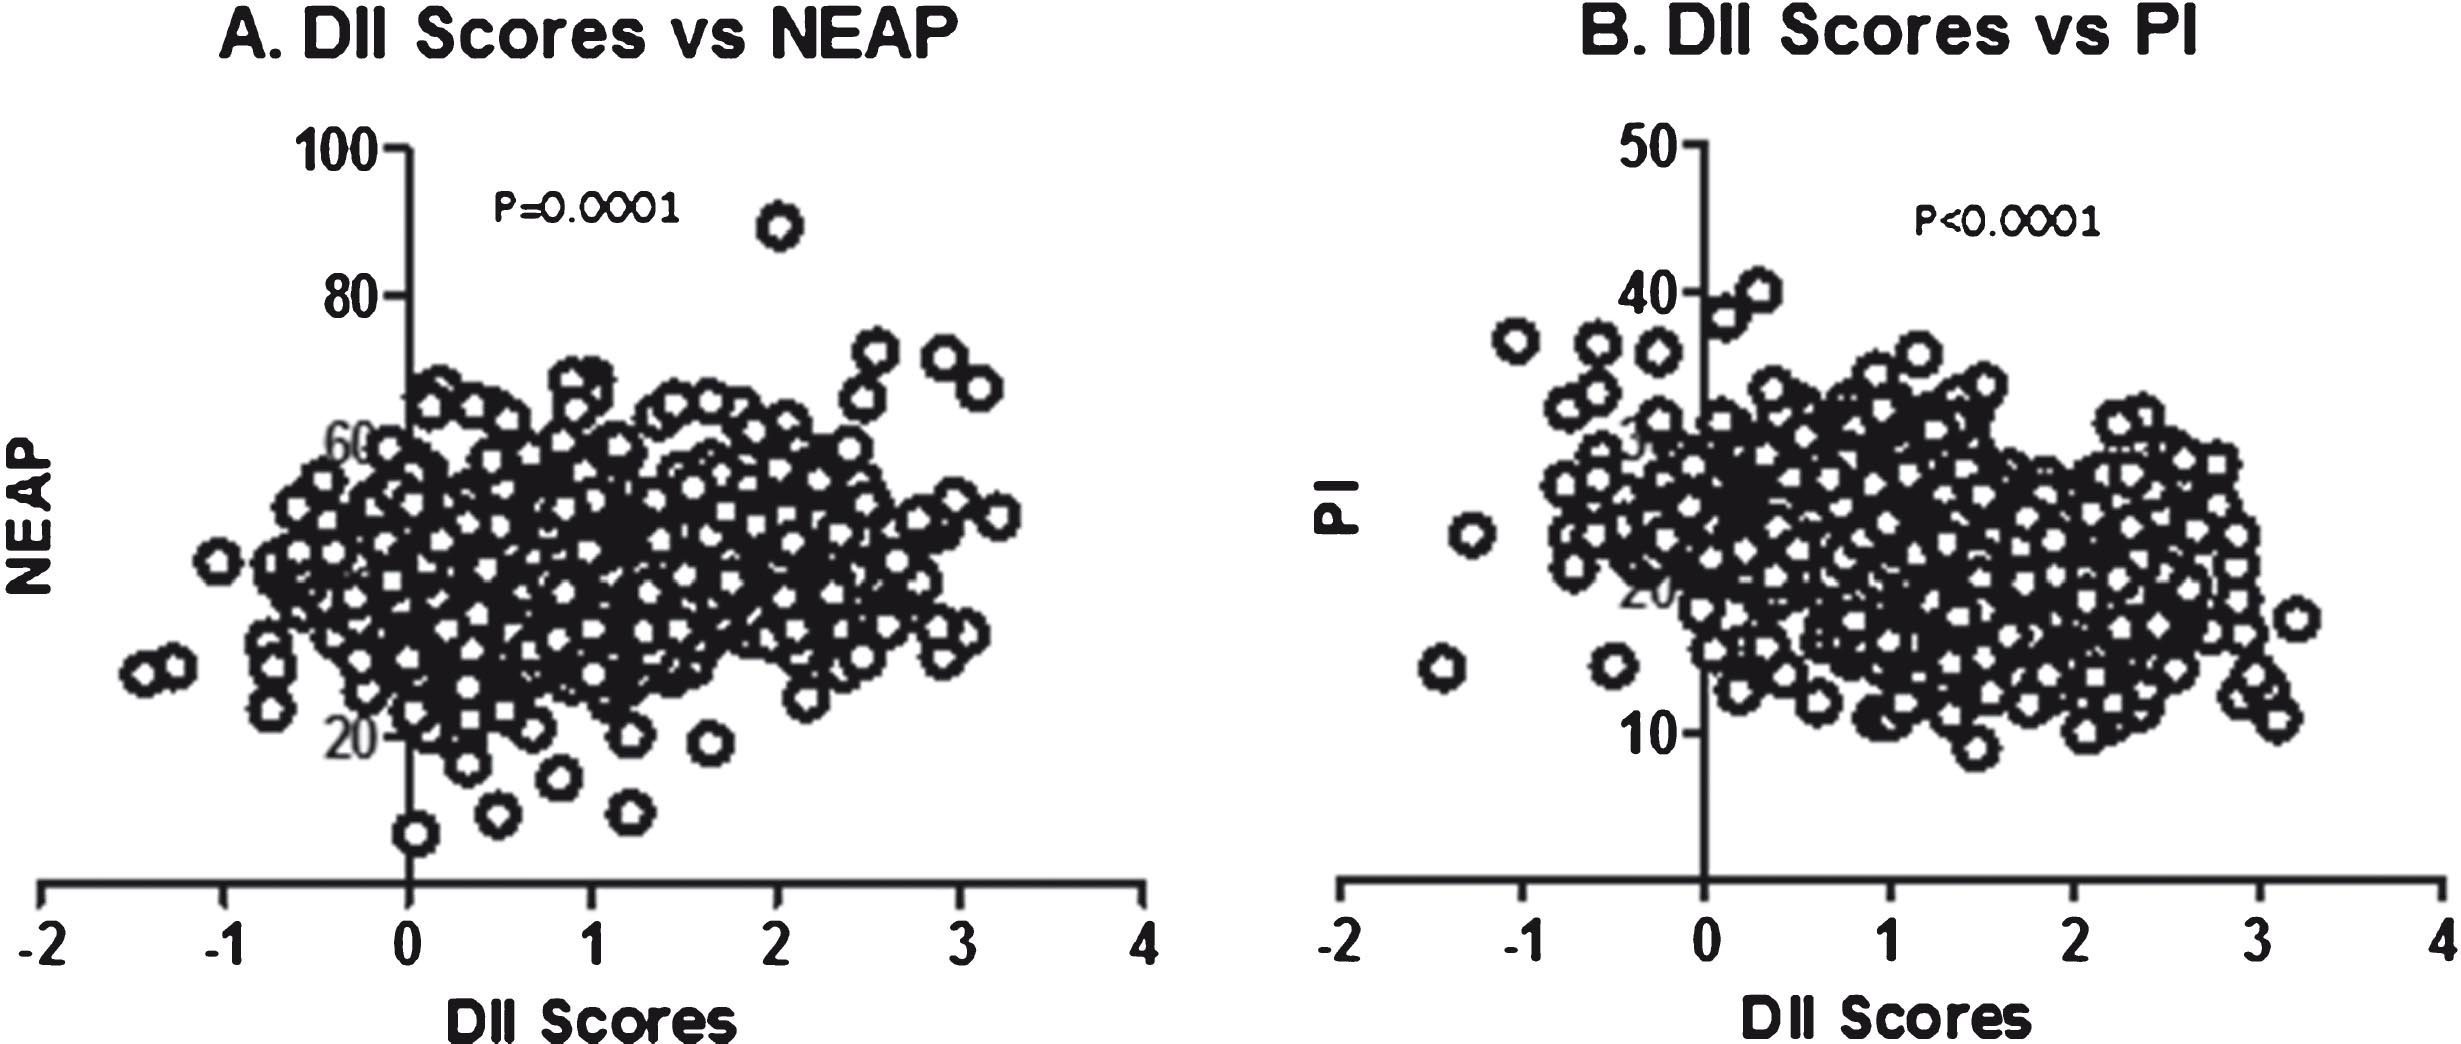
Fig.4
Scatterplot of DII score vs. Energy Intake (A), Protein Intake (B), Fats Intake (C) and cholesterol intake (D).
4Discussion
The findings of the study are particularly important for developing countries like Pakistan where obesity is more related to dietary factor. Therefore, there is a need of exploring all possible reasons and causes of diet induced obesity. The inflammatory potential of diet may be one of these causes. A diet seemingly balanced in terms of nutrient may be potentially inflammatory and hence may cause chronic inflammation (obesity). To the best of our knowledge, this is the first study in Pakistan to report relationship between diet-induced inflammation and age, BMI, NEAP and PI.
Diet-induced inflammation is a serious health challenge. Knowledge on inflammatory factors in the diet is therefore important to consider when prescribing therapeutic diets or giving dietary advice in general. A novel dietary inflammatory index (DII) to assess the overall diet quality with regard to inflammation potential has been developed [21] and used and validated extensively in a number of studies [16, 19–22]. The DII has been validated using CRP measurements in the Seasonal Variation in Blood Lipids Study (SEASONS); a longitudinal study of approximately 500 individuals followed with intensive dietary and physical activity monitoring for a year [16, 21].
In the present study, a higher pro-inflammatory diet (i.e. higher DII score) was observed in the older participants and in those with a higher BMI, WC, and % BF. The highest tertile of the DII was associated with the corresponding highest tertiles of these variables. In the context of aging in particular, these results also suggest the hypothesis that beside many dietary factors [3–7], aging is also a contributing factor to diet-induced inflammation [8–11]. The underlying mechanism is still to be investigated, but it may simply be argued that old age is associated with more unhealthy and unbalanced diet [23], which may contribute to higher DII scores in aged population as shown in the current study. Aging in man is accompanied by changes which may impair food acquisition, digestion, and metabolism [23]. Many conditions such as disability, acute and chronic diseases may influence nutritional status in ageing patients [1]. There is convincing evidence of dietary changes with aging [1, 23], which may promote inflammation that might contribute to increasing or maintaining obesity, especially abdominal obesity, in a population that is mostly overweight or obese.
We observed a steady decrease in DII score with increasing phytochemical index (PI). PI is a strong indicator of the presence of phytochemicals, which are bioactive non-nutrient plant chemicals found in high amount in fruits, vegetables, grains, nuts and legumes, may provide desirable health benefits and reduce the risk of major chronic diseases [27]. Phenolic compounds are ones of the important phytochemicals [28]. Research has demonstrated that these provide strong protection against inflammation, cardiovascular diseases, diabetes (type-II), oxidative stress and vascular dysfunction [28, 29]. Monitoring phytochemical intakes in a population-based study is usually not feasible due to huge expenses and hence usually laborious and virtually impractical. To overcome this difficulty, McCarty suggested a simple but applied method for the quantification of phytochemical intake in diet. The proposed tool is known as phytochemical index (PI). which is defined as: “the percent of dietary calories derived from foods rich in phytochemicals” [27]. In this method, calories derived from vegetables and fruits, legumes, nuts, whole grains, nuts, fruit/vegetable juices, seeds, soy products, wine, beer, and cider are counted in this index. According to PI, the vegan diet (excluding potato products, hard liquors and refined sugar) has the highest score of 100, whereas unhealthy dietary patterns such as Western diets always score below that [27]. Because it is not known whether the PI score is associated with a reduction in DII score, the present study also aimed to determine the correlation of PI score with DII score in Pakistani adults.
The present study has certain limitations; the main one being the cross-sectional nature of our analyses. It is, therefore, unclear whether obese individuals are more likely to choose pro-inflammatory diets, or if pro-inflammatory diets contribute to promoting or maintaining obesity. Both weight reduction and an overall healthy dietary pattern have the capacity to reduce inflammatory markers. Thus, the association between the DII and obesity indices remains to be confirmed in prospective analyses. Another limitation is that anthropometric measures are surrogate markers of abdominal obesity. Waist circumference and WHR do not differentiate between visceral adipose tissue and subcutaneous abdominal adipose tissue. Therefore, we cannot determine whether the DII is more strongly associated with visceral, subcutaneous or both types of abdominal fat mass. Finally, the DII is limited by the existing knowledge of the inflammatory factors involved in obesity.
5Conclusion
The present study shows direct positive correlations between the DII, age and indices of obesity and thus supports the hypothesis that diet may have a role in the development of obesity through inflammatory modulation mechanisms in elderly. Recent analyses have tested the relationship between nutrition and immune modulation and suggest the usefulness of some immune biomarkers [30]. For the purpose of the current study, DII as indicator of diet-induce inflammation. The development of DII included 6 inflammatory molecules to test the inflammatory profile of nutrients. The usefulness of these biomarkers should be further reviewed regarding (i) their correlation with clinical endpoint (ii) link to causal pathway (iii) biological sensitivity (iv) technical feasibility (v) robustness and others. A recent report [23] discussed the driving forces leading to low grade inflammation in elderly individuals. The gut-brain axis (including microbiota) and the effect of nutritional interventions (omega-3 fatty acid, probiotic, prebiotic, antioxidant and polyphenol) were the two areas requiring better understanding in order to identify ways to slow, control or reverse low grade inflammation. This could have a significant impact on the development of conditions in older adults and extend health span.
6Disclosure statement
Dr. James R. Hébert owns the controlling interest in Connecting Health Innovations LLC (CHI), a company planning to license the right to his invention of the dietary inflammatory index (DII) from the University of South Carolina in order to develop computer and smart phone applications for patient counselling and dietary intervention in clinical settings. Dr. Nitin Shivappa is an employee of CHI. The subject matter of this paper will not have any direct bearing on that work, nor has that activity exerted any influence on this project.
All the remaining authors disclose ‘no conflict of interest’.
7Authors’ contribution
Iftikhar Alam, Graham Pawelec and Anis Larbi conceived the research, and designed the study. Iftikhar Alam collected the field data. Iftikhar Alam, Graham Pawelec and Anis Larbi did the statistical analysis of the data. Dietary inflammatory index (DII) scores were calculated by Nitin Shivappa and James R. Hebert. Iftikhar Alam drafted the manuscript and Graham Pawelec, Anis Larbi, Nitin Shivapp and James R. Hebert reviewed the manuscript.
Acknowledgments
The first author, in particular, extends his appreciation to the College of Applied Medical Sciences Research Center and the Deanship of Scientific Research at King Saud University.
References
[1] | Forster S , Gariballa S . Age as a determinant of nutritional status: A cross sectional study. Nutrition Journal. (2005) ;4: (1):28. |
[2] | Esmaillzadeh A , Kimiagar M , Mehrabi Y , Azadbakht L , Hu FB , Willett WC . Dietary patterns and markers of systemic inflammation among Iranian women. J Nutr. (2007) ;137: :992–8. |
[3] | Dyer J , Davison G , Marcora SM , Mauger AR . Effect of a Mediterranean type diet on inflammatory and cartilage degradation biomarkers in patients with osteoarthritis. The Journal of Nutrition, Health & Aging. (2017) ;21: (5):562–6. |
[4] | Mertens E , Mullie P , Deforche B , Lefevre J , Charlier R , Huybrechts I , Clarys P . Cross-sectional study on the relationship between the Mediterranean Diet Score and blood lipids. Nutrition Journal. (2014) ;13: (1):88. |
[5] | Calviello G , Su HM , Weylandt KH , Fasano E , Serini S , Cittadini A . Experimental evidence of omega-3 polyunsaturated fatty acid modulation of inflammatory cytokines and bioactive lipid mediators: Their potential role in inflammatory, neurodegenerative, and neoplastic diseases. Biomed Res Int. (2013) ;2013: :743171. |
[6] | Root MM , McGinn MC , Nieman DC , Henson DA , Heinz SA , Shanely RA , et al. Combined fruit and vegetable intake is correlated with improved inflammatory and oxidant status from a cross-sectional study in a community setting. Nutrients. (2012) ;4: :29–41. |
[7] | Middleton G , Keegan R , Smith MF , Alkhatib A , Klonizakis M . Implementing a Mediterranean diet intervention into a RCT: Lessons learned from a non-Mediterranean based country. The Journal of Nutrition, Health & Aging. (2015) ;19: (10):1019–22. |
[8] | Calder PC , Ahluwalia N , Albers R , Bosco N , Bourdet-Sicard R , Haller D , Holgate ST , Jönsson LS , Latulippe ME , Marcos A , Moreines J . A consideration of biomarkers to be used for evaluation of inflammation in human nutritional studies. British Journal of Nutrition. (2013) ;109: (S1):S1–34. |
[9] | Ferrucci L , Corsi A , Lauretani F , Bandinelli S , Bartali B , Taub DD , Guralnik JM , Longo DL . The origins of age-related proinflammatory state. Blood. (2005) ;105: (6):2294–9. |
[10] | Danesh J , Kaptoge S , Mann AG , Sarwar N , Wood A , Angleman SB , Wensley F , Higgins JP , Lennon L , Eiriksdottir G , Rumley A . Long-term interleukin-6 levels and subsequent risk of coronary heart disease: Two new prospective studies and a systematic review. PLoS Medicine. (2008) ;5: (4):e78. |
[11] | Simanek AM , Dowd JB , Pawelec G , Melzer D , Dutta A , Aiello AE . Seropositivity to cytomegalovirus, inflammation, all-cause and cardiovascular disease-related mortality in the United States. PLoS One. (2011) ;6: (2):e16103. |
[12] | Calder PC , Bosco N , Bourdet-Sicard R , Capuron L , Delzenne N , Doré J , Franceschi C , Lehtinen MJ , Recker T , Salvioli S , Visioli F . Health relevance of the modification of low grade inflammation in ageing (inflammageing) and the role of nutrition. Ageing Res Rev. (2017) . pii: S1568-1637(17)30003-X. doi: 10.1016/j.arr.2017.09.001. [Epub ahead of print] |
[13] | Mazidi M , Gao HK , Kengne AP . Inflammatory Markers Are Positively Associated with Serum trans-Fatty Acids in an Adult American Population. Journal of Nutrition and Metabolism. (2017) ;2017. |
[14] | Scott A , Khan KM , Roberts CR , Cook JL , Duronio V . What do we mean by the term “inflammation”? A contemporary basic science update for sports medicine. Br J Sports Med. (2004) ;38: (3):372–80. |
[15] | Kaysen GA . Biochemistry and biomarkers of inflamed patients: Why look, what to assess. Clin J Am Soc Nephrol. (2009) ;4: (Suppl 1):S56–63. |
[16] | Shivappa N , Steck SE , Hurley TG , Hussey JR , Hebert JR. Designing and developing a literature-derived, population based dietary inflammatory index. Public Health Nutr. (2013) :1–8. |
[17] | Shivappa N , Wirth MD , Hurley TG , Hébert JR . Association between the dietary inflammatory index (DII) and telomere length and C-reactive protein from the National Health and Nutrition Examination Survey-1999-2002. Mol Nutr Food Res. (2017) ;61: (4). |
[18] | Wirth MD , Shivappa N , Davis L , Hurley TG , Ortaglia A , Drayton R , Blair SN , Hébert JR . Construct validation of the dietary inflammatory index among African Americans. The Journal of Nutrition, Health & Aging. (2017) ;21: (5):487–91. |
[19] | Tabung FK , Steck SE , Zhang J , Ma Y , Liese AD , Agalliu I , Hingle M , Hou L , Hurley TG , Jiao L , Martin LW . Construct validation of the dietary inflammatory index among postmenopausal women. Annals of Epidemiology. (2015) ;25: (6):398–405. |
[20] | Tabung FK , Steck SE , Ma Y , Liese AD , Zhang J , Caan B , Hou L , Johnson KC , Mossavar-Rahmani Y , Shivappa N , Wactawski-Wende J . The association between dietary inflammatory index and risk of colorectal cancer among postmenopausal women: Results from the Women’s Health Initiative. Cancer Causes & Control. (2015) ;26: (3):399–408. |
[21] | Shivappa N , Steck SE , Hurley TG , Hussey JR , Ma Y , Ockene IS , Tabung F , Hébert JR . A population-based dietary inflammatory index predicts levels of C-reactive protein in the Seasonal Variation of Blood Cholesterol Study (SEASONS). Public Health Nutrition. (2014) ;17: (8):1825–33. |
[22] | Shivappa N , Steck SE , Hurley TG , Hussey JR , Hebert JR . Designing and developing a literature-derived, population-based dietary inflammatory index. Public Health Nutrition. (2014) ;17: (8):1689–96. PubMed PMID: 23941862. Pubmed Central PMCID: 3925198. |
[23] | Alam I , Larbi A , Pawelec G . Aging affects the number of T and B cells in a group of elderly in developing countries – a pilot study from Pakistan. AGE. (2012) ;35: (5):1521–30. |
[24] | Frassetto LA , Lanham-New SA , Macdonald HM , Remer T , Sebastian A , Tucker KL , Tylavsky FA . Standardizing terminology for estimating the diet-dependent net acid load to the metabolic system. The Journal of Nutrition. (2007) ;137: (6):1491–2. |
[25] | Frassetto LA , Todd KM , Morris RC , Sebastian A . Estimation of net endogenous noncarbonic acid production in humans from diet potassium and protein contents. Am J Clin Nutr. (1998) ;68: (3):576–83. |
[26] | Remer T . Influence of nutrition on acid-base balance – metabolic aspects. Eur J Nutr. (2010) ;40: (5):214–20. |
[27] | McCarty MF . Proposal for a dietary “phytochemical index”. Med Hypothes. (2004) ;63: :813–7. |
[28] | Boyer J , Liu RH . Apple phytochemicals and their health benefits. Nutrition Journal. (2004) ;3: (1):5. |
[29] | Carughi A , Feeney MJ , Kris-Etherton P , Fulgoni V , Kendall CW , Bulló M , Webb D . Pairing nuts and dried fruit for cardiometabolic health. Nutrition Journal. (2016) ;15: (1):23. |
[30] | Albers R , Bourdet-Sicard R , Braun D , Calder PC , Herz U , Lambert C , Lenoir-Wijnkoop I , Meheust A , Ouwehand A , Phothirath P , Sako T . Monitoring immune modulation by nutrition in the general population: Identifying and substantiating effects on human health. British Journal of Nutrition. (2013) ;110: (S2):S1–30. |


