
The Geometric Framework for Nutrition as a tool in precision medicine
Abstract
Fundamental questions in nutrition include, “What constitutes a nutritionally balanced diet?”, “What are the consequences of failing to achieve diet balance?”, and “How does diet balance change across the lifecourse and with individual circumstances?”. Answering these questions requires coming to grips with the multidimensionality and dynamic nature of nutritional requirements, foods and diets, and the complex relationships between nutrition and health, while at the same time avoiding becoming overwhelmed by complexity. Here we illustrate the use of an integrating framework for taming the complexity of nutrition, the Geometric Framework for Nutrition (GFN), and show how this might be used to untap the full potential for nutrition to provide targeted primary interventions and treatments for the chronic diseases of aging. We first briefly introduce the concepts behind GFN, then provide an example of how GFN has been used to relate nutrition to various behavioural, physiological and health outcomes in a large mouse experiment, and end by suggesting a translational pathway to human health.
1Introduction
Nutrition fundamentally shapes the relationship between genes and health, acting via a complex system of molecular and physiological interactions that includes gene expression, metabolism, the immune system, the alimentary tract and its microbiota, other organ systems, and the brain. Humans, like all animals, must acquire numerous macro- and micro-nutrients in appropriate amounts and proportions to function optimally, with this balance changing across the lifecourse and differing according to genetic and epigenetic background and environmental circumstances [1]. Failure to attain dietary balance has profound consequences, which reverberate across all levels in the hierarchy of biological organization. These include changes in molecular and cellular processes to pathophysiological and behavioural responses – and extend beyond the individual to shape social dynamics, societal systems, and environmental impacts [1–3]. The same nutritional imperatives face the gut microbiota, members of which gain their primary nutrition from food ingested by the host or from host-derived secretions, and in turn provision the host with metabolites and nutrients that are essential to health [4, 5].
Understanding the processes and mechanisms that define the relationships between diet and physiologyholds great promise to improve human health [6]. Indeed, nutrition has the potential to be the most significant single primary prevention intervention in humans, while titrating nutrition to the specific needs of the patient has an obvious role in the management of obesity-associated non-communicable diseases and in healthy aging. However, progress towards this end has been impeded by the complexity of the relationships between diet, physiology and health. Traditional approaches in the science of nutrition have usually been “one variable at a time”, focusing on the roles of single dietary components or properties rather than the entire mixture [6]. Due to interactions occurring between nutrients and other dietary constituents as well as the non-linearity of responses to many nutrients, studies that focus on perturbing single nutrients or comparing two dietary treatments (e.g. control vs dietary restriction in aging) risk drawing erroneous conclusions about the relationships between nutrition and physiological outcomes (e.g. [7]).
2A framework for taming the complexity of nutrition
The development of an approach called the Geometric Framework for Nutrition (GFN) offers a means to transform how we interpret the ways that nutrients, other dietary constituents and their interactions influence physiology and health [1, 3]. The foundational principle of GFN is that the nutritional requirements of an organism can be represented graphically either as a point integrated over a given time period or as a moving trajectory within an n-dimensional space, where each dimension is a nutrient (macro- or micro-) or other dietary constituent (fibre, toxin, secondary metabolite, etc.). Such ‘intake targets’ can be reached if the animal has appropriate foods available. Foods are presented as radials, or ‘rails’, in the nutrient space, extending outwards from the origin at an angle defined by the ratio of nutrients found in each food. A nutritionally balanced food is one where the radial intersects the intake target and therefore allows the animal to move directly to its target, thereby attaining its multiple nutritional requirements simultaneously. Nutritionally imbalanced foods do not intersect the target and constrain the animal to having to trade-off eating too little of some nutrients against too much of others relative to the intake target, with physiological consequences and potential health costs. Nutritionally complementary foods are those which, although individually nutritionally imbalanced, can be mixed to reach the intake target by virtue of their rails jointly subtending an angle in nutrient space that contains the target.
GFN models have been used to demonstrate how organisms across many taxa, from slime molds to humans, possess nutrient-specific appetites, select foods, control food intake and utilize ingested nutrients to attain their intake, growth and maintenance requirements (see [1]). Additionally, GFN allows the consequences of ingesting particular combinations of nutrients to be mapped as response topologies. which provide a visual read-out of how nutrient intakes effect the state of the animal, for example physiological markers, disease risk, reproduction or mortality rates. Therein lies the power of GFN to relate nutrition to health outcomes and to integrate across levels from molecular to ecological[3, 8]. An early example in the field of aging research was an experiment in which ca. 1,000 mated female Drosophila were confined to one of 28 diet formulations that were varied systematically in protein and carbohydrate ratio and concentration. Volume eaten by each fly was measured and their protein-carbohydrate intakes derived. It was then possible to map associated life-history outcomes (how long each fly lived and now many eggs she laid) onto the resulting array of 1,000 bi-coordinate intake points [9]. Such response landscapes were then used to derive inferences about longevity-reproduction trade-offs, and the contributions of caloric restriction and macronutrient ratio in determining lifespan. This study showed that lifespan was maximised on diets with low protein:carbohydrate ratios (1 : 16), whereas reproduction was maximised on a diet with P:C 1 : 4. When allowed to regulate dietary balance through complementary feeding (as shown schematically in Fig. 1), the flies selected the diet that supported maximal reproduction, even though this was associated with reduced lifespan.
Fig.1
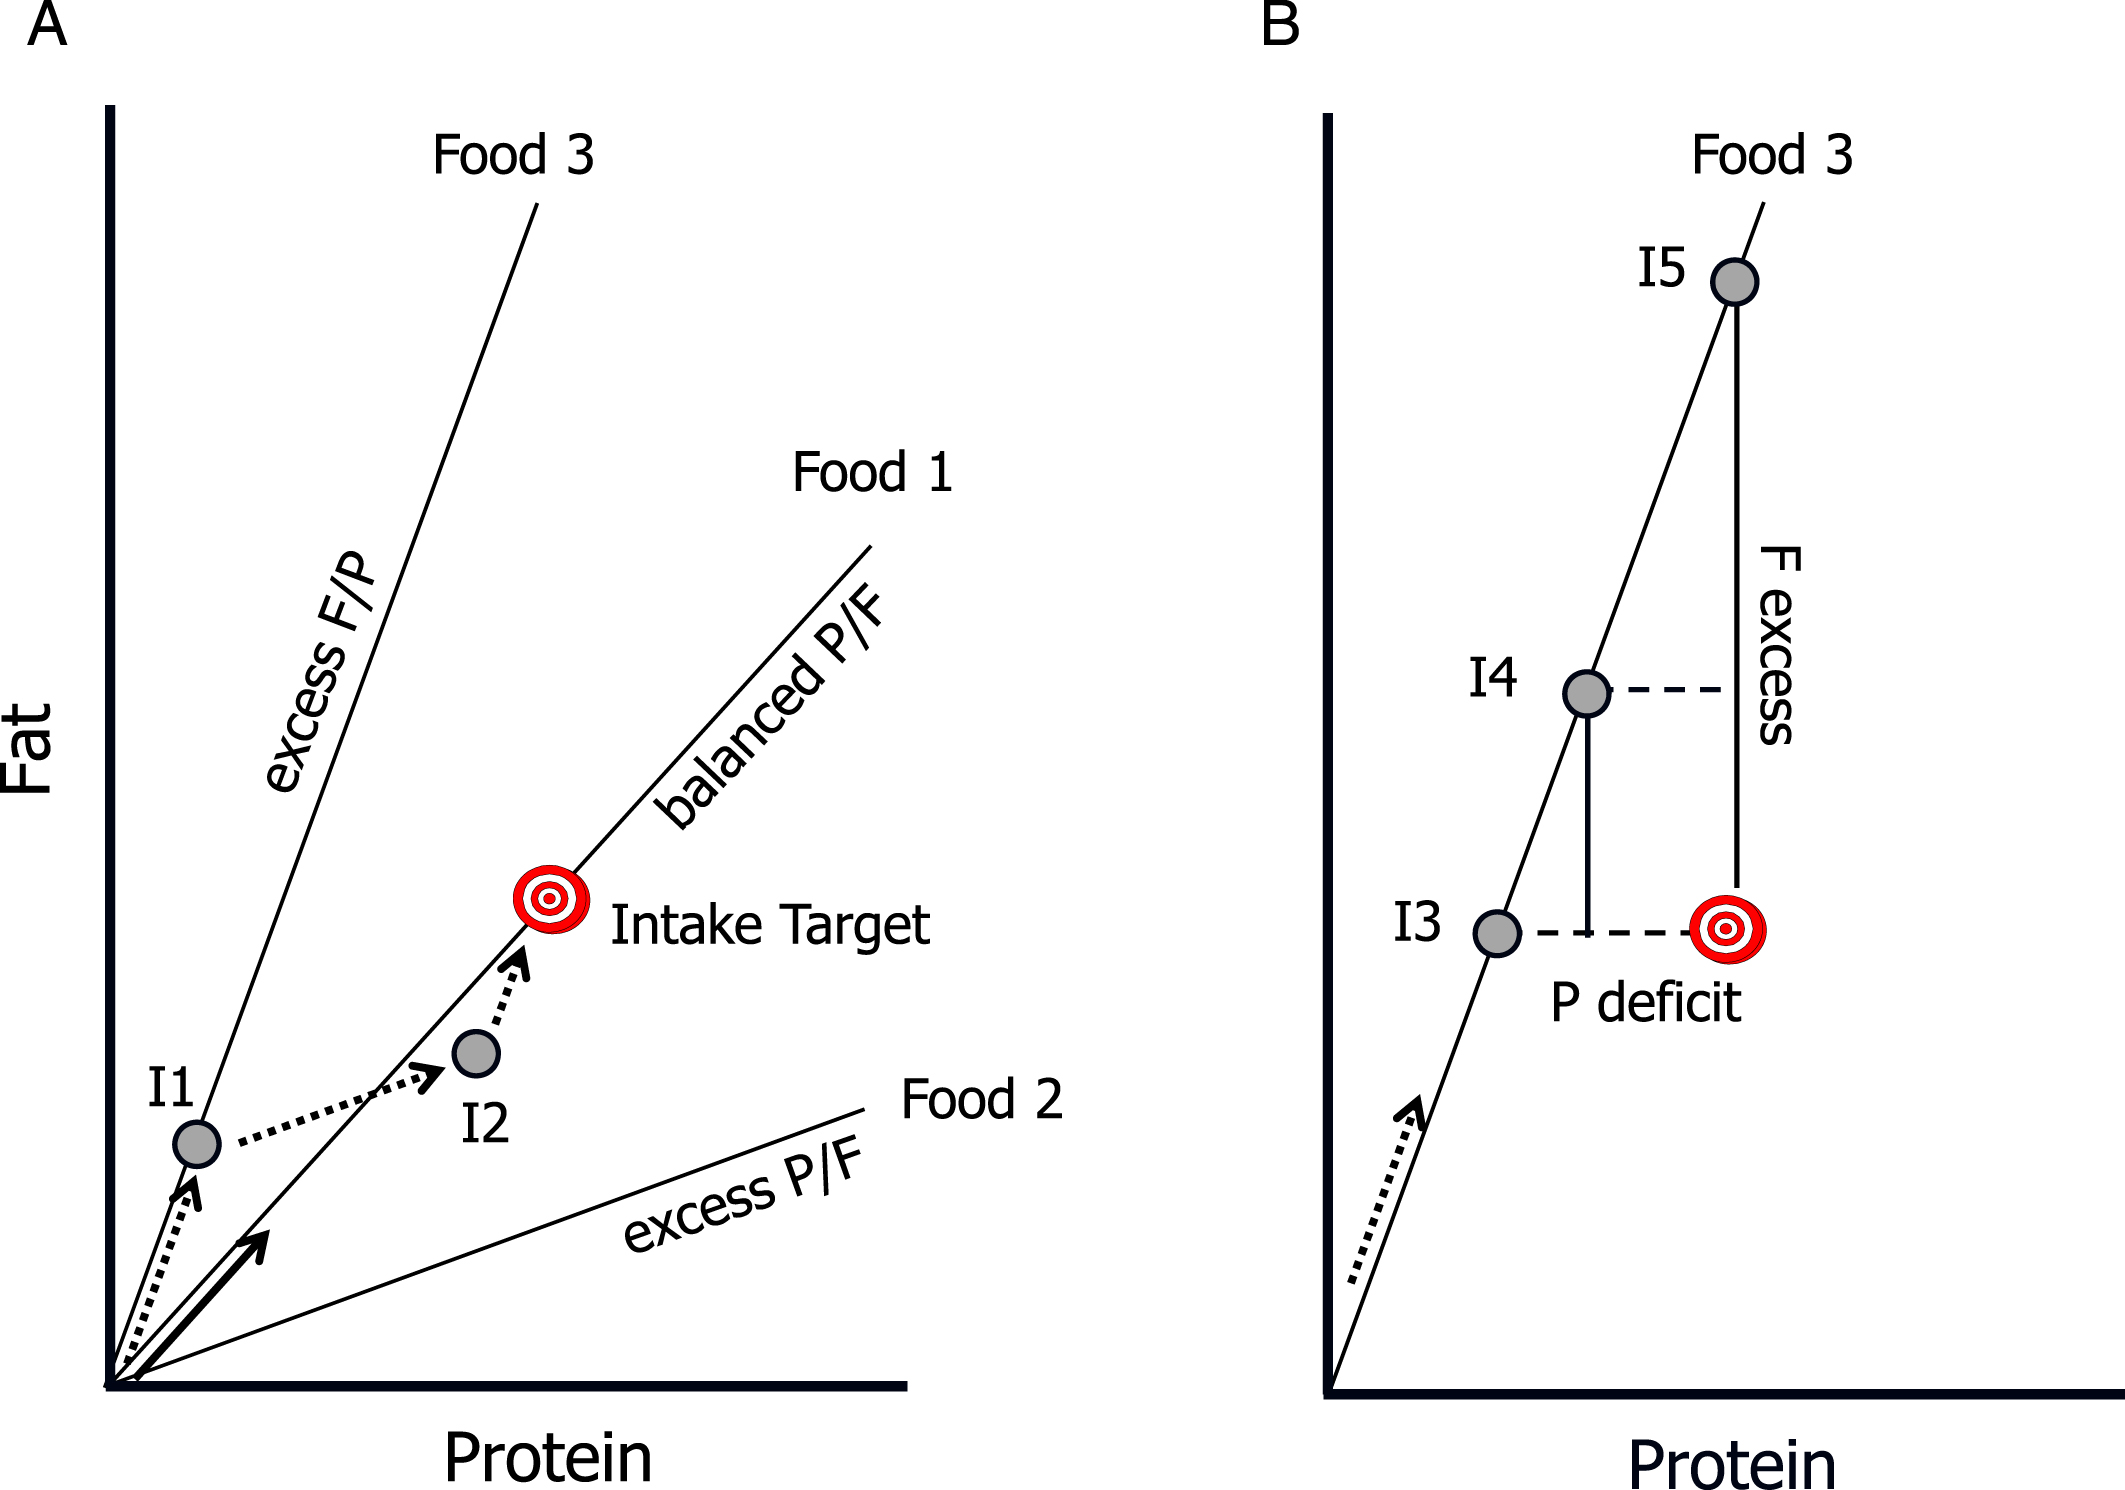
Core concepts of the Geometric Framework for Nutrition. The intake target represents the optimal amount and balance of the nutrients required by the animal. Radial lines are “rails” showing the ratio of the nutrients in foods, and grey circles represent hypothetical nutrient intakes (I1 –I5). As the animal eats it “moves” along a trajectory at an angle equal to the angle of the rail for the food it is eating (arrows), with sequential arrows representing intake trajectories. A) Food 1 is balanced with respect to the protein:fat ratio (P:F): it passes through the Intake Target, and thus enables the animal to directly reach the target (solid arrow). In contrast, Foods 2 and 3 are imbalanced (excess P and F respectively) and do not enable the animal to reach the target. It can, however, reach the target by mixing its intake from these “nutritionally complementary” foods (dotted arrows): for example, by first feeding on Food 3 to point I1, then switching to Food 2 at I2 switching back to Food3. B) If restricted to a single imbalanced food, the animal faces a trade-off between over-eating one nutrient and under-eating another. At I3 it meets its requirements for fat but suffers a protein deficit, at I5 it has optimal protein intake but excess fat, and at I4 it has both a moderate excess of fat and deficit of protein.
3Proof of concept: A study in mice
A series of recent publications has used GFN to show in mice that macronutrient intakes profoundly impact appetite, growth, reproduction, aging, cardio-metabolic health, obesity and immune function, as well as the ecology of the gut microbiota. This research provides a model illustration of how GFN might be used as a platform for defining nutritional interventions to manage health outcomes.
In the mouse study 858 animals of both sexes were confined to one of 25 diets varying systematically in protein, carbohydrate, fat and energy content. Animals were euthanized at 15 months for evaluation of health, biochemical pathways and gut microbiota, while a second cohort was maintained for lifespan studies [10]. Thus, we were able to pinpoint the optimum balance of macronutrients and energy across a broad landscape of physiologically relevant diets for various biological and health outcomes, and to unequivocally answer the question whether it is the reduction in calories or the balance of macronutrients that mediates the aging benefits of a calorically restricted diet under ad libitum feeding conditions [10, 11].
The major behavioural response to food nutritional composition, compensatory feeding, was found to be driven most strongly by protein content of the diet, less so by carbohydrates and least of all by fat content. Hence, mice ingested a greater mass of foods that contained a lower percentage of protein and, to a somewhat lesser degree, of carbohydrate, yet showed little response to dietary fat content. The consequence was that total energy intake was greatest on low percent protein diets in which the primary diluent of protein was fat. Increased food intake on lowpercent protein diets – termed protein leverage [12] – was also apparent but less pronounced when carbohydrate rather than fat was the main diluent of protein, in part because of nutrient-specific regulatory feedbacks inhibiting excess carbohydrate intake [13].
As previously discussed above in relation to flies and also reported for other insects, lifespan was maximised on diets with a low protein, low fat and high carbohydrate content, with the ratio of protein to carbohydrate (P:C) having the most significant effect, not calories eaten [9, 14]. Despite mice on the low protein, high carbohydrate diets being somewhat hyperphagic and having increased body fat, they exhibited markers of beneficial health outcomes, such as low HOMA (a measure of insulin resistance), blood pressure and LDLc, i.e. compatible with the concept of healthy obesity. These results show why it is essential to study a broad range of diet compositions in order to understand the relationship between macronutrients, dietary energy and health-related outcomes. Moreover, this study formed the linchpin for a number of observational studies in humans, which supported the conclusion that the balance of protein to carbohydrates in the diet is the major nutritional driver of age-related health and lifespan under ad libitum feeding conditions [8, 14]. By contrast, as expected by evolutionary theories founded on functional trade-offs between reproduction and longevity [15], reproductive potential was optimised in both female and male mice on diets with higher protein and lower carbohydrate contents than that which optimised lifespan [16]; a finding which emphasizes that nutritional requirements change across the lifecourse and cannot be met by adopting a single diet composition throughout life.
We were then able to dissect out some of the underlying physiological responses. GFN was used to analyse the effects of nutrition on the gut microbiota [4]. By visualising the responses of the microbiota to macronutrients and energy it was found that microbial assemblages are fundamentally shaped by a dichotomy in bacterial strategies to access nitrogen in the gut environment, and could be broadly divided into two functional guilds: those with a limitation-type response which consume nitrogen derived from host secretions, notably gut mucin, versus those bacterial taxa that derive nitrogen from the remnants of food ingested by the host. Hence, GFN rendered a potentially highly multidimensional microbial ecology down to two response types, which had different associations with measures of host health and did not map neatly onto current bacterial taxonomic schema [4]. This example illustrates how GFN offers a means to help define concepts such as microbial ‘dysbiosis’ and the ‘holobiont’ in a manner that becomes more tractable to mechanistic study [4, 17].
Next, we studied the effect of nutrition on immune responses using the GFN. Lymphocyte populations were measured in splanchnic nodes, spleen and liver. Protein content of the diet was the major driver of lymphocyte populations, with low protein diets producing CD4:CD8, naïve and memory T cell counts reflective of younger animals, while high protein content was associated with more aged patterns [18]. Biochemical studies of blood showed that circulating branched chain amino acids and glucose were together strongly correlated with dietary protein and carbohydrate and health-related outcomes. Moreover, in vitro experiments using similar combinations of concentrations of branched chain amino acids and glucose as found in vivo, generated changes in nutrient sensing pathways in cell lines, showing a clear link between diet, circulating metabolomics andcellular response [10, 19].
At the cellular and cytokine level, GFN allowed us to determine that the major nutrient sensing pathway, mTOR, was driven by the ratio of dietary protein and carbohydrate and more proximally by the ratio of the branched chain amino acids and glucose bathing the hepatocytes. A second nutrient sensing pathway, IGF-1, was primarily driven by dietary energy content, while FGF21 was dramatically increased by low protein intakes, especially when coupled with high carbohydrate intakes [20].
The GFN mouse study and its mechanistic sub-studies illustrate how nutrition influences different life-history outcomes, physiological responses, microbiota, molecular pathways and health. More than this, however, GFN makes it possible to visualize the various outcomes across scales as topologies mapped onto the same array of multidimensional nutrient intakes, and to determine how those responses overlap and form a matrix of nutritionally-driven, interacting processes that govern responses to different nutritional challenges (Fig. 2). Accordingly, low protein, high carbohydrate diets are associated with lower relative abundance of Bacteroidetes, lower branched chain amino acids, lower mTOR activation, improved glucose tolerance and reduced testicular weight but heightened FGF21, increased CD4:CD8 ratio and increased lifespan. Although the responses at each scale differ to some degree in terms of their patterns of response to macronutrients and energy, the only diets that optimize each physiological scale for late-life health and lifespan were those with a low ratio of protein to carbohydrates. Such a conclusion is invisible to any other methodology.
Fig.2
A selection of surface plots from an experiment in which male and female mice were confined to one of 25 diets differing in protein, carbohydrate and fat content from weaning until either being culled at 15 month for cardio-metabolic phenotyping or until death by natural causes (see text for references). Thin-plate spline-fitted response surfaces are shown for protein vs carbohydrate (cut as a slice through the median for fat) from the full, 3-nutrient response topologies. Each full surface has its highest elevation for a given variable in the dark red area and its foothills in the dark blue regions. Plots A) and B) indicate intakes of food and total energy as a function of the concentrations of protein and carbohydrate in the diet. The food intake surface shows compensatory feeding responses for both protein and carbohydrate, with the former somewhat stronger than the latter, thereby driving elevated energy intake on low percent protein, high carbohydrate diets (P:C). [This effect, termed protein leverage, was more marked when protein was diluted by fat in the diet than with carbohydrate – see 10.] All other surfaces are mapped onto absolute average daily intakes for protein and carbohydrate, rather than dietary concentrations as in A) and B). Plots C) and D) show how body lean mass and percent fat mass were greatest on high P:C and low P:C diets, respectively, the latter reflecting increased energy intake driven by protein leverage. E) and F) indicate that dietary P:C has contrasting effects on two key life-history traits – lifespan and reproduction – with mice living longest on low P:C diets (as distinct from low P, high F diets, where they lived less long), but having highest values for indicators of reproductive function (in this case male testes mass) on higher P:C diets. Plots G) and H) map microbial relative abundances and illustrate the two major functional response types found across microbial taxa. Surfaces I) – L) map metabolic outcomes in mid-late life (15 months) and show how the longevity surface (E) accords with various cardio-metabolic health markers, including improved mitochondrial function, better glucose tolerance, low blood pressure and low triglycerides. Plots M) – P) next map components of nutrient signalling pathways, illustrating how associations can be made seamlessly across scales of response from life history and behaviour through to underlying molecular mechanisms.
![A selection of surface plots from an experiment in which male and female mice were confined to one of 25 diets differing in protein, carbohydrate and fat content from weaning until either being culled at 15 month for cardio-metabolic phenotyping or until death by natural causes (see text for references). Thin-plate spline-fitted response surfaces are shown for protein vs carbohydrate (cut as a slice through the median for fat) from the full, 3-nutrient response topologies. Each full surface has its highest elevation for a given variable in the dark red area and its foothills in the dark blue regions. Plots A) and B) indicate intakes of food and total energy as a function of the concentrations of protein and carbohydrate in the diet. The food intake surface shows compensatory feeding responses for both protein and carbohydrate, with the former somewhat stronger than the latter, thereby driving elevated energy intake on low percent protein, high carbohydrate diets (P:C). [This effect, termed protein leverage, was more marked when protein was diluted by fat in the diet than with carbohydrate – see 10.] All other surfaces are mapped onto absolute average daily intakes for protein and carbohydrate, rather than dietary concentrations as in A) and B). Plots C) and D) show how body lean mass and percent fat mass were greatest on high P:C and low P:C diets, respectively, the latter reflecting increased energy intake driven by protein leverage. E) and F) indicate that dietary P:C has contrasting effects on two key life-history traits – lifespan and reproduction – with mice living longest on low P:C diets (as distinct from low P, high F diets, where they lived less long), but having highest values for indicators of reproductive function (in this case male testes mass) on higher P:C diets. Plots G) and H) map microbial relative abundances and illustrate the two major functional response types found across microbial taxa. Surfaces I) – L) map metabolic outcomes in mid-late life (15 months) and show how the longevity surface (E) accords with various cardio-metabolic health markers, including improved mitochondrial function, better glucose tolerance, low blood pressure and low triglycerides. Plots M) – P) next map components of nutrient signalling pathways, illustrating how associations can be made seamlessly across scales of response from life history and behaviour through to underlying molecular mechanisms.](https://content.iospress.com:443/media/nha/2017/4-3/nha-4-3-nha170027/nha-4-nha170027-g002.jpg)
4Next steps towards using GFN as a tool in precision medicine
The case study presented above illustrates how GFN could be used to optimize diet composition to support specified metabolic, microbial and health outcomes. Ultimately, the aim is to translate this approach to humans for the design of targeted nutritional interventions for individuals, particular age groups and populations. To do this, it will be necessary to map the association between intakes of multiple nutrients (macro- and micro-nutrients) as well as other dietary constituents (e.g. fibre, plant secondary metabolites, prebiotics) and differentmeasures of health in selected study populations [21]. Having identified combinations of intakes that yield a desired outcome, the need is next to translate these stipulated intakes into combinations of foods, meals and dietary patterns. This translation from nutrients back to prescribed diets will need to factor in digestibility and bio-availability of nutrients within foods, individual food preferences, cultural and religious norms, economic constraints, and even the sustainability and environmental impacts of food production. Such a translation will be made possible because there is a near infinite number of combinations of different foods that will allow a specified mixture of nutrient intakes to be attained [3].
Realising the potential offered by GFN for ‘precision nutrition’ requires that we fill key knowledge gaps and provide a clear translational pathway from animal models to humans. We next consider some of these gaps and suggest some questions for future research to fill them (Table 1).
Table 1
Some questions for future research using the Geometric Framework for Nutrition
| 1. How do macronutrients and dietary energy influence microbiome and physiological responses across multiple scales and across thelife-course? How do these responses interact to meld a cogent organismal response to nutritional challenges and imbalances? |
| 2. What are the mechanisms linking nutritional variation, microbiome characteristics including microbial metabolites, and host metabolic and inflammatory responses? |
| 3. What are the differences (and similarities) across the nutritional landscape and downstream physiological responses between diet-related health outcomes including fatty liver, insulin resistance, obesity (and healthy obesity) and reproductive health? |
| 4. How do the quality and composition of macronutrients influence microbiome, physiological responses and health outcomes? |
| 5. How does the macronutrient composition of the diet influence responses to micronutrients, e.g. cholesterol and vitamin D? |
| 6. What are the dietary influences on microbiome, metabolomics, proteomics and circulating hormones and cytokines in humans with obesity related conditions including fatty liver, insulin resistance and obesity? |
| 7. What is the impact of genetic background and sex on responses to diet? |
| 8. Does healthy obesity exist in humans and can it be differentiated from unhealthy obesity on the basis of nutrition and/or the physiological and microbiomic responses to diet? |
| 9. Is there a physiological (multi-omic) signature that reflects dietary composition in mice and humans? |
| 10. Can a precision nutrition computational model be developed incorporating data generated by this research and other published data that can be harnessed for humans to titrate macro- and micro-nutrient requirements based on individual characteristics and health status? What is the best nutritional composition for optimization of health outcomes for individuals? |
| 11. What does a front-end technology platform for delivering precision nutrition to the public, patients and health professionals look like? |
4.1Mouse experiments
There remains a need for further work in model animal systems, notably the mouse.
4.1.1Quality of macronutrients
To date the GFN mouse study has emphasised the role of total macronutrients and energy on outcomes. Next, the GFN needs to be used to analyse macronutrient quality, by parsing the contributions of different sub-types of the major macronutrients to consider the role of amino acid balance in proteins (see [22]), and the ratio of different types of carbohydrates (simple sugars, starches and fibre) and fats (saturated, mono- and poly-unsaturated, omega-3 vs omega-6 PUFA, trans-fats). Such experiments can be guided by, and grounded in, the experiments undertaken to date, focusing on particular sub-regions of macronutrient space and expanding from single macronutrient dimensions to consider different types of macronutrients as separate dimensions in GFNmodels.
4.1.2Interactions between macronutrients and micronutrients
Micronutrients may have different effects depending on the background macronutrient and energy landscape and may interact with macronutrients and other micronutrients. GFN has been used to investigate interactions among macronutrients and micronutrients in invertebrate models (see [1]). Micronutrients can be incorporated into GFN designs as additional axes in the multidimensional space that includes other nutrients, or else mapped as response surfaces in macronutrient intake space to explore the correlations between the intakes of macro- and micro-nutrients. An example of the latter is that of Blumfield et al. who mapped micronutrient intakes onto estimates of the macronutrient proportions in the diet of a prospective cohort of pregnant women and showed clear associations with dietary macronutrients [23]. The responses to supplementation or restriction of micronutrients such as vitamin D or cholesterol for which there is abundant evidence of health impacts are likely be influenced by other components of the diet. This is critical, for example, for informing clinical advice about vitamin D, not only for bone and muscle health [24, 25], but for obesity-relateddiabetes mellitus [26].
4.1.3Gene by nutrient interactions
To date, GFN studies have ecompassed a wide range of species of invertebrates and vertebrates and have shown clear patterns in nutritional responses that reflect animals’ phylogeny (hence genetics) and ecology [1]. Studies in mice have employed mainly a single strain, C57 Bl/6. It is well documented that nutritional responses vary with mouse genotype (e.g. [27–29]). To explore the relationship between genes and nutrition will require studies which strategically sample regions of nutrients space across different genotypes, utilising genetic resources such as the Collaborative Cross mouse lines [30]. Additionally, different epigenetic backgrounds could potentially be incorporated into experimental designs, or at least used as a response measure to be mapped ontonutrient arrays [31, 32].
4.1.4Disease by nutrient interactions
The GFN can be harnessed to interpret the relationships between nutrition and obesity-related chronic diseases such as type 2 diabetes mellitus, fatty liver and some types of cancer. For example, observational and interventional dietary studies in diabetes and fatty liver have generated conflicting results with the only consistent finding across most studies being that reduced energy intake is associated with reduced risk of these disorders.
At the population level, there is as yet no strong evidence supporting an association between total carbohydrate as a proportion of dietary intake and risk of diabetes [33, 34]. However, composition of the carbohydrates appears important in diabetes risk; a number of studies report decreasing diabetes risk with increasing consumption of complex carbohydrates, whole grains and cereal fibre [35–37], suggesting that for metabolic health, the type of carbohydrate is most important. Once people have developed diabetes, lower glycaemic index food intake is associated with better control [38]. The interaction between the ratio of dietary protein to carbohydrate and diabetes has been reported in human studies. In their review Pedersen et al. [39], found a relationship between the risk of type 2 diabetes mellitus and long-term low carbohydrate, high protein, high fat diets[40, 41]. Where reported, animal based protein and diets had the worst effects, while vegetable-based proteins and diets nullified or reversed the associations. These results suggest that carbohydrates and protein, and the derivation of these macronutrients all influence the risk of type 2 diabetes.
The liver is one of the first organs to manifest the consequences of caloric excess, altered nutrient composition and reduced physical activity as evidenced by the development of non-alcoholic fatty liver disease (NAFLD) and non-alcoholic steatohepatitis (NASH). NAFLD is now the commonest liver disease worldwide, affecting approximately 25% of the population [42]. In some cases, NAFLD can lead to progressive hepatic inflammation and fibrosis resulting in cirrhosis, liver failure and cancer, such that NAFLD is now the second most common liver disease among individuals listed for liver transplantation in the United States [43]. The metabolic associations of NAFLD include obesity, dyslipidaemia, type 2 diabetes, hypertension and metabolic syndrome, all in large part, a consequence of unhealthy lifestyles and poor nutrition.
Since the liver is an important metabolic gateway, nutrient composition is critical to the outcome of NAFLD. However, the exact relationship between the two has not been adequately defined as disease progression is slow (over decades) and best assessed by invasive liver biopsy. Most data are thus confined to cross sectional studies, with virtually no longitudinal data relating diet composition to liver related health outcomes. What is known is that a western dietary pattern rich in take-away foods, red and processed meats, full fat dairy products, fried potatoes, refined cereals, confectionary, cakes, biscuits, sauces and dressings at 14 years of age, is associated with a greater risk of incident fatty liver disease at age 17. Conversely, a healthy diet rich in whole grains, fruit, vegetables, legumes, fish, fibre, folic acid, most micronutrients, and low in total and saturated fat and refined sugars is protective [44]. With regard to dietary macronutrient in relation to carbohydrate and fat, long-term studies suggest that on hypocaloric diets, high fat low carbohydrate and low fat high carbohydrate diets were equally effective in reducing liver lipid [45], while the same was demonstrated in a recent metanalysis for weight loss [46]. Small scale studies also suggest that a Mediterranean-type diet more effectively reduces liver lipid and improves insulin sensitivity in comparison to a low fat high carbohydrate diet [47]. An additional layer of complexity with regard to liver disease is that nutrient requirements change with disease stage, with end stage disease being a catabolic wasting state, where treatment is usually directed towards a high protein, high calorie salt restricted diet.
What we believe to be required next is to begin to integrate nutritional and dietary associations such as those detailed above, using GFN to map disease outcomes (fatty liver, type 2 diabetes, cancer, or whatever) as topologies in multidimensional nutrient space (Fig. 2).
4.2A method for formally classifying surface response topologies
A key requirement of GFN studies in which many different response surfaces are mapped onto common arrays of nutrient intakes is a new statistical approach to the classification and comparison of surface topologies. Traditional two-treatment experimental designs, such as diet restriction vs control treatments in aging, or high-fat vs chow-fed mice in diabetes research, can only explore three response outcomes – no change, an increase, or a decrease in response to treatment compared with control. By contrast, GFN surfaces may adopt many differently shaped topologies, and there is the potential to simplify these into a small number of types that can be used to infer fundamental underlying nutritional relationships. An example discussed above was the reduction down to two functional guilds of microbial abundance response to macronutrient intakes in mice [4]. That attribution was made by visual comparison of the relative abundance landscapes generated across a large number of bacterial taxa. Although the dichotomy was evident upon comparing surfaces by eye, a statistical approach is required that formalises such comparisons and allows multiple response surfaces to be classified and compared quantitatively, including extremely multi-variate omics data. Such a methodology is currently under development, based on analysis of parameters that define key topological features of individual response surfaces.
5Conclusion: A translational pathway from mouse and other models to humans
To date GFN has been used in both observational and experimental studies on humans and has already provided new insights into the dietary determinants of chronic diseases associated with obesity and aging [3, 12, 14, 48–50]. The detailed phenotypic mapping and identification of nutritional signatures made possible by extensive experiments in model systems such as fly and mouse has already informed the interpretation of observational data in humans and directed the design of experimental manipulations. Compared with model organisms, such experimental studies in humans are limited in the numbers of dietary treatments that are feasible to test. Nonetheless, GFN can be used to design experiments that efficiently explore not only the main effects of a given nutritional manipulation but also the interactions with other dietary components, thereby enhancing the potential for discovery and reducing the risk that outcomes are misattributed. Even beyond traditional model organisms, GFN research involving wildlife under field conditions, companion and food animals has proven instructive in illuminating the human condition – and vice versa [51]. The aim should be to continue to develop this translational pathway from non-human animals to humans and back again as new evidence emerges.
References
[1] | Simpson SJ , Raubenheimer D . The Nature of Nutrition: A Unifying Framework from Animal Adaptation to Human Obesity. Princeton: Princeton University Press, (2012) . |
[2] | Raubenheimer D, Simpson SJ, Mayntz D. Nutrition, ecology and nutritional ecology: Toward an integrated framework. Funct Ecol (2009) ;23: :4–16. |
[3] | Raubenheimer D , Simpson SJ . Nutritional ecology and human health. Annu Rev Nutr. (2016) ;36: :603–26. |
[4] | Holmes AJ , Chew YV , Colakoglu F , Cliff JB , Klaassens E , Read MN , Solon-Biet SM , McMahon AC , Cogger VC , Ruohonen K , Raubenheimer D , Le Couteur D , Simpson SJ . Diet-microbiome interactions in health are controlled via intestinal nitrogen source constraints. Cell Metab. (2017) ;25: (1):140–51. |
[5] | Kumar H , du Toit E , Kulkarni A , Aako J , Linderborg KM , Zhang Y , Nicol MP , Isolauri E , Yang B , Collado MC , Salminen S . Distinct patterns in human milk microbiota and fatty acid profiles across specific geographic locations. Front Microbiol. (2016) ;7: :1619. |
[6] | Leulier F , MacNeil LT , Lee W , Rawls JF , Cani PD , Schwarzer M , Zhao L , Simpson SJ . Integrative physiology: At the crossroads of nutrition, microbiota, animal physiology and human health. Cell Metab. (2017) ;25: (3):522–34. |
[7] | Piper MDW , Partridge L , Raubenheimer D , Simpson SJ . Dietary restriction and ageing: A unifying perspective. Cell Metab. (2011) ;14: (2):154–60. |
[8] | Simpson SJ , Raubenheimer D , Le Couteur DG . Putting the balance back in diet. Cell. (2015) ;161: (1):18–23. |
[9] | Lee KP , Simpson SJ , Clissold FJ , Brooks R , Ballard JWO , Taylor PW , Soran N , Raubenheimer D . Lifespan and reproduction in Drosophila: New insights from nutritional geometry. Proc Natl Acad Sci USA. (2008) ;105: (7):2498–503. |
[10] | Solon-Biet SM , McMahon AC , Ballard JWO , Ruohonen K , Wu LE , Cogger VC , Warren A , Pichaud N , Melvin RG , Gokarn R , Khalil M , Turner N , Cooney GJ , Sinclair DA , Raubenheimer D , Le Couteur DG , Simpson SJ . The ratio of macronutrients, not caloric intake, dictates cardiometabolic health, aging and longevity in ad libitum-fed mice. Cell Metab. (2014) ;19: (3):418–30. |
[11] | Solon-Biet SM , Mitchell SJ , de Cabo R , Raubenheimer D , Le Couteur DG , Simpson SJ . Macronutrients and caloric intake in health and longevity. J Endocrinol. (2015) ;226: (1):R17–28. |
[12] | Simpson SJ , Raubenheimer D . Obesity: The protein leverage hypothesis. Obesity Rev. (2005) ;6: (2):133–42. |
[13] | Sørensen A , Mayntz D , Raubenheimer D , Simpson SJ . Protein leverage in mice: Geometry of macronutrient balancing and consequences for fat deposition. Obesity. (2008) ;16: (3):566–71. |
[14] | Le Couteur DG , Solon-Biet SM , Cogger VC , Mitchell SJ , Senior AM , de Cabo R , Raubenheimer D , Simpson SJ . The impact of low protein, high carbohydrate diets on aging and lifespan. Cell Mol Life Sci. (2016) ;73: (6):1237–52. |
[15] | Raubenheimer D , Simpson SJ , Le Couteur DG , Solon-Biet SM , Coogan SCP . Nutritional ecology and the evolution of aging. Exp Gerontol. (2016) ;86: :50–61. |
[16] | Solon-Biet SM , Walters KA , Simanainen U , McMahon AC , Ruohonen K , Ballard JWO , Raubenheimer D , Handelsman DJ , Le Couteur DG , Simpson SJ . Macronutrient balance, reproductive function and lifespan in aging mice. Proc Natl Acad Sci USA. (2015) ;112: (11):3481–6. |
[17] | Wong ACN , Holmes A , Ponton F , Lihoreau M , Wilson K , Raubenheimer D , Simpson SJ . Behavioural microbiomics: A multi-dimensional approach to microbial influence on behaviour. Frontiers Microbiol. (2015) ;6: :1359. |
[18] | Le Couteur D , Wilder SM , Simpson SJ . The evolution of research on ageing and nutrition. J Gerontol Biol Sci Med Sci. (2014) ;69: (1):1–2. |
[19] | Wang TJ , Larson MG , Vasan RS , Cheng S , Rhee EP , Mccabe E , Lewis GD , Fox CS , Jacques PF , Fernandez C , O’Donnell CJ , Carr SA , Mootha VK , Florez JC , Souza A , Melander O , Clish CB , Gerszten RE . Metabolite profiles and the risk of developing diabetes. Nat Med. (2011) ;17: (4):448–53. |
[20] | Solon-Biet SM , Cogger VC , Heblinski M , Pulpitel TJ , Wahl D , McMahon AC , Warren A , Durrant-Whyte J , Walters KA , Krycer J , Ponton F , Ruohonen K , Conigrave A , James D , Raubenheimer D , Morrison CD , Le Couteur DG , Simpson SJ . Defining the nutritional and metabolic context of FGF21 using the Geometric Framework. Cell Metab. (2016) ;24: (4):555–65. |
[21] | Raubenheimer D , Gosby AK , Simpson SJ . Integrating nutrients, foods, diets, and appetites with obesity and cardiometabolic health. Obesity (Silver Spring). (2015) ;23: (9):1741–42. |
[22] | Piper MDW , Soultoukis GA , Blanc E , Mesaros A , Herbert SL , Juricic P , He X , Atanassov I , Salmonowicz H , Yang M , Simpson SJ , Ribeiro C , Partridge L . Matching dietary amino acid balance to the in silico-translated exome optimizes growth and reproduction without cost to lifespan. Cell Metab. (2017) ;25: (3):610–21. |
[23] | Blumfield M, Hure A, MacDonald-Wicks L, Smith R, Simpson SJ, Raubenheimer D, Collins C. The Association between the Macronutrient Content of Maternal Diet and the Adequacy of Micronutrients during Pregnancy in the Women and Their Children’s Health (WATCH) Study. Nutrients (2012) ;4: :1958–76. |
[24] | Girgis CM , Clifton-Bligh RJ , Hamrick MW , Holick MF , Gunton JE . The roles of vitamin D in skeletal muscle: Form, function, and metabolism. Endocr Rev. (2013) ;34: (1):33–83. |
[25] | Hirani V , Cumming RG , Blyth FM , Naganathan V , Le Couteur DG , Handelsman DJ , Waite LM , Seibel MJ . Vitamin D status among older community dwelling men living in a sunny country and associations with lifestyle factors: The Concord Health and Ageing in Men Project, Sydney, Australia. J Nutr Health Aging. (2013) ;17: (7):587–93. |
[26] | Boucher B. Vitamin D, obesity, and risk of diabetes. Lancet (2014) ;5: :361–2. |
[27] | Masson LF , McNeill G , Avenell A . Genetic variation and the lipid response to dietary intervention: A systematic review. Am J Clin Nutr. (2003) ;77: (5):1098–111. |
[28] | Rossmeisl M , Rim JS , Koza RA , Kozak LP . Variation in type 2 diabetes-related traits in mouse strains susceptible to diet-induced obesity. Diabetes. (2003) ;52: (8):1958–66. |
[29] | Liao C-Y , Rikke BA , Johnson TE , Diaz V , Nelson JF . Genetic variation in the murine lifespan response to dietary restriction: From life extension to life shortening. Aging Cell. (2010) ;9: (1):92–5. |
[30] | Churchill GA , Airey DC , Allayee H , Angel JM , Attie AD , Beatty J , Beavis WD , Belknap JK , Bennett B , Berrettini W , Bleich A , Bogue M , Broman KW , Buck KJ , Buckler E , Burmeister M , Chesler EJ , Cheverud JM , Clapcote S , Cook MN , Cox RD , Crabbe JC , Crusio WE , Darvasi A , Deschepper CF , Doerge RW , Farber CR , Forejt J , Gaile D , Garlow SJ , Geiger H , Gershenfeld H , Gordon T , Gu J , Gu W , de Haan G , Hayes NL , Heller C , Himmelbauer H , Hitzemann R , Hunter K , Hsu HC , Iraqi FA , Ivandic B , Jacob HJ , Jansen RC , Jepsen KJ , Johnson DK , Johnson TE , Kempermann G , Kendziorski C , Kotb M , Kooy RF , Llamas B , Lammert F , Lassalle JM , Lowenstein PR , Lu L , Lusis A , Manly KF , Marcucio R , Matthews D , Medrano JF , Miller DR , Mittleman G , Mock BA , Mogil JS , Montagutelli X , Morahan G , Morris DG , Mott R , Nadeau JH , Nagase H , Nowakowski RS , O’Hara BF , Osadchuk AV , Page GP , Paigen B , Paigen K , Palmer AA , Pan HJ , Peltonen-Palotie L , Peirce J , Pomp D , Pravenec M , Prows DR , Qi Z , Reeves RH , Roder J , Rosen GD , Schadt EE , Schalkwyk LC , Seltzer Z , Shimomura K , Shou S , Sillanpää MJ , Siracusa LD , Snoeck HW , Spearow JL , Svenson K , Tarantino LM , Threadgill D , Toth LA , Valdar W , de Villena FP , Warden C , Whatley S , Williams RW , Wiltshire T , Yi N , Zhang D , Zhang M , Zou F , Complex Trait Consortium. The Collaborative Cross, a community resource for the genetic analysis of complex traits. Nat Genet. (2004) ;36: (11):1133–7. |
[31] | Horvath S . DNA methylation age of human tissues and cell types. Genome Biol. (2013) ;14: :3156. |
[32] | Lee SG , Kaya A , Avanesov AS , Podolskiy DI , Song EJ , Go DM , Jin GD , Hwang JY , Kim EB , Kim DY , Gladyshev VN . Age-associated molecular changes are deleterious and may modulate life span through diet. Sci Adv. (2017) ;3: (2):e1601833. |
[33] | Salmerón J , Manson JE , Stampfer MJ , Colditz GA , Wing AL , Willett WC . Dietary fiber, glycemic load, and risk of non– insulin-dependent diabetes mellitus in women. JAMA. (1997) ;277: (6):472–7. |
[34] | Salmerón J , Ascherio A , Rimm EB , Colditz GA , Spiegelman D , Jenkins DJ , Stampfer MJ , Wing AL , Willett WC . Dietary fiber, glycemic load, and risk of NIDDM in men. Diabetes Care. (1997) ;20: (4):545–50. |
[35] | Meyer KA , Kushi LH , Jacobs DR Jr , Slavin J , Sellers TA , Folsom AR . Carbohydrates, dietary fiber, and incident type 2 diabetes in older women. Am J Clin Nutr. (2000) ;71: (4):921–30. |
[36] | Schulze MB , Liu S , Rimm EB , Manson JE , Willett WC , Hu FB . Glycemic index, glycemic load, and dietary fiber intake and incidence of type 2 diabetes in younger and middle-aged women. Am J Clin Nutr. (2004) ;80: (2):348–56. |
[37] | Sargrad KR , Homko C , Mozzoli M , Boden G . Effect of high protein vs high carbohydrate intake on insulin sensitivity, body weight, hemoglobin A1c, and blood pressure in patients with type 2 diabetes mellitus. J Am Diet Assoc. (2005) ;105: (4):573–80. |
[38] | Fontvieille AM , Rizkalla SW , Penfornis A , Acosta M , Bornet FRJ , Slama G . The use of low glycaemic index foods improves metabolic control of diabetic patients over five weeks. Diabet Med. (1992) ;9: (5):444–50. |
[39] | Pedersen AN , Kondrup J , Borsheim E . Health effects of protein intake in healthy adults: A systematic literature review. Food Nutr Res. (2003) ;57. 10.3402/fnr.v3457i3400.21245. |
[40] | Schulze MB , Schulz M , Heidemann C , Schienkiewitz A , Hoffmann K , Boeing H . Carbohydrate intake and incidence of type 2 diabetes in the European Prospective Investigation into Cancer and Nutrition (EPIC)-Potsdam Study. Br J Nutr. (2008) ;99: (5):1107–16. |
[41] | Sluijs I , Beulens JWJ , van der A DL , Spijkerman AMW , Grobbee DE , van der Schouw YT . Dietary intake of total, animal, and vegetable protein and risk of type 2 diabetes in the European Prospective Investigation into Cancer and Nutrition (EPIC)-NL study. Diabetes Care. (2010) ;33: (1):43–8. |
[42] | Younossi ZM , Koenig AB , Abdelatif D , Fazel Y , Henry L , Wymer M . Global epidemiology of nonalcoholic fatty liver disease-Meta-analytic assessment of prevalence, incidence, and outcomes. Hepatology. (2016) ;64: (1):73–84. |
[43] | Kim WR , Lake JR , Smith JM , Skeans MA , Schladt DP , Edwards EB , Harper AM , Wainright JL , Snyder JJ , Israni AK , Kasiske BL . OPTN/SRTR Annual Data Report: Liver. Am J Transplant. (2015) ;15: :S2:1–28. |
[44] | Oddy W , Herbison CE , Jacoby P , Ambrosini GL , O’Sullivan TA , Ayonrinde OT , Olynyk JK , Black LJ , Beilin LJ , Mori TA , Hands BP , Adams LA . The Western dietary pattern is prospectively associated with nonalcoholic fatty liver disease in adolescence. Am J Gastroenterol. (2013) ;108: (5):778–85. |
[45] | Yki-Järvinen H . Nutritional modulation of non-alcoholic fatty liver disease and insulin resistance. Nutrients. (2015) ;7: (11):9127–38. |
[46] | Hall KD , Guo J . Obesity energetics: Body weight regulation and the effects of diet composition. Gastroenterology. (2017) ;152: (7):1718–27. |
[47] | Ryan MC , Itsiopoulos C , Thodis T , Ward G , Trost N , Hofferberth S , O’Dea K , Desmond PV , Johnson NA , Wilson AM . The Mediterranean diet improves hepatic steatosis and insulin sensitivity in individuals with non-alcoholic fatty liver disease. J Hepatol. (2013) ;59: (1):138–43. |
[48] | Gosby AK , Conigrave AD , Lau NS , Iglesias MA , Hall RM , Jebb SA , Brand-Miller J , Caterson ID , Raubenheimer D , Simpson SJ . Testing protein leverage in lean humans: A randomised controlled experimental study. PLoS One. (2011) ;6: (10):e25929. |
[49] | Gosby AK , Conigrave AD , Raubenheimer D , Simpson SJ . Protein leverage and energy intake. Obes Rev. (2014) ;15: (3):183–91. |
[50] | Le Couteur DG , Solon-Biet S , Wahl D , Cogger VC , Willcox BJ , Willcox DC , Raubenheimer D , Simpson SJ . New Horizons: Dietary protein, ageing and the Okinawan ratio. Age Ageing. (2016) ;45: (4):443–7. |
[51] | Raubenheimer D, Machovsky-Capuska GE, Gosby AK, Simpson SJ. Nutritional ecology of obesity: from humans to companion animals. Brit J Nutr (2015) ;113: :S26–39. |


