Stage dependent nutritional regulation of transgenerational longevity
Abstract
BACKGROUND: Statistical analyses in human populations have associated limited food availability during development with increased longevity of next generations. In support, recent findings in Caenorhabditis elegans revealed nutritional effects on transgenerational longevity.
OBJECTIVES: In this study we tested the effect of nutrition on longevity of future generations in Drosophila and whether this is sex-specific.
METHODS: We reared male larvae and adults of Drosophila under different food conditions and performed lifespan analyses in F2 generation.
RESULTS: Grandsons of males which experienced starvation through larval stages were long-lived and grandsons of well fed larvae were short lived, in two Drosophila strains. In one strain, the nutritional effect on transgenerational longevity was transmitted through male line. Interestingly, we find that dietary restriction in adult males is the main nutritional condition affecting lifespan of grandsons.
CONCLUSIONS: Our findings suggest that nutritional regulation of transgenerational longevity is evolutionarily conserved and developmental stage – dependent in Drosophila.
Abbreviations
IIS | greaterthan Insulin/insulin like signaling |
Igf | greaterthan Insulin growth factor |
1Introduction
Discovery of single genetic mutations that increase lifespan in animal model systems established aging research as one of the most fascinating and rapidly evolving scientific fields. Such mutations were rapidly linked to reduced insulin-insulin like signaling pathway (IIS) [1–3] and since then, several genes, signaling pathways, dietary interventions and drugs, often converging into common lifespan-extending mechanisms, have been shown to affect aging [4]. Importantly, most of these lifespan-extending factors seem to have an evolutionarily conserved anti-aging role, thus making their manipulation a promising method to delay aging and increase healthy lifespan in humans. However, recent findings offer new insights on longevity regulation; nutritional state can have a transgenerational impact on future generations’ longevity.
As such, statistical analyses of human famines indicate food availability as a transgenerational regulator of longevity. Historical data analyses linking food availability and mortality of several generations (Överkalix study), revealed a strong association of longevity with ancestors’ diet during the slow growth period (SGP) in mid childhood (9–12 years) [5, 6]. Specifically, the grandsons, but not the granddaughters, of paternal grandfathers who had experienced low food supply during the SGP exhibited lower mortality rates. Similarly, paternal grandmother’s food supply had some tendency to be linked with reduced granddaughters’, but not grandsons’, mortality. In summary, this study showed for the first time that food supply during a specific period of human development can affect mortality of next generations. Importantly, recent findings have associated starvation with transgenerational longevity in Caenorhabditis elegans [7], thus showing for the first time experimentally that nutrition can regulate longevity of future generations.
2Materials and methods
We used two laboratory-adapted strains, Canton Special (CS) and white Dahomey (wDah), maintained on a 12 hours lights on/12 hours dark cycle at 25°C. Standard food contained: 65 gram/lt cornmeal, 23 gram/lt sugar, 10 gram/lt agar, 56 gram/lt dry yeast, 16 ml/lt nipagin (10% in ethanol), 4 ml/lt propionic acid. Larvae were reared in food with different yeast concentrations as follows: Flies laid eggs in sugar-agar petri dishes (5 gram agar, 40 ml apple juice and 5 ml propionic acid per 100 ml). Eggs were washed in PBS and 100 ul of eggs were placed in bottles with varying concentrations of yeast. These corresponded to 10% (starvation conditions), 50%, 100% and 200% of standard yeast concentration used in our laboratory (0.1, 0.5, 1.0 and 2.0 food respectively). Adult males (F0) were selected from each bottle and were massively crossed with virgin females reared under standard food (normally fed females). From their progeny we selected both virgin males (F1 males) and females (F1 females). These were separately crossed with normally fed females or males respectively. We then selected virgin males (F2 males) of these crosses and performed lifespan analysis under standardfood.
First, we analyzed lifespans of F2 males, derived from the male offspring of F0 males that were reared under different yeast concentrations (F2 parental males) and secondly we analyzed lifespans of F2 males derived from the daughters of these F0 males (F2 maternal males). F2 males were put in plastic vials in groups of twenty. For each food condition we analyzed at least 13 plastic vials and totally at least 260 flies. To measure lifespan, flies were transferred to new vials three times per week at which time deaths were scored.
Lifespan data were analyzed using ANOVA, with Graph Pad Prism 5.03 software (Graph Pad Prism Software Inc.). Multiple comparisons among strains were performed with one-way ANOVA with Dunnett’s Multiple Comparison test. Regression analysis was performed in Graph Pad Prism 5.03 software (Graph Pad Prism Software Inc.). Survivorship data were analyzed in Excel using the Log Rank test.
3Results and discussion
To test whether nutritional regulation of transgenerational longevity is a general, evolutionarily conserved rule underlying aging regulation in animals, we simulated the Överkalix study in flies, a powerful model organism for aging research. We reared larvae of a Drosophila melanogaster control, laboratory-adapted Canton Special (CS) strain under food conditions containing four yeast concentrations, 10%, 50%, 100% and 200% of standard fly food used in our laboratory (0.1, 0.5, 1.0 and 2.0). Yeast concentration alone sufficiently recapitulates the effect of food availability on flies’ lifespan [8] and lifespan of wild derived Drosophila strains is shown to respond to these yeast concentrations with a typical tent-shaped response, with the lowest one (0.1) representing starvation conditions. F0 males were classified in four groups based on rearing food conditions (groups F0 0.1, 0.5, 1.0 and 2.0) and massively crossed with females reared under standard food (1.0- normally fed). F1 males and females were crossed with normally fed flies and lifespan analysis was carried out in F2 virgin males. These were named as F2 (paternal) or F2 (maternal) depending on whether they derived from male or female offspring of the F0 males reared under different food conditions. They were also categorized as groups F2 0.1, 0.5, 1.0 and 2.0, based on the food rearing conditions of their ancestors.
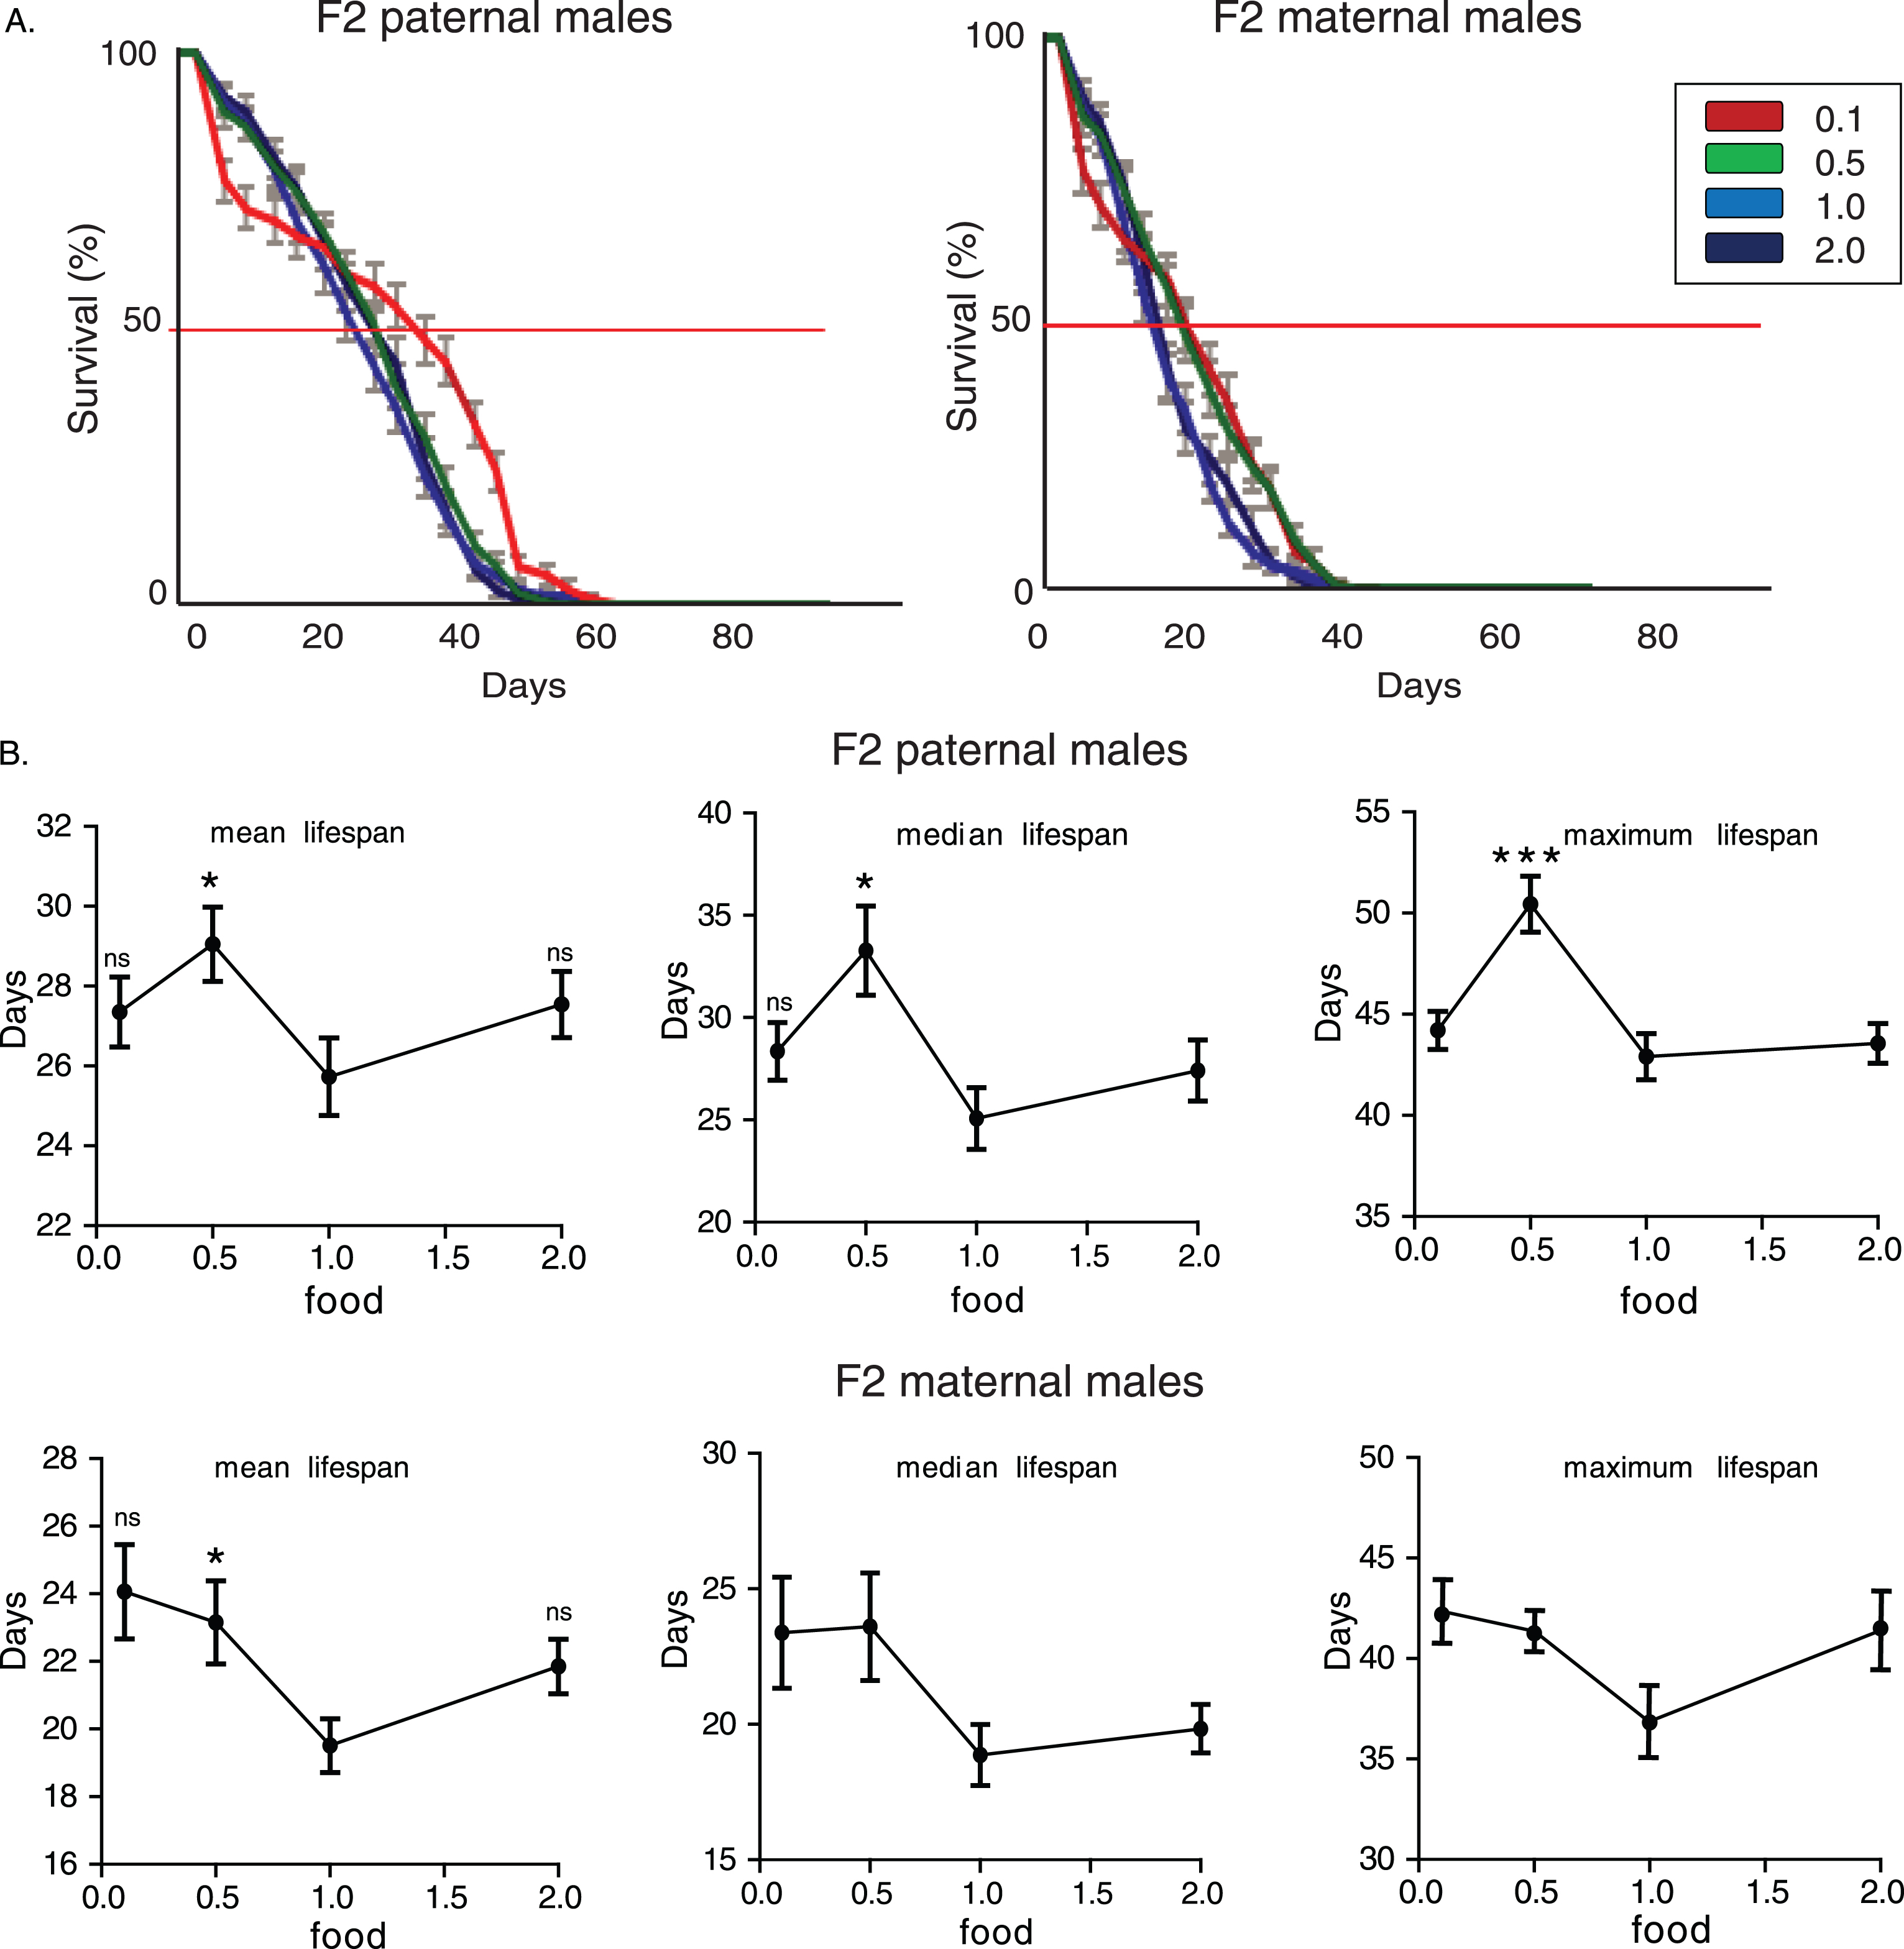
First, we measured lifespan of F2 males whose paternal grandfathers had experienced starvation through larval stages. F2 (paternal) 0.1 flies had the longest and 2.0 flies the shortest lifespan (Fig. 1A). Mean, median and maximum lifespan values were significantly influenced by paternal grandparents’ diet (for mean lifespan: p = 0.0008, F = 6.52, R2 = 0.2736, for median lifespan: p = 0.022, F = 5.53, R2 = 0.2421, for maximum lifespan: p = 0.019, F = 3.6, R2 = 0.172, one-way ANOVA) and F2 (paternal) 0.1 group had significantly higher mean and median lifespan values compared to the F2 parental 2.0 males (Fig. 1B).
To test if the above observations are caused by sex specific transgenerational mechanisms we performed similar analysis on maternal grandsons. The effects of ancestor’s diet during larval stages were even more robust on longevity of maternal grandsons (Fig. 1A and 1B). F2 (maternal) 0.1 flies had the longest and 2.0 flies the shortest lifespan. Again, mean, median and maximum lifespan values were significantly influenced by maternal grandparents’ diet and significantly correlated with shortage of food during development (for mean lifespan: p = 0.0001, F = 21.72, R2 = 0.5422, for median lifespan: p = 0.0001, F = 22.06, R2 = 0.5461, for maximum lifespan: p = 0.0011, F = 6.143, R2 = 0.2510, one-way ANOVA). Concluding, the poorest feeding conditions that we used (10% of standard yeast concentration, which corresponds to starvation conditions) to rear larvae of F0 males induced a significant lengthening of lifespan in F2 male offspring. Conversely, rich nutrients conditions had a robust shortening effect on longevity.
To further verify the nutritional effect on transgenerational longevity we repeated lifespan analysis in another laboratory adapted Drosophila strain, white Dahomey (wDah). F2 (paternal) 0.1 flies lived longer compared to the other three F2 (paternal) groups (Fig. 2A). No statistically significant differences were observed among lifespans of F2 (paternal) 0.5, 1.0 and 2.0 flies (p > 0.05, log rank test). Feeding through larval stages significantly affected mean and median, but not maximum lifespan (for mean lifespan: p = 0.0189, F = 3.611, R2 = 0.1671, for median lifespan: p = 0.0279, F = 3.275, R2 = 0.1539, for maximum lifespan: p = 0.0898, F = 2.28, R2 = 0.1124, one-way ANOVA) and F2 (paternal) 0.1 group had significantly higher mean and median lifespan values (Fig. 2B). Interestingly though, feeding through larval stages did not exert lifespan effects on F2 maternal grandsons (p > 0.05, log rank test, for mean lifespan: p = 0.84, F = 0.2785, R2 = 0.014, for median lifespan: p = 0.87, F = 0.2263, R2 = 0.011980, for maximum lifespan: p = 0.8307, F = 0.2924, R2 = 0.0154, one-way ANOVA). Thus, we conclude that starvation-induced transgenerational effects on longevity passed only through male line in wDah strain (Fig. 2A and B).
We then subjected adult F0 males belonging to the CS strain into different food regimes, to test if nutritional effects on transgenerational longevity are exclusively generated through larval developmental stages. As depicted in Fig. 3A, in both experiments with F2 paternal and maternal grandsons, dietary restriction induced the highest lifespan-extending effect on males grandsons’ longevity (p < 0.05, log rank test). Although F2 (maternal) 0.1 flies were equally long lived as F2 (maternal) 0.5 flies (F2 maternal 0.1 vs. 0.5 flies p > 0.05, log rank test), in F2 paternal flies only dietary restriction induced enhanced longevity in F2 (F2 paternal 0.1 vs. 0.5 flies p < 1.48×10⁻⁹, log rank test). Nutrition through adulthood significantly affected lifespan values (For F2 paternal males, median lifespan: p = 0.0105, F = 4.05, R2 = 0.1555, for maximum lifespan: p = 10–4, F = 9.668, R2 = 0.3053. For F2 maternal males, mean lifespan: p = 0.0247, F = 3.397, R2 = 0.1665, median lifespan: p = 0.089, F = 2.295, R2 = 0.1189, maximum lifespan: p = 0.0742, F = 2.449, R2 = 0.1259, one-way ANOVA) (Fig. 3B). Hence, adult specific nutritional effects can also induce enhanced transgenerational longevity; however, it is dietary restriction and not starvation that has the major impact on future generations’lifespan.
Lifespan response to dietary restriction fits in a polynomial equation, but response of F2 males’ lifespan to F0 larval feeding conditions did not fit in such a model. The former has been previously shown to fit a third-order polynomial (cubic) model, described by the equation: Y = B0 + B1*X + B2*X2 + B3*X 3 [9]. Non-linear regression analysis showed that goodness of fit was low for all models tested (For wDah strain; first order polynomial: R² = 0.08639 and 0.03723, second order polynomial: R² = 0.1234 and 0.1403, third order polynomial: R² = 0.1556 and 0.1539, fourth order polynomial: R² = 0.1556 and 0.1539, for mean and median lifespans respectively). Hence, transgenerational influence of larval feeding on F2 male offspring’s lifespan does not fit a polynomial equation and does not mimic the pattern of lifespan response to dietary restriction.
Nutritional state can affect future generations through specific mechanisms; diet can generate transgenerationally heritable rDNA rearrangements in flies [10], caloric restriction can induce histone modification, as also DNA methylation [10–12] and parental diet can affect cholesterol and lipid metabolism in offspring, through DNA methylation in mammals [11]. Interestingly, IIS pathway and nutritional alterations have similar effects on rDNA in flies, thus making IIS pathway a putative mediator of starvation-induced transgenerational phenomena. In support, insulin growth factor (Igf) gene can be regulated by DNA methylation and parental imprinting [13, 14]. IIS pathway downregulation and dietary restriction are the most reliable ways to extend lifespan in yeast, worms, flies and mammals, but also to improve health, even in aged humans [15, 16]. For this, we predict that nutritional effects at specific developmental stages in flies and humans might change activity of genes affecting nutrient-sensing pathways, such as IIS, which, in turn, affect lifespan in future generations.
It has been suggested that Y- and X-chromosomes might control epigenetic effects by altering the chromatin structure on other chromosomes [16, 17]. Drosophila genes can be methylated [18] and imprinted [19]. Moreover, the Y chromosome alters expression of several X-linked and autosomal genes affecting, among others, lipid and mitochondrial metabolism [20]. Such trans-chromosomal epigenetic effects imposed by the Y chromosome could explain the sex-specific lifespan increase observed in F2 males of the wDah. However, in CS flies transgenerational lifespan increase was not affected by female interference in F1. Drosophila strains, including wDah and CS, have been previously reported to differ regarding the nutritional range affecting longevity and sex-specific factors differentially influence lifespan extending factors X genotype interactions among strains [21, 22]. Identification of the molecular mechanisms underlying nutritional effects on transgenerational longevity in flies is a prerequisite to understand sex-specific transgenerational lifespan increase of wDah.
In worms, specific heritable chromatin modifications, affecting epigenetics, are shown to induce transgenerational inheritance of longevity [23]. Furthermore, a recent study showed that starvation can transgenerationally increase longevity through expression and transmittance of small RNAs. Interestingly, these RNA molecules target metabolism-related genes [24]. In conclusion, dietary conditions seem to alter activity of metabolic pathways through DNA methylation, histone modifications or small regulatory RNAs molecules production. We hypothesize that such alterations underlie transgenerational longevity effects of starvation.
Interestingly, despite starvation during larval stages being the effector of transgenerational lifespan increase in F2, dietary restriction seem to be the equivalent effector during adulthood. In the case of F2 maternal males, starvation had a similar lifespan effect to dietary restriction. Hence, we could presume that, during adulthood, the range of nutrients shortage, which suffices for generation of transgenerational longevity effects, differs through development. In adults, a narrower reduction in nutrients might be necessary for generation of longevity effects in future generations.
Here for the first time we show that Drosophila lifespan can be transgenerationally regulated. We found that starvation during development can transgenerationally increase lifespan in flies, as it has been previously reported in humans and worms. We assume that this is an evolutionarily conserved mechanism of lifespan regulation in animals. Moreover, our findings revealed a sex-specific mode for this regulation in one of the strains tested, similarly to what has been observed in humans. This implicates common mechanisms underlying lifespan extension in flies and humans. Therefore, we believe that Drosophila is suitable as an experimental platform to study epigenetic alterations that increase life expectancy and identify genes that regulate human aging. Reversibility and chemical manipulation of epigenetic alterations make them promising tools for the development of anti-aging treatments in humans. Our findings pave the way for further studies towards elucidating the molecular mechanisms by which limited nutrition increases transgenerational longevity, and assessing whether it enhances healthspan in addition to lifespan.
Acknowledgments
AM is supported by a standard Marie Curie intra-European individual fellowship.
References
[1] | Klass MR . A method for the isolation of longevity mutants in the nematode Caenorhabditis elegans and initial results. Mechanisms of Ageing and Development. (1983) ;22: (3-4):279–86. |
[2] | Kenyon C , Chang J , Gensch E , Rudner A , Tabtiang R . A C elegans mutant that lives twice as long as wild type. Nature. (1993) ;366: (6454):461–4. |
[3] | Clancy DJ , Gems D , Harshman LG , Oldham S , Stocker H , Hafen E , et al. Extension of life-span by loss of CHICO, a Drosophila insulin receptor substrate protein. Science. (2001) ;292: (5514):104–6. |
[4] | Lopez-Otin C , Blasco MA , Partridge L , Serrano M , Kroemer G . The hallmarks of aging. Cell. (2013) ;153: (6):1194–217. |
[5] | Bygren LO , Kaati G , Edvinsson S . Longevity determined by paternal ancestors’ nutrition during their slow growth period. Acta Biotheoretica. (2001) ;49: (1):53–9. |
[6] | Pembrey ME , Bygren LO , Kaati G , Edvinsson S , Northstone K , Sjostrom M , et al. Sex-specific, male-line transgenerational responses in humans. European Journal of Human Genetics: EJHG. (2006) ;14: (2):159–66. |
[7] | Rechavi O , Houri-Ze’evi L , Anava S , Goh WS , Kerk SY , Hannon GJ , et al. Starvation-induced transgenerational inheritance of small RNAs in C. elegans. Cell. (2014) ;158: (2):277–87. |
[8] | Bass TM , Grandison RC , Wong R , Martinez P , Partridge L , Piper MD . Optimization of dietary restriction protocols in Drosophila. The Journals of Gerontology Series A, Biological Sciences and Medical Sciences. (2007) ;62: (10):1071–81. |
[9] | Metaxakis A , Partridge L . Dietary restriction extends lifespan in wild-derived populations of Drosophila melanogaster. PloS One. (2013) ;8: (9):e74681. |
[10] | Aldrich JC , Maggert KA . Transgenerational inheritance of diet-induced genome rearrangements in Drosophila. PLoS Genetics. (2015) ;11: (4):e1005148. |
[11] | Bacalini MG , Friso S , Olivieri F , Pirazzini C , Giuliani C , Capri M , et al. Present and future of anti-ageing epigenetic diets. Mechanisms of Ageing and Development. (2014) ;136-137: :101–15. |
[12] | Chouliaras L , van den Hove DL , Kenis G , Draanen M , Hof PR , van Os J , et al. Histone deacetylase 2 in the mouse hippocampus: Attenuation of age-related increase by caloric restriction. Current Alzheimer Research. (2013) ;10: (8):868–76. |
[13] | Carone BR , Fauquier L , Habib N , Shea JM , Hart CE , Li R , et al. Paternally induced transgenerational environmental reprogramming of metabolic gene expression in mammals. Cell. (2010) ;143: (7):1084–96. |
[14] | DeChiara TM , Robertson EJ , Efstratiadis A . Parental imprinting of the mouse insulin-like growth factor II gene. Cell. (1991) ;64: (4):849–59. |
[15] | Colman RJ , Anderson RM , Johnson SC , Kastman EK , Kosmatka KJ , Beasley TM , et al. Caloric restriction delays disease onset and mortality in rhesus monkeys. Science. (2009) ;325: (5937):201–4. |
[16] | Fontana L , Partridge L . Promoting health and longevity through diet: From model organisms to humans. Cell. (2015) ;161: (1):106–18. |
[17] | Nelson VR , Spiezio SH , Nadeau JH . Transgenerational genetic effects of the paternal Y chromosome on daughters’ phenotypes. Epigenomics. (2010) ;2: (4):513–21. |
[18] | Friberg U , Stewart AD , Rice WR . X- and Y-chromosome linked paternal effects on a life-history trait. Biology Letters. (2012) ;8: (1):71–3. |
[19] | Lyko F , Ramsahoye BH , Jaenisch R . DNA methylation in Drosophila melanogaster. Nature. (2000) ;408: (6812):538–40. |
[20] | Golic KG , Golic MM , Pimpinelli S . Imprinted control of gene activity in Drosophila. Current Biology: CB. (1998) ;8: (23):1273–6. |
[21] | Grandison RC , Wong R , Bass TM , Partridge L , Piper MDW . Effect of a standardised dietary restriction protocol on multiple laboratory strains of drosophila melanogaster. PloS One. (2009) ;4: (1):e4067. |
[22] | Spencer CC , Howell CE , Wright AR , Promislow DEL . Testing an ‘aging gene’ in long-lived Drosophila strains: Increased longevity depends on sex and genetic background. Aging Cell. (2003) ;2: (2):123–30. |
[23] | Lemos B , Araripe LO , Hartl DL . Polymorphic Y chromosomes harbor cryptic variation with manifold functional consequences. Science. (2008) ;319: (5859):91–3. |
[24] | Greer EL , Maures TJ , Ucar D , Hauswirth AG , Mancini E , Lim JP , et al. Transgenerational epigenetic inheritance of longevity in Caenorhabditis elegans. Nature. (2011) ;479: (7373):365–71. |
Figures and Tables
Fig.1
Starvation-induced transgenerational effect on longevity is evolutionarily conserved in Drosophila melanogaster. A) Lifespan curves of F2 males (CS strain) from paternal and maternal grandfathers exposed to different dietary conditions. F2 virgin males whose paternal grandfathers had experienced starvation through larval stages (F2 paternal 0.1 males) were long-lived compared to the other groups. F2 (paternal) 0.1 vs. 0.5: p < 1.2×10⁻⁴, F2 (paternal) 0.1 vs. 1.0: p < 0.014 and F2 (paternal) 0.1 vs. 2.0: p < 1.7×10⁻²¹, log rank test. Also, F2 virgin males whose paternal grandfathers were fed under the richest conditions through larval stages (F2 paternal 2.0 males) were the shortest lived compared to the other groups. F2 (paternal) 2.0 vs. 1.0: p < 1.7×10⁻⁹, F2 (paternal) 2.0 vs. 0.5: p < 5.7×10⁻⁷, log rank test. F2 virgin males whose maternal grandfathers had experienced starvation through larval stages (F2 maternal 0.1 males) were also long-lived compared to the other groups. F2 (maternal) 0.1 vs. 0.5: p < 7×10–14, F2 (maternal) 0.1 vs. 1.0: p < 1.6×10⁻¹⁴ and F2 (paternal) 0.1 vs. 2.0: p < 1×10–40, log rank test. On the contrary, the richest conditions of larval feeding (F2 maternal 2.0 males) led to significant lifespan reduction. F2 (paternal) 2.0 vs. 1.0: p < 1.3×10⁻¹¹, F2 (paternal) 2.0 vs. 0.5: p < 7×10–12, log rank test. Lifespan data shown are from a single trial. For each lifespan experiment n > 260. Error bars indicate SEM. B) Mean, median and maximum lifespan of F2 males from paternal and maternal grandfathers exposed to different dietary conditions. Grandparents’ feeding affected mean, median but not maximum lifespan in F2 paternal flies (the mean lifespan of the longest-lived 10% of flies); F2 (paternal) 0.1 vs. 2.0: p < 0.001, q = 4,404 and p < 0.001, q = 3.912, for mean and median lifespan respectively. Ancestor’s feeding affected more pronouncedly lifespan values in maternal grandsons (F2 maternal 0.1 vs. 0.5: p < 0.01, q = 3,739 and p < 0.01, q = 3,204 for mean and median lifespan respectively, F2 maternal 0.1 vs. 1.0: p < 0.001, q = 3,929 and p < 0.01, q = 3,465 for mean and median lifespan respectively, F2 maternal 0.1 vs. 2.0: p < 0.001, q = 8,067, p < 0.001, q = 8.081 and p < 0.001, q = 4.100 for mean, median and maximum lifespan. One-way ANOVA with Dunnett’s multiple comparison against F2 0.1 flies. For each lifespan experiment n > 13, **p < 0.01, ***p < 0.001. Error bars indicate SEM.
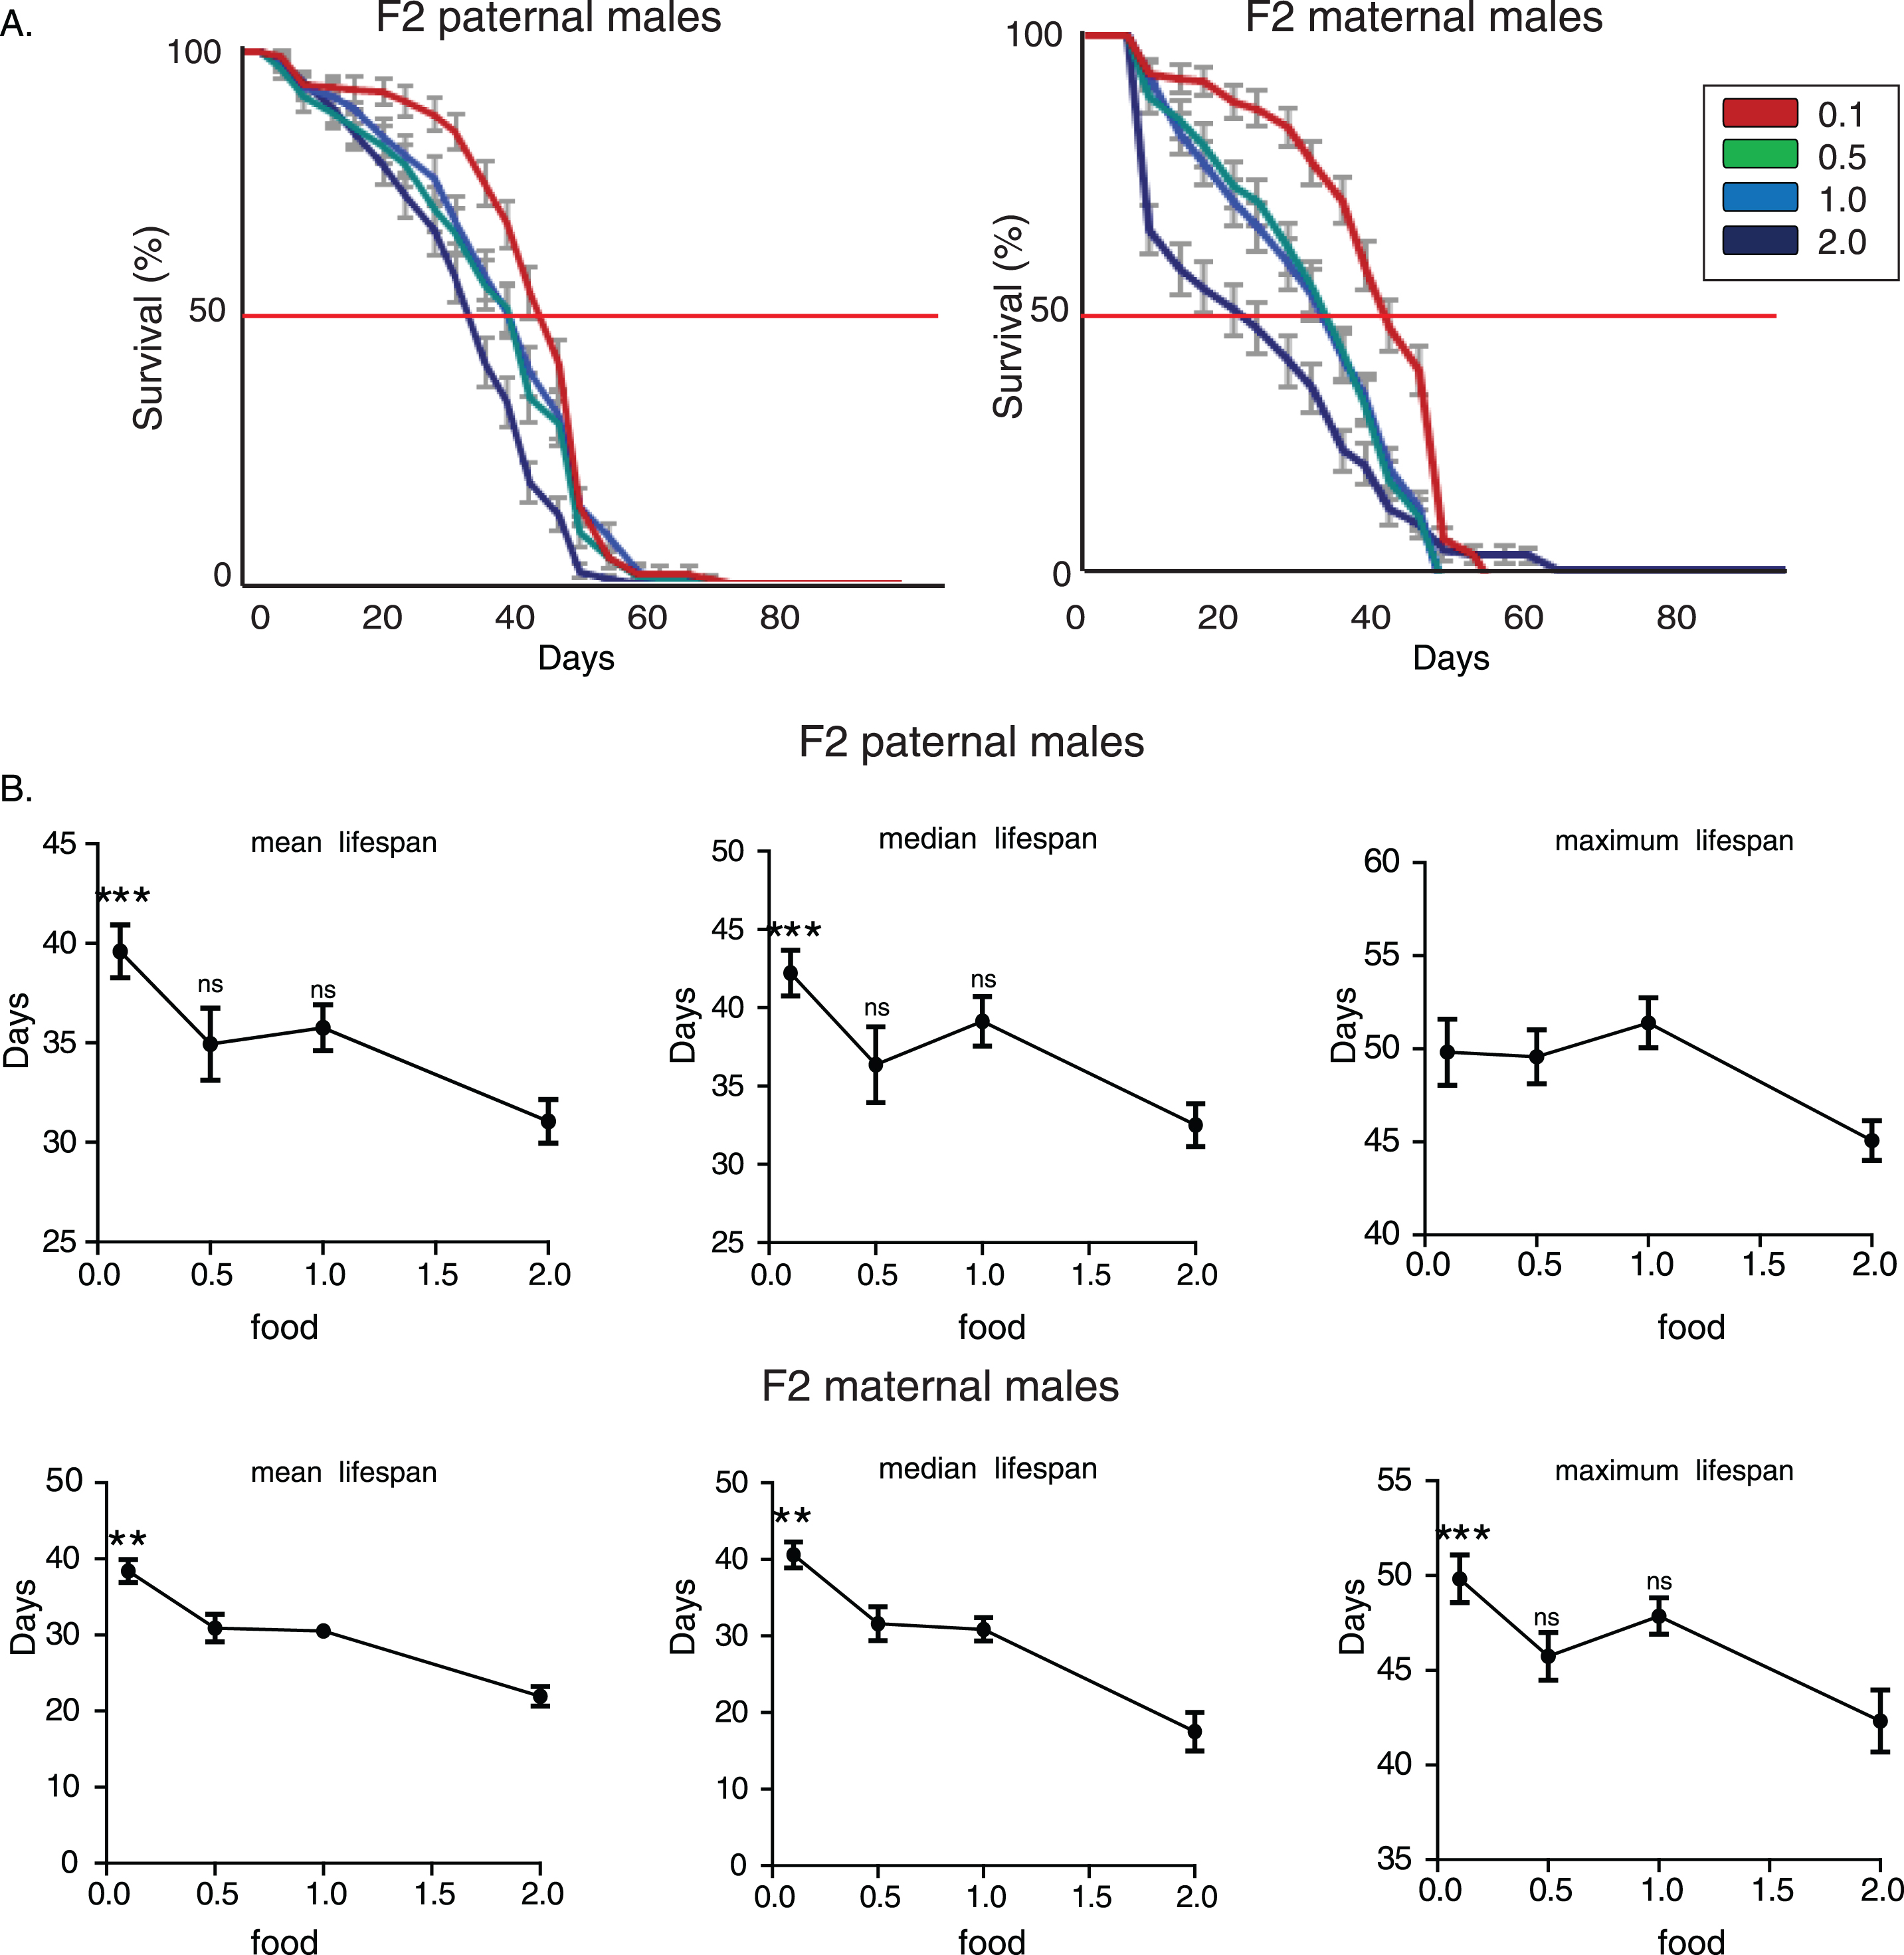
Fig.2
Nutritional regulation of transgenerational longevity in wDah strain is sex-specific. A) Lifespan curves of F2 males from paternal and maternal grandfathers subjected to different dietary regimes through larval stages. F2 virgin males whose paternal grandfathers had experienced starvation through larval stages (F2 paternal 0.1 males) were long-lived compared to the other groups. F2 (paternal) 0.1 vs. 0.5: p < 0.042, F2 (paternal) 0.1 vs. 1.0: p < 4×10⁻⁶ and F2 (paternal) 0.1 vs. 2.0: p < 0.0025, log rank test. Lifespan curves did not differ significantly in F2 virgin males whose maternal grandfathers were reared under different food conditions (F2 maternal males) (p > 0.05, log rank test). Lifespan data shown are from a single trial. For each lifespan experiment n > 260. Error bars indicate SEM. B) Mean, median and maximum lifespan of F2 males from paternal and maternal grandfathers exposed to different dietary conditions. Mean and median, but not maximum, lifespans were significantly increased in F2 parental males. F2 (paternal) 0.1 vs. 0.5: p < 0.05, q = 2.54, p < 0.05, q = 2.49 and p > 0.05, q = 0.356, F2 (paternal) 0.1 vs. 1.0: p < 0.05, q = 2.54, p < 0.05, q = 2.89 and p > 0.05, q = 1.696, F2 (paternal) 0.1 vs. 2.0: p < 0.05, q = 3, p > 0.05, q = 2.203 and p > 0.05, q = 1.548, for mean, median and maximum lifespan respectively. However, ancestor’s diet during larval stages did not significantly affect lifespan of F2 maternal males. One-way ANOVA with Dunnett’s multiple comparison against F2 0.1 flies. For each lifespan experiment n > 13, *p < 0.05. Error bars indicate SEM.
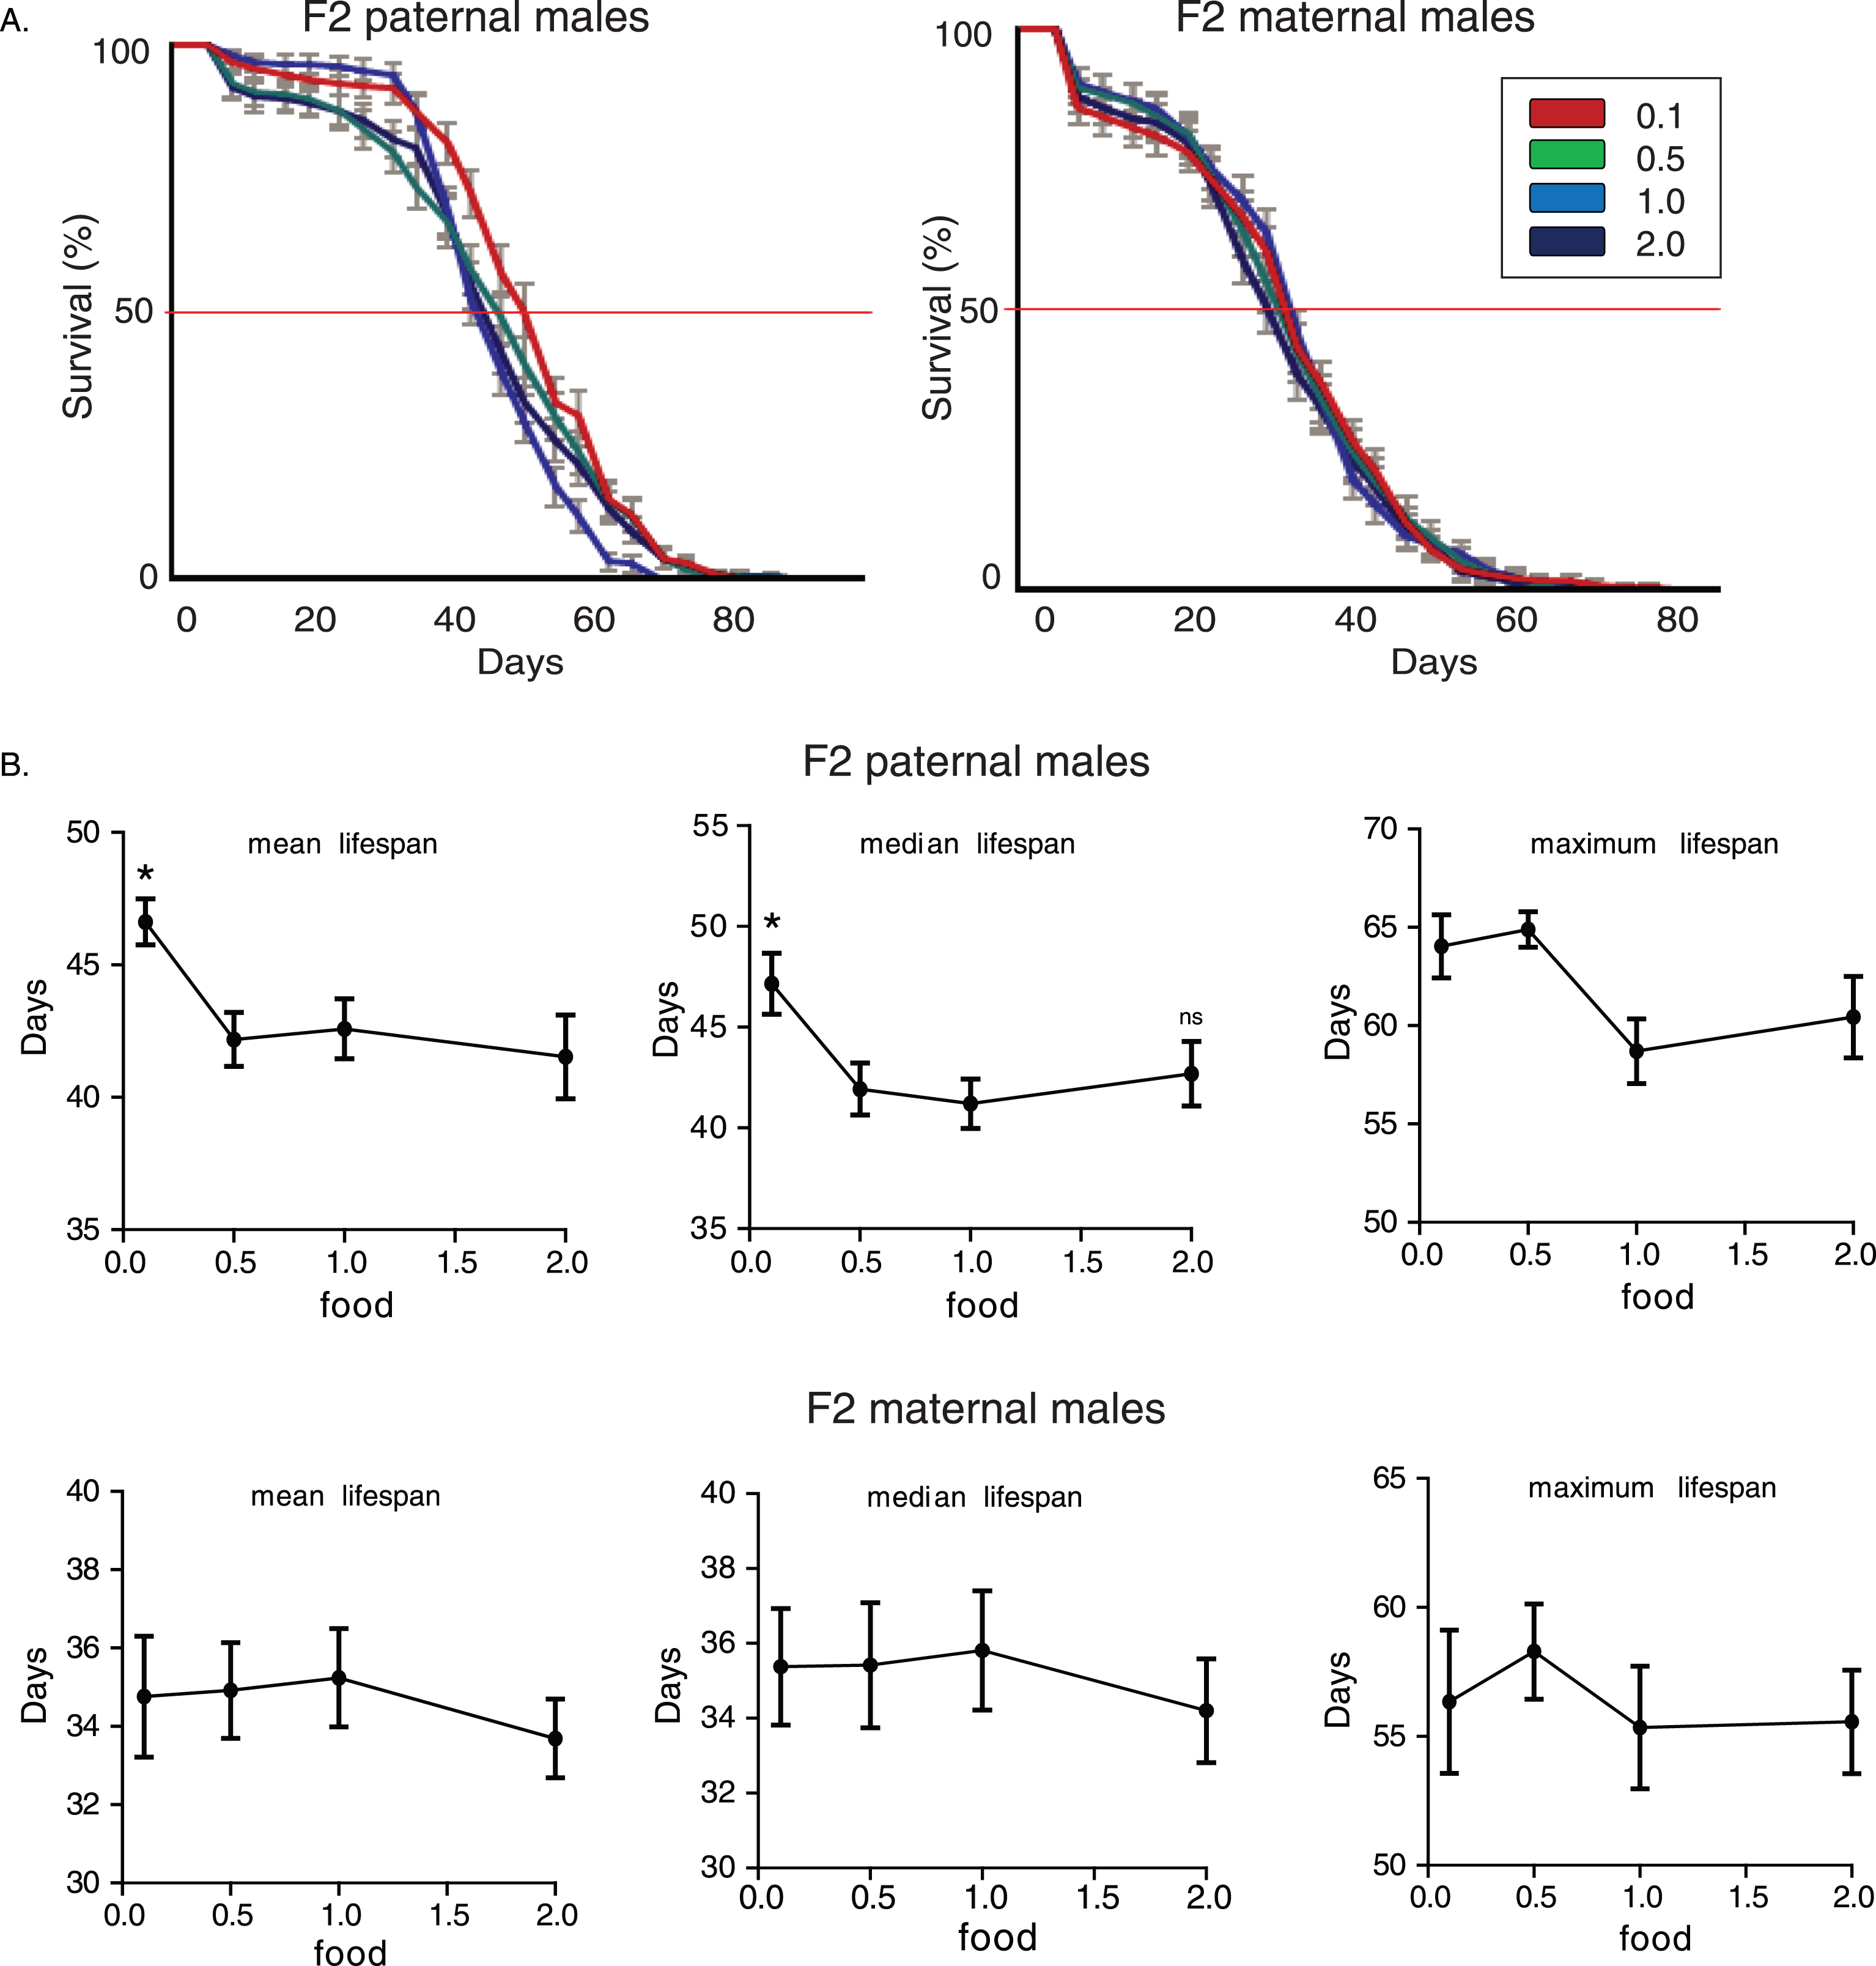
Fig.3
Dietary restriction during adulthood induces transgenerational effects on longevity. A) Lifespan curves of F2 males from paternal and maternal grandfathers subjected to different dietary regimes through adult stages. F2 virgin males whose paternal grandfathers had experienced starvation through adult stages lived longer; F2 (paternal) 0.1 vs.. 0.5: p < 1.47×10⁻⁹, F2 (paternal) 0.1 vs.. 1.0: p < 3.6×10⁻¹⁰ and F2 (paternal) 0.1 vs.. 2.0: p < 3×10–12, log rank test. In F2 maternal males, dietary restriction and starvation of F0 males induced similar effects; F2 (maternal) 0.5 vs. 0.1: p > 0.9, F2 (maternal) 0.5 vs. 1.0: p < 8×10⁻⁷, F2 (maternal) 0.5 vs. 2.0: p < 0.0049, F2 (maternal) 0.1 vs. 1.0: p < 1×10⁻⁶, F2 (maternal) 0.1 vs. 2.0: p < 0.0049, log rank test. Lifespan data shown are from a single trial. For each lifespan experiment n > 260. Error bars indicate SEM. B) Mean, median and maximum lifespan of F2 males from paternal and maternal grandfathers exposed to different dietary conditions during adulthood. F2 (paternal) 0.5 vs. 0.1: p < 0.001, q = 4.097, for maximum lifespan, F2 (paternal) 0.5 vs. 1.0: p < 0.05, q = 2.512, p < 0.01, q = 3.326, p < 0.001, q = 4.6 for mean, median and maximum lifespan, F2 (paternal) 0.5 vs. 2.0: p < 0.05, q = 2.456 and p < 0.001, q = 4.34, for median and maximum lifespan. F2 (maternal) 0.5 vs. 1.0: p < 0.05, q = 2.457 for mean lifespan, F2 (maternal) 0.1 vs. 1.0: p < 0.05, q = 2.95, for mean lifespan, one-way ANOVA with Dunnett’s multiple comparison against F2 0.5 flies. For each lifespan experiment n > 13, *p < 0.05, ***p < 0.001. Error bars indicate SEM.