
TGF – beta 2 enriched formula as oral nutritional supplement in patients hospitalized for COVID-19: A preliminary observational study
Abstract
BACKGROUND:
SARS-COV 2 turned in a global epidemic since January 2020. It is able to directly stimulate the release of proinflammatory cytokines (cytokine storm) and, affecting enterocytis, dysregulates intestinal permeability likewise Inflammatory Bowel Diseases. According to Guidelines, nutritional support in COVID-19 patients is relevant in a perspective of a fast recovery. Aim of this study is to propose in SARS-COV2 patients an early nutritional support using a polymeric - TGF-beta2 containing formula, with immunoregulatory properties specific for bowel disease, evaluating its effects on systemic inflammation and protein energy malnutrition.
METHODS:
COVID-19 patients hospitalized in Santa Maria Hospital of Terni and in Madonna delle Grazie Hospital of Matera (March - December 2020) were enrolled. The protocol consists in supplying 150 gr of nutritional formula powder (750 kcal/day). Values of serum prealbumin, transferrin, C-reactive protein and Lymphocyte count were collected at baseline and every week. Data were compared to a untreated sample of inpatients.
RESULTS:
TGF-beta2 containing formula use seems to be associated to a lower needing and longer time free from steroid therapy, increasing of prealbumin and transferrin values and overall with a better outcome in exposed patients; higher values of serum prealbumin seemed to be associated with lower CRP. It does not induce gastrointestinal discomfort or worsen gastrointestinal symptoms.
CONCLUSIONS:
TGF-beta2 containing formula represents a valid nutritional support in COVID-19, preventing sarcopenia associated to hypercatabolic status and modulating inflammatory response probably thanks to specific properties of its nutritional components. This is only a preliminary observation: further investigations are on-going, involving several Italian Centers.
1Introduction
The 2019 Coronavirus outbreak (COVID-19) was declared a Public Health Emergency by the World Health Organization (WHO) on 30th January 2020 and SARS-COV2 has turned very rapidly in a global epidemic. Worldwide, scientists and researchers are fighting to find performing strategies and therapies. People with COVID-19 can be asymptomatic or paucisymptomatic with symptoms such as fever, cough and dyspnea. When COVID-19 involves the upper and lower respiratory tract, it can cause mild or acute respiratory syndrome resulting in the release of cytokines (cytokine storm), including interleukin IL -1β and IL-6 [1]. A biochemical pattern characterized by high proinflammatory cytokines values is observed and especially IL-6 is associated with an increased risk of severe evolution. SARS-COV 2 is able to directly stimulate the release of proinflammatory cytokines [2, 3]. Higher serum cytokines and chemokines levels are associated with severe respiratory distress, whereas uncomplicated SARS usually shows a reduced increase of inflammatory pattern [3, 4]. This variable picture of respiratory distress, in association with a high inflammatory response, compromises the nutritional status in the acute phase and contributes to muscle mass reduction and substrates depletion. As a consequence, a hyper-catabolic state onsets, leading to cachexia [5].
The European Society for Enteral and Parenteral Nutrition (ESPEN) has recently published clinical practice guidelines of nutritional management of SARS-COV2 infected people. It suggests that early identification of risk and presence of malnutrition should be carried out for all patients, especially for more frail subjects, in order to optimize their nutritional status; the use of Oral Nutritional Supplements (ONS) is encouraged when normal diet should not provide nutritional needs [6].
Emerging data support the theory that SARS-COV 2 via its receptor, ACE2, could directly infect enterocytes, disrupting intestinal permeability and leading to the leakage of gut microbes and associated metabolites into circulation [7]; this probable “gut-lung axis” leads to an unbalanced production of pro-inflammatory cytokines up to cytokine storm, that represents the pathophysiological basis of ARDS and, definitively, mortality [6, 8, 9]
Moreover, the pathogenesis of SARS-COV2 infection presents similarities with Inflammatory bowel diseases (IBD), both in deregulated immune response and in clinical manifestations [8, 10, 11] (Fig. 1). Considering those similarities, aim of our study - conducted at Santa Maria Hospital of Terni and Madonna delle Grazie Hospital of Matera Italy, and still ongoing as a multicentric study in many other Italian Centers- is to investigate the safety and efficacy of an oral supplementation with a TGFβ2 enriched formula in mitigating malnutrition and proinflammatory pattern in SARS-CoV-2 infected patients [12].
Fig. 1
Pathogenesis of SARS-COV2 and Inflammatory bowel diseases (IBD) similarities.
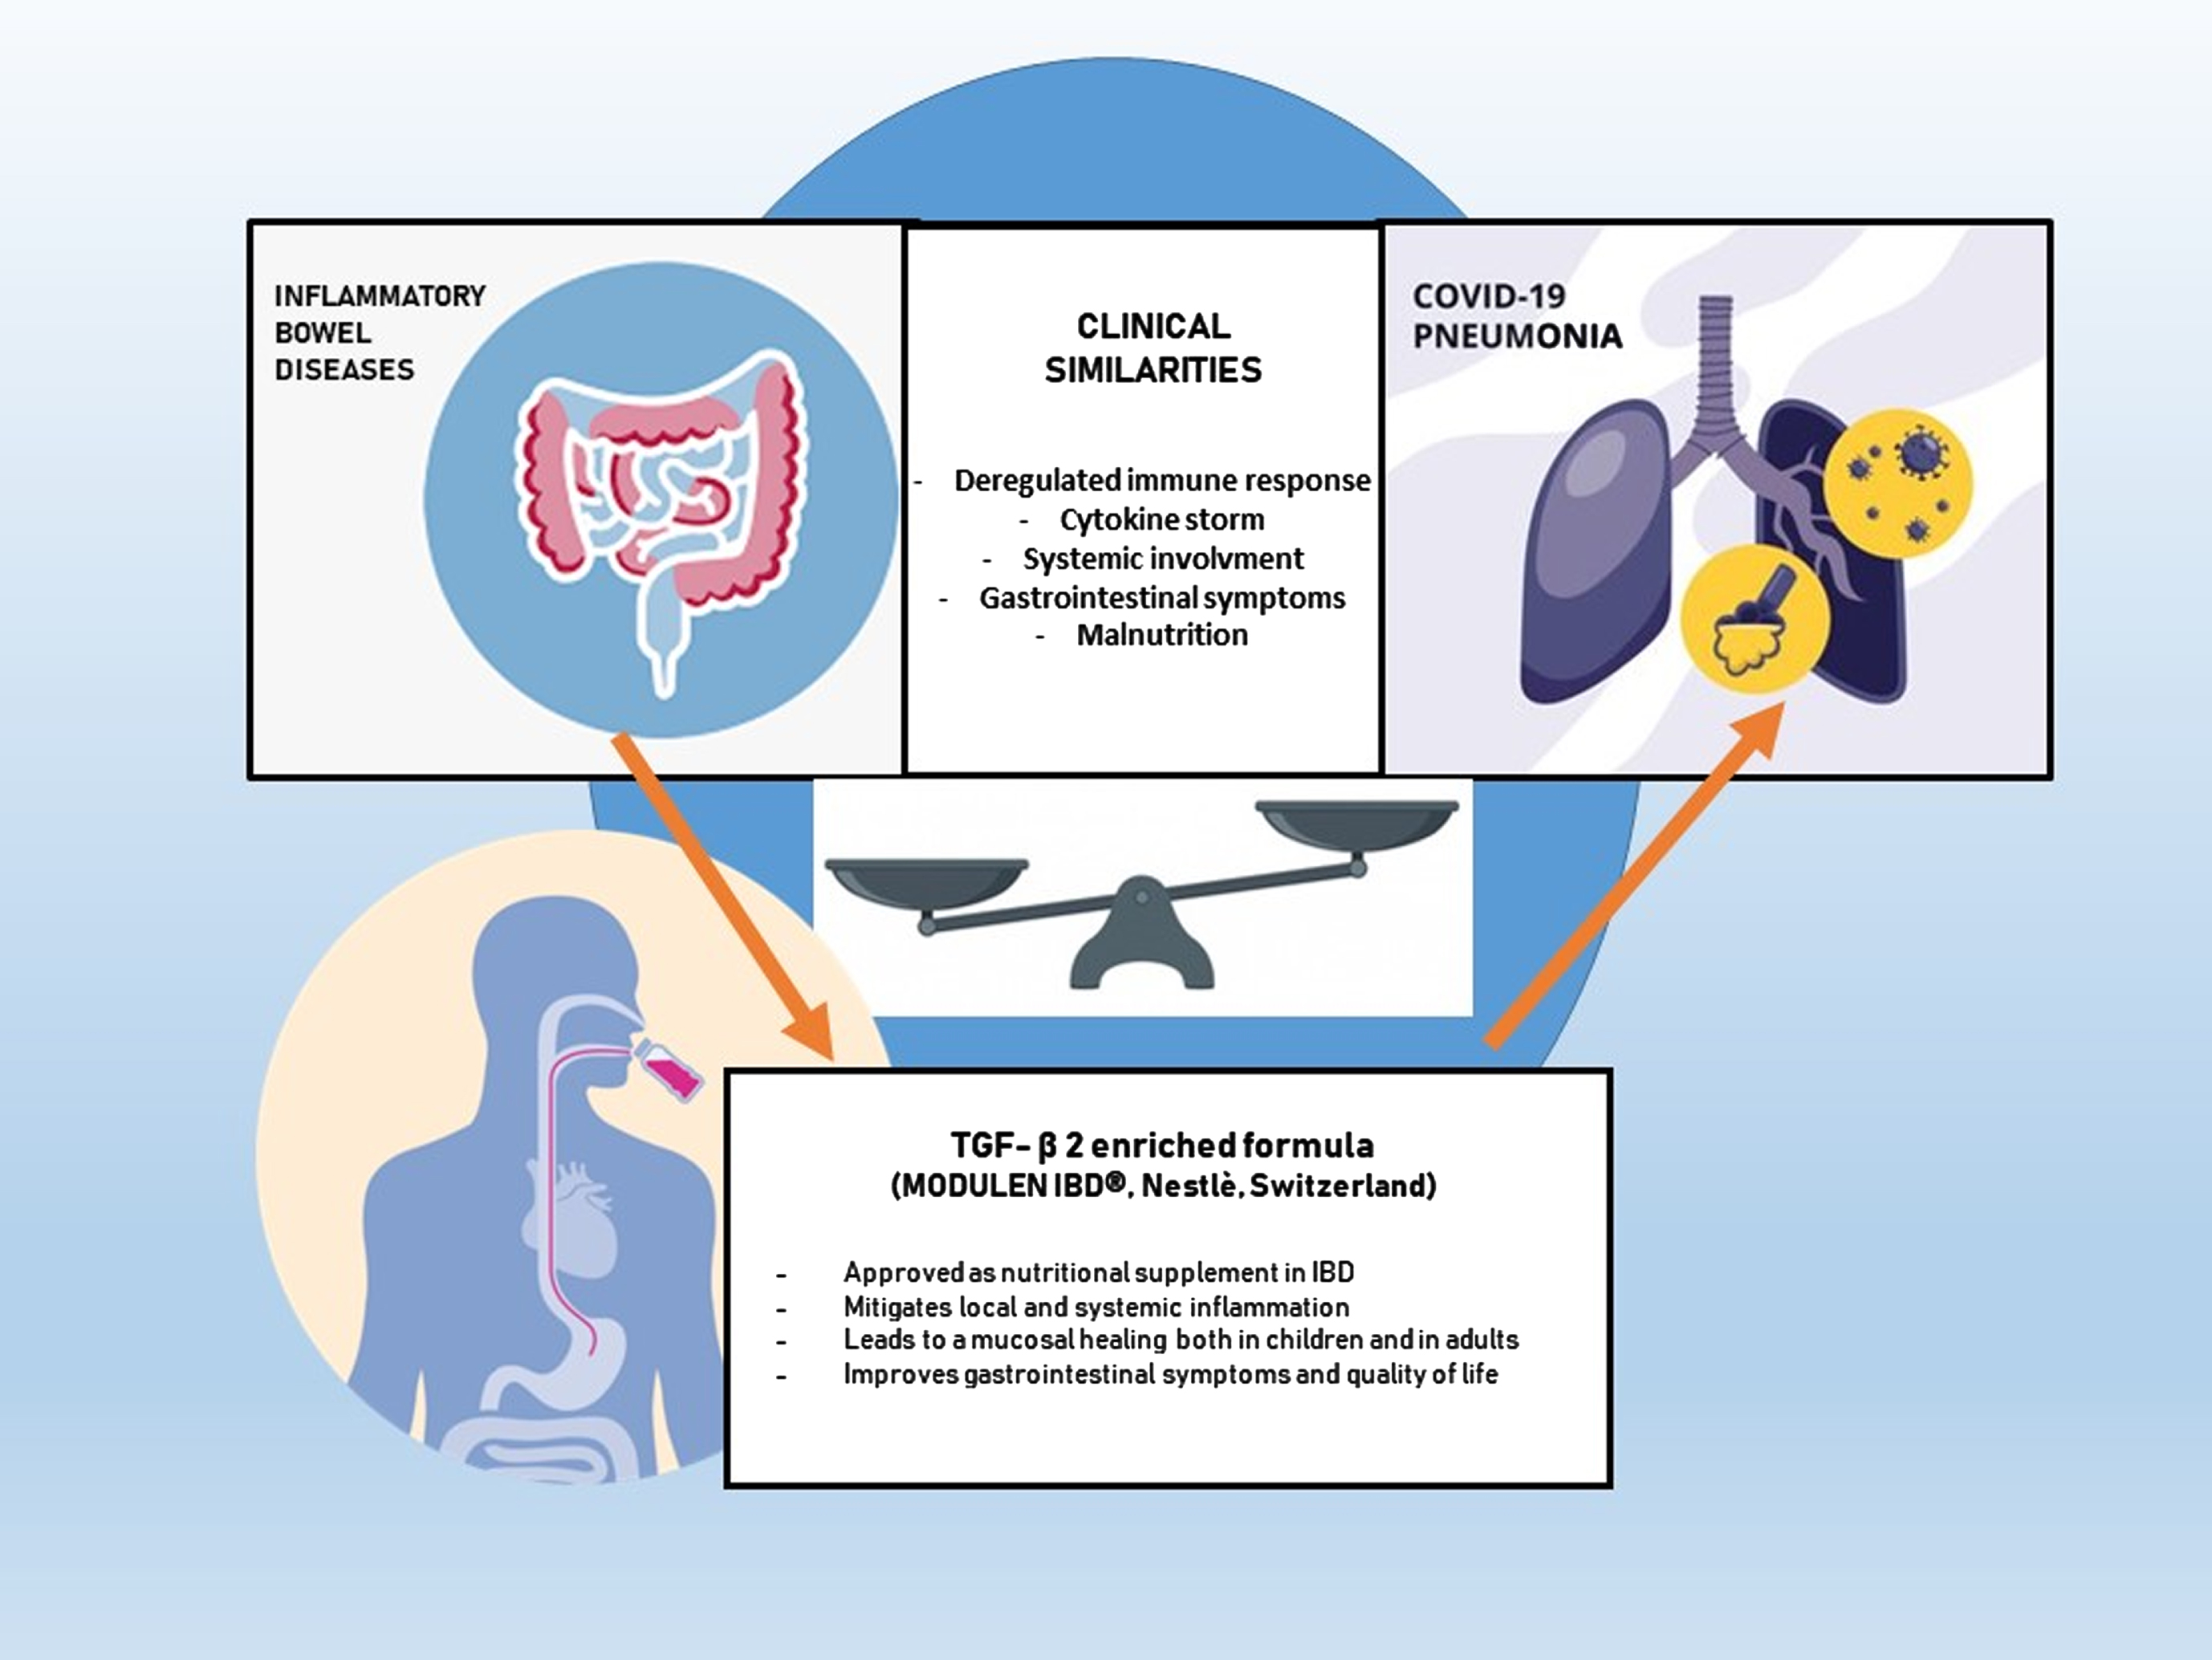
Within the available nutritional therapeutic strategies, a polymeric diet containing TGFβ2 has shown to lead to a significative reduction of inflammatory indexes in people affected by IBD [13]. The Transforming Growth Factors Beta2 (TGFβ2), naturally present in casein, is a complex of regulatory molecules produced by different cells including enterocytes and CD3 lymphocytes, well known for its effect on cell growth and differentiation and for its immunoregulatory effects. TGFβ2 exerts various autocrine or paracrine immunoregulatory activities in gut, counteracting production of proinflammatory cytokines, promoting the mucosal healing and improving immunotolerance [14].
The aim of this study was to evaluate the potential benefit of oral TGFβ2 enriched supplementation in patients hospitalized for COVID-19.
2Materials and methods
This is an observational, retrospective study approved by local Ethical Committee (Prot. 40830, 4/05/2020; Prot.20200021661, 8/06/2020). All consecutive patients hospitalized in Santa Maria Hospital of Terni (Internal Medicine Unit and Infectious Disease Unit, Department of Medicine) and in Madonna delle Grazie Hospital of Matera (Dietetics and Clinical Nutrition Unit and Infection Disease Unit) from March to December 2020 with an established diagnosis of COVID-19 were enrolled in the study, based on the following characteristics:
– patients able to take oral food and eat hospital meals (total or partial portions);
– patients in enteral tube feeding before hospitalization;
– patients with indications to start enteral feeding (hyporexia, dysphagia, concomitant neurological pathologies, advanced age);
– patients without respiratory support or under oxygen therapy (nasal-cannulas, oxygen masks –low fluxes 0–4 lt/min; high fluxes 6–10 lt/min)
– patients under treatment with C-PAP or non-invasive ventilation (NIV) only if these could be shortly interrupted for oral feeding.
To be included in the study, oral TGFβ2 supplementation had to be started within day 7 and continued for at least 15 days.
2.1Nutritional supplement
Our clinical team decided to use, as first line oral supplementation, a TGFβ2 enriched formula, MODULEN® (Nestlé Healthcare, Switzerland), currently approved for nutritional support in patient with IBD. Nutritional profile is: 44% of total energy by carbohydrates (mainly maltodextrins); 42% of total energy in fats (with a high percentage of MCT), 14% of energy provided by proteins (caseinates with high content of TGFβ2), gluten and lactose free.
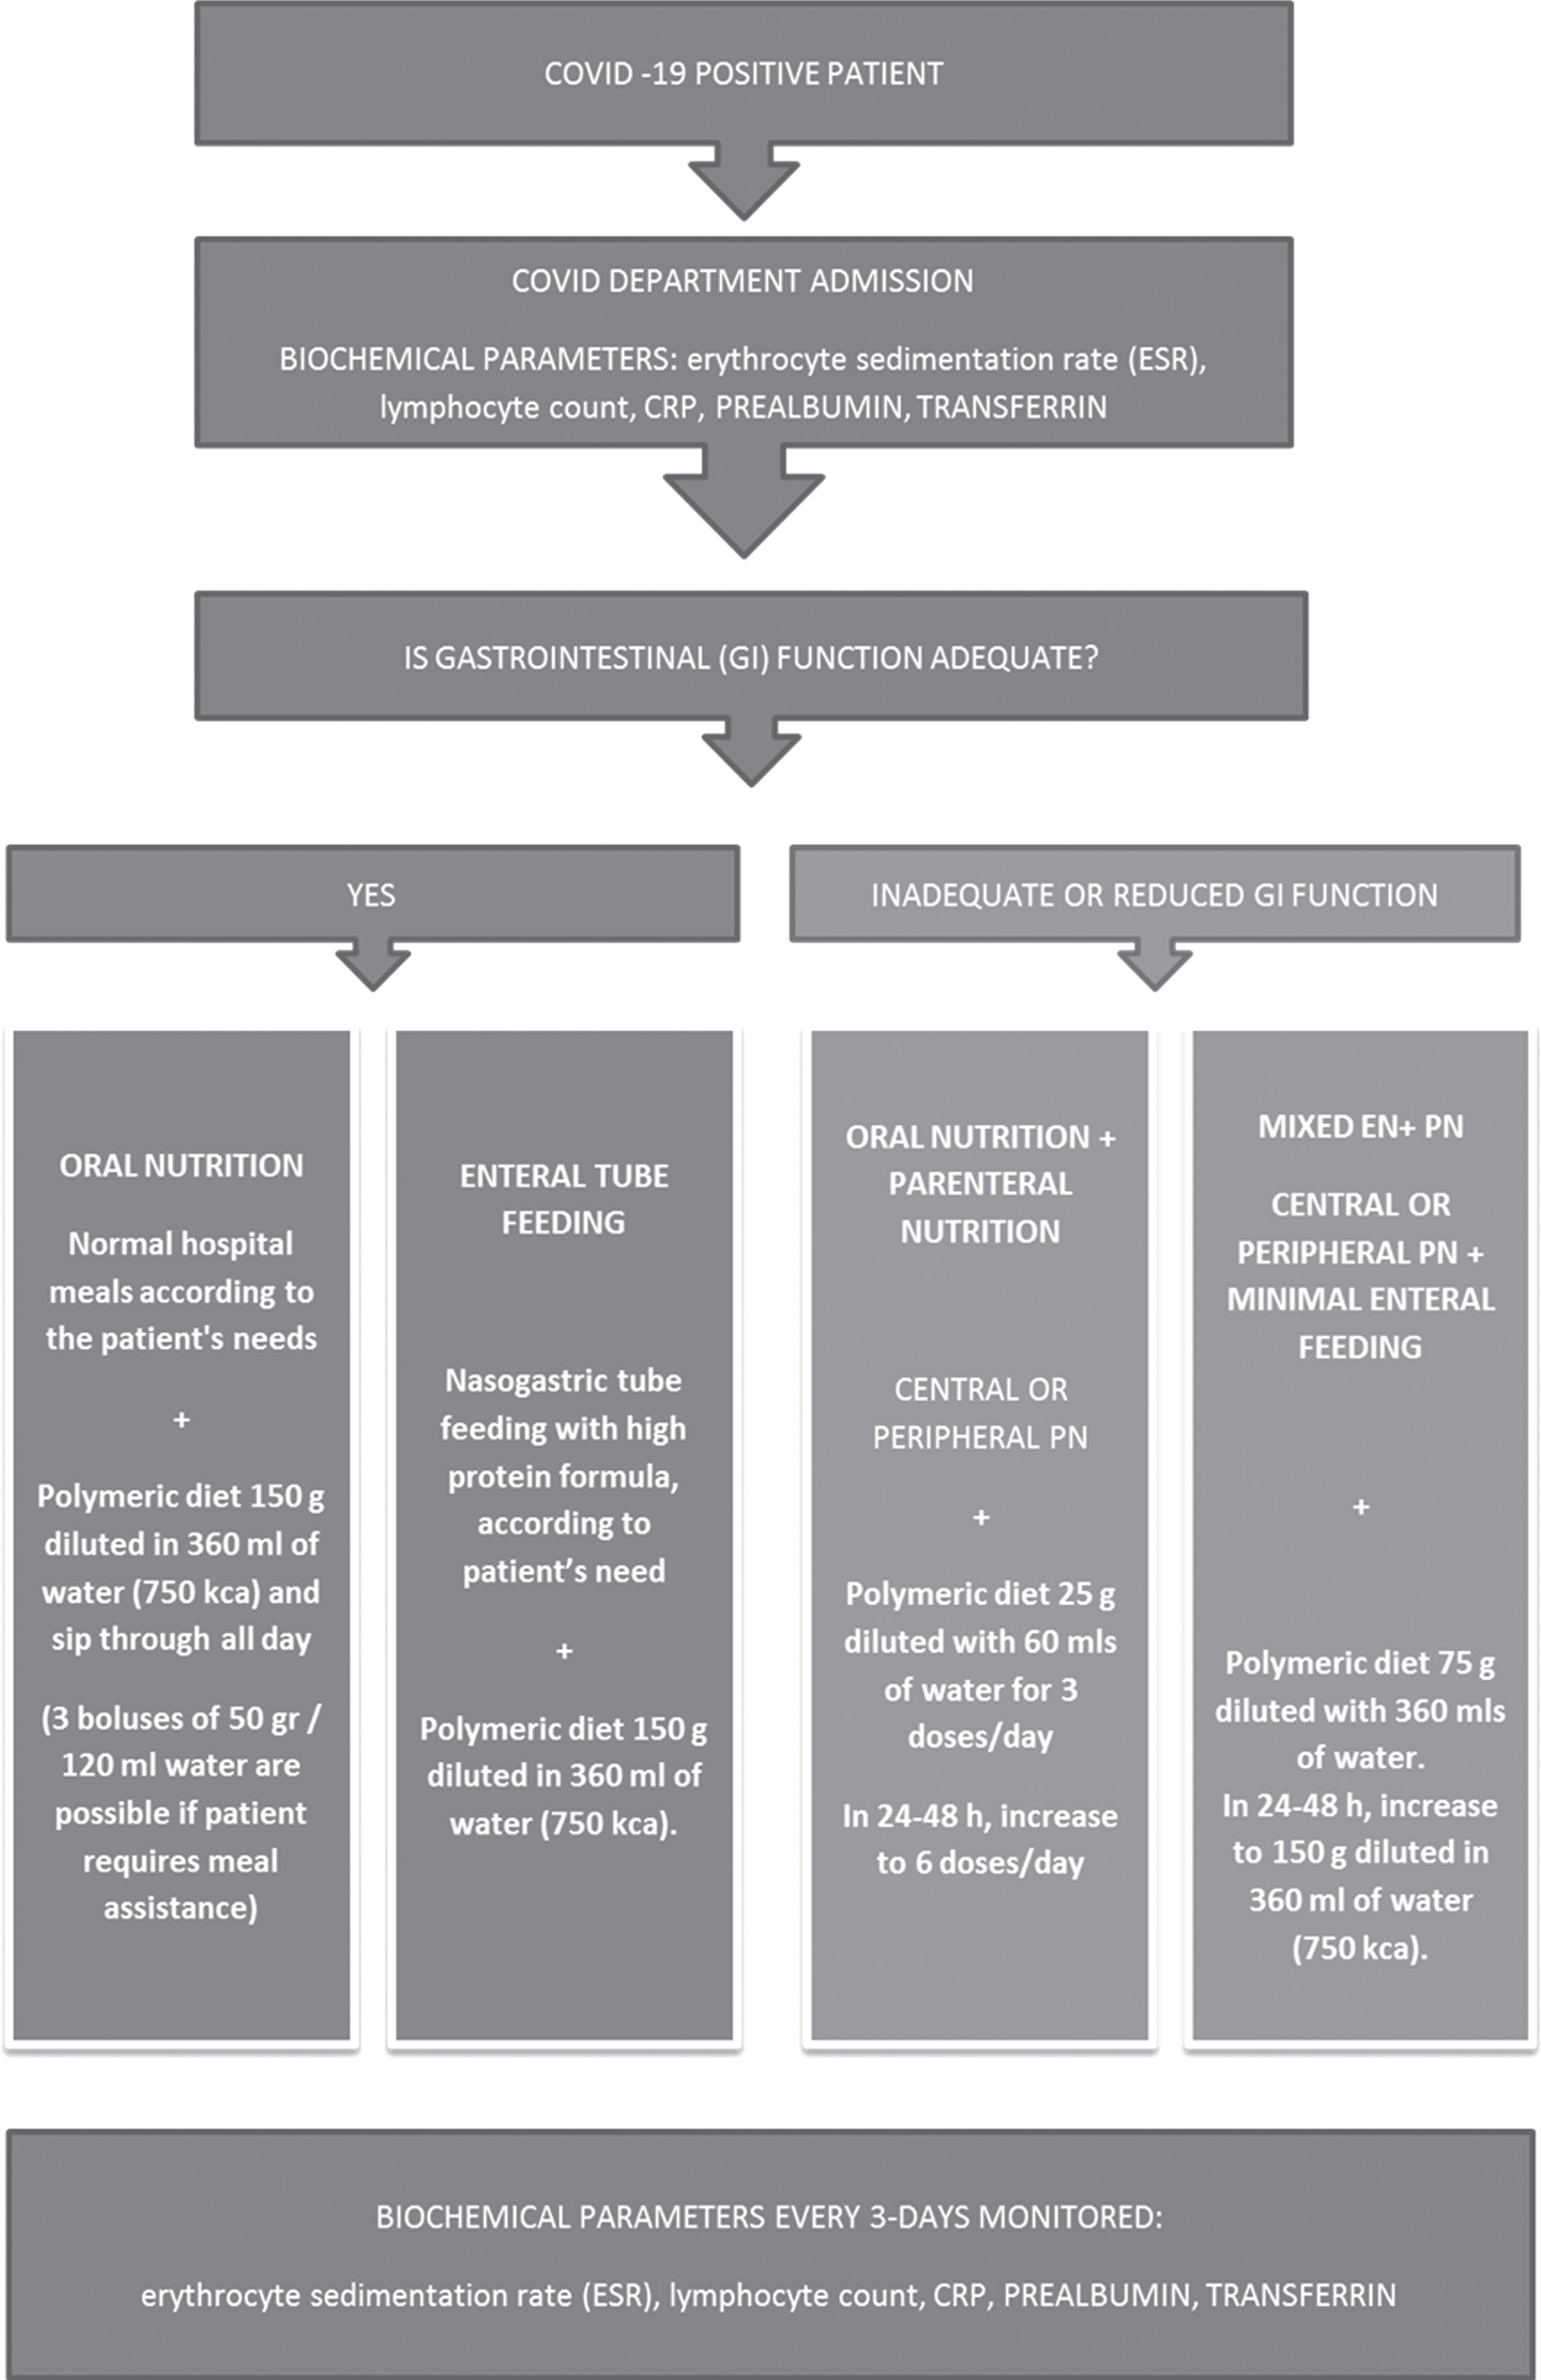
In this protocol we prescribed 150 gr of powder reconstituted at 30% with 360 ml of drinking water (total volume 500 ml, 750 kcal/day), given as ONS to patients, instructed to sip it slowly in about 3-4 hours, in addition to a standard oral diet, targeted on their specific caloric requirements; it is possible to use this formula as oral nutritional supplement, or administered enterally, through a nasogastric tube and in association to others standard enteral formulas in order to reach nutritional requirements; it is also possible use it in the context of mixed parenteral/enteral nutrition as minimal enteral feeding, ensuring intestinal trophism (see flow chart in Fig. 2). Treatment should be continued for two weeks.
Fig. 2
Protocol Flow chart.
2.2Clinical/biochemical monitoring
During the treatment period the following biochemical parameters were collected if possible twice but at least once weekly up to day 21: serum prealbumin, transferrin, C-reactive protein (CRP), Lymphocyte count, in addition to the usual monitoring required for these patients.
2.3Statistical analysis
Categorical variables were summarized as absolute and relative frequencies, while continuous variables were expressed as mean±standard deviation (SD). Baseline characteristics between exposed (patients receiving TGFβ2 enriched formula supplementation) and non-exposed (patients without supplementation) were compared using Fisher exact test (for categorial variables) and non-parametric Wilcoxon test (for continuous variables). The effect of TGFβ2 enriched formula supplementation on clinical and biochemical parameters was assessed using a Generalized Estimated Equation (GEE) models [15] with autoregressive structure to take into account repeated measures. By default the model consider an interaction term between exposure and time to blood sample (baseline, week 1, week 2, . . .) to model different trend in clinical and biochemical parameters in the two groups. Statistical significance of interaction terms were tested using Wald test and they were dropped if p > 0.05. All baseline characteristic were considered in the GEE models as predictors to adjust the TGFβ2 enriched formula and time effect for potential differences among exposed and non-exposed. Because specific therapies (e.g. steroids) could be started during all the hospitalization before or after supplementation, for each outcome we run two models including (Model 1) and excluding (Model 2) specific therapies as predictors; results were compared to understand if such covariates could have influenced the outcome.
Specific relative effect measures were presented with 95% confidence intervals (CI): risk ratio (RR) and absolute difference (Δ) for dichotomous and continuous outcomes, respectively. All statistical analyses were performed using STATA (StataCorp. 2017, release 1).
3Results
A total of 123 patients were identified between March and December 2020; 44 patients did not fulfilled the inclusion criteria and were excluded from the analysis. For additional 24 patients hospital information were not available. Finally, 55 patients were included in the analysis, 31 received a TGFβ2 enriched formula during hospitalization (exposed group) and 24 were used as controls (non-exposed group) (Fig. 3).
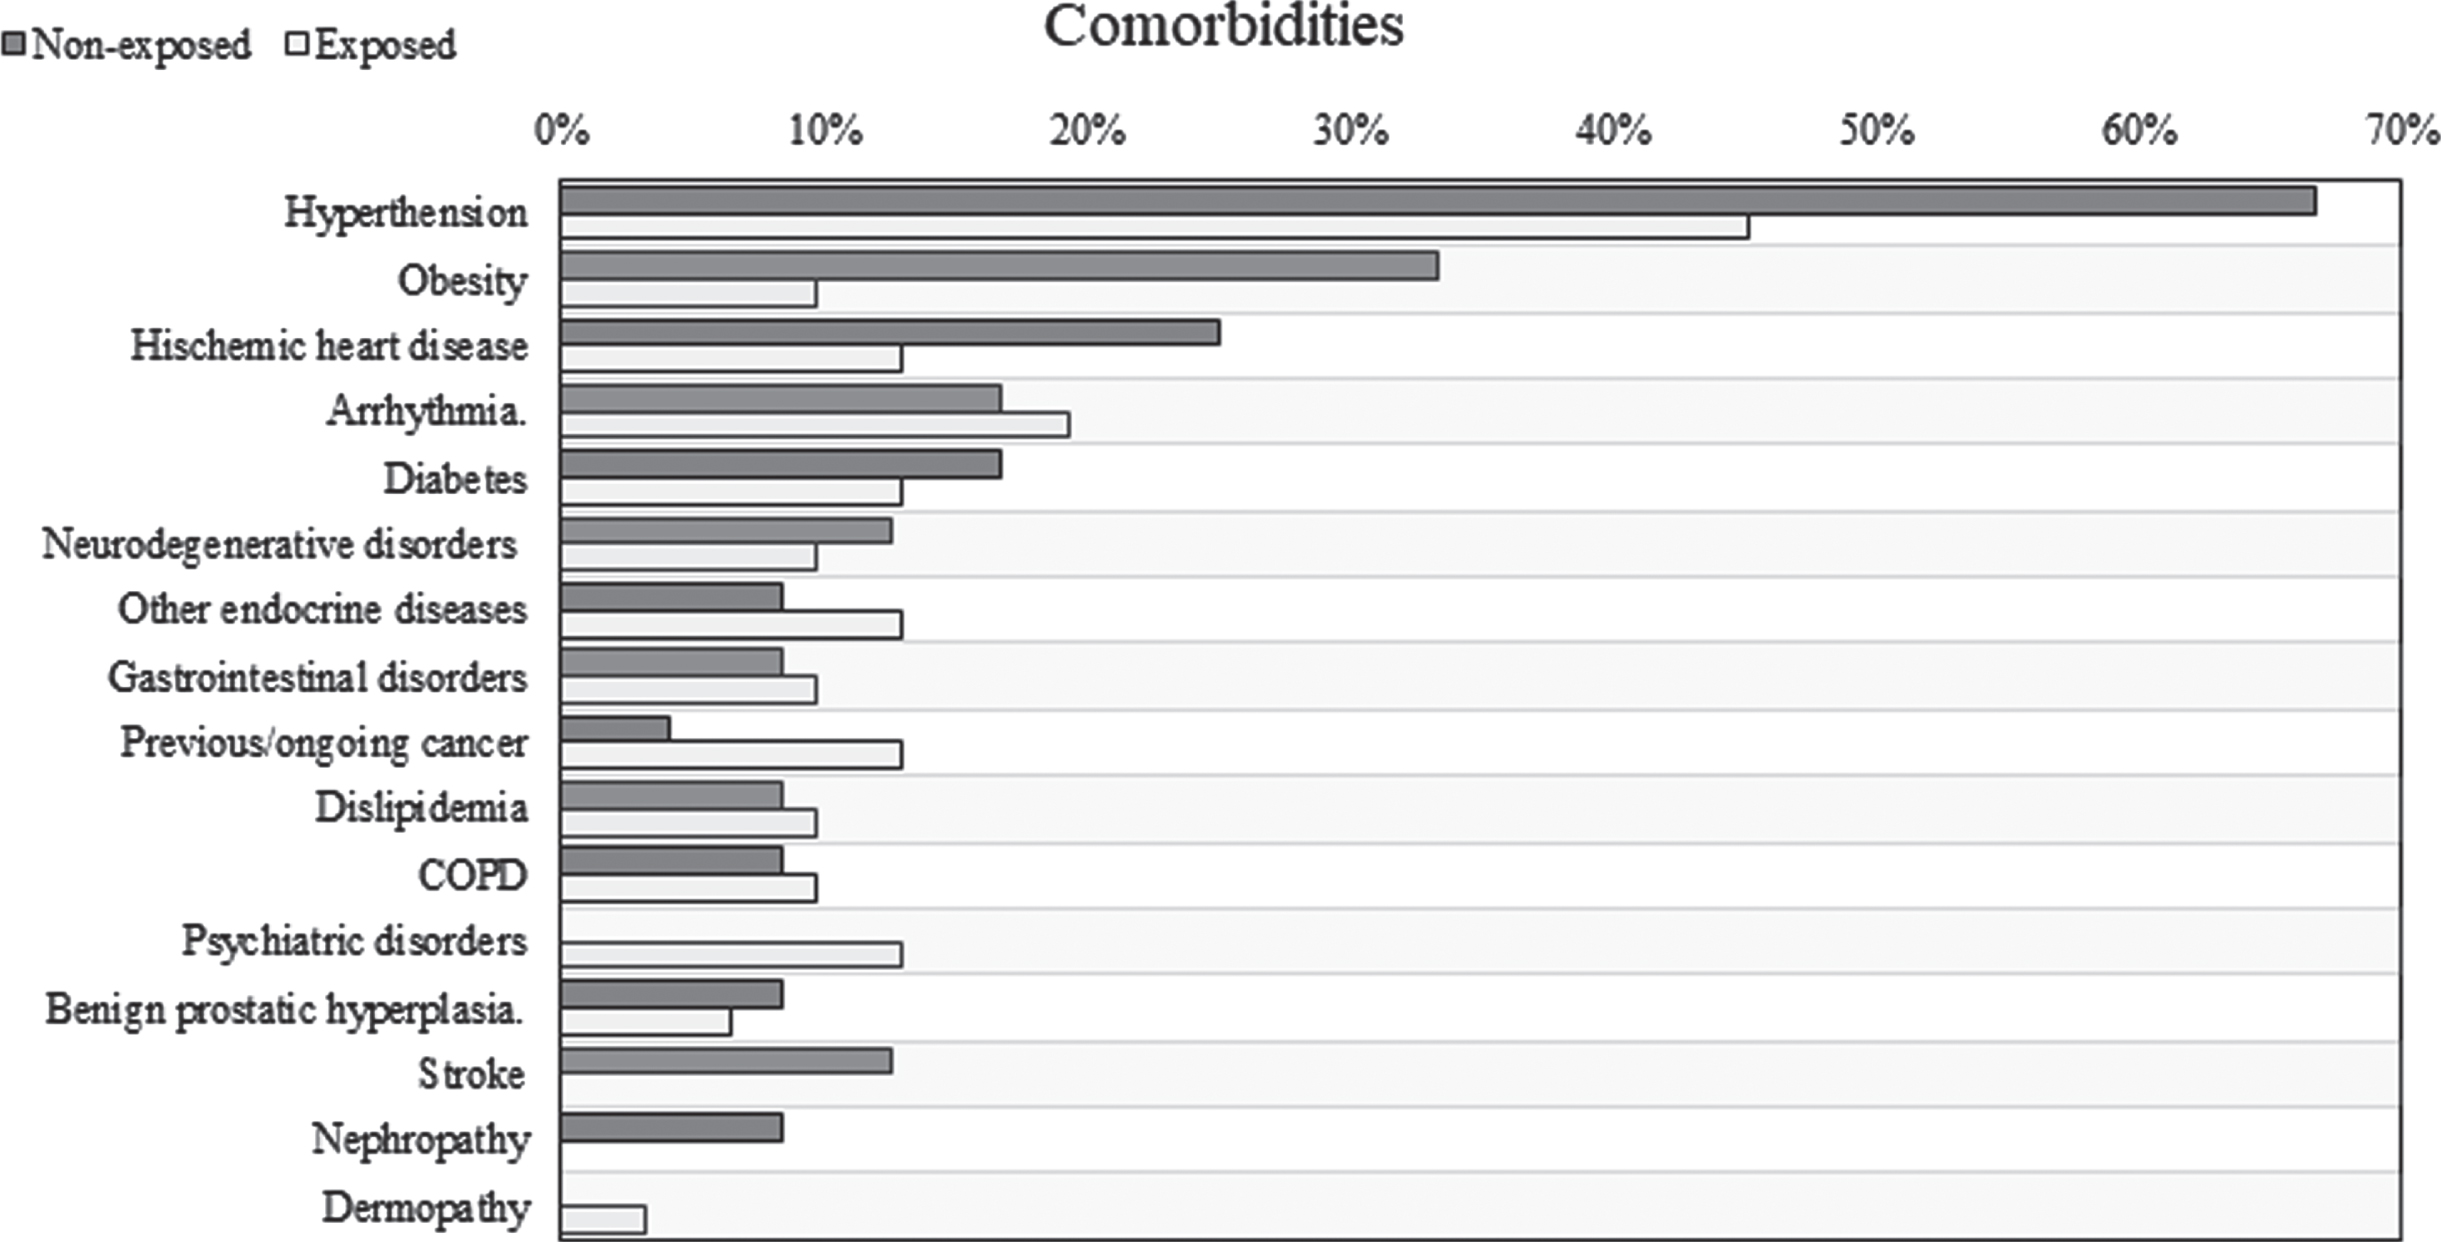
Baseline characteristics were detailed in Table 1. Exposed and not-exposed were comparable for age, gender, number of comorbidities (complete list of comorbidities in Fig. 7) and prevalence of diarrhea at admission. Patients treated with TGFβ2 enriched formula were more likely to be admitted to Infectious Disease Department while non-exposed to Medicine Department (p < 0.001). O2 therapy with high flow was more frequent between non-exposed (70.8%) while patients in the exposed group were equally treated with low and high flow (38.7% and 35.5%, respectively). Furthermore, almost all patients received oral nutrition, 4 patients among non-exposed (16.7%) and 1 patient treated with TGFβ2 enriched formula (3.2%) received enteral or parenteral nutrition (p = 0.154).
Fig. 3
Flowchart of patients enrolment in the study.
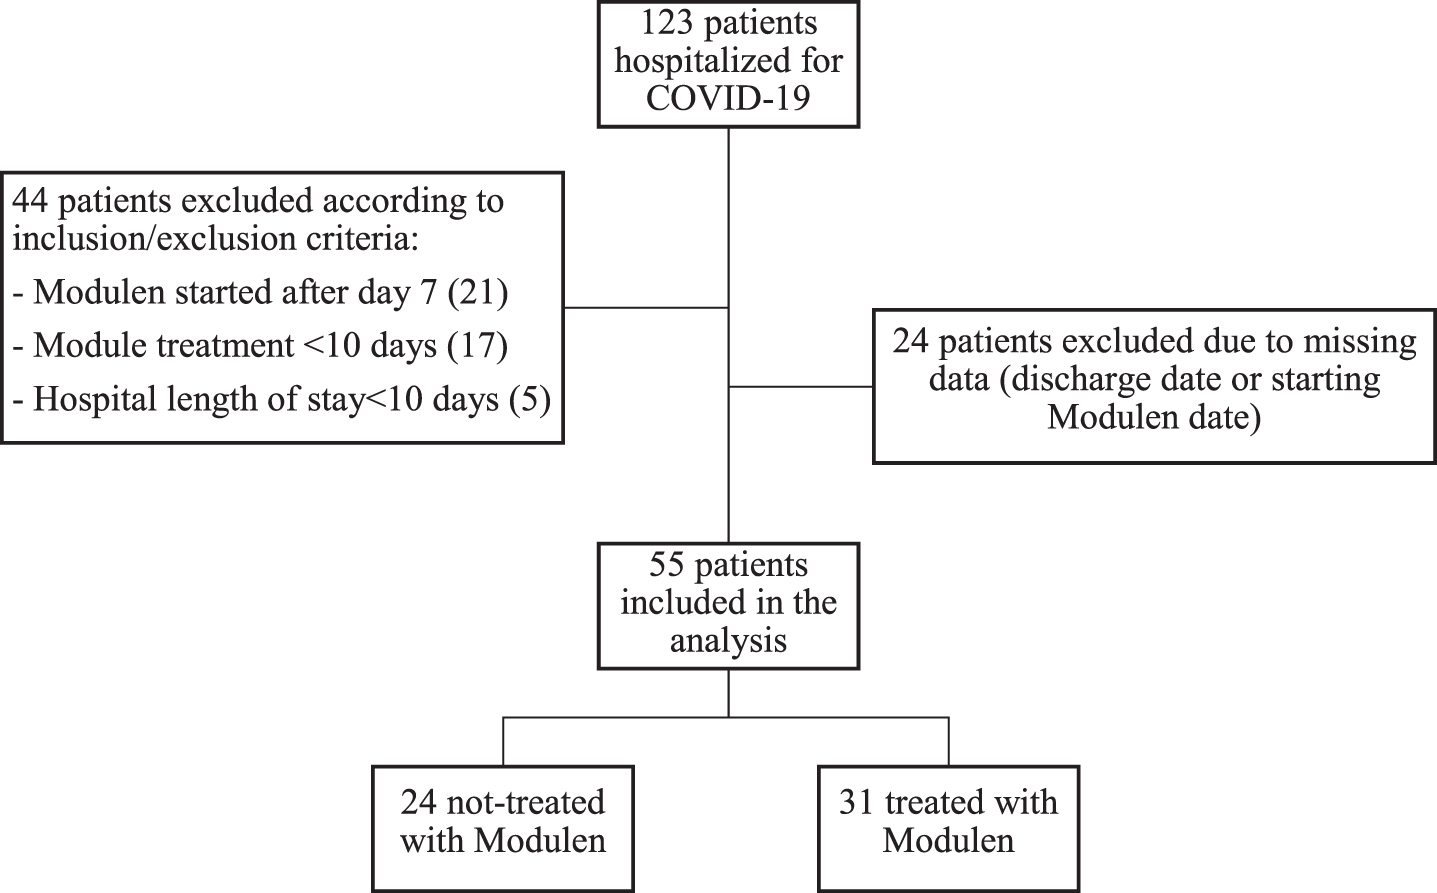
Table 1
Baseline characteristics
| Variables | Non-exposed | Exposed | Comparison (95% CI) | p-value |
| N | 24 | 31 | ||
| Gender (women) | 8 (33.3%) | 11 (35.5%) | RR = 1.06 (0.4 to 3.1) | 0.908 |
| Age (years) | 64.7±13.9 | 64.5±16.8 | Δ= –0.18 (–8.5 to 8.1) | 0.966 |
| Comorbidities | 2.4±1.7 | 1.9±1.5 | Δ= –0.5 (–1.4 to 0.4) | 0.272 |
| Diarrhea at admission | 4 (16.7%) | 8 (25.8%) | RR = 1.5 (0.4 to 5.6) | 0.514 |
| Admission type | <0.001 | |||
| Medicine | 19 (79.2%) | 2 (6.5%) | ||
| Pneumology | 1 (4.2%) | 1 (3.2%) | ||
| Infectious disease | 4 (16.7%) | 28 (90.3%) | ||
| Nutrition (EN or PN) | 4 (16.7%) | 1 (3.2%) | RR = 0.19 (0.02 to 1.85) | 0.154 |
| O2 therapy | 0.038 | |||
| None | 3 (12.5%) | 8 (25.8%) | ||
| Low flow | 4 (16.7%) | 12 (38.7%) | ||
| High flow | 17 (70.8%) | 11 (35.5%) |
RR: risk ratio; Δ: absolute difference; EN: enteral nutrition, PN: parenteral nutrition.
Fig. 7
Prevalence of comorbidities.
Oral supplementation was started about 4 days after hospital admission (3.84±1.66 days) and was continued for almost 3 weeks (19.61±7.26 days). Total hospital stay was comparable between non-exposed and exposed patients (25 vs 22.5 days, p = 0.897). Diarrhea had resolved for all patients independently from nutritional formula supplementation within the first week and none presented new symptoms during hospitalization. 5 patients not treated with TGFβ2 enriched formula died during the study period, 2 of them were admitted to Intensive Care Unit.
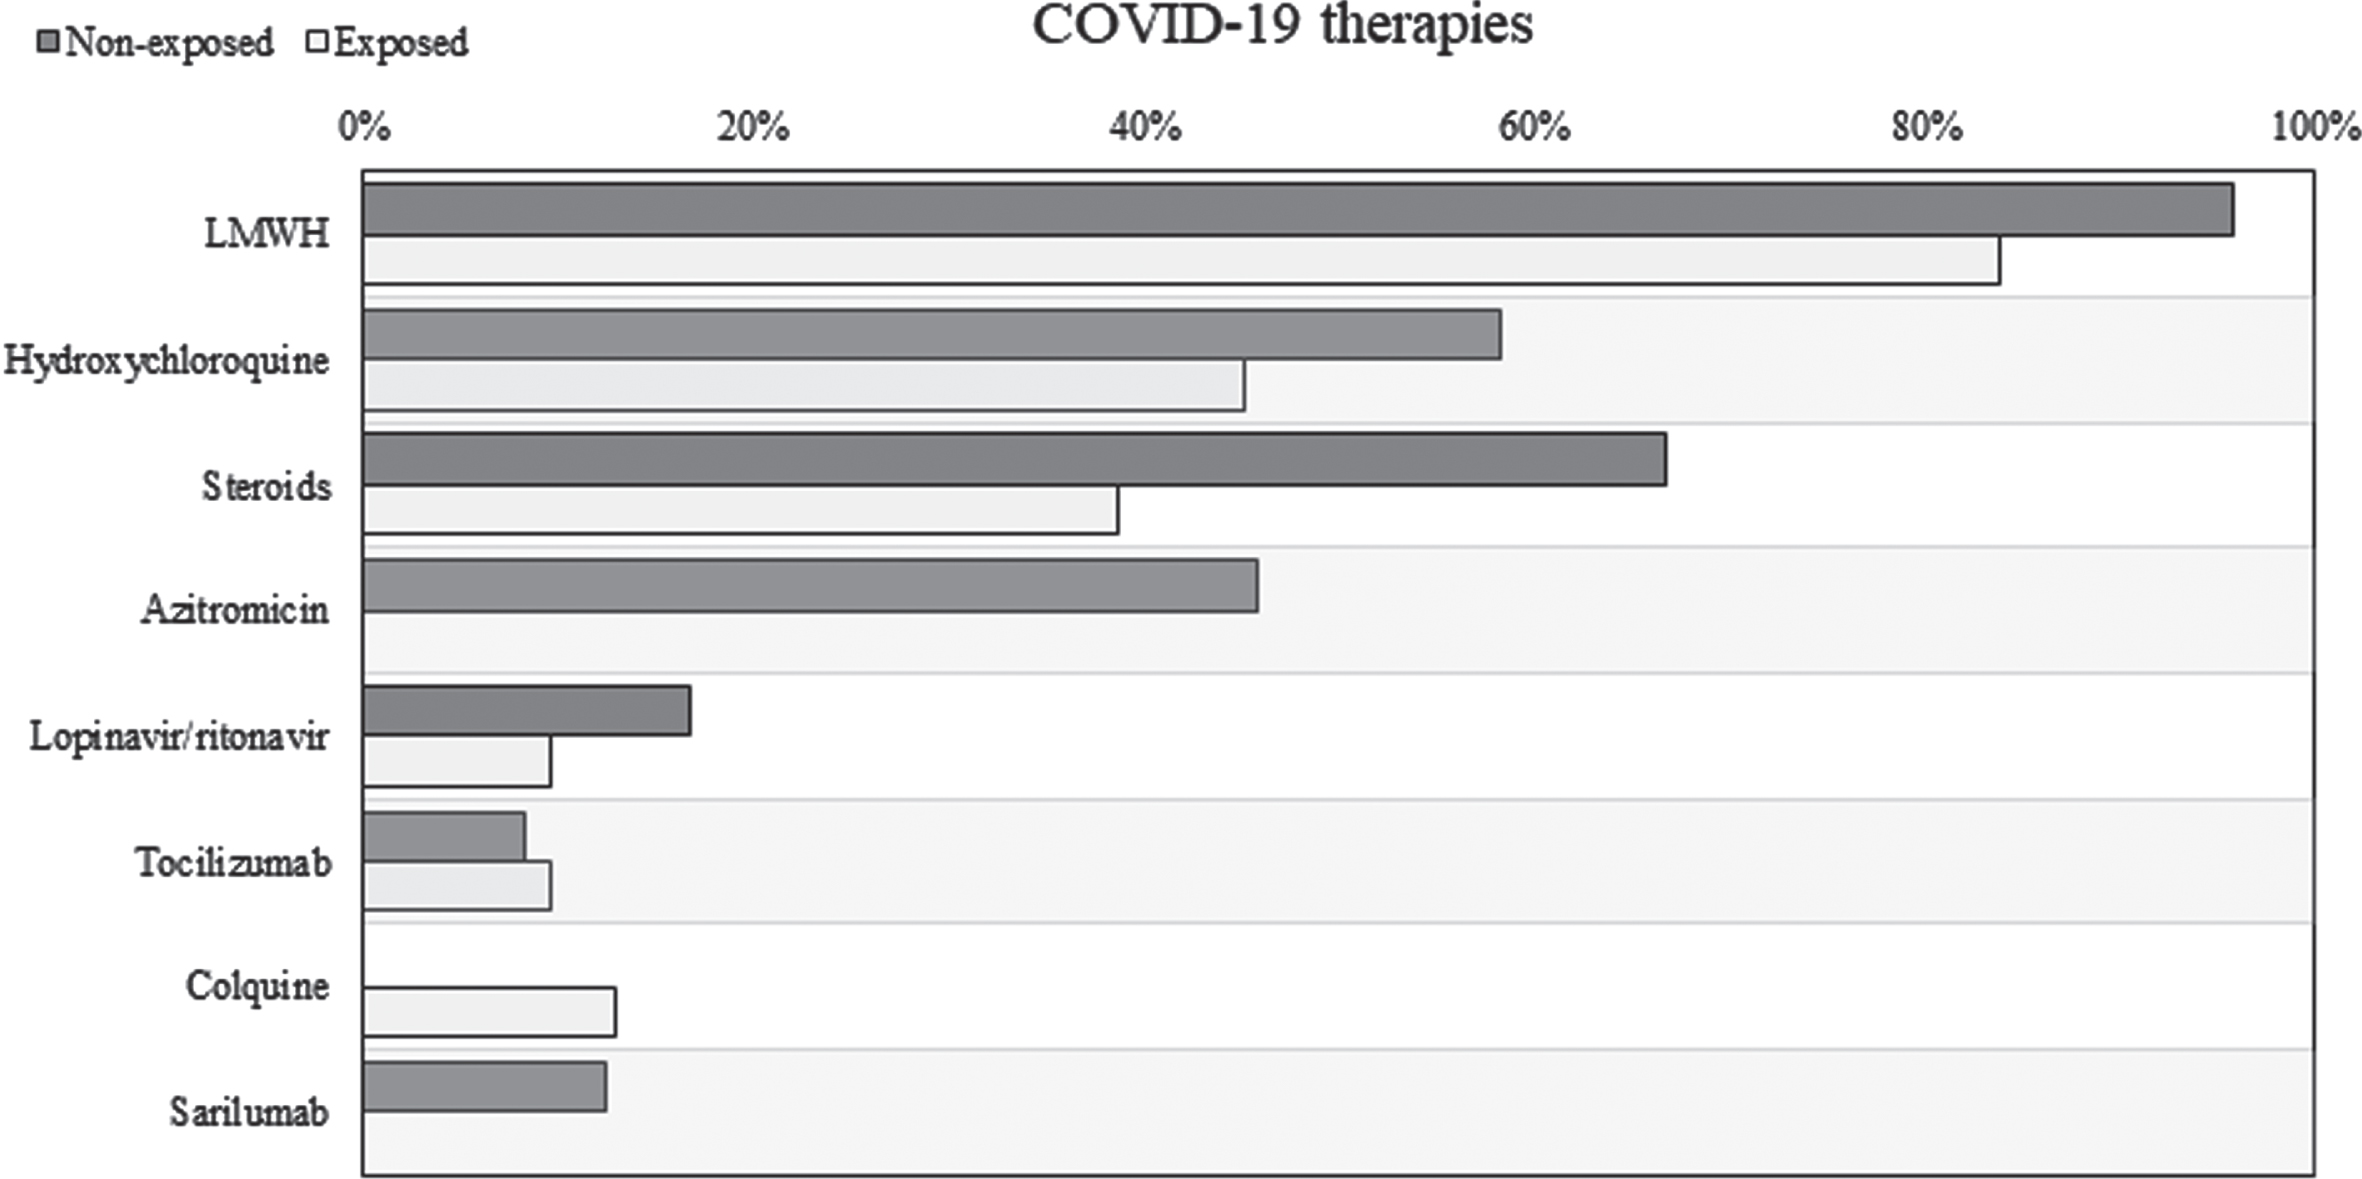
Patients treated with TGFβ2 enriched formula seemed to be associated to a lower needing of steroid therapy (Fig. 4). After adjusting from baseline characteristics, the use of supplementation remained associated to a reduced risk of steroid prescription (HR = 0.316, 95% CI 0.12 to 0.828). Considering all the COVID-19 therapies prescribed during hospitalization, only 9 patients (29.0%) in the exposed group needed more than 2 different therapies compared to 15 patients (62.5%) in the non-exposed group (RR = 0.46, 95% CI 0.17 to 1.24). Detailed distribution of all COVID-19 therapies prescribed during hospitalization was illustrated in Fig. 8.
Fig. 4
Steroids free survival comparison between exposed and not-exposed.
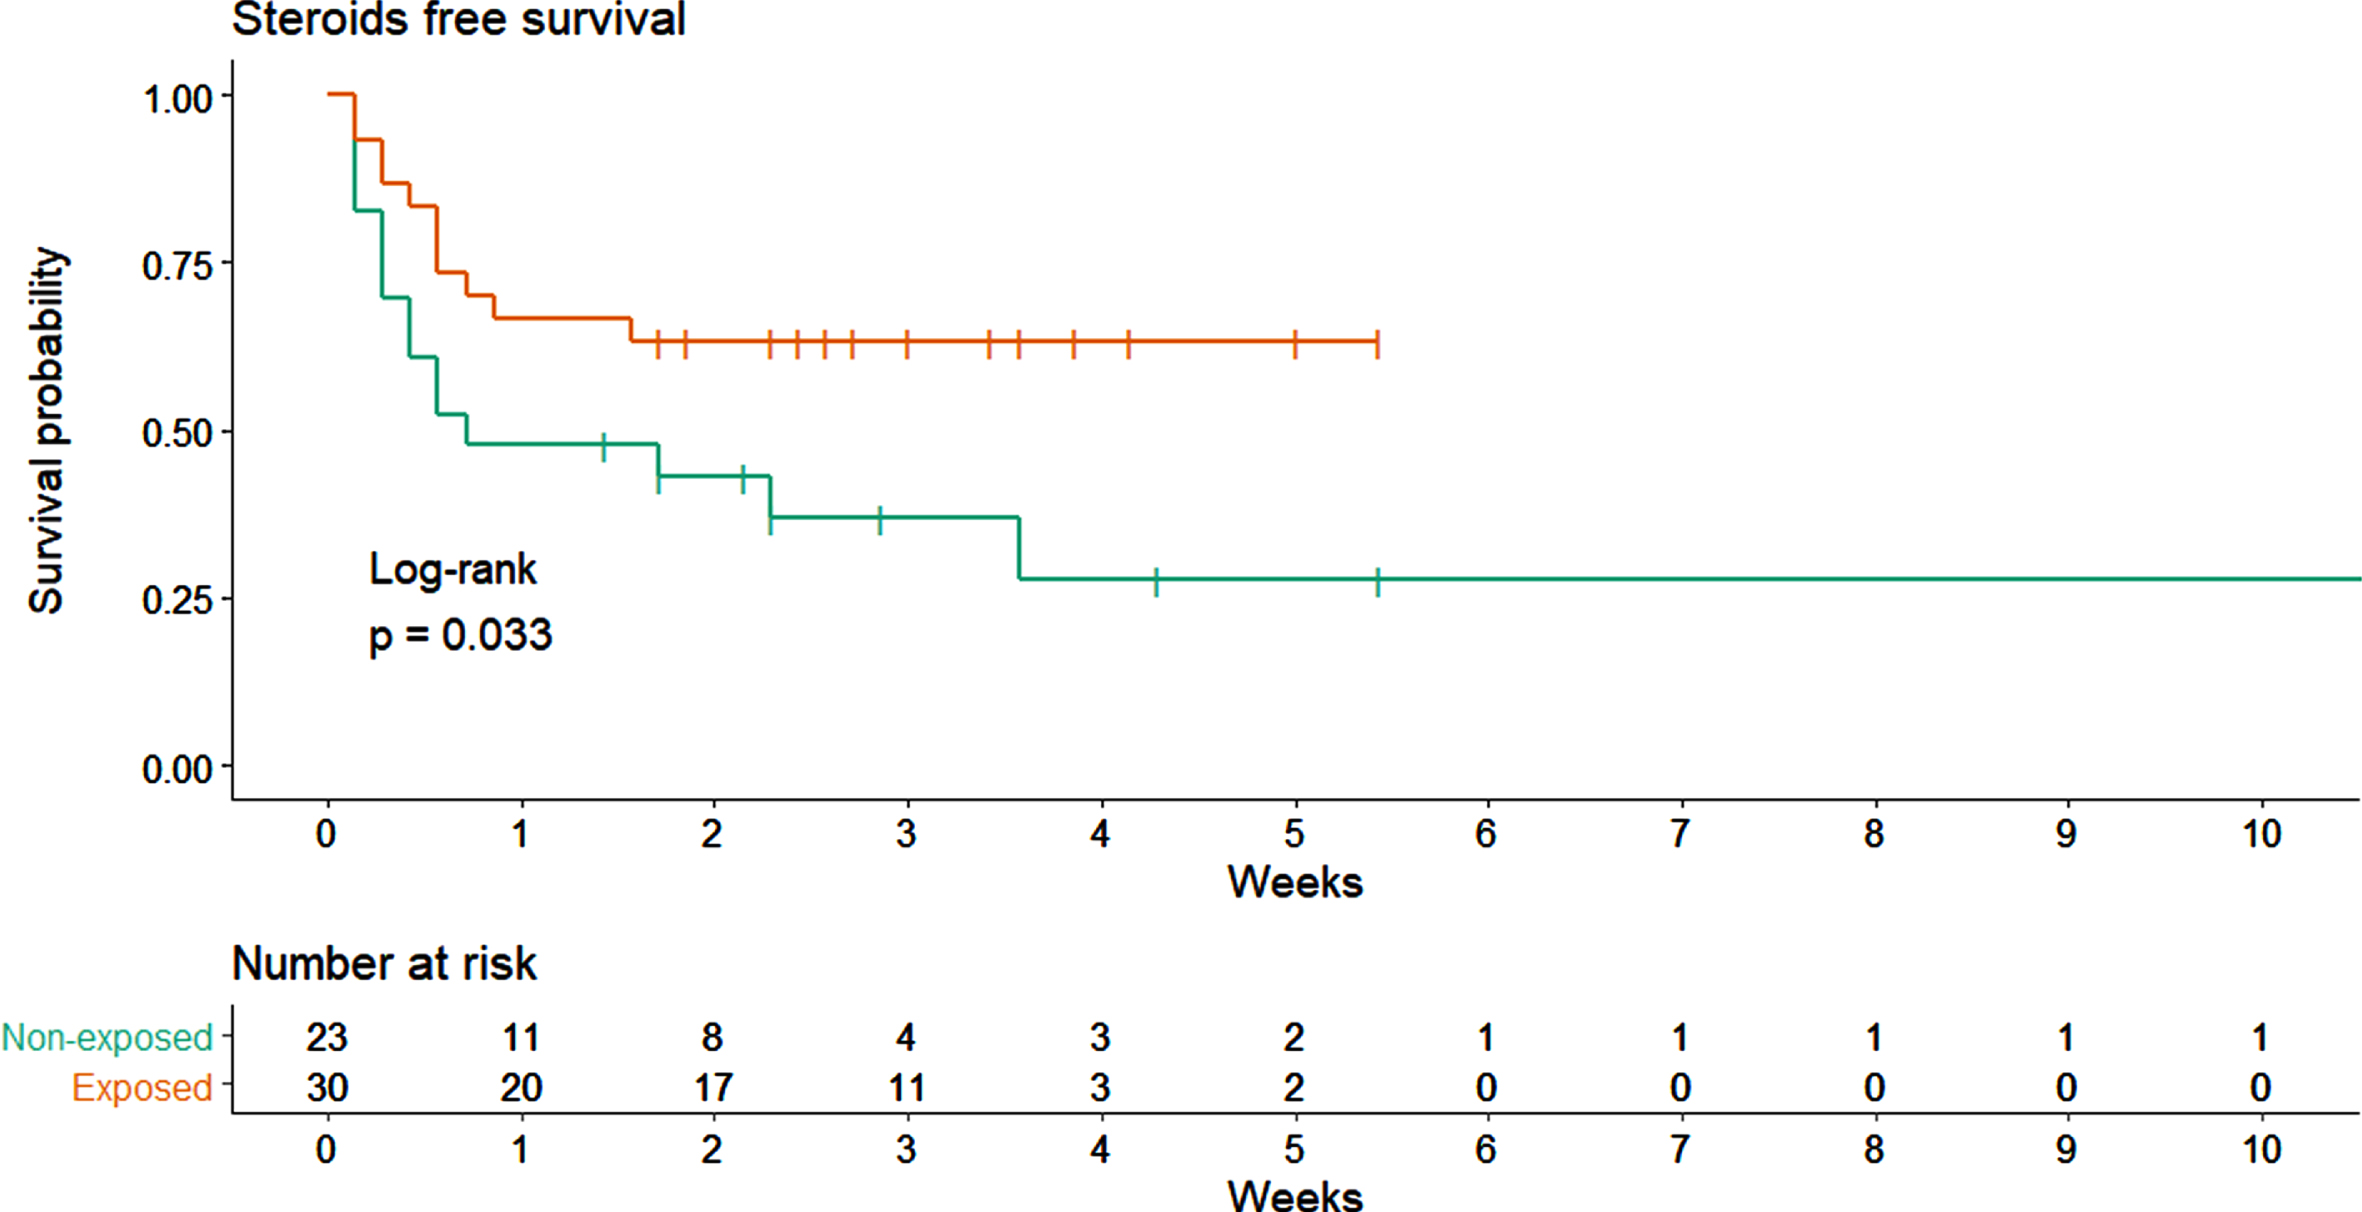
Fig. 8
Specific therapies for COVID-19 started during hospitalization. LMWH: low molecular weight heparin.
Blood tests were performed quite regularly during hospitalization in both groups, only the second blood test was performed after about 3 days from the first in the exposed group, probably after starting nutritional supplementation (Table 4). For almost all patients in the oral formula group, 4 blood samples were available while in the non-exposed group the fourth blood sample was available only for 3 patients. All clinical and biochemical parameters were not evaluated routinely in the not-exposed group (Table 5). Specifically, serum prealbumin and transferrin levels were collected for less than 17% of patients and lymphocyte count and CRP for only 3 patients at week 3. For this reason, only the evolution of lymphocyte count and CRP from admission to week 2 was compared among exposed and not-exposed (Fig. 5).
Table 4
Interval between two consecutive blood sample (data was presented as mean±standard deviation, in brackets the number of patients still hospitalized on which the blood test was performed)
| Days between | Non-Exposed | Exposed | Δ (95% CI) | p-value |
| Admission and 1st BS | 1.21±0.51 (N = 24) | 1.55±0.77 (N = 31) | 0.34 (0.00 to 0.68) | 0.049 |
| 1st and 2nd BS | 5.75±1.39 (N = 24) | 3.39±2.80 (N = 31) | –2.36 (–4.03 to –0.70) | 0.005 |
| 2nd and 3rd BS | 6.43±1.88 (N = 23) | 5.87±1.31 (N = 31) | –0.56 (–1.42 to 0.29) | 0.194 |
| 3rd and 4th BS | 4.33±3.79 (N = 3) | 8.25±6.76 (N = 28) | 3.92 (–0.84 to 8.67) | 0.107 |
BS: blood sample; Δ: absolute difference; CI: confidence interval.
Table 5
Clinical and biochemical parameter distributions for all the available blood samples performed during hospitalization (data was presented as mean±standard deviation, in brackets the number of patients on which the blood test was performed and each parameter was tested)
| Parameter | BS | Non-exposed | Exposed | Δ (95% CI) | p-value |
| Lymphocyte | 1st | 0.99±0.66 (N = 23) | 1.14±0.62 (N = 30) | 0.15 (–0.19 to 0.5) | 0.383 |
| count (x1000 | 2nd | 1.26±0.68 (N = 22) | 1.33±0.71 (N = 25) | 0.07 (–0.33 to 0.47) | 0.736 |
| mm3) | 3rd | 1.56±0.71 (N = 22) | 1.54±0.83 (N = 31) | –0.02 (–0.45 to 0.41) | 0.924 |
| 4th | 1.27±1.06 (N = 3) | 1.69±0.67 (N = 28) | 0.42 (–0.27 to 1.11) | 0.229 | |
| Serum | 1st | 8.3±2.9 (N = 4) | 10.7±4.2 (N = 9) | 2.4 (–1.6 to 6.5) | 0.244 |
| prealbumin | 2nd | 13.3±5.9 (N = 3) | 15.3±6 (N = 21) | 2 (–4.5 to 8.5) | 0.556 |
| (mg/dL) | 3rd | 11±8.5 (N = 2) | 22±7.2 (N = 22) | 11 (4.6 to 17.3) | 0.001 |
| 4th | NA | 25.6±8.7 (N = 23) | NA | NA | |
| Transferrin | 1st | 160.3±45.5 (N = 4) | 182.2±42.7 (N = 10) | 22 (–25.9 to 69.8) | 0.369 |
| (mg/dL) | 2nd | 182.3±9.8 (N = 3) | 191±48.2 (N = 21) | 8.6 (–44.9 to 62.2) | 0.752 |
| 3rd | 177 (N = 1) | 204±51.8 (N = 22) | 27 (–63.8 to 117.7) | 0.561 | |
| 4th | NA | 214.6±59.5 (N = 23) | NA | NA | |
| C-reactive | 1st | 11.65±8.48 (N = 24) | 6.36±5.16 (N = 29) | –5.3 (–9.33 to –1.26) | 0.01 |
| protein | 2nd | 6.12±9.53 (N = 23) | 5.27±4.54 (N = 25) | –0.86 (–4.89 to 3.18) | 0.678 |
| (mg/dL) | 3rd | 3.01±7.95 (N = 21) | 1.23±1.93 (N = 30) | –1.78 (–4.6 to 1.04) | 0.216 |
| 4th | 4.64±2.78 (N = 3) | 1.47±2.72 (N = 27) | –3.17 (–12.59 to 6.26) | 0.51 |
BS: blood sample; Δ: absolute difference; CI: confidence interval.
Fig. 5
Average evolution of clinical and biochemical parameters collected during hospital stay both for exposed and non-exposed patients.
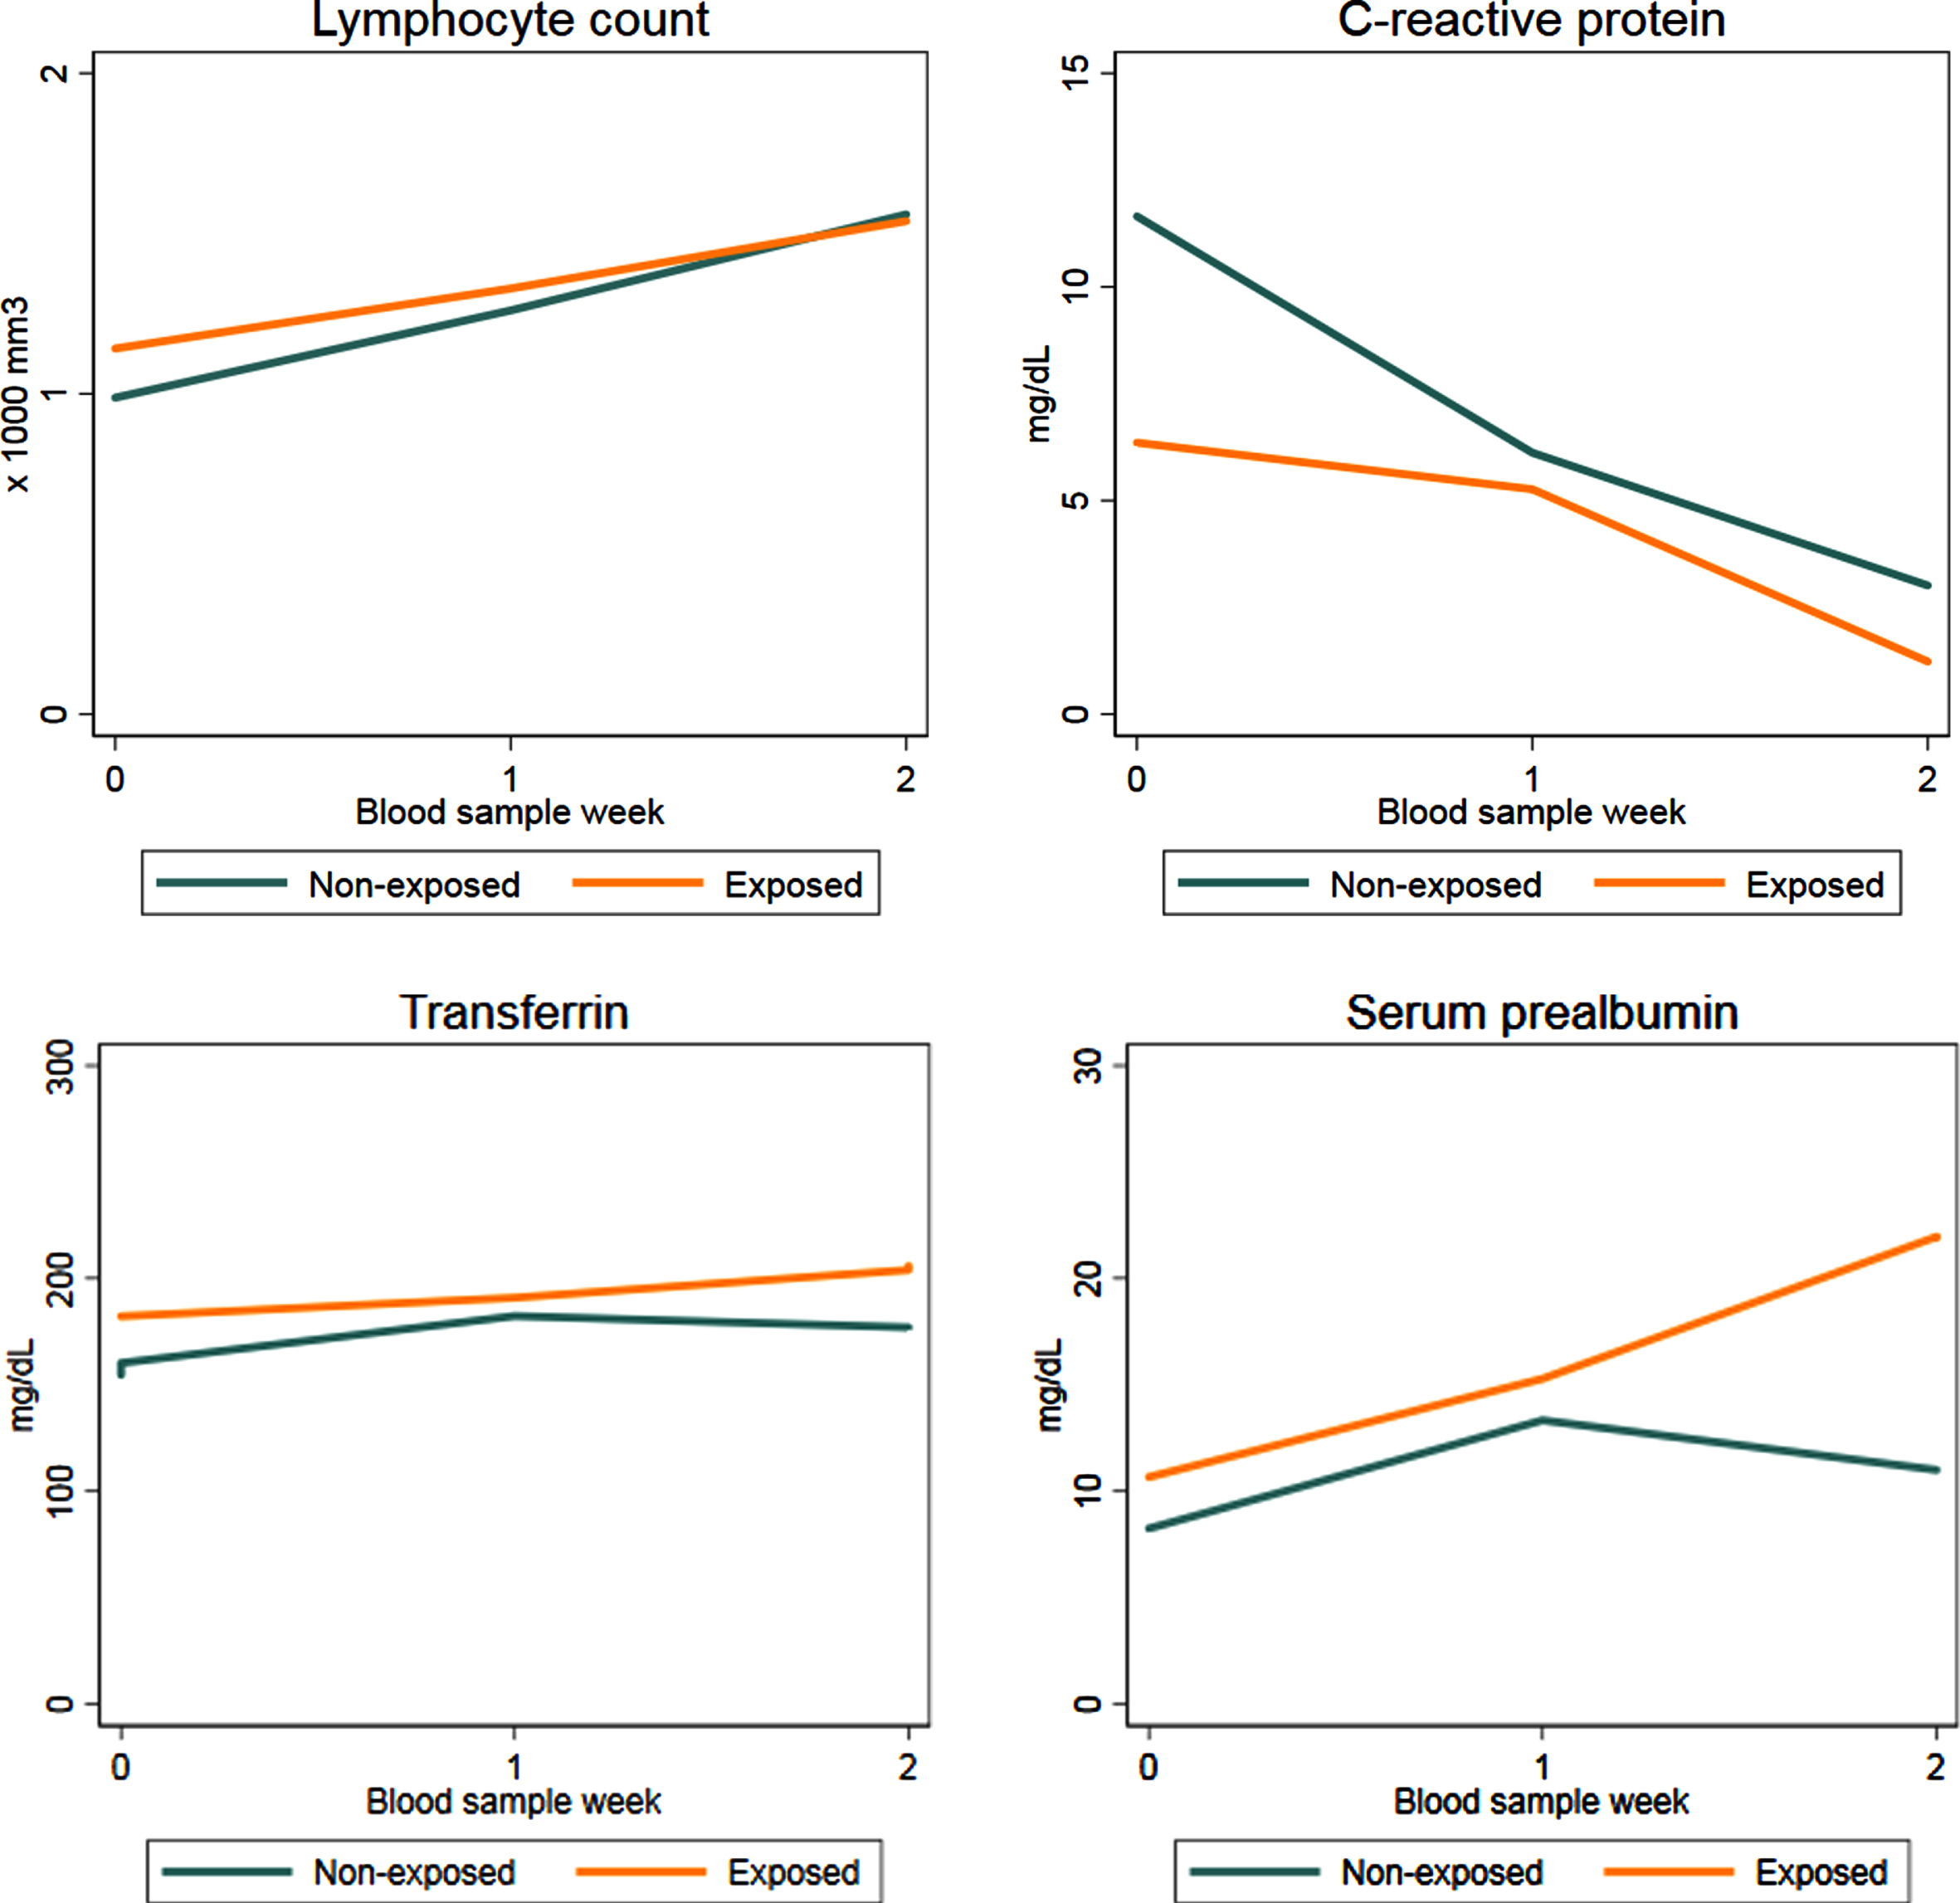
The lymphocyte count increased from admission to week 2 in both groups almost linearly, results of GEE model (Table 2) confirmed the qualitative trend illustrated in Fig. 5: the increase from admission to week 2 (Δ= 0.57, 95% CI 0.386 to 0.754) is exactly twice the increase from admission to week 1 (Δ= 0.231, 95% CI 0.075 to 0.388). Furthermore, such trend was the same in both groups as the interaction terms resulted negligible (p = 0.1211). Results of both model (with or without COVID-19 therapies as predictors) were consistent indicating no influence of these covariates.
Table 2
GEE analysis on lymphocyte count trend
| Model 1 | Model 2 | |||||
| Variables | Δ | 95% CI | p-value | Δ | 95% CI | p-value |
| Modulen® supplementation | 0.025 | (–0.37 to 0.42) | 0.902 | 0.100 | (–0.143 to 0.343) | 0.422 |
| BSW (vs admission) | ||||||
| Week 1 | 0.231 | (0.075 to 0.388) | 0.004 | 0.243 | (0.099 to 0.388) | 0.001 |
| Week 2 | 0.570 | (0.386 to 0.754) | <0.001 | 0.576 | (0.392 to 0.759) | <0.001 |
| Gender (vs women) | –0.046 | (–0.274 to 0.182) | 0.692 | –0.089 | (–0.327 to 0.148) | 0.462 |
| Age (year) | –0.016 | (–0.027 to –0.006) | 0.003 | –0.016 | (–0.026 to –0.007) | 0.001 |
| Comorbidity (vs none) | ||||||
| 1-2 | 0.432 | (0.025 to 0.838) | 0.037 | 0.409 | (0.043 to 0.775) | 0.028 |
| 3+ | 0.552 | (0.014 to 1.09) | 0.045 | 0.706 | (0.229 to 1.183) | 0.004 |
| Diarrhea at admission | 0.102 | (–0.138 to 0.341) | 0.406 | 0.173 | (–0.092 to 0.437) | 0.201 |
| Nutrition (EN o PN) | –0.154 | (–0.536 to 0.229) | 0.431 | –0.155 | (–0.592 to 0.281) | 0.485 |
| O2 therapy (vs none) | ||||||
| Low flow | –0.291 | (–0.843 to 0.261) | 0.302 | –0.347 | (–0.849 to 0.154) | 0.175 |
| High flow | –0.757 | (–1.271 to –0.243) | 0.004 | –0.782 | (–1.268 to –0.297) | 0.002 |
| COVID-19 therapies (>2) | –0.122 | (–0.368 to 0.124) | 0.33 | |||
| Steroids | –0.201 | (–0.624 to 0.222) | 0.353 | |||
BSW: blood sample week; EN: enteral nutrition; PN: parenteral nutrition; CI: confidence interval.
The evolution of CRP was quite different in the two groups (Fig. 5) and it was confirmed by GEE analysis (Table 3). In both groups CRP decreased during hospitalization, considerably. However, patients supplemented with oral formula started with lower values of CRP with respect to non-exposed (Δ= –4.559, 95% CI –7.946 to –1.172) and its decrease was less evident than that experienced by non-exposed patients; such evolution was represented by positive sign of interaction terms at week 1 (Δ= 6.436, 95% CI 3.414 to 9.457) and week 2 (Δ= 4.182, 95% CI 0.871 to 7.493). As for the lymphocyte count, no difference were observed in the estimates obtained by Model 1 and Model 2.
Table 3
GEE analysis on C-reactive protein trend
| Model 1 | Model 2 | |||||
| Variables | Δ | 95% CI | p-value | Δ | 95% CI | p-value |
| Modulen® supplementation | –4.559 | (–7.946 to –1.172) | 0.008 | –5.032 | (–7.978 to –2.086) | 0.001 |
| BSW (vs admission) | ||||||
| Week 1 | –6.393 | (–9.413 to –3.374) | <0.001 | –5.581 | (–8.523 to –2.638) | <0.001 |
| Week 2 | –8.607 | (–11.395 to –5.819) | <0.001 | –8.024 | (–10.687 to –5.361) | <0.001 |
| Group×BSW (vs admission) | ||||||
| Modulen®×week 1 | 6.436 | (3.414 to 9.457) | <0.001 | 5.791 | (2.793 to 8.788) | <0.001 |
| Modulen®×week 2 | 4.182 | (0.871 to 7.493) | 0.013 | 4.982 | (2.014 to 7.95) | 0.001 |
| Gender (vs women) | –2.268 | (–3.071 to –1.466) | <0.001 | –2.842 | (–3.785 to –1.898) | <0.001 |
| Age (year) | 0.001 | (–0.008 to 0.01) | 0.872 | 0.001 | (–0.002 to 0.004) | 0.45 |
| Comorbidity (vs none) | ||||||
| 1-2 | –2.272 | (–2.989 to –1.555) | <0.001 | –0.381 | (–0.69 to –0.072) | 0.016 |
| 3+ | –2.146 | (–2.862 to –1.43) | <0.001 | –0.432 | (–0.921 to 0.057) | 0.084 |
| Diarrhea at admission | –0.042 | (–0.068 to –0.017) | 0.001 | 3.133 | (2.102 to 4.165) | <0.001 |
| Nutrition (EN o PN) | 4.801 | (3.764 to 5.839) | <0.001 | 2.494 | (1.349 to 3.639) | <0.001 |
| O2 therapy (vs none) | ||||||
| Low flow | 4.890 | (3.204 to 6.576) | <0.001 | 2.893 | (1.945 to 3.842) | <0.001 |
| High flow | 4.499 | (2.825 to 6.174) | <0.001 | 2.999 | (1.997 to 4.002) | <0.001 |
| COVID-19 therapies (>2) | 1.690 | (0.676 to 2.704) | 0.001 | |||
| Steroids | –2.249 | (–3.108 to –1.389) | <0.001 | |||
BSW: blood sample week; EN: enteral nutrition; PN: parenteral nutrition; CI: confidence interval.
In patients receiving oral supplementation, both serum prealbumin and transferrin increased during hospitalization particularly in the second week (Fig. 5). The trend in patients not supplemented with oral formula was similar in the first week with a slight decline in the second week; however comparison among exposed and not-exposed could not be performed because data were available only for 4 patients in the not-exposed group.
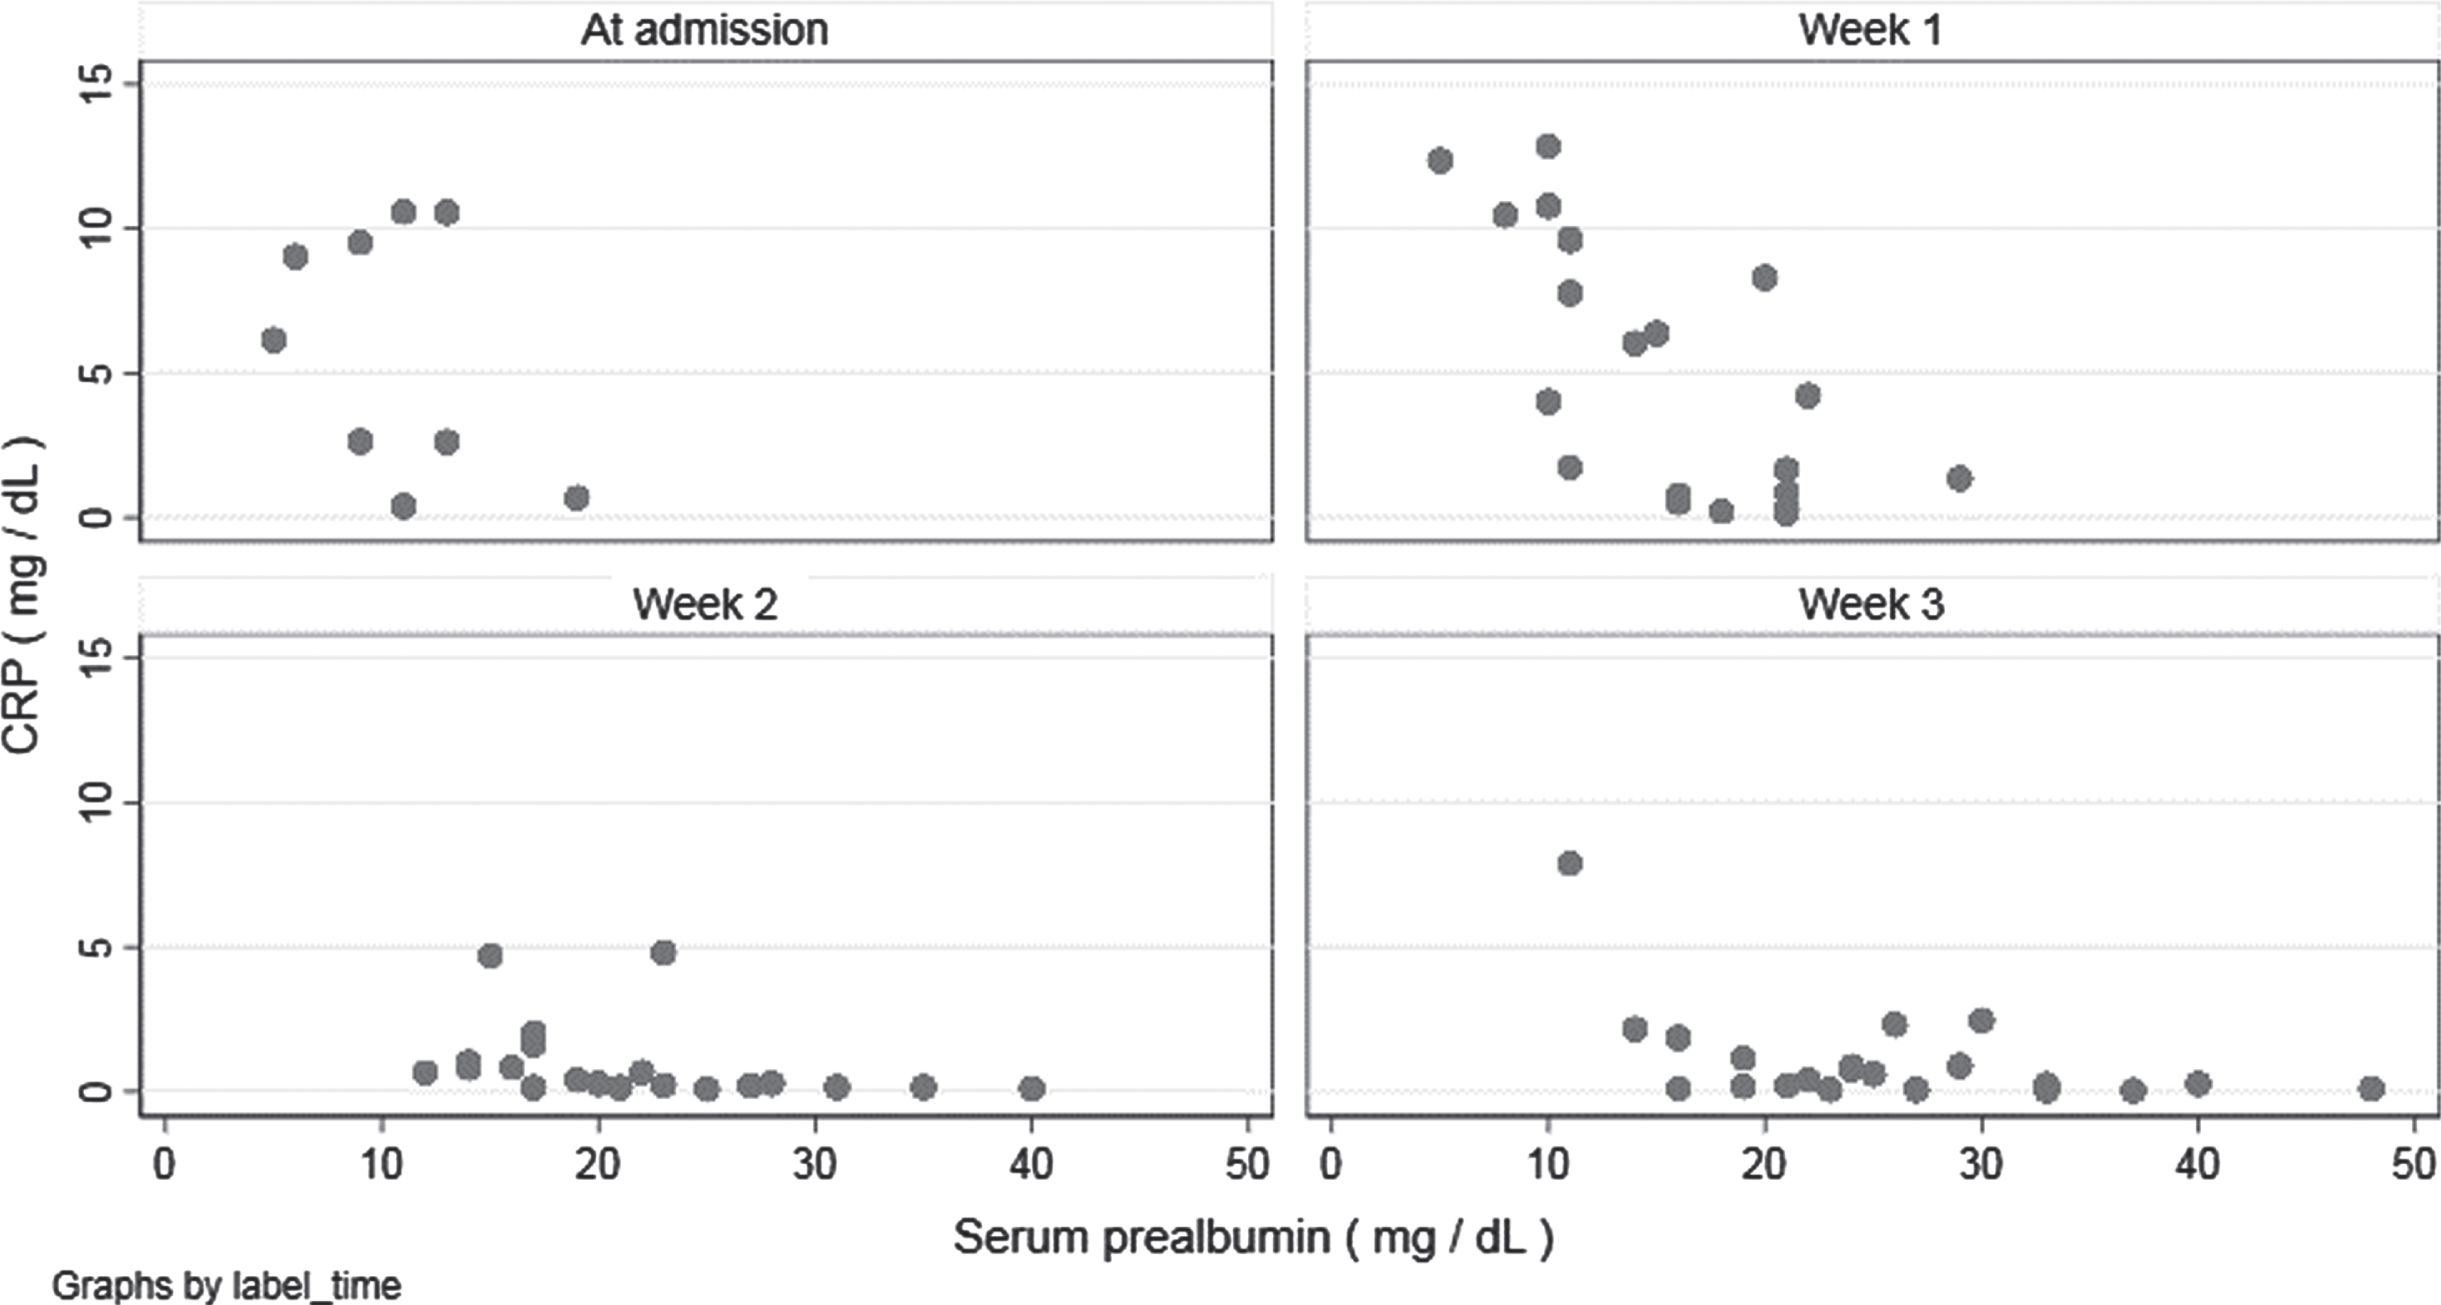
Exploratory analysis was performed on the relationship between serum prealbumin and CRP in patients supplemented with TGFβ2 enriched formula (Fig. 6). Higher values of serum prealbumin seemed to be associated with lower CRP levels at every blood sample; after adjusting for the week of blood test, every 1 mg/dL increment in serum prealbumin value was associated to a decrease of –0.044 mg/dL (95% CI –0.074 to –0.014) in CRP value.
Fig. 6
Correlation between serum prealbumin and C-reactive protein during hospitalization (data of patients supplemented with Modulen®).
4Discussion
In this paper we presented data of a retrospective observational study carried out on patients enrolled in the first onset of COVID 19 and consecutively hospitalized up to December. Out of 123 patients enrolled, we analyzed only those that presented homogeneous data consistent with the analysis. Most of them (46/55 = 84%) are representative of the first phase of the pandemic: this explains the difficult in collecting data and standardizing treatments, due to unexisting uniform guidelines or protocol of treatment for SARS Cov 2. Despite our analysis are affected by the “onset effect” of heterogeneous early treatment strategies, some aspects deserve interest:
Use of a TGFβ2 enriched formula seems to be associated with lower requirement of steroid therapy (Fig. 4). Indeed, considering all the COVID-19 therapies prescribed during hospitalization, patients in the exposed group unfrequently needed more than 2 different therapies if compared to non-exposed group. A reduced need and a longer time free from steroids suggest a more limited inflammatory response, according to our hypothesis. As evidence this data have been highlighted in a time when use of steroids was not mandatory. High flow O2 therapy was more frequent in non-exposed patients, while in the exposed group high or low flows have greater uniformity. Causality is not provable, but the formula use seems to be related with a mild course of the disease.
The lymphocyte count increased linearly from admission to week 2 in both groups; serum prealbumin and transferrin increased during hospitalization, particularly in the second week for patients receiving oral supplementation (Fig. 5). Data were available only for 4 not-exposed patients, hence no comparison could be performed.
According to the evidences, the visceral proteins (albumin and prealbumin) must be correctly recognized as inflammatory markers during critical ill trauma and sepsis [16]; where rises in positive acute-phase proteins and declines in negative acute-phase proteins are shown. It is assumed that reduction of visceral proteins is related to hepatic reprioritization of protein synthesis, increase in capillary permeability (that leads proteins leaving the intravascular space) and tissue catabolism [17].
Patients supplemented with the TGFβ2 enriched formula started with lower values of CRP, so its decrease was less evident than in non-exposed patients; higher values of serum prealbumin, though, seemed to be associated with lower CRP levels at every blood sample, to indicate a strong correlation between the two parameters. Moreover, normalization of visceral proteins, according to declines in negative acute-phase proteins, may indicate the resolution of inflammation, the reduction of nutrition risk, and a transition to anabolism [19].
Oral formula does not induce gastrointestinal discomfort or worsen gastrointestinal symptoms. Diarrhea was resolved in all patients independently from nutritional supplementation and none presented new symptoms during hospitalization.
At last, 5 patients out of non-exposed group died, 2 of them after a period of hospitalization in Intensive Care Unit.
5Conclusions
Limitations of this study are related to sample size, data collecting, leak of standardized protocols of care. Nevertheless data point out that nutritional support with TGFβ2 enriched formula reduces malnutrition risk, reduces inflammation markers, improving outcomes.
As recommended by international Guidelines, “taking care of nutrition” in COVID-19 is essential to influence the clinical course of the disease, in a perspective of a fast recovery; in this view, an early nutritional supplementation is mandatory. Considering the inflammatory storm of Sars-Cov2 and the gut lung-axis, a TGFβ2 enriched formula, generally used for the management of inflammatory bowel disease thanks to its immunoregulatory properties, represents a valid support in COVID-19 patients. It is effective in treating both sarcopenia and hypercatabolic status, reducing, at the same time, pro-inflammatory cytokines systemic values and drug-related gastrointestinal side-effects. Considering the variety of nutritional treatments available, investigated up to date, it’s time to tailor our therapies according to pathophysiological and clinical aspects of the single patient.
Further study will be performed to analyze clinical result of this proposal. A TGFβ2 formula could represent a promising possibility to face COVID-19 related malnutrition, per se and as a model of all acute inflammatory diseases with a high nutritional impact. This aim led to an ongoing data collection by several Hospital Centers of every part of Italy, in order to investigate, in different clinical practices and realities, efficacy and effectiveness of our nutritional protocol during Sars-COV2 hospital treatments.
Conflicts of interest
The authors certify that there is no conflict of interest with any financial organization regarding the material discussed in the manuscript.
Funding
The authors report no involvement in the research by the sponsor that could have influenced the outcome of this work.
Authors’ contributions
Ilenia Grandone and Carmela Bagnato have given substantial contributions to the conception or the design of the manuscript, Luisa Barana and Massimiliano Cavallo to acquisition, analysis and interpretation of the data. All authors have participated to drafting the manuscript, Ilenia Grandone, Carmela Bagnato and Gaetano Vaudo revised it critically. All authors read and approved the final version of the manuscript.
ONS-COVID Group
Mariangela Bonanno, Eva Mirri, Mariangela Palazzi, Federica Ranucci, Alessandra Teofrasti (Diabetology, Dietetics and Clinical Nutrition Unit, Santa Maria Hospital, Terni, Italy); Cinzia Di Giuli, Lavinia Maria Saraca, Francesco Sicari (Infectious Diseases Unit, Santa Maria Hospital, Terni, Italy); Anna Fineo (Infectious Diseases Unit, Santa Maria delle Grazie Hospital, Matera, Italy).
Acknowledgments
The authors acknowledge Massimiliano Povero and Lorenzo Pradelli for statistical analysis
References
[1] | Coperchini F , Chiovato L , Croce L , Magri F , Rotondi M . The cytokine storm in COVID- An overview of the involvement of the chemokine/chemokine-receptor system. Cytokine Growth Factor Rev. (2020) ;53: :25–32. doi: 10.1016/j.cytogfr.2020.05.003. Epub 2020. |
[2] | Wang J , Jiang M , Chen X , Montaner LJ . Cytokine storm and leukocyte changes in mild versus severe SARS-CoV-2 infection: Review of COVID-19 patients in China and emerging pathogenesis and therapy concepts. J Leukoc Biol. (2020) ;108: (1):17–41. doi: 10.1002/JLB.3COVR0520-272R. Epub 2020 Jun 13. PMID: 32534467; PMCID: PMC7323250. |
[3] | Han H , Ma Q , Li C , Liu R , Zhao L , Wang W , Zhang P , Liu X , Gao G , Liu F , Jiang Y , Cheng X , Zhu C , Xia Y , Profiling serum cytokines in COVID-19 patients reveals IL-6 and IL-10 are disease severity predictors. Emerg Microbes Infect.-30. (2020) ;9: (1):1123–30. doi: 10.1080/22221751.2020.1770129. PMID: 32475230; PMCID: PMC7473317. |
[4] | Channappanavar R , Perlman S . Pathogenic human coronavirus infections: causes and consequences of cytokine storm and immunopathology. Semin Immunopathol.529. (2017) ;39: (5)529–39. doi:10.1007/s00281-017-0629-x. Epub 2017 May 2. PMID: 28466096; PMCID: PMC7079893. |
[5] | Van Hall G , Steensberg A , Fischer C , Keller C , Møller K , Moseley P , Pedersen BK . Interleukin-6 markedly decreases skeletal muscle protein turnover and increases nonmuscle amino acid utilization in healthy individuals. J Clin Endocrinol Metab. (2008) ;93: (7)2851–8. doi:10.1210/jc.2007-2223. Epub 2008 Apr 22. PMID: 18430776. |
[6] | Barazzoni R , Bischoff S , Breda J , Wickramasinghe K , Krznaric Z , Nitzan D , Pirlich M , Singer P , ESPEN expert statements and practical guidance for nutritional management of individuals with SARS-CoV-2 infection, Clinical Nutrition (2022) ;39: :1631–8, doi: org/10.1016/j.clnu.2020.03.022. |
[7] | Cardinale V , Capurso G , Ianiro G , Gasbarrini A , Arcidiacono PG , Alvaro D . Intestinal permeability changes with bacterial translocation as key events modulating systemic host immune response to SARS-CoV- A working hypothesis. Dig Liver Dis. (2020) ;52: (12):1383–9, doi: 10.1016/j.dld.2020.09.009. Epub 2020 Sep 16. PMID: 33023827; PMCID: PMC7494274. |
[8] | Neurath M , Covid-19 and immunomodulation in IBD, Gut. (2020) ;69: :1335–42, doi: 10.1136/gutjnl-2020-321269. |
[9] | Hu B , Huang S , Yin L , The cytokine storm and COVID-19, Journal of Medical Virology. (2020) doi: 10.1002/jmv.26232. |
[10] | Aktas B , Aslim B , Gut-lung axis and dysbiosis in COVID-19, Turkish Journal of Biology. (2020) ;44: (3):265–72, doi:10.3906/biy-2005-102. |
[11] | Ahlawat S , Asha , Sharma KK . Immunological co-ordination between gut and lungs in SARS-CoV-2 infection. Virus Res.03. (2020) ;286: :198103. doi: 10.1016/j.virusres.2020.198103. Epub 2020 Jul 24. PMID: 32717345; PMCID: PMC7380259. |
[12] | Grandone I , Cavallo M , Barana L , Cerasari A , Luca G , Vaudo G . A TGF - beta2 enriched formula as an oral nutritional supplement for hospitalized COVID-19 patients. Minerva Gastroenterol (Torino). 2021. doi: 10.23736/S2724-5985.21.02820-8. PMID: 33856141. |
[13] | Resende Ferreira T , Albuquerque A , Cancela Penna F , Macedo Rosa> R , Toulson Davisson Correia M , Afonso Barbosa A , Salles Cunha A , Abreu Ferrari M , Effect of oral nutrition supplements and TGF-β2 on nutrition and inflammatory patterns in patients with active Chron’s disease Nutrition in Clinical Practice. 2019 00, 0 xxx 1-9 doi: 10.1002/nc10448. |
[14] | Fell JM Control of systemic and local inflammation with transforming growth factor beta containing formulas. JPEN J Parenter Enteral Nutr.S126-8; discussion S129-33, S184-8. (2005) ;29: (4 Suppl):S126-8; discussion S129-33, S184–8. doi:10.1177/01486071050290S4S126. PMID: 15980274. |
[15] | Keene ON , Davis RL , Koch GG . Use of generalized estimating equations in a trial in influenza to explore treatment effects over time, Pharmaceutical Statistics. (2004) ;3: (4):281–7. doi:org/10.1002/pst.141. |
[16] | Evans DC , Corkins MR , Malone A , Miller S , Mogensen KM , Guenter P , Jensen GL ; ASPEN Malnutrition Committee. The Use of Visceral Proteins as Nutrition Markers: An ASPEN Position Paper. Nutr Clin Pract. (2021) ;36: (1):22–8. doi:10.1002/nc10588. Epub 2020 Oct 30. PMID: 33125793. |
[17] | Sharma K , Mogensen KM , Robinson MK . Pathophysiology of Critical Illness and Role of Nutrition. Nutr Clin Pract. (2019) ;34: (1):12–22. doi:10.1002/nc10232. Epub 2018 Dec 23. PMID: 30580456. |
[18] | Iddir M , et al. Strengthening the immune system and reducing inflammation and oxidative stress through diet and nutrition: considerations during the COVID-19 crisis. Nutrients. 2020:12. |
[19] | Clark MA , Hentzen BTH , Plank LD , Hill GH . Sequential changes in insulin-like growth factor 1, plasma proteins, and total body protein in severe sepsis and multiple injury. JPEN J Parenter Enteral Nutr. (1996) ;20: (5):363–70. |


