
Lipid profile improvement of food products containing bioactive compounds from unsaponifiable matters of palm fatty acid distillate in hypercholesterolemia rats
Abstract
BACKGROUND:
Unsaponifiable matters (USM) from palm fatty acid distillate (PFAD) contains vitamin E (mainly tocotrienols), phytosterols, and squalene that have ability to reduce blood cholesterol. Fortification of USM into food products is a way for hypercholesterolemia management.
OBJECTIVE:
This study evaluated effects of fortification of USM from PFAD into instant noodle, bread, and biscuit on lipid profile improvement of hypercholesterolemia rats. It was also aimed to compare the effects of different type of foods as USM carrier that represented different processing steps and nutritional composition.
METHODS:
Rats were divided into control-standard diet and atherogenic diet fed groups, and 6 hypercholesterolemia groups fed by instant noodle, plain bread, and biscuit with 1% USM fortification and without fortification for 8 weeks. Lipid profile (total cholesterol, triglyceride, LDL cholesterol, and HDL cholesterol) was analysed at week 0, 4, and 8. Hepatic and fecal cholesterol and bile acid were also examined at the end of experiment to elucidate some mechanism of cholesterol lowering due to USM fortified foods administration.
RESULTS:
Some bioactive compounds lost during USM fortified food preparation and the highest retention was found in biscuit. Lipid profile improvement was indicated by reduction of total cholesterol, triglyceride, and LDL cholesterol, meanwhile HDL cholesterol increased. Type of fortified foods affected the level of alteration of lipid profile. Degree of lipid profile improvement was affected by nutritional composition of fortified foods, food intake of the rats, and level of bioactive content. Bioactive compounds in USM fortified foods inhibited cholesterol absorption that indicated by higher fecal cholesterol and bile acid compared to atherogenic diet fed group. Modulation of cholesterol synthesis was likely to occur that indicated by lower hepatic cholesterol and higher bile acids.
CONCLUSIONS:
Feeding of USM fortified food products improved lipid profile of hypercholesterolemia rats.
1Introduction
Palm oil contains minor components that demonstrate major nutritional and health benefits including carotenoids, tocopherols, tocotrienols, sterols, phospholipids, glycerolipids, and squalene [1]. Palm fatty acid distillate (PFAD) is a by-product of palm oil refining in deodorization step. PFAD contained bioactive compounds such as vitamin E 196 ppm mainly tocotrienols, phytosterols 7476 ppm, and squalene 2373 ppm [2]. Separation of bioactive compounds from PFAD is by saponification that produced unsaponifiable matters (USM). USM from PFAD had vitamin E of 0.80%, phytosterols of 9.16%, and squalene of 1.14% [3]. Other study (Estiasih et al., 2014) showed that USM of PFAD contained vitamin E 1.96%, phytosterols 0.55%, and squalene 32.30%. Vitamin E of USM comprised of 83% tocotrienols and the remaining is tocopherol. Phytosterols of USM contained 0.42% beta sitosterol and 0.13% campesterol [2].
Squalene (2,6,10,15,19,23-hexamethyl-2,6,10,14,18,22-tetracosahexaene) is a biosynthetic precursor of steroids [4]. In animals, supplementation of the diet with squalene can reduce cholesterol and triglyceride levels. Squalene feeding produced a significant increase in fecal excretion of cholesterol, its nonpolar derivatives, and bile acids. The antioxidant and oxygen carrying properties of squalene predicts its potential in preventing cardiovascular disease [5]. Shin et al. [6] reported amaranth squalene reduced lipid serum and liver.
Phytosterols are triterpenes similar with cholesterol in structure, that have four-ring steroid nucleus, the 3 β hydroxyl group, and often a 5,6-double bond [7]. The cholesterol-lowering action of phytosterols/phytostanols is thought to occur, at least in part, through competition with dietary and biliary cholesterol for intestinal absorption in mixed micelles. It suggests that phytosterols/phytostanols regulate cholesterol metabolism both in enterocytes and hepatocytes [8]. Lin et al. [9] reported that phytosterols supplemented to the diet reduce intestinal cholesterol absorption and plasma low-density lipoprotein (LDL)-cholesterol.
Tocotrienols are a class of vitamin E which modulates several mechanisms associated with cardio-protection. Tocotrienols possess inimitable properties and hypocholesterolemic effects together by reducing the atherogenic apolipoprotein and lipoprotein plasma level. Rich sources of tocotrienols which include rice bran, palm oil, and other edible oils exhibit protective effect against cardiovascular disorders [10]. Wilson et al. [11] reported that tocotrienol rich fraction from palm oil improved dyslipidemia. Tocotrienols also act as HMG-CoA reductase inhibitor and have inhibitory effect on monocyte endothelial adhesion. Degree of inhibition is affected by tocotrienol types [12].
Mostly of USM from edible oil contains bioactive compounds that consists one or more of tocopherols, tocotrienols, squalene, phytosterols, and carotenoids. Health benefits of USM from edible oil are related to its bioactive compounds. Kahlon and Smith [13] reported cholesterol-lowering activity of unsaponifiable matters of rice bran oil. USM from PFAD significantly affected blood serum total cholesterol reduction in a dose dependent manner [2].
Incorporation of USM from edible oil into food products is still limited. In this study, we examined PFAD USM fortified food products on the cholesterol lowering effect in hypercholesterolemic rats. We also compared different type of foods, instant noodle, biscuit, and bread, as PFAD USM carrier that represented different steps of processing and nutritional composition.
2Materials and methods
2.1Materials
PFAD was kindly obtained from a palm oil refinery, PT Salim Ivoma Pratama, Surabaya, East Java, Indonesia. Reagents for USM PFAD preparation were technical grade and for analysis were pro analysis from Merck. Wistar male rats age 8–12 weeks with body weight 150–200 g, AIN-93M standard diet, atherogenic diet, serum blood lipid profile analysis kit from Diasys, and total bile acid analysis kit from Diasys were used for in vivo study.
2.2USM preparation from PFAD
Preparation of USM from PFAD was referred to our previous method [2].
2.3Preparation of USM fortified food products
Food products that incorporated by USM from PFAD were instant noodle, plain bread, and biscuit. Level of USM addition was 1% (w/w wet basis).
In general, instant noodle preparation was mixing of ingredients (wheat flour, salt, water, whole egg, and alkaline water). USM was added of 1% from total weight of ingredients. The ingredients were mixed until smooth, then sheeted and molded to have the strands of noodle. Noodle strands were then steamed for 10 min at 100°C and fried in palm oil for 15 s.
Bread was prepared as followed: ingredients (wheat flour, sugar cane, instant yeast, milk powder) were mixed, then other ingredients (egg yolk, margarine, warm water) and USM (1% w/w) were added and mixed thoroughly to obtain smooth dough. The dough was let for 30 min to expand and then divided into 100 g and the gas was removed by pressing the dough. The dough was put in baking tray and then baked at 180°C for 20 min.
Biscuit was made by mixing butter, margarine, and sugar powder for 2-3 min. Other ingredients (wheat flour, egg yolk, baking powder, salt, vanilla) and USM (1% w/w) were added and mixed until the dough was smooth. The dough was sheeted and cut in 4×4×1 cm in size then baked for 10–15 min at 180°C.
Fortified food products were analyzed for tocotrienols, tocopherols, squalene, and phytosterols.
2.4Cholesterol lowering effect evaluation
This animal study was approved for Ethical Clearance No. 608-KEP-UB from Animal and Care and Use Committee, Brawijaya University. As many as 40 male Wistar rats (Rattus novergicus) were adapted for 1 week at 20–25°C temperature and fed ad libitum by standard diet AIN-93M (Table 1).
Table 1
Composition of standard diet AIN-93M and atherogenic diet
| Ingredient | Composition (g/kg diet) | |
| AIN-93M* | Atherogenic Diet | |
| Corn Starch | 620,692 | 620,692 |
| Casein | 140 | 116,528 |
| Sucrose | 100 | 100 |
| Soy bean oil | 40 | 40 |
| CMC | 50 | 50 |
| Mineral mix | 35 | 35 |
| Vitamin mix | 10 | 10 |
| L-cystine | 1,8 | 1,8 |
| Choline bitartrate | 2,5 | 2,5 |
| TBHQ | – | – |
| Cholic Acid | – | 2 |
| Cholesterol | – | 20 |
| Tallow | – | 185 |
* Reeves [14].
Rats were divided into 8 groups (each group was 5 rats) that consisted of a control (normal) group fed with standard diet (K1) [14], and 7 hypercholesterolemia groups which fed with instant noodle without fortification (K2), plain bread without fortification (K3), biscuit without fortification (K4), USM fortified instant noodle (K5), USM fortified plain bread (K6), USM fortified biscuit (K7), and atherogenic diet (Table 1) (K8).
Hypercholesterolemia condition was achieved by atherogenic diet (Table 1) based on standard diet AIN-93M with addition of tallow, cholesterol, and cholic acid. After achieving total cholesterol level more than 200 mg/dl, the treatment was started and every 4 weeks blood sample was collected by retro orbital plexus for 8 week experiment. Analysis of serum lipid profile included total cholesterol, HDL cholesterol, and LDL cholesterol photometrically by CHOD-PAP method (Cholesterol Oxidase-Phenol Aminophenazone) [15], triglyceride analysis was conducted using GPO-PAP method (Glycerol-3-Phosphate-Phenol Aminophenazone) [16]. The rest of feed was collected and weighted everyday for measuring average food intake and obtained the body weight of the rats every week for 8-week experiment.
Rat feces and liver was collected in the end of experiment and analyzed for cholesterol concentration by Liebermann-Burchard method [17], fecal, and liver bile acid concentration. Fecal preparation was conducted by Boue et al. [18] method, and liver preparation was according to Parker et al. [19] method. About 20 μL sample was mixed with reagent from EnzyFluo Bile Acids Assay Kit (Diasys) and analyzed in ELISA with fluorescent detection (WTW America micro plate) at λ530 nm.
2.5USM preparation from fortified food products for bioactive compounds analysis
Lipid was extracted from the products by method of Bligh and Dyer [20]. Extracted lipid was subsequently saponified according to our previous method [2] to obtain unsaponifiable matters (USM). USM was further prepared for phytosterols, vitamin E, and squalene analysis.
2.5.1Phytosterols analysis
Phytosterols analysis used high performance liquid chromatography (HPLC). About 1 mg of USM was diluted in ethanol 1 mL and then filtered. As much as 20 μL of solution was injected to HPLC (Shimadzu LC20AT) with C18 PPODS column 250×4.6 mm and uv vis detector (Shimadzu SPD20A) at 206 nm. Mobile phase was methanol:water (99:1 v:v) with 1 mL/min flow rate. Standards for identification and qualification were stigmasterol, β-sitosterol, and campesterol (Santa Crus Biotech, USA).
2.5.2Vitamin E analysis
Analysis of vitamin E used HPLC. As much as 1 mg of USM was diluted in 1 mL ethanol and subsequently filtered. As much as 20 μL solution was analyzed in HPLC (Shimadzu LC20AT) with C18 PPODS column 250×4.6 mm and uv vis detector (Shimadzu SPD20AT) at 295 nm. Mobile phase was methanol:water (95:5 v:v) with 1 mL/mm flow rate. Standards for identification and quantification were α-tocopherol, α-tocotrienol, δ-tocotrienol, and γ-tocotrienol (Santa Cruz Biotech, USA).
2.5.3Squalene analysis
Analysis of squalene used gas chromatography - mass spectrophotometry (GC-MS). About 10 mg of USM was put into reaction tube and added by 10 μL MSTFA. the mixture was heated at 60°C for 15 min. External standard of squalene was used for quantification that prepared by diluted 1 mg of this standard with 100 μL MSTFA and the mixture was heated at 60°C for 15 min. As much as 1 μL of derivatized sample was injected into GC-MS (GCMS-QP20120S Shimadzu) with column (AGILENT DB-1) 30 m, i.d. 0.25 mm, helium as carrier gas and ionization EI 70 Ev. GC operational condition was oven temperature of 80°C, injector temperature of 310°C, pressure of 16.5° kPa, total flow rate of 80.0 mL/min, column flow rate of 0.50 mL/min, linear velocity of 26.1 cm/s, supporting gas rate of 3.0 mL/min and split ratio of 153.0. Initial temperature was 80°C and hold for 5 min. Temperature was increased with rate of 10°C/min to the temperature of 305°C and hold for 25 min. MS analysis was conducted at ion source temperature of 250°C, interface temperature of 310°C, solvent cut time of 4.80 min, scan speed of 1250, start m/z 28.0 and end m/z 600.0. Squalene standard (Santa Cruz Biotech, USA) was used as an external standard.
2.6Statistical analysis
Data was analyzed for analysis of variance and further tested by Duncan Multiple Range Test using Sirichai software.
3Result
3.1Composition of PFAD, USM, and USM fortified foods
Data in Table 2 showed that during preparation of foods, bioactive compounds reduced significantly. Type of products affected retention of bioactive compounds. Stability of bioactive compounds during food processing was also varied. Phytosterols was the most abundant bioactive compound in all foods. The second abundant was squalene and the least was vitamin E. Biscuit had the highest amount of phytosterols and squalene. Instant noodle had the highest amount of vitamin E and medium amount of phytosterols and squalene compared to bread and biscuit. Bread had the lowest amounts of bioactive compounds among all foods.
Table 2
Bioactive compounds in PFAD, USM, and USM fortified food products
| Bioactive Compound (mg/100 g) | PFAD | USM | Estimation in 1% USM addition | USM Fortified Product | ||
| Biscuit | Instant Noodle | Bread | ||||
| Total vitamin E | 149.19±2.5 | 7714.79±84.32 | 77.14 | 23.46±0.71 | 35.76±1.09 | 22.68±0.05 |
| α Tocopherol | – | – | – | – | – | |
| α Tocotrienol | 99.77±3.84 | 5158.94±62.26 | 51.58 | 14.72±0.44 | 22.21±0.82 | 20.69±0.03 |
| δ Tocotrienol | 12.07±0.45 | 623.89±8.21 | 6.23 | 1.93±0.03 | 2.76±0.04 | 1.99±0.02 |
| γ Tocotrienol | 37.36±1.26 | 1931.96±20.31 | 19.31 | 6.81±0.12 | 10.85±0.23 | – |
| Total phytosterols | 698.80±25.21 | 36134.78±1231.86 | 361.35 | 261.35±5.01 | 186.43±3.71 | 122.11±2.59 |
| β Sitosterol | 531.08±14.23 | 27462.36±1051.23 | 274.61 | 184.85±3.21 | 123.41±1.43 | 91.88±2.31 |
| Stigmasterol | 41.90±1.42 | 2166.79±10.24 | 21.67 | 14.39±0.56 | 5.03±0.24 | 3.82±0.04 |
| Campesterol | 125.81±2.41 | 6505.83±32.21 | 65.09 | 62.11±1.24 | 57.99±2.04 | 26.41±0.24 |
| Squalene | 1017.26±34.28 | 16597.94±421.45 | 165.97 | 128.45±2.26 | 72.51±1.42 | 56.29±1.25 |
PFAD = Palm Fatty Acid Distillate, USM = Unsaponifiable Matters.
Nutritional composition of fortified and unfortified food products was shown in Tables 2 and 3. Fortification of USM into all food products slightly changed nutritional composition. Biscuit had the highest fat and carbohydrate among food products, and the lowest crude fiber. The highest protein was found in instant noodle. Fat and carbohydrate possibly affected lipid profile improvement of USM fortified foods. Bread showed the lowest calorie due to low fat content.
Table 3
Nutritional composition of unfortified and USM fortified food products
| Nutrition | Unfortified | USM Fortified | ||||
| Biscuit | Instant Noodle | Bread | Biscuit | Instant Noodle | Bread | |
| Fat (%, db) | 27.49±0.49 | 15.93±0.65 | 5.22±0.21 | 27.98±0.54 | 15.93±0.26 | 5.25±0.002 |
| Protein (%, db) | 8.52±0.07 | 10.52±0.32 | 8.79±0.41 | 8.04±0.13 | 10.50±0.38 | 8.53±0.19 |
| Carbohydrate (%, db) | 60.36±0.47 | 66.47±1.42 | 54.19±2.24 | 60.07±0.66 | 59.70±1.64 | 54.63±0.07 |
| Crude Fiber (%, db) | 0.24±0.08 | 1.78±0.04 | 1.05±0.03 | 0.22±0.02 | 1.58±0.38 | 1.79±0.05 |
| Calorie (kcal) | 524.01±6.78 | 451.33±4.21 | 298.9±5.43 | 524.26±8.02 | 424.17±10.42 | 299.89±1.06 |
USM = Unsaponifiable Matters.
3.2Average intake of feed
Average intake of feed during 8 week experiment was shown in Fig. 1. The highest intake was found in groups fed by bread either USM fortified or non USM fortified bread. Statistically, the lowest intake was found in group of rats fed by USM fortified instant noodle and USM fortified biscuit. It was apparent that intake of food products without USM fortification was higher than their corresponding USM fortified foods. Off flavor from USM presumably affected rat acceptability of fortified foods.
Fig.1
Average intake of feed during 8 week feeding by USM fortified foods (K1 = control group, standard diet; K2 = hyphercholesterolemia, instant noodles; K3 = hypercholesterolemia, bread; K4 = hypercholesterolemia, biscuit; K5 = hypercholesterolemia, USM fortified instant noodle; K6 = hypercholesterolemia, USM fortified bread; K7 = hypercholesterolemia, USM fortified biscuit, K8 = hypercholesterolemia, atherogenic diet). Mean that followed by the same notation means not significantly different at α= 0.05. USM = Unsaponifiable Matters.
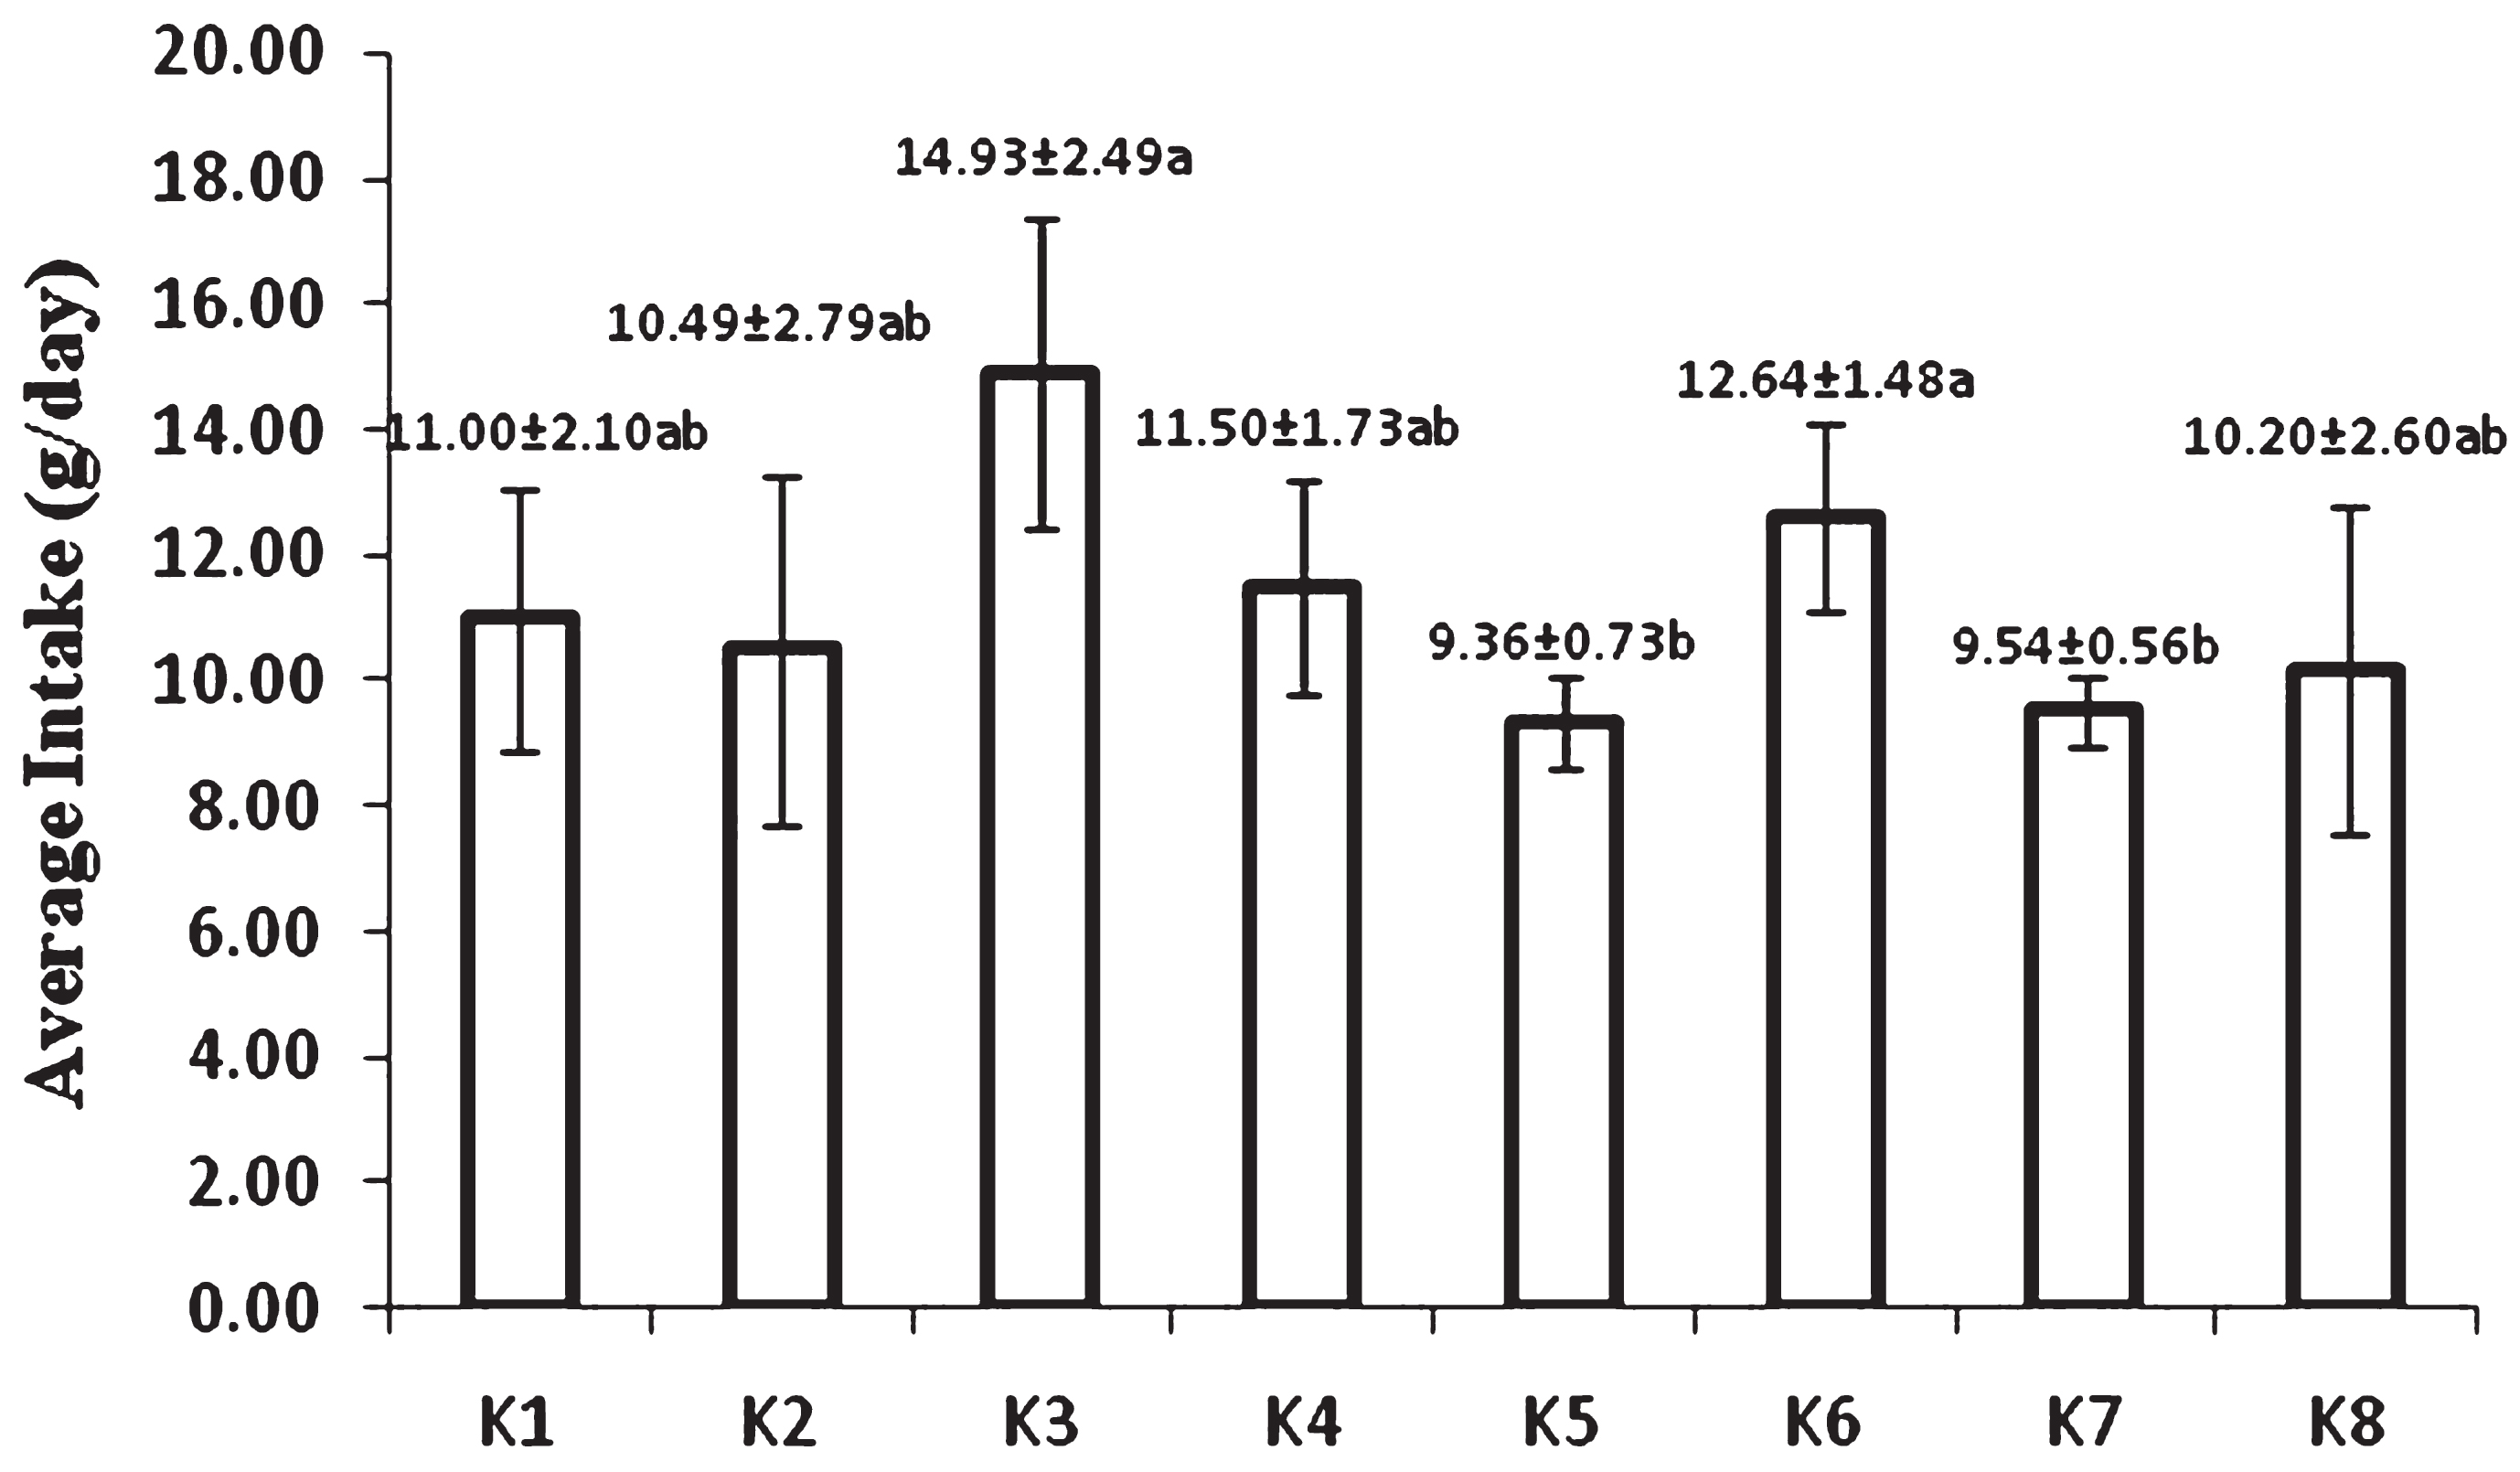
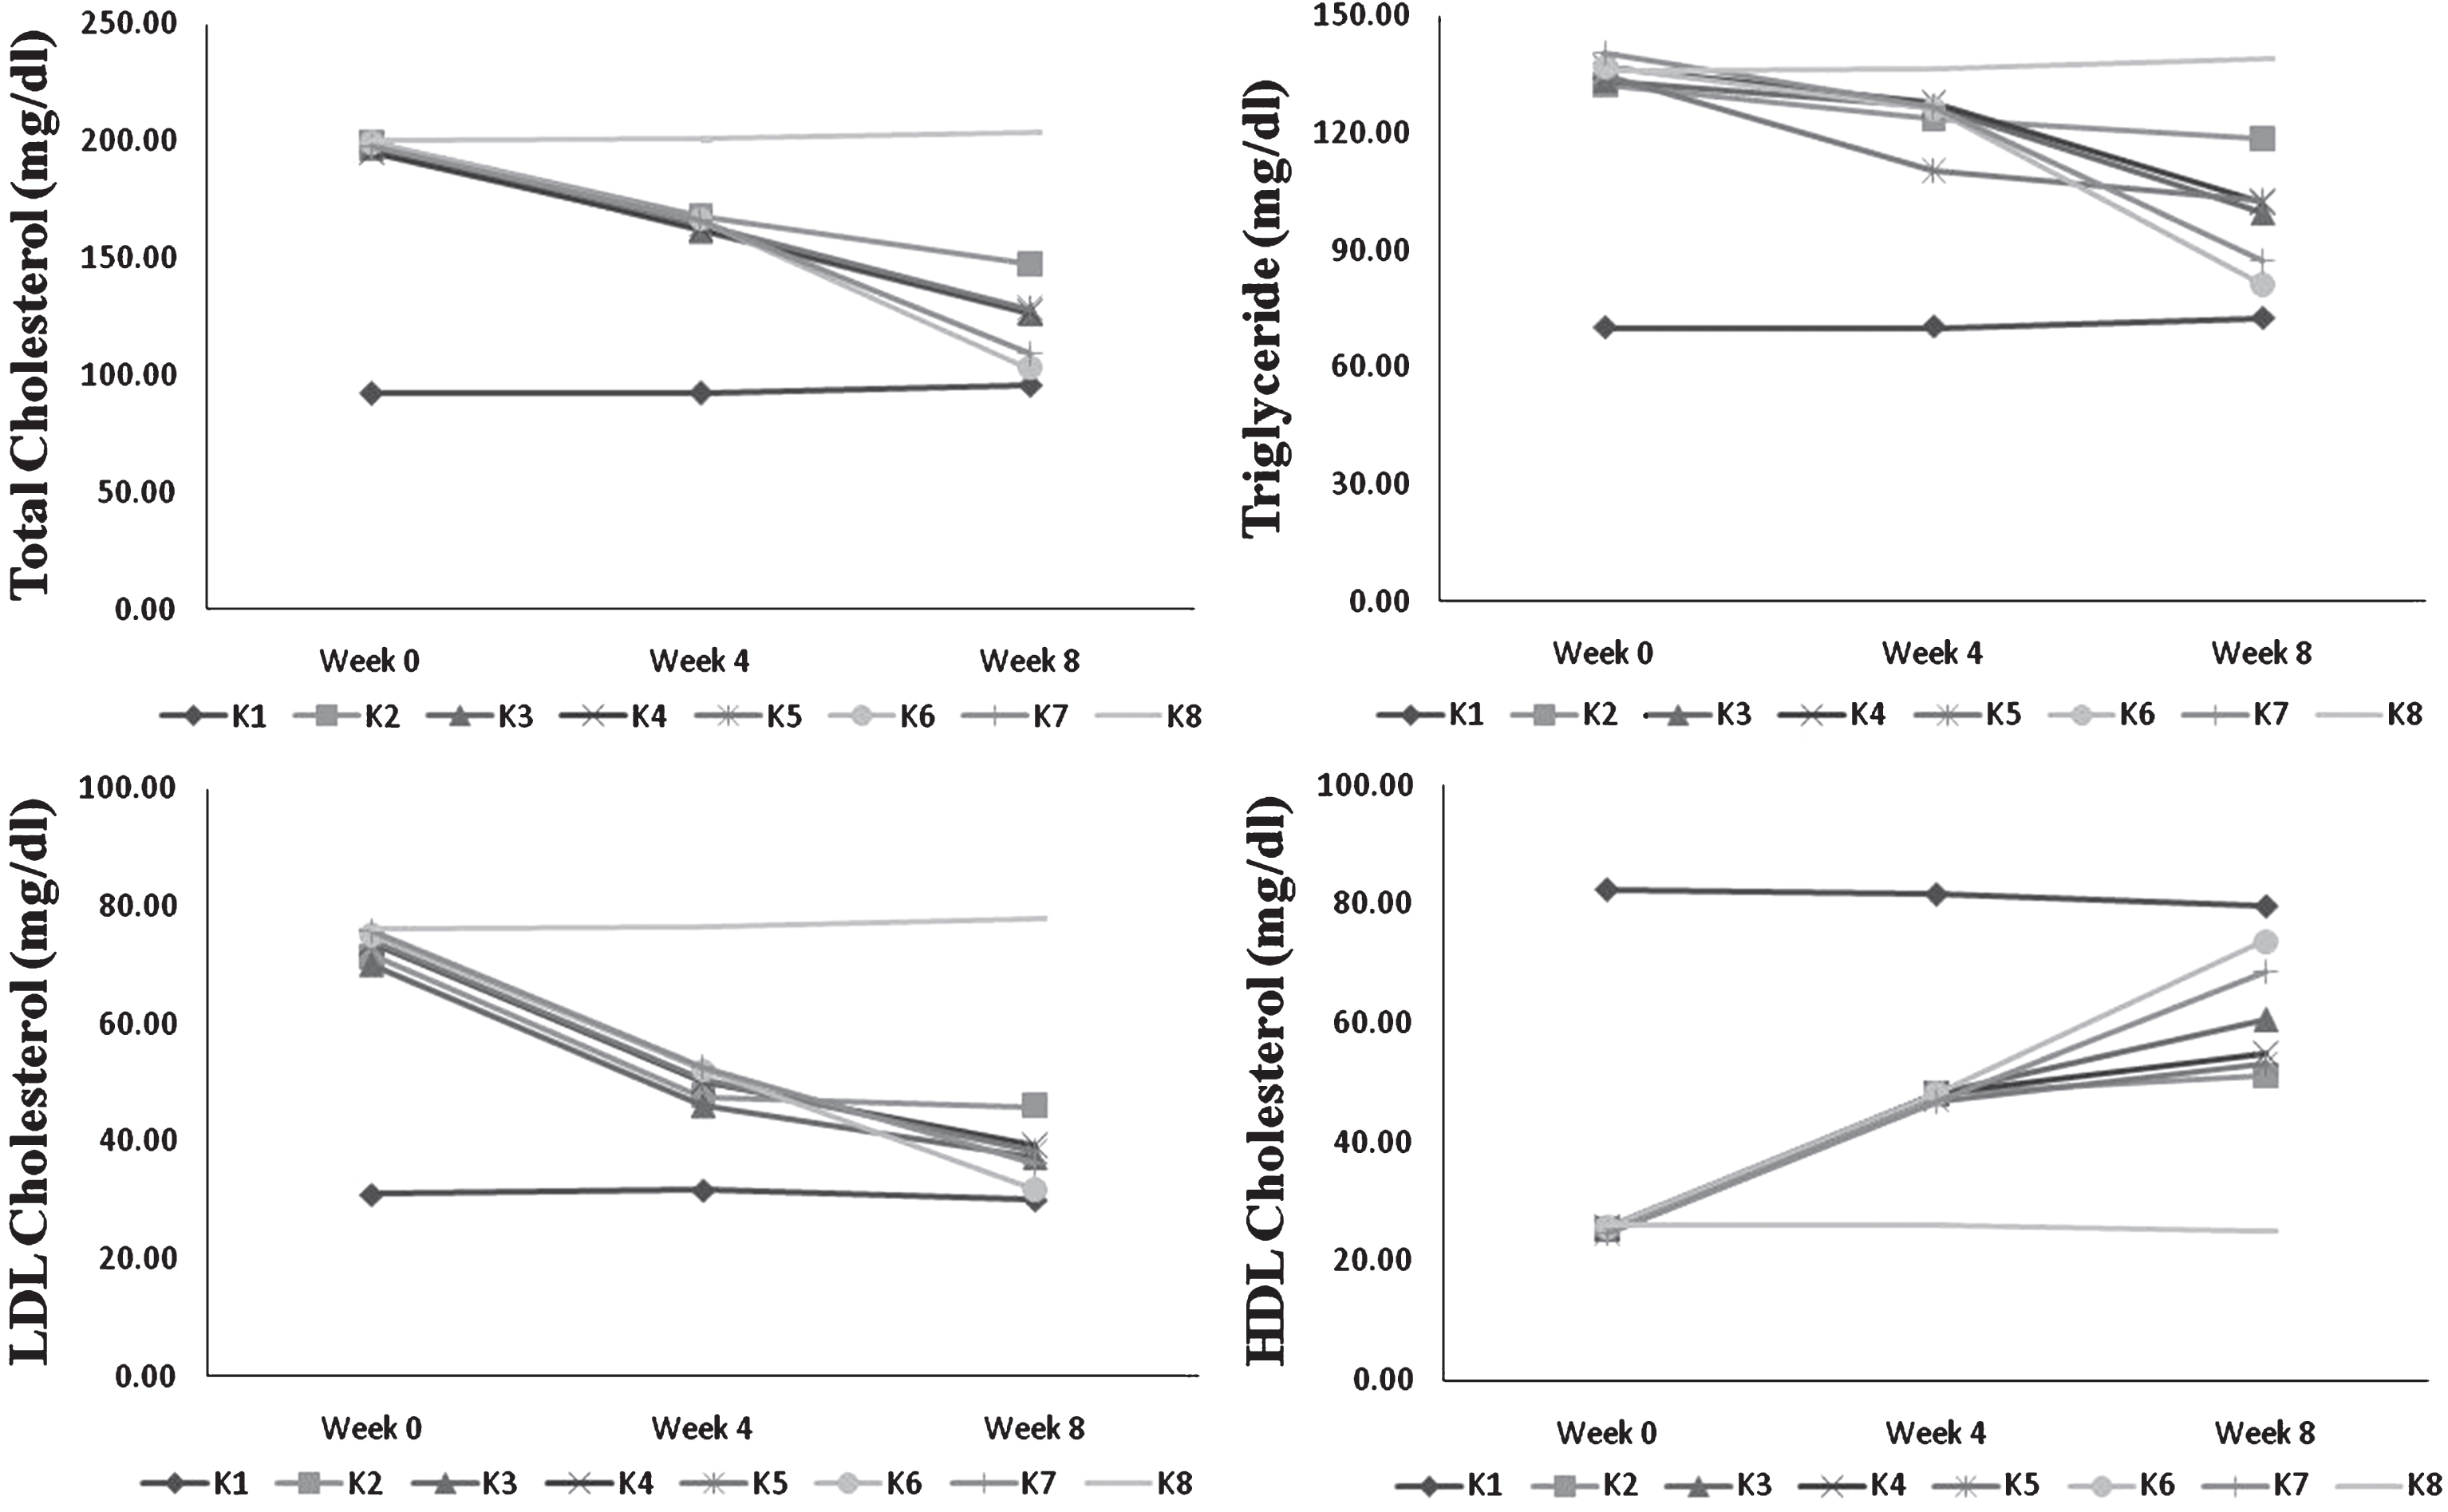
Fig.2
Profile lipid of blood serum during 8 week feeding by USM fortified foods (K1 = control group, standard diet; K2 =hypercholesterolemia, instant noodles; K3 = hypercholesterolemia, bread; K4 = hypercholesterolemia, biscuit; K5 = hypercholesterolemia, USM fortified instant noodle; K6 = hypercholesterolemia, USM fortified bread; K7 = hypercholesterolemia, USM fortified biscuit, K8 = hypercholesterolemia, atherogenic diet). USM = Unsaponifiable Matters.
3.3Blood serum lipid profile
Lipid profile improvement was found in group of rats fed by all USM fortified food products during 8-week feeding (Table 4). Hypercholesterolemia group fed by atherogenic diet (K8) still exhibited high total cholesterol, triglyceride, and LDL cholesterol that differed significantly to all other treatments. Conversely, lipid profile improvement was found in all food products either by USM fortification or without fortification. However, all USM fortified foods showed better improvement of lipid profile. Group of rats fed by USM fortified bread (K6) had the highest reduction of total cholesterol, triglyceride, and LDL cholesterol. Its group also had highest HDL cholesterol enhancement. USM fortified instant noodle (K5) showed the least improvement in lipid profile among other USM fortified foods. Total cholesterol, triglyceride, and LDL cholesterol level of this group (K5) also did not significantly different to unfortified bread (K3) and biscuit (K4). While USM fortified biscuit (K7) had medium improvement among USM fortified foods and still had better improvement than unfortified foods.
Table 4
Blood serum lipid profile at week 8 of experiment
| Group | Total Cholesterol | Triglyceride | LDL Cholesterol | HDL Cholesterol | ||||
| mg/dl | % | mg/dl | % | mg/dl | % | mg/dl | % | |
| K1 | 95.21±3.17 a | 3.69 | 72.36±3.69 a | 3.48 | 29.89±3.50 a | – 3.07 | 79.56±2.51 f | – 3.39 |
| K2 | 142.11±8.05 e | – 26.23 | 115.43±6.21 d | – 10.32 | 44.66±2.01 c | – 35.81 | 53.20±3.62 b | 102.24 |
| K3 | 125.78±6.69 d | – 35.83 | 99.17±8.87 c | – 25.59 | 37.09±1.43 b | – 46.93 | 60.44±2.62 c | 137.33 |
| K4 | 126.61±3.76 d | – 34.81 | 102.02±3.94 c | – 25.34 | 39.30±1.65 b | – 46.74 | 55.00±2.51 b | 114.80 |
| K5 | 127.77±4.94 d | – 35.41 | 102.47±4.74 c | – 24.03 | 38.33±1.80 b | – 48.15 | 53.23±1.76 b | 114.87 |
| K6 | 102.31±4.02 b | – 48.45 | 80.75±4.08 b | – 40.90 | 31.83±1.89 a | – 57.64 | 73.82±1.69 e | 186.76 |
| K7 | 108.93±4.46 c | – 44.70 | 87.04±3.57 b | – 37.96 | 36.12±1.33 b | – 52.27 | 68.67±1.98 d | 177.20 |
| K8 | 202.98±1.99 f | 1.63 | 138.88±2.51 e | 2.29 | 77.64±2.21 d | 2.22 | 25.00±2.32 a | – 3.41 |
K1 = control group, standard diet; K2 = hyphercholesterolemia, instant noodles; K3 = hypercholesterolemia, bread; K4 = hypercholesterolemia, biscuit; K5 = hypercholesterolemia, USM fortified instant noodle; K6 = hypercholesterolemia, USM fortified bread; K7 = hypercholesterolemia, USM fortified biscuit, K8 = hypercholesterolemia, atherogenic diet. Percentage was compared to initial level of each lipid profile parameter at week 0. Mean that followed by the same notation means not significantly different at α= 0.05. USM = Unsaponifiable Matters.
3.4Hepatic cholesterol and bile acid
After 8-week treatment, atherogenic diet fed group (K8) showed the highest hepatic cholesterol. The lowest hepatic cholesterol level was found in control-standard diet group (K1). Figure 3a shows that hepatic cholesterol of USM fortified foods was lower than corresponding unfortified foods. USM fortified bread (K6) had the lowest hepatic cholesterol and did not significantly different with control-standard diet group (K1).
Fig.3
Hepatic cholesterol (a) and bile acid levels (b) at week 8 (K1 = control group, standard diet; K2 = hyphercholesterolemia, instant noodles; K3 = hypercholesterolemia, bread; K4 = hypercholesterolemia, biscuit; K5 = hypercholesterolemia, USM fortified instant noodle; K6 = hypercholesterolemia, USM fortified bread; K7 = hypercholesterolemia, USM fortified biscuit, K8 = hypercholesterolemia, atherogenic diet). Mean that followed by the same notation means not significantly different at α= 0.05. USM = Unsaponifiable Matters.
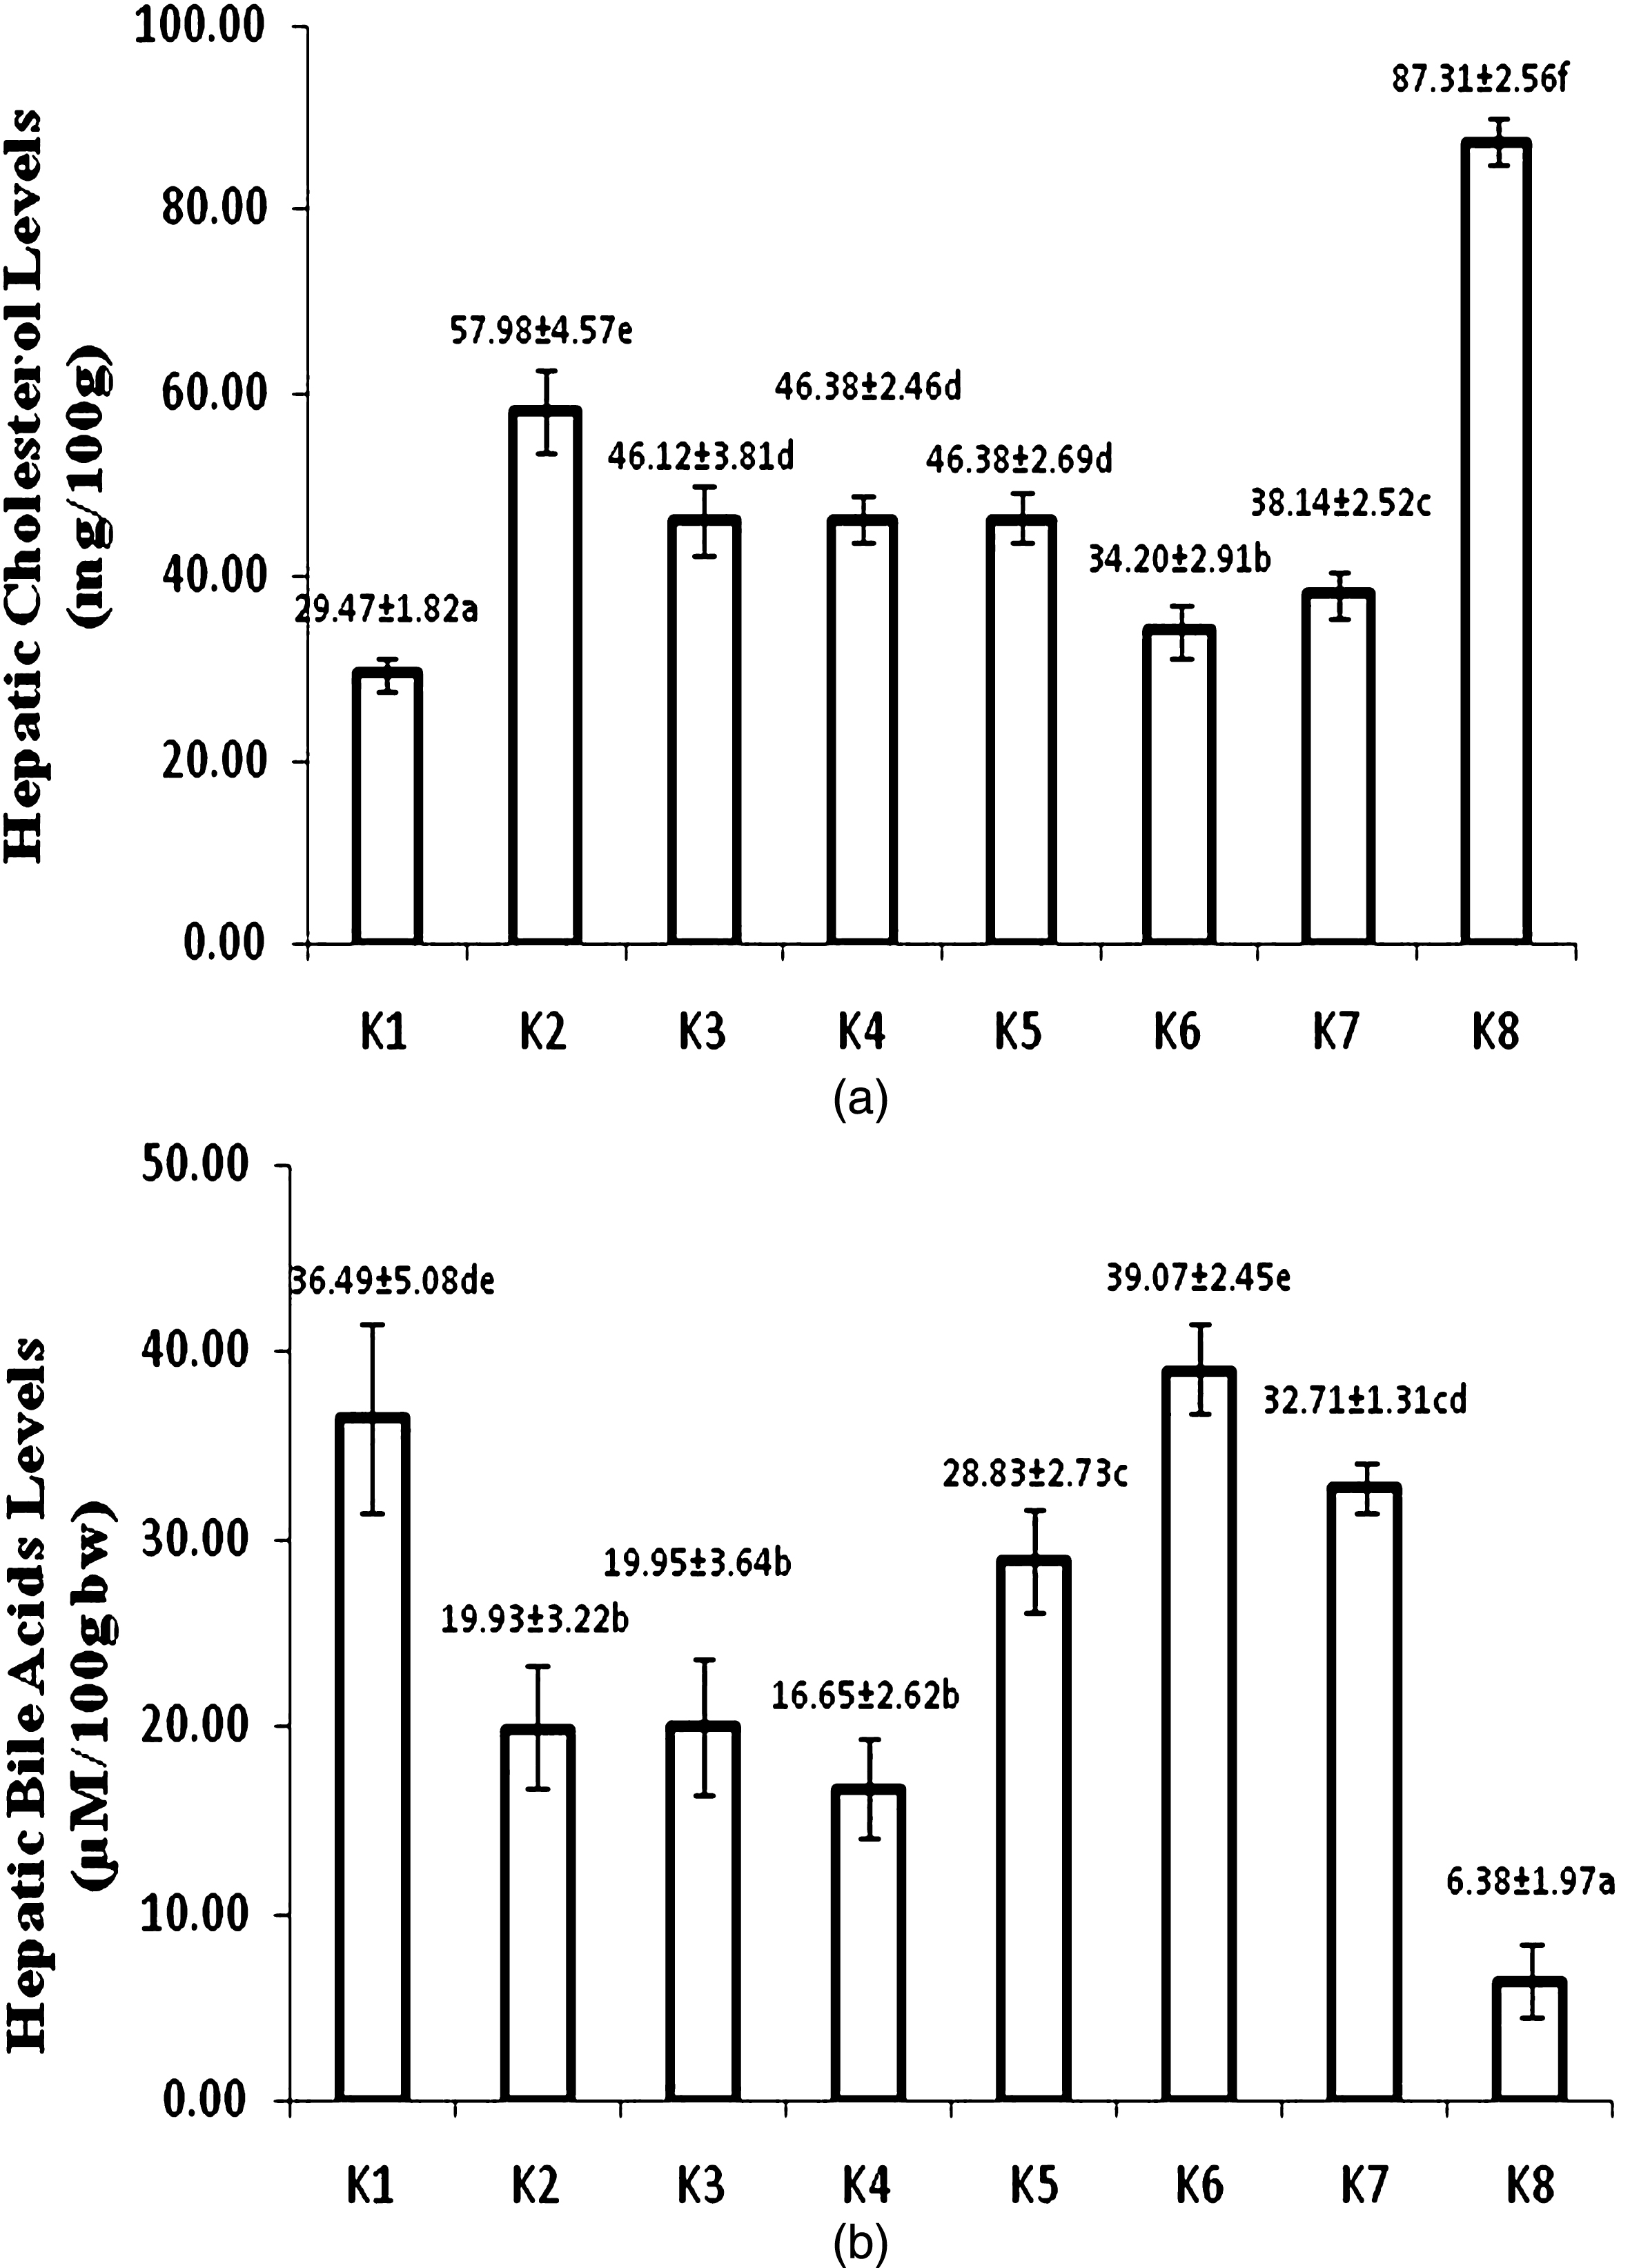
Hepatic bile acid of USM fortified foods were higher than unfortified foods. The highest level of hepatic bile acid was found in group fed with USM fortified bread (k6). While atherogenic diet group (K8) had the lowest level of hepatic bile acid (Fig. 3b).
3.5Fecal cholesterol and bile acid
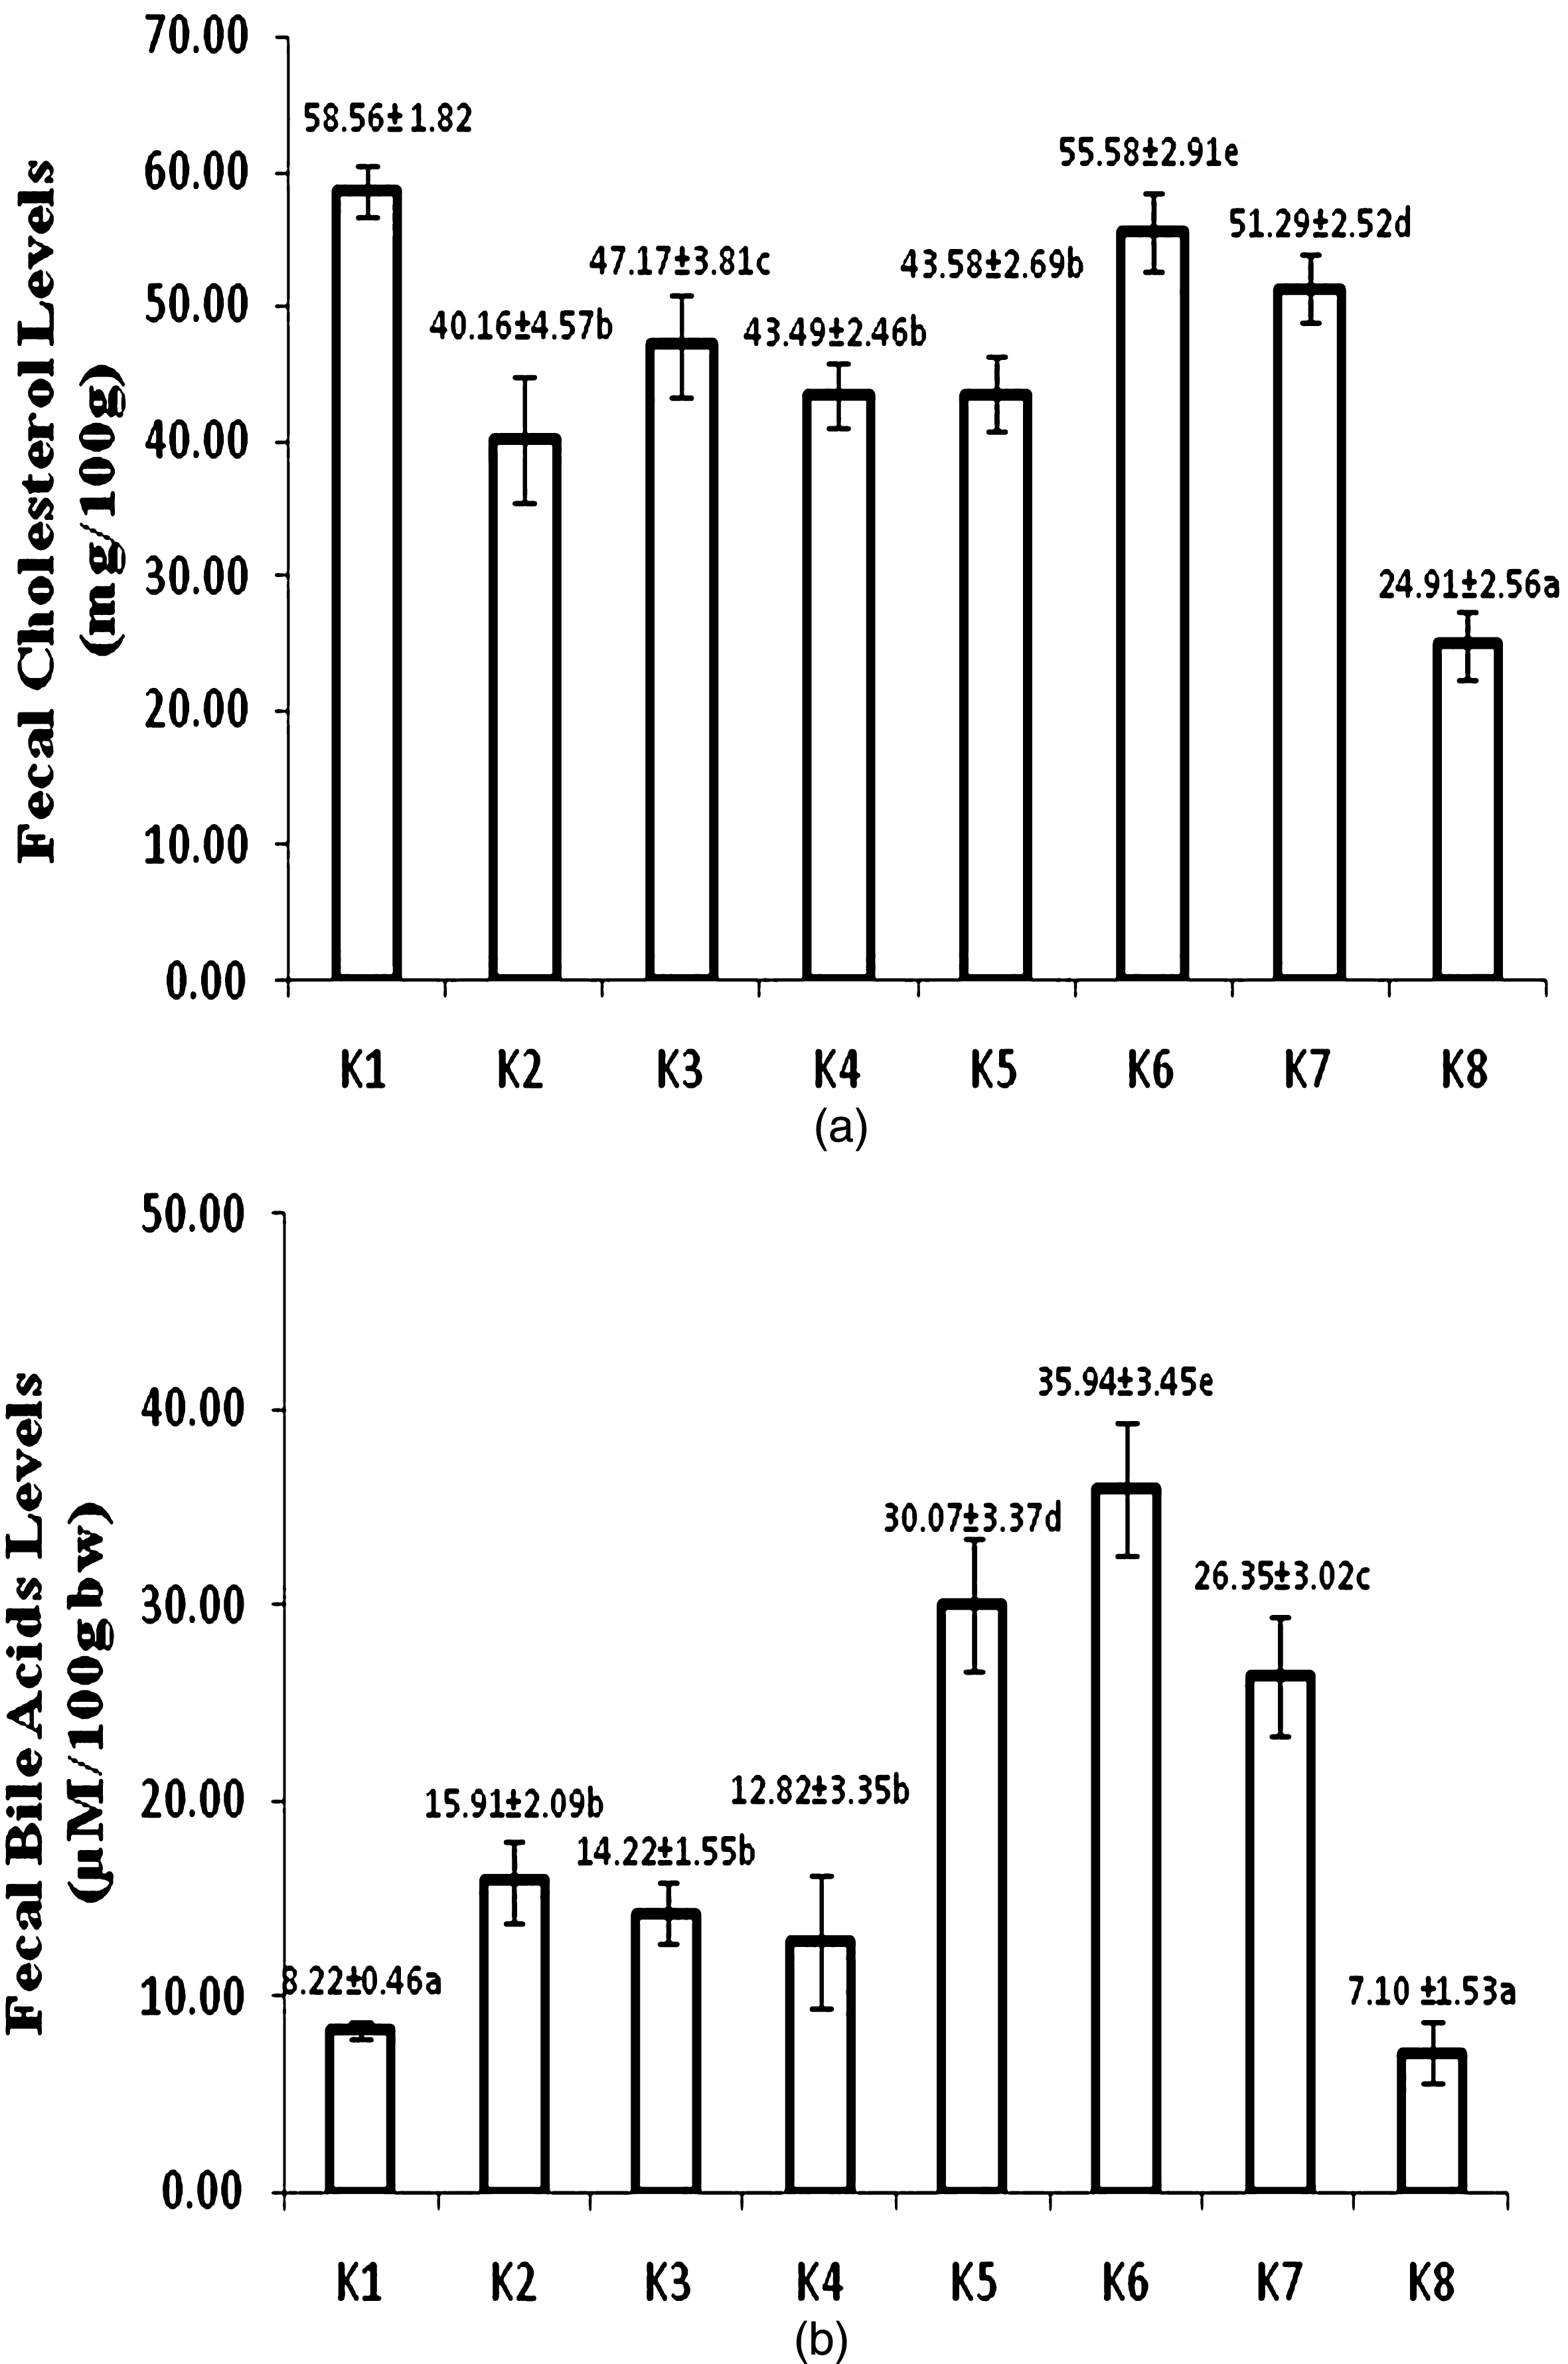
Figure 4a showed fecal cholesterol concentration after 8 week treatment. Atherogenic diet fed group (K8) had the lowest fecal cholesterol level. USM fortified bread fed group (K6) had the highest fecal cholesterol among other USM fortified and unfortified foods. Fecal cholesterol level of USM fortified bread fed group (K8) also did not significantly different with control-standard diet group (K1). Group of rats administered by USM fortified foods also showed enhancement of excreted fecal bile acid. USM fortified bread fed group (K6) had the highest fecal bile acid. Control-standard diet (K1) and atherogenic (K8) fed groups diet had the lowest level of fecal bile acid (Fig. 4b).
Fig.4
Fecal cholesterol (a) and bile acid levels (b) at week 8 (K1 = control group, standard diet; K2 = hyphercholesterolemia, instant noodles; K3 = hypercholesterolemia, bread; K4 = hypercholesterolemia, biscuit; K5 = hypercholesterolemia, USM fortified instant noodle; K6 = hypercholesterolemia, USM fortified bread; K7 = hypercholesterolemia, USM fortified biscuit, K8 = hypercholesterolemia, atherogenic diet). Mean that followed by the same notation means not significantly different at α= 0.05. USM = Unsaponifiable Matters.
4Discussion
4.1Bioactive compounds of PFAD, USM, and USM fortified foods
Instant noodle, biscuit, and bread had different processing, which were affected the stability of bioactive compounds. Biscuit had the simplest processing that involved mixing and baking but using high temperature during baking. Whereas, instant noodle processing was also complicated that comprised of mixing, steaming, and frying, but thermal process in instant noodle processing is in a short time. The most complex process was in bread making that involved mixing, fermentation, and high temperature baking.
The highest level of bioactive compounds in food products was phytosterols, because they were also the most abundant in USM. Phytosterols were able to be oxidized and produced POPs (phytosterol oxidation products) [21]. Kmiecik et al. [22] showed degradation of β sitosterol and campesterol during heating, and campesterol was more stable than sitosterol. The least stable of phytosterols was found in bread. Fermentation in warm temperature was involved in making of bread followed by baking at 180°C for 20 min. Gas production during fermentation and porous matrix formed during baking might increase oxidation of phytosterols. Some phytosterols might dissolve in frying oil during instant noodle preparation and also degraded during high temperature frying. Biscuit showed the most stable of phytosterols, although its preparation involved high temperature. Oxidation presumably occurred mainly in fat before oxidation of phytosterols.
Vitamin E also can degrade during processing. Tocotrienols were not stable during food product preparation. The lowest stability was found in bread, and the most stable was in instant noodle. Gas expansion during fermentation and baking resulted in porous matrix that made tocotrienol enable to contact with oxygen. Park et al. [23] reported under no oxygen conditions, no degradation could be observed even when isomers were exposed to high temperature for long time, while the presence of oxygen resulted in reduction of γ tocotrienol. Biscuit preparation involved high temperature baking that resulted in moderate loss of tocotrienols. The highest tocotrienols retention in instant noodle related to short time high temperature in frying and steaming.
This study showed a decrease of squalene during food processing. The highest reduction of squalene level was found in bread and the lowest decrease was in biscuit. High temperature baking and long processing in bread making contributed to a significant degradation of squalene. As reported by Rastrelli et al. [24], tocopherols prevented the degradation of squalene but it also degraded thereafter. USM contained tocotrienols that presumably also acted to protect squalene, but the lowest retention of tocotrienols in bread made squalene degradation in this product was high. Moderate loss of squalene was found in biscuit. Although biscuit was process under high temperature, but squalene was retained well.
4.2Blood serum lipid profile
Among USM fortified foods, group of rats fed by fortified bread (K6) showed the highest decline in total cholesterol, triglyceride, and LDL cholesterol (Fig. 2). The lowest reduction was found in instant noodle fed group (K5). Similar manner was also shown by unfortified foods. Reduction of total cholesterol, triglyceride, and LDL cholesterol possibly contributed to the nutritional composition and the amount of food intake. USM fortified foods had better profile lipid improvement than unfortified foods. It means that bioactive compounds in USM had a contribution in lowering total cholesterol.
Bread had the lowest calorie, fat, and carbohydrate than other foods. Liatis et al. [25] showed that bread without beta-glucan fortification slightly reduced LDL cholesterol. HDL cholesterol also increased after USM fortified and unfortified food feeding. Among treated group, the highest increase was found in USM fortified bread fed group (K6). Among fortified food products, the highest intake was found in group of rats fed by fortified bread, followed by fortified noodle (K5) and biscuit (K7) fed groups. Food products were as a carrier to deliver bioactive compounds from USM. High food consumed should be in accordance to high bioactive compounds intake. As previously discussed, bread showed the least stable of bioactive compounds (Table 2). Nevertheless, this low retained bioactive compounds in bread still showed the greatest impact on lipid profile improvement.
USM fortified biscuit had the highest phytosterols and squalene content than other food products. In fact, biscuit had the highest fat and carbohydrate but exhibited moderate reduction of total cholesterol, triglyceride and LDL cholesterol, also moderate enhancement of HDL cholesterol compared to instant noodle and bread. This improvement was supposed to relate to bioactive compounds. Conversely, bread had the lowest phytosterols and squalene but showed the highest reduction in total cholesterol, triglyceride, and LDL cholesterol. Intake of bread was the highest among USM fortified foods. Lower fat and carbohydrate content presumably had a significant role in total cholesterol reduction. Bread also had the lowest calorie that inadequacy of energy might imply to utilization of deposit fat and affected lipid profile of blood serum. Instant noodle had the highest tocotrienols and medium squalene, and phytosterols. The lowest effect of USM fortified instant noodle in decreasing total cholesterol might relate to moderate fat, carbohydrate, calorie and bioactive compounds. Apparently, bioactive compounds level and nutritional composition mainly fat and carbohydrate of USM fortified foods affected lipid profile improvement.
Phytosterols were the most abundant bioactive compound in USM fortified foods. Phytosterols have several roles in improving lipid profile by inhibiting cholesterol absorption through competing with cholesterol for micelle formation [8] and co-crystallization that reduces cholesterol uptake [26]. Phytosterols are also able to inhibit acyl-coenzyme A cholesterol acyl transferase (ACAT) activity [27]. Since plant sterols inhibit part of cholesterol absorption, they might also interfere with the absorption of other fat-soluble compounds [28], and presumably also interfere the absorption of tocotrienols and squalene from USM. Therefore, we supposed that phytosterols had a main role in improving lipid profile of USM fortified foods.
Squalene presumably also contributed to lipid profile improvement in hypercholesterolemia groups. The level of squalene in USM fortified foods was lower than phytosterols but higher than tocotrienols. Previously Kim et al. [29] reported hypocholesterolemic effect of amaranth squalene in rats fed a high cholesterol diet.
The role of unsaponifiable matters from rice bran in reducing cholesterol also had been reported by Kahlon and Smith [13]. Bioactive compounds of rice bran USM were mainly tocotrienols. Tocotrienols were also supposed to inhibit HMG-CoA reductase activity [12]. However, USM fortified foods only had low level of tocotrienols. Despite of this fact, tocotrienols might also contributed to lipid profile improvement, but it was suggested that phytosterols were the most responsible for the change.
4.3Hepatic cholesterol and bile acid
Fortification of USM into food products resulted in significantly lower hepatic cholesterol than unfortified foods. The lowest hepatic cholesterol was found in USM fortified bread fed group (K6), that significantly differed to USM fortified biscuit (K7) and instant noodle (K5) fed groups. Meanwhile, hepatic cholesterol of USM fortified instant noodle fed group (K5) was not significantly different to group of rats fed by biscuit (K4) and bread without fortification (K3).
Hepatic cholesterol reflected synthesis of cholesterol in liver. It was supposed that the main bioactive compounds responsible to hepatic cholesterol level were tocotrienols and squalene. Qureshi et al. [30] reported amaranth seeds and oil which were rich with tocotrienols and squalene decreased activity of HMG-CoA reductase as rate-limiting enzyme in cholesterol biosynthesis. Increasing tocotrienols and squalene in liver due to USM fortified food feeding as tocotrienols and squalene carrier was highly supposed to have a role in inhibiting cholesterol synthesis. It could be concluded that fortification of food products by USM from PFAD gave synergistic effect in improving serum lipid profile and hepatic cholesterol synthesis.
Bile acids are a group of water-soluble steroids formed during the catabolism of cholesterol and synthesized in the hepatocytes of the liver [31]. USM fortified product feeding resulted in significantly higher hepatic bile acids than their corresponding products, but lower hepatic cholesterol level. Although cholesterol synthesis was inhibited and decreased cholesterol level in liver, some cholesterol concomitantly converted into bile acids. Possibly, in digestive tract the presence of phytosterols from USM fortification induced more bile acids needed, that caused more bile acids produced. It also made hepatic cholesterol to decrease.
The order of hepatic cholesterol level of USM fortified foods was bread < biscuit < instant noodle. This order was in accordance to the order of total cholesterol, triglyceride, and LDL cholesterol in serum blood. There was a high correlation between blood and hepatic cholesterol level. USM fortification gave positive modulation and implied to a better lipid profile of hypercholesterolemia rats.
4.4Fecal cholesterol and bile acid
Inhibition of cholesterol by phytosterols from USM fortification of foods was supposed to increase fecal cholesterol. The highest fecal cholesterol was found in control-standard diet group (K1) that it did not differ significantly to USM fortified bread group (K6) (Fig. 4a). The order of fecal cholesterol concentration of group of rats fed by USM fortified foods was bread > biscuit > instant noodle. Fecal cholesterol reflected absorption inhibition of cholesterol mainly by the presence of phytosterols from USM fortification. Racette et al. [32] reported that phytosterol effectively increased total fecal cholesterol excretion, biliary cholesterol excretion, and reduced intestinal cholesterol absorption.
USM fortified foods exhibited higher fecal cholesterol than that of corresponding foods. Interestingly, USM fortified instant noodle did not show significant difference of fecal cholesterol to biscuit without fortification, even lower than bread without fortification. Instant noodle also exibited the highest blood serum total cholesterol among USM fortified foods. Instant noodle feeding was the lowest among USM fortified foods, that phytosterols intake was also lower than other foods.
Group of rat fed by USM fortified biscuit (K4) exhibited higher fecal cholesterol than USM fortified instant noodle (K5), although the intake of both products was not significantly different (Fig. 1). USM fortified biscuit had higher bioactive compounds than USM fortified instant noodle. It was obvious that bioactive compounds of USM from PFAD had a great role in increasing fecal cholesterol thereby improved lipid profile.
Bile acids are important physiological agents for intestinal nutrient absorption and biliary secretion of lipids. Conversion of cholesterol to bile acids is critical for maintaining cholesterol in the liver [33]. About 5% of bile acids go to the colon for excretion in the feces [31]. Figure 4b showed that control-standard diet (K1) and atherogenic diet (K8) fed groups had the lowest fecal bile acid. Low bile acid in liver also implied on low bile acid excretion into feces. Chiang [33] explained that the net daily turnover of bile acids is about 5% of a total bile acid pool, and bile acids have enterohepatic circulation. Bile acids synthesized in the liver are immediately secreted into bile, reabsorbed in the intestine, and transported back to the liver. Therefore, only low bile acid was secreted into feces in normal condition. Low fecal bile acid concentration in atherogenic diet fed group (K8) was related to the lowest hepatic bile acid.
USM fortified foods had higher fecal bile acids than corresponding foods without USM fortification. Hepatic bile acid of groups of rats fed by foods without USM fortification was also lower. Hence, limited bile acid was excreted into intestine thus produced lower fecal bile acid. Among USM fortified foods, group of rats fed by fortified bread (K6) showed the highest fecal bile acid concentration. The lowest fecal bile acid was found in group of rats fed by USM fortified biscuit (K7). The difference of fecal bile acid among USM fortified foods was possibly related to hepatic bile acid concentration.
Bioactive of USM in fortified foods had a role in suppressing cholesterol synthesis in liver as precursor for bile acids. Tocotrienols and squalene were able to inhibit HMG CoA reductase thereby less cholesterol produced [30]. It was supposed that the highest intake of bioactive compounds from USM fortified foods was from bread. USM fortified bread (K6) possibly had the highest intake athough this product had the lowest bioactive compounds. Low fat of bread also supported the performance of USM fortified bread in modulation cholesterol metabolism. High fecal bile acid concentration was an indicator of cholesterol elimination from body through bile acid excretion. It also resulted in reduction of total cholesterol in blood circulation. Interestingly, USM fortified instant noodle (K5) although exhibited higher fecal bile acid than USM fortified biscuit (K7), but USM fortified biscuit showed better improvement of lipid profile. Higher bioactive compounds and intake of USM fortified biscuit, made this product was better than instant noodle.
5Conclusions
Fortification of USM into food products resulted in lower hepatic cholesterol than unfortified foods. The order of hepatic cholesterol level of USM fortified foods was bread < biscuit < instant noodle. This order was in accordance to the order of total cholesterol, triglyceride, and LDL cholesterol in serum blood. USM fortified foods exhibited higher fecal cholesterol than that of corresponding foods. The order of fecal cholesterol concentration of group of rats fed by USM fortified foods was bread > biscuit > instant noodle. Bioactive compounds level and nutritional composition mainly fat and carbohydrate of USM fortified foods affected lipid profile improvement. USM apparently is a useful fortificant for developing bioactive containing foods. The most suitable foods as bioactive carrier for USM is low fat and carbohydrate products.
Acknowledgments
The authors would like to thank and appreciate Directorate Research and Community Service, Directorate General of Strengthening Research and Development, Ministry of Research, Technology, and Higher Education, Republic of Indonesia, for funding this research through Penelitian Strategis Nasional Contract No. 007/SP2H/LT/DRPM/II/2016, February 17, 2016.
References
[1] | Mba OI , Dumontn MJ , Ngadi M . Palm oil: Processing, characterization and utilization in the foodindustry – A review. Food Biosci. (2015) ;10: :26–41. |
[2] | Estiasih T , Ahmadi K , Tri DW , Emalia R , Ambar F , Katarina P , Yuyun W . The effect of unsaponifiable fraction from palm fatty acid distillate on lipid profile of hypercholesterolaemia rats. J Food Nutr Res. (2014) ;2: :1029–36. |
[3] | Estiasih T , Ahmadi K , Widyaningsih TD , Maligan JM . Multi components of bioactive compounds for food supplement and fortificant as an effort to increase economical value of by-product of palm oil refinery. Year 1 MP3EI Report. Research Centre, Brawijaya University, Malang; (2012) . |
[4] | Gunes FE . Medical use of squalene as natural antioxidants. MUSBED. (2012) ;3: (4):220–8. |
[5] | Bhilwade HN , Naoto T , Nishida H , Konishi T . Squalene as novel food factor. Curr Pharm Biotechnol. (2010) ;11: :1–6. |
[6] | Shin DH , Heo HJ , Lee YJ , Kim HK . Amaranth squalene reduces serum and liver lipid levels in rats fed a cholesterol diet. Brit J Biomed Sci. (2004) ;61: (1):11–4. |
[7] | Fernandes P , Cabral JM . Phytosterols: Applications and recovery methods. Bioresour Tech. (2007) ;98: :2335–50. |
[8] | Calpe-Berdiel L , Escolà-Gil JC , Blanco-Vac F . New insights into the molecular actions of plant sterols and stanols in cholesterol metabolism. Atherosclerosis. (2009) ;203: :18–31. |
[9] | Lin X , Racette SB , Lefevre M , Spearie CA , Most M , Ma L , Ostlund RE Jr . The effects of phytosterols present in natural food matrices on cholesterol metabolism and LDL-cholesterol: A controlled feeding trial. Eur J Clin Nutr. (2010) ;64: :1481–7. |
[10] | Vasanthi HR , Parameswari RP , Da DK . Multifaceted role of tocotrienols in cardioprotection supports their structure: Function relation. Genes Nutr. (2012) ;7: :19–28. |
[11] | Wilson TA , Nicolosi RJ , Kotyla T , Sundram K , Kritchevsky D . Different palm oil preparations reduce plasma cholesterol concentrations and aortic cholesterol accumulation compared to coconut oil in hypercholesterolemic hamsters. J Nutr Biochem. (2005) ;16: (10):633–40. |
[12] | Chao JT , Gapor A , Theriault A . Inhibitory effect of δ-tocotrienol, a HMG CoA reductase inhibitor, on onocyte-endothelial cell adhesion. J Nutr Sci Vitaminol. (2002) ;48: :332–7. |
[13] | Kahlon TS , Smith GE . Rice bran: A health promoting ingredients. Cereal Food Word. (2004) ;49: (4):188–94. |
[14] | Reeves PG . Components of the AIN-93 diets as improvements in the AIN-76A diet. J Nutr. (1993) ;127: :838S–841S. |
[15] | Siedel J , Hagele EO , Ziegenhorn J , Wahiefeld AW . Reagent for the enzymatic determination of serum total cholesterol with improved lipolytic efficiency. Clin Chem. (1983) ;29: :1075–80. |
[16] | Sullivan DR , Kruijswijk Z , West CE , Kohlmeler M , Katan MB . Determination of serum triglycerides by an accurate enzymatic method not affected by free glycerol. Clin Chem. (1985) ;31: (7):1227–8. |
[17] | Huang TC , Chen CP , Wefler V , Raftery A . A stable reagent for the Liebermann-Burchard reaction. Anal Chem. (1961) ;33: (10):1405–7. |
[18] | Boueu S , Fortgang I , Levy-Jr RJ , Bhatnagar D , Burow M , Fahey G , Heiman ML . A novel gastrointestinal microbiome modulator from soy pods reduces absorption of dietary fat in mice. Obesity. (2016) ;24: :87–95. |
[19] | Parker RA , Garcia R , Ryan CS , Liu X , Shipkova P , Livanov V , Patel P , Ho SP . Bile acid and sterol metabolism with combined HMG-CoA and PCSK9 suppression. J Lipid Res. (2013) ;54: :2400–9. |
[20] | Bligh EG , Dyer WJ . A rapid method of lipid extraction and purification. Can J Biochem Physiol. (1959) ;37: (8):911–7. |
[21] | Gonzalez-Larena M , García-Llatas G , Vidal MC , Sanchez-Siles LM , Barber R , Lagarda MJ . Stability of plant sterols in ingredients used in functional foods. J Agric Food Chem. (2011) ;59: :3624–31. |
[22] | Kmiecik D , Korczak J , Rudzin M , Gramza-Michalłowska A , Hes M , Kobus-Cisowska J . Stabilisation of phytosterols by natural and synthetic antioxidants in high temperature conditions. Food Chem. (2015) ;173: :966–71. |
[23] | Park SR , Kim YH , Park HJ , Lee YS . Stability of tocopherols and tocotrienols extracted from unsaponifiable fraction of rice bran under various temperature and oxygen condition. 4th International Crops Science Congress, Australia; (2004) . |
[24] | Rastrelli L , Passi S , Ippolito F , Vacca G , de Simone F . Rate of degradation of α-tocopherol, squalene, phenolics, and polyunsaturated fatty acids in olive oil during different storage conditions. J Agric Food Chem. (2002) ;50: :5566–70. |
[25] | Liatis S , Tsapogas P , Chala E , Dimosthenopoulos C , Kyriakopoulos K , Kapantais E , Katsilambros N . The consumption of bread fortified with beta glucan reduces LDL-cholesterol and improves insulin resistance in patients with type 2 diabetes. Diabetes Metab. (2009) ;35: :115–20. |
[26] | Garti N , Avrahami M , Aserin A . Improved solubilization of celecoxib in U-type nonionic microemulsions and their structural transitions with progressive aqueous dilution. J Colloid Interf Sci. (2006) ;229: :352–65. |
[27] | Brufau G , Canela MA , Rafecas M . Phytosterols: Physiologic and metabolic aspects related to cholesterol-lowering properties. Nutr Res. (2008) ;28: (4):217–25. |
[28] | Plana N , Nicolle C , Ferre R , Camps J , Villoria RCJ , Masana L . Plant sterol-fortified fermented milk enhances the attainment of LDL-cholesterol goal in hypercholesterolemic subjects. Eur J Nutr. (2008) ;47: :32–9. |
[29] | Kim HK , Chang YJ , Heo HJ , Cho HY , Hng B , Shin DH . Hypocholesterolemic effect of amaranth squalene (Amaranth esculanthus) in rats fed a high cholesterol diet. Nutraceutical and Food. (2003) ;8: :13–8. |
[30] | Qureshi AA , Lehmann JW , Peterson DM . Amaranth and its oil inhibit cholesterol biosynthesis in 6-week-old female chicken. J Nutr. (1996) ;126: :1972–8. |
[31] | Stamp D , Jenkins G . An overview of bile-acid synthesis, chemistry and function issues in toxicology. In: Jenkins G , Hardie LJ , editors. Bile Acids: Toxicology and Bioactivity, Cambridge: Royal Society of Chemistry; (2008) . |
[32] | Racette SB , Lin X , Lefevre M , Spearie CA , Most MM , Ma L , Ostlund RE Jr. . Dose effects of dietary phytosterols on cholesterol metabolism: A controlled feeding study. Am J Clin Nutr. (2009) ;91: (1):32–38. |
[33] | Chiang JYL . Bile acid metabolism and signaling. Compr Physiol. (2013) ;3: :1191–212. |


